 Ayat Al Assi1,2,3*
 Rubayet Bin Mostafiz2,3,4
 Carol J. Friedland2,3
 Robert V. Rohli3,4
 Md Adilur Rahim2,3,5
- 1Bert S. Turner Department of Construction Management, Louisiana State University, Baton Rouge, LA, United States
- 2LaHouse Resource Center, Department of Biological and Agricultural Engineering, Louisiana State University Agricultural Center, Baton Rouge, LA, United States
- 3Coastal Studies Institute, Louisiana State University, Baton Rouge, LA, United States
- 4Department of Oceanography & Coastal Sciences, College of the Coast & Environment, Louisiana State University, Baton Rouge, LA, United States
- 5Engineering Science Program, Louisiana State University, Baton Rouge, LA, United States
Floods inflict significant damage even outside the 100-year floodplain. Thus, restricting flood risk analysis to the 100-year floodplain (Special Flood Hazard Area (SFHA) in the United States of America) is misleading. Flood risk outside the SFHA is often underestimated because of minimal flood-related insurance requirements and regulations and sparse flood depth data. This study proposes a systematic approach to predict flood risk for a single-family home using average annual loss (AAL) in the shaded X Zone–the area immediately outside the SFHA (i.e., the 500-year floodplain), which lies between the limits of the 1.0- and 0.2-percent annual flood probability. To further inform flood mitigation strategy, annual flood risk reduction with additional elevation above an initial first-floor height (
1 Introduction
Flood is considered the costliest natural hazard worldwide (Wang & Sebastian, 2021). Between 1980 and 2021, the United States of America was affected by 36 catastrophic floods that caused a total $173.3 billion (consumer price index adjusted) in direct losses (NOAA, 2022). FEMA’s floodplain maps are used to determine flood risk zones and their base flood elevations (BFEs), which have been used to define flood risk regions around the United States of America (Xian et al., 2015). FEMA’s 100-year floodplain–the area that has at least a one-percent chance of experiencing flood in a given year–has been used to define high-risk flood zones, known as the Special Flood Hazard Area (SFHA). Many efforts have been made to quantify flood risk (Habete & Ferreira, 2017; Armal et al., 2020; Mostafiz et al., 2021a), determine minimum first-floor elevation requirements (American Society of Civil Engineers (ASCE), 2014; FEMA, 2019) and identify the benefit of applying mitigation strategies in the SFHA (Rath et al., 2018), including regulations on development such as the mandatory purchase of flood insurance for those with a federally-backed mortgage (Wing et al., 2022).
Areas outside the SFHA, generally known in the United States of America as X Zones, have received significantly less attention because they have been considered as moderate-to-low flood risk areas, with less than a one-percent annual chance of flood occurrence (Technical Mapping Advisory Council, 2015). However, average annual flood losses outside the SFHA have mounted to $19.1 billion and are projected to increase by 21.2 percent in the United States of America by 2050 because of climate change (Wing et al., 2022). Thus, significantly more attention must be devoted to understanding flood risk in these areas in order to reduce flood losses.
The area between the limits of the one-percent (bordering the SFHA) and 0.2-percent (bordering the “non-shaded X Zone”) annual flood probability inundation areas—the 500-year floodplain, known in the United States of America as the “shaded X Zone”—is particularly preferred for dense development and is considered an area of likely population growth (Association of State Floodplain Managers, 2020). Clearly, it is important to assess the flood risk outside the SFHA, particularly in the shaded X Zone. Notable examples of research on flood hazards in the shaded X Zone include that of Hagen and Bacopoulos (2012), who identified tropical storm characteristics that induce flooding in Florida’s Big Bend Region. Likewise, Ferguson and Ashley (2017) evaluated residential development in Atlanta, Georgia. Kiaghadi et al. (2020) investigated the relation between hurricane events and the housing price depreciation in Miami-Dade County. Goldberg and Watkins (2021) analyzed flood risk among three watersheds in the lower St. Johns River basin landscape, and Hemmati et al. (2021) examined how flood risk assessment affects residents’ location choices. However, there is a dearth of research focusing on flood risk evaluation for residential buildings in the shaded X Zone. Without a better understanding of flood risk for areas in the shaded X Zone, the true costs and benefits of flood mitigation strategies cannot be realized (Mostafiz et al., 2022c).
Flood risk is assessed as the product of flood occurrence probability and the associated consequences (Šugareková & Zeleňáková, 2021). Average annual loss (AAL) has been used in past research to represent flood risk (Hallegatte et al., 2013; Armal et al., 2020; Rahim et al., 2021; 2022; Mostafiz et al., 2022a; Bowers et al., 2022; Wing et al., 2022; Yildirim & Demir, 2022; Al Assi et al., 2023b; Friedland et al., 2023) in terms of costs associated with direct building loss, direct contents loss, and indirect losses such as use loss while the building is being renovated (Al Assi et al., 2023a). AAL is calculated as the integral of flood loss as a known function of the flood probability (or flood return period), and the Gumbel distribution function is one of the most widely accepted probability functions (Singh et al., 2018; Patel, 2020). The Gumbel parameters are the regression coefficients (slope and y-intercept, respectively) in the relationship between flood depth above the ground (
Calculating flood risk in the shaded X Zone can be challenging due to data limitations. As the shaded X Zone lies between the limits of the one-percent and 0.2-percent annual chance of flood, land in this zone is by definition unflooded until the 100-year flood event is exceeded. Therefore, in the shaded X Zone,
To overcome these challenges, this paper presents a systematic approach to 1) provide a meaningful estimate of the range of expected annual flood risk in the shaded X Zone; and 2) calculate the reduction in annual flood risk via elevation for homes in the shaded X Zone. The lack of flood hazard data in the shaded X Zone is addressed by developing a library of combinations of synthetic, regression-derived Gumbel parameters that meet the mathematical definition of the shaded X Zone. These are used here by hypothetical type of single-family homes in the United States of America (i.e., one vs two-plus stories, with vs without basement) as input to the framework methodology presented in Al Assi et al. (2023a). The results of two case studies are compared with the results generated from the Gumbel regression parameters produced using Mostafiz et al.’s (2021b, 2022b) method, which extrapolated the Gumbel parameters in the shaded X Zone using spatial interpolation, to confirm the results of this method for a range of 500-year flood depths in inland and coastal areas.
The contribution of this research is a novel conceptualization and implementation of annual flood risk assessment in the shaded X Zone–a location where little flood risk information has been generated. This improved risk assessment provides a clearer perception of the advantages of applying mitigation strategies in those areas. The methodology and results generated in this paper will benefit homeowners, builders, developers, community planners, and other partners in the process of enhancing resilience to the flood hazard via risk-informed construction techniques.
2 Background
Recent catastrophic events and studies regarding projected trends under environmental change scenarios reveal that the area outside the presently designated SFHA is subjected to rapidly increasing flood risk. For example, in 2005 Hurricane Katrina inflicted severe damage outside the SFHA across Louisiana, Mississippi, and Alabama, including massive structural damage (Xian et al., 2015). Likewise, only 7 years later Hurricane Sandy caused flooding far above the BFE and beyond the SFHA in New York and New Jersey (FEMA, 2013). Only 5 years later, amazingly, 68 percent of the 31,000 homes that Hurricane Harvey flooded in the Houston, Texas, area were outside the SFHA (Kousky et al., 2020b). In the next year, 24 percent of the area flooded and 43 percent of the residential structures damaged in North Carolina by Hurricane Florence were outside the SFHA (Pricope et al., 2022). And in 2019, 62 percent of the 1,000+ Texas homes flooded in Tropical Storm Imelda were outside the SFHA (Kousky et al., 2020b). Kennedy et al. (2020) reported that Hurricane Michael in Florida caused major wave and surge damage in X Zones. In a more general sense, a trained model to predict flood damage probability in the conterminous United States of America using a suite of geospatial predictors and the location of historical reported flood damage revealed that an astounding 68 percent of flood damage was outside of FEMA’s high-risk zone (Collins et al., 2022). Significant attention has been devoted to reducing flood damage exacerbated by climate change and sea level rise (Botzen & van den Bergh, 2008; Hino & Hall, 2017; Kousky et al., 2020a; Xian et al., 2017). Therefore, a need exists to evaluate flood risk in the shaded X Zone more comprehensively through improved assessment of economic consequences to better identify and mitigate the risk.
Recent studies show that using the refined numerical integration method shows promising results to predict AAL because it accounts for losses across the full range of exceedance probabilities, and it addresses the limitations of other approaches (Gnan et al., 2022a). This refined numerical integration method models the annual probability of exceedance for the expected flood depth using available flood depth data. The Gumbel distribution is used to determine the annual probability of exceedance at each given depth. AAL is then estimated using trapezoidal Riemann sums to aggregate the area under the loss-exceedance probability curve (Meyer et al., 2009; Gnan et al., 2022a).
Specifically, the refined numerical integration method has been used to estimate annual flood risk for multiple home elevation scenarios above the initial first-floor height to determine flood risk reduction (Gnan et al., 2022a). Optimizing the effectiveness of the elevation strategy using such scenarios is important for maximizing the benefit of federal government grants, such as from FEMA or the U.S. Department of Housing and Urban Development (HUD), for elevating such homes, to as many people as possible. These elevation scenarios conform to or surpass the National Flood Insurance Program (NFIP) requirement that the minimum lowest-floor elevation is at the BFE, which is approximately equal to the 100-year flood elevation (
Elevating above
3 Methodology
The computational framework to quantify AAL in the shaded X Zone consists of three major steps (Figure 1). First, synthetic flood parameters are generated based on shaded X Zone properties. Second, AAL is quantified using the computational framework developed by Al Assi et al. (2023a). In that approach, AAL is partitioned to homes (I = 1 through n) separately for building, contents, and use, with the AAL reduction calculated for M increases of increment J in first-floor height above the
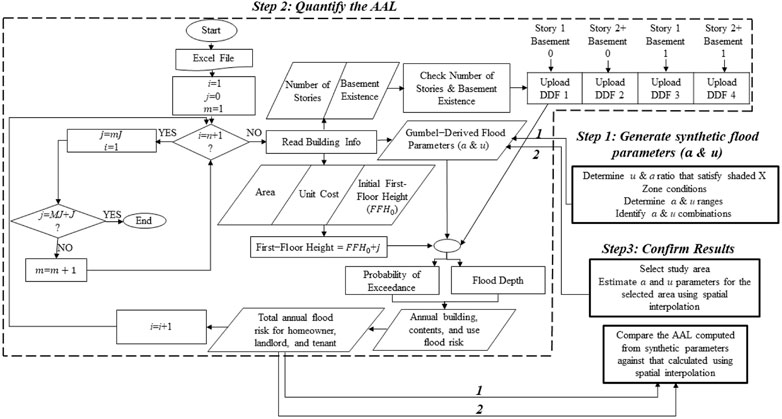
FIGURE 1. Computational framework to quantify and confirm AAL in the shaded X Zone.
3.1 Generate synthetic flood parameters
This research uses the two-parameter Gumbel distribution function to estimate flood depth. Equation (1) shows the cumulative distribution function (CDF) of the Gumbel distribution, which represents the annual non-exceedance probability (
Solving Eq. (1) for
In Eqs (1), (2),
To overcome the absence of
Generating the synthetic, unique
Likewise, if it is assumed that a point within the shaded X Zone does flood within the 500 (i.e.,
Solving Eqs (4)–(5) yields the ratio between
Thus, the range of the ratio of
Because
Each combination of
Each combination of
3.2 Quantify annual flood risk and flood risk reduction
3.2.1 Refined numerical integration method
AAL represents the sum of the expected annual flood risk to a building (
The method of Gnan et al. (2022a, 2022b, 2022c) is used to calculate
where
By contrast,
where
Then, the three components of AAL are converted to absolute currency values (in USD) for building (
where
These values are then summed to give the total AAL as a proportion of
To quantify the economic benefit of elevating above
3.2.2 Data processing
The MATLAB algorithm developed by Al Assi et al. (2023a) is utilized here to analyze all simultaneously valid
3.3 Confirm results
Spatial interpolation is used to characterize the flood hazard (
4 Case study
Jefferson Parish, Louisiana, and Santa Clarita, California, are selected as these areas have multiple return period (10–, 50–, 100–, and 500–years) flood depth data, which are needed to estimate flood parameters using spatial interpolation (Figure 2). Flood depth grids were developed at a scale of 3.048 m x 3.048 m, by FEMA through its Risk Mapping, Assessment and Planning (Risk MAP) program (FEMA, 2021). To demonstrate all possible scenarios for synthetic and estimated flood parameters to quantify annual flood risk and flood risk reduction in the shaded X Zone, a hypothetical slab-on-grade, single-family home with 2000 sq. ft. of living area is used, with the four scenarios of home type (i.e., one or two-or-more stories, with and without basement) calculated separately. Each combination in the collection of synthetic and estimated Gumbel parameters is input to evaluate the range of annual flood risk for each home type.
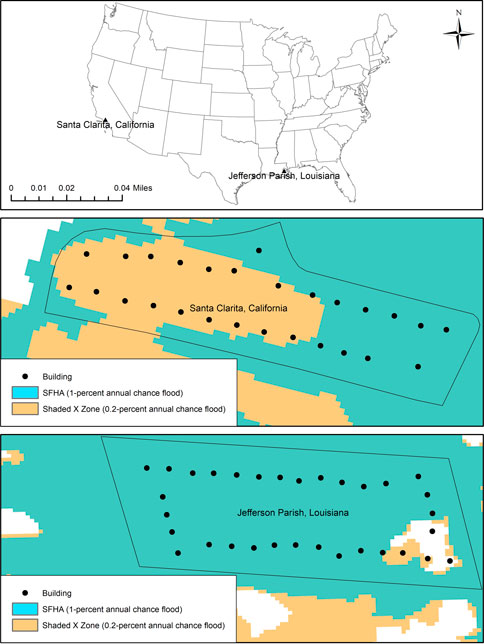
FIGURE 2. Case study areas in Santa Clarita, California, and Jefferson Parish, Louisiana, highlighting the homes situated in the Special Flood Hazard Area (SFHA) and shaded X Zone.
5 Results
5.1 Generate synthetic flood parameters
The ratio of flood parameters (Eq. (6)) along with the updated stillwater elevation for coastal data are used to determine the flood parameters’ range and combinations that satisfy shaded X Zone properties. The analysis updating the results of Bohn (2013) suggests that the maximum
A total of 1740 combinations of
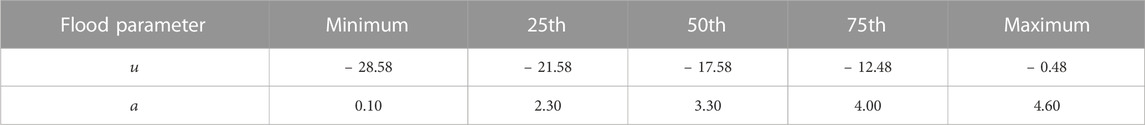
TABLE 1. Descriptive statistics for synthetic flood parameters in the shaded X Zone.
The flood depth-return period relationships generated at the 2-, 10-, 50-, 100-, 500-, 1,000-, 5,000- and 10,000-year return periods for these 1740 scenarios are shown in Figure 3. The
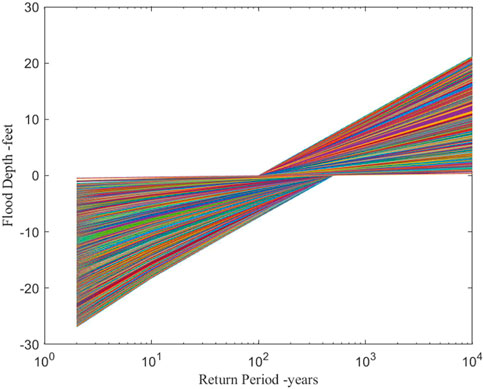
FIGURE 3. Flood depth-return period relationship for synthetic data.
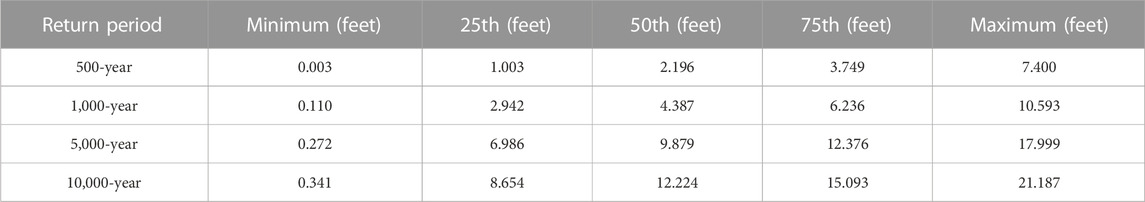
TABLE 2. Descriptive statistics of flood depth at long return periods using synthetic data in the shaded X Zone.
5.2 Quantify annual flood risk and flood risk reduction
For the 1740 scenarios of valid
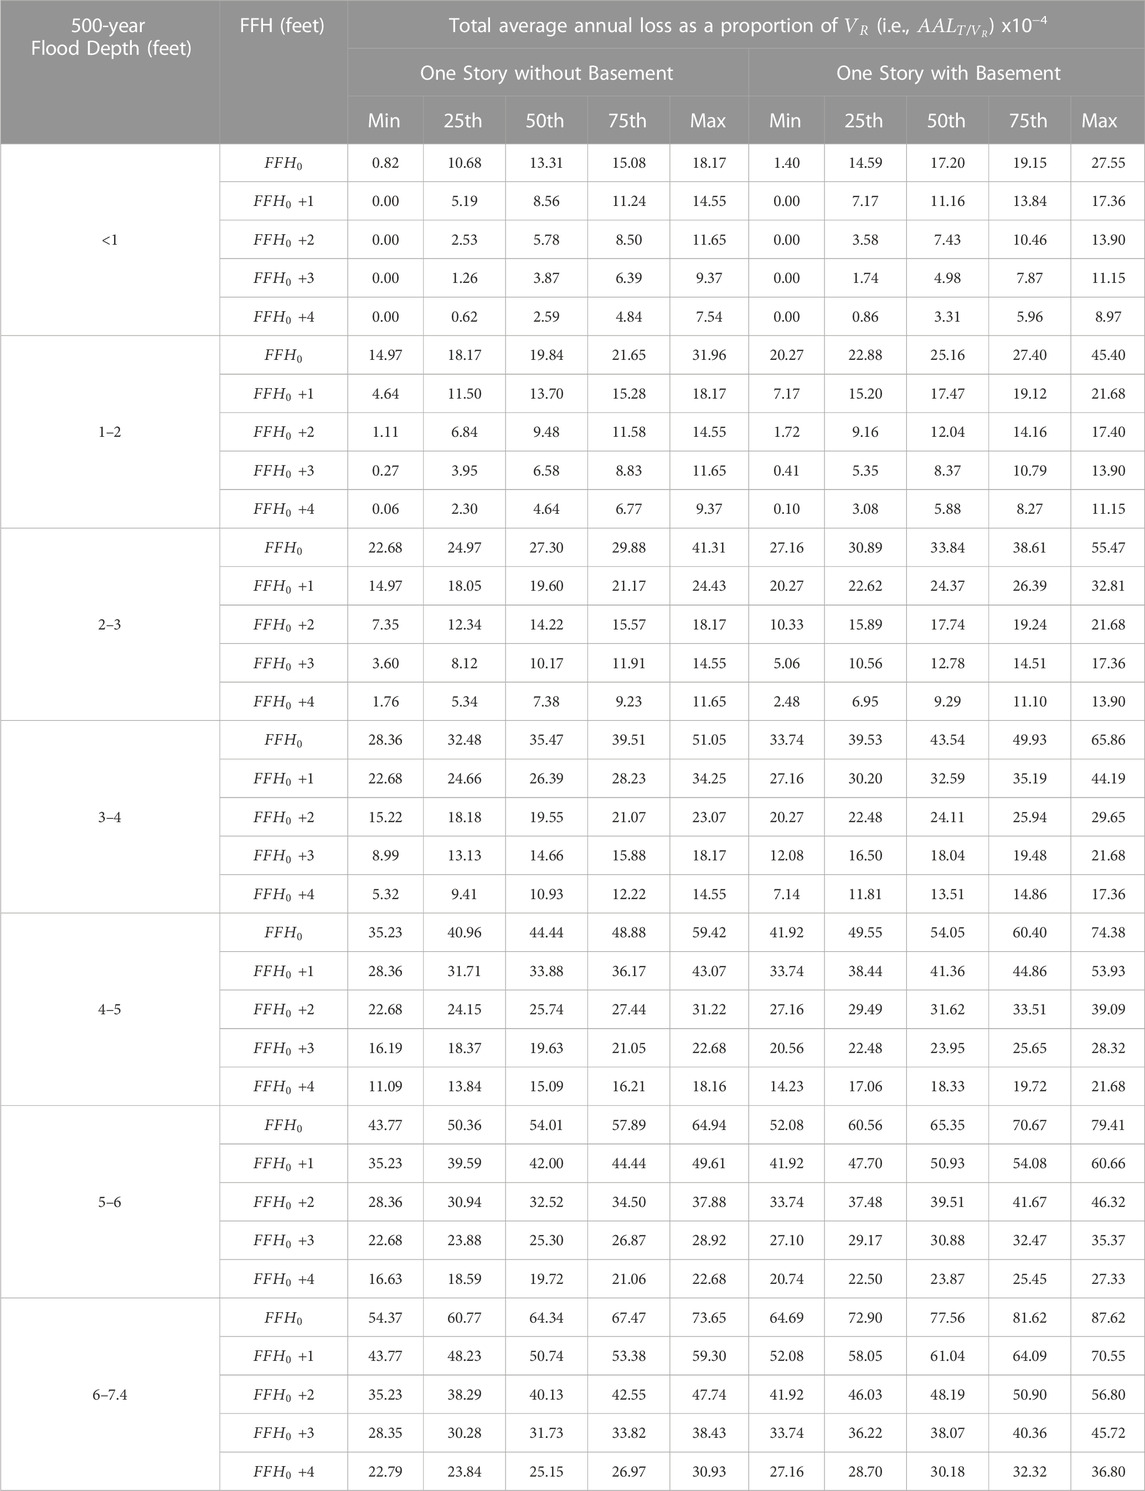
TABLE 3. Descriptive statistics of annual flood risk as a proportion of
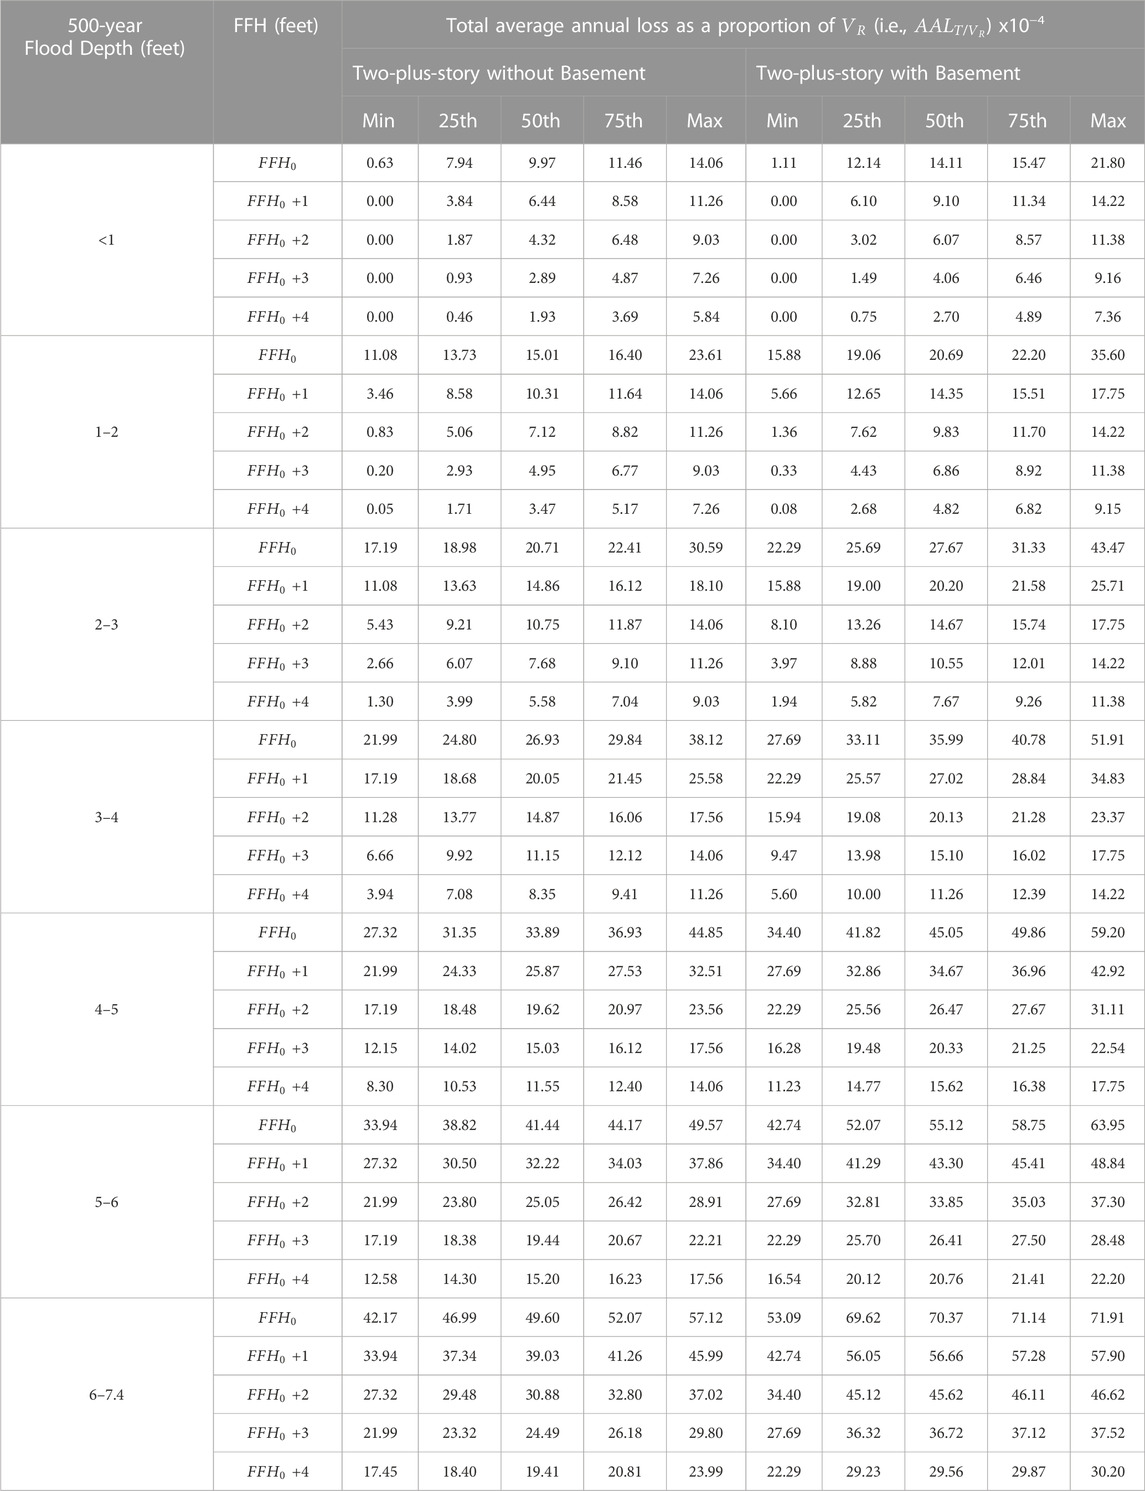
TABLE 4. As in Table 3, except for two-plus-story home.
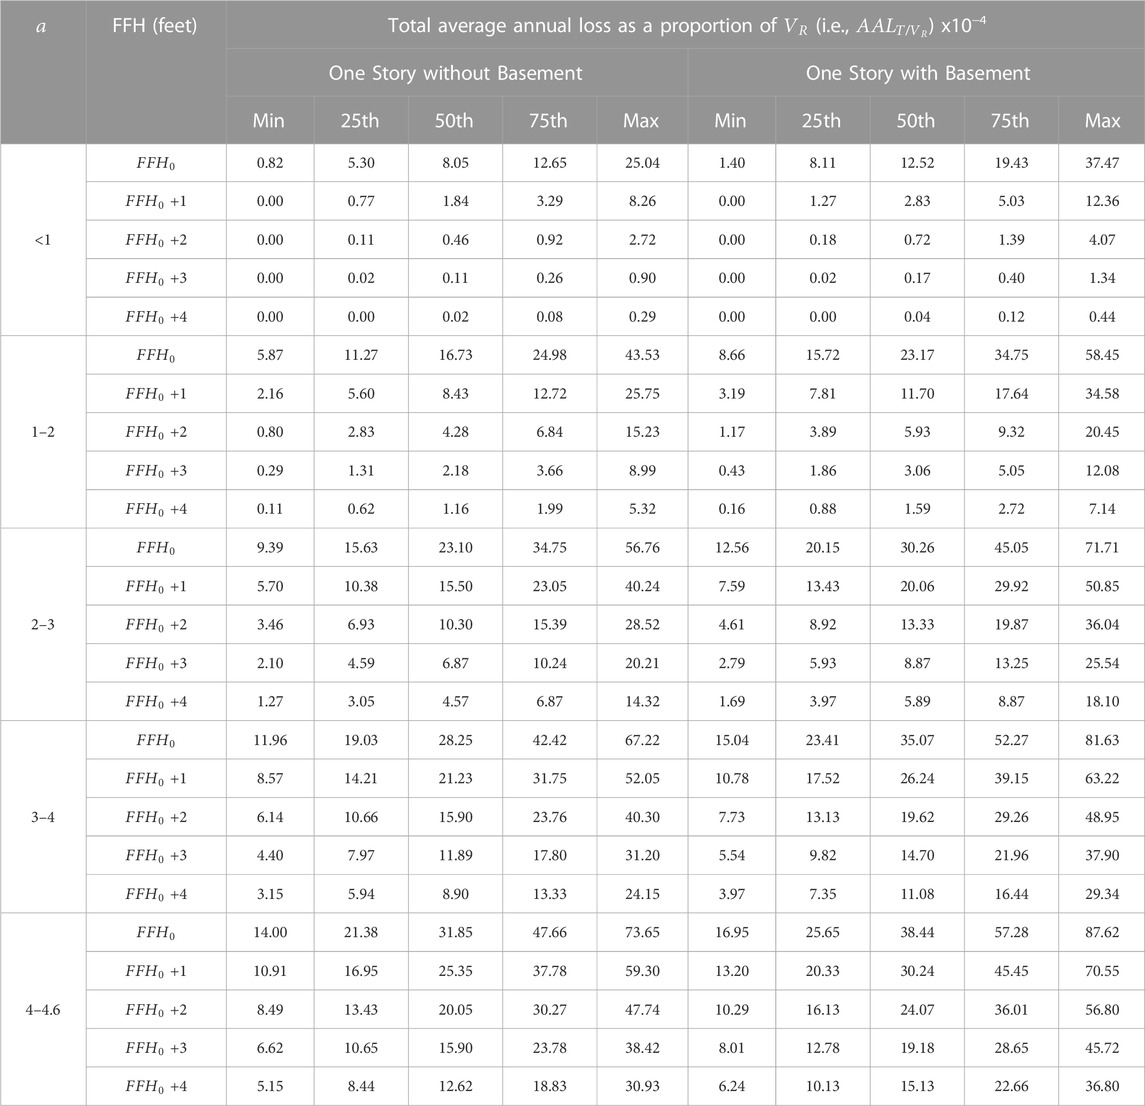
TABLE 5. As in Table 3 but categorized based on the
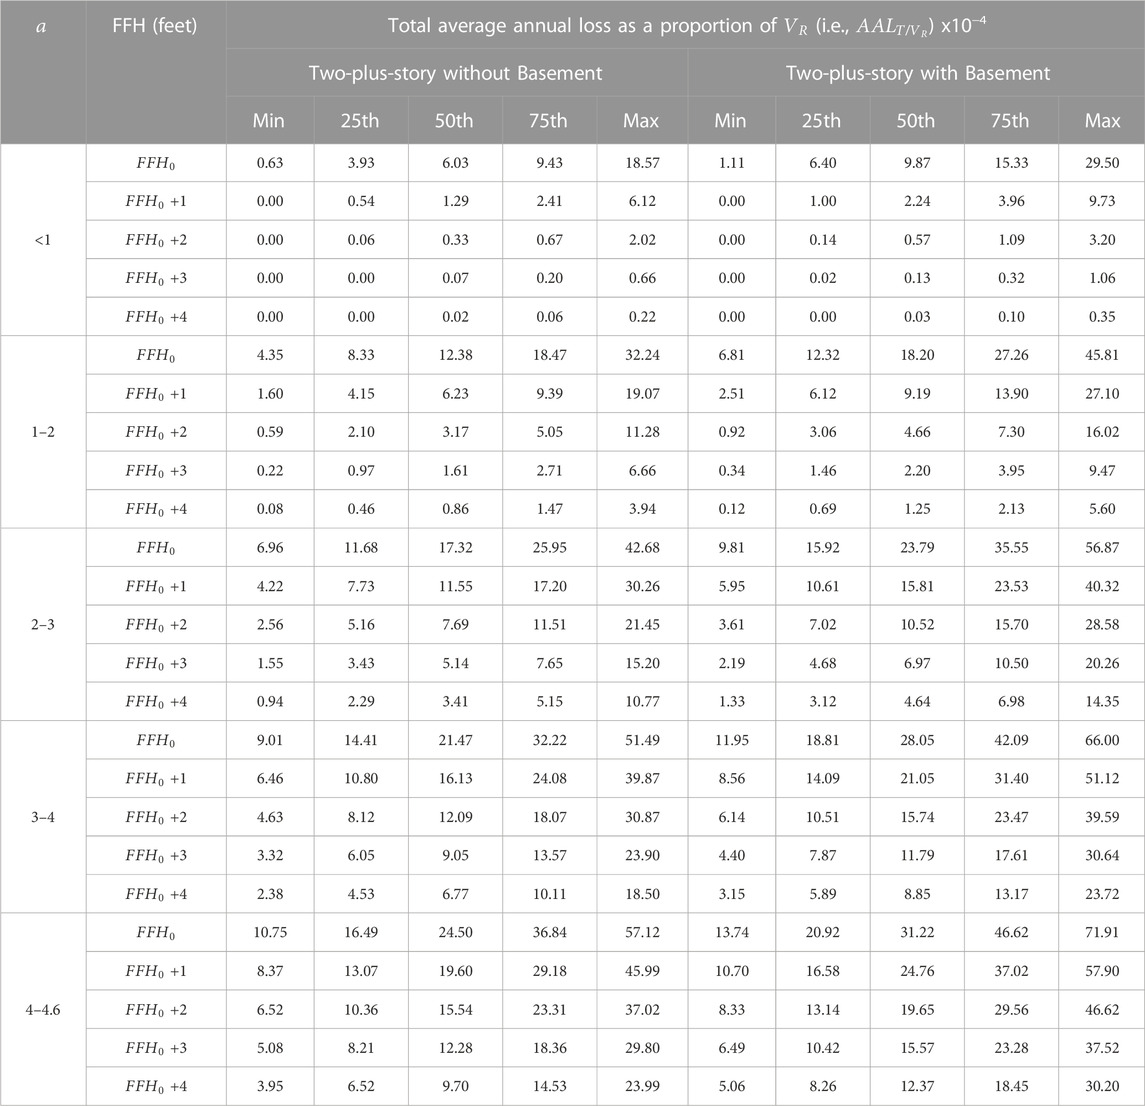
TABLE 6. As in Table 4 but categorized based on
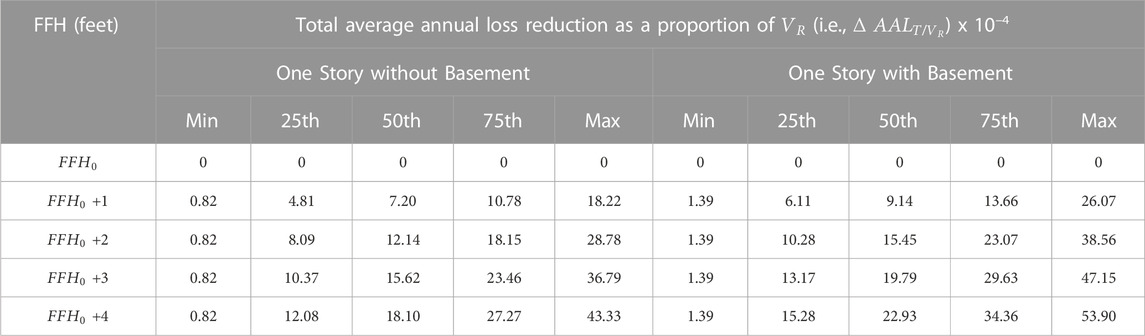
TABLE 7. Annual flood risk reduction by FFH elevation for one-story single-family home with and without basement using synthetic data.
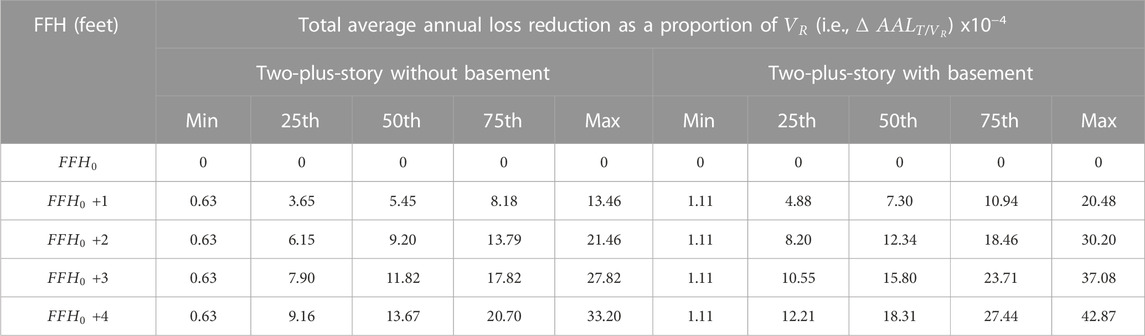
TABLE 8. Annual flood risk reduction by FFH elevation for two-plus-story single-family home with and without basement using synthetic data.
5.3 Confirm results
Table 9 demonstrates
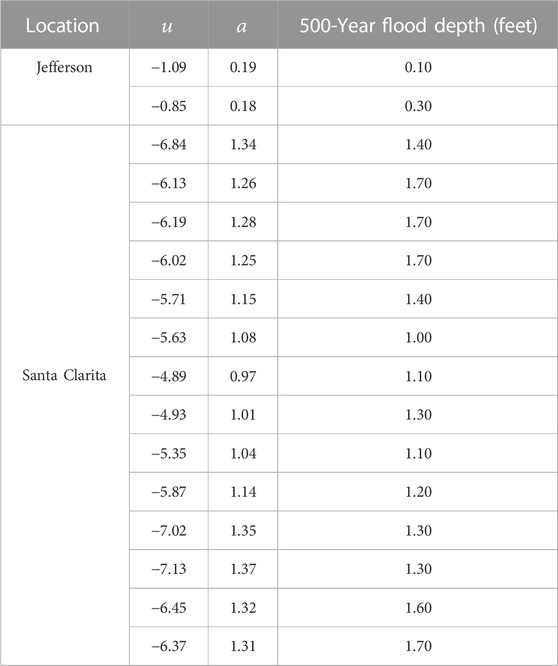
TABLE 9. Flood parameters and 500-year flood depth for the shaded X Zone located in Jefferson Parish, Louisiana, and Santa Clarita, California, using spatial interpolation.
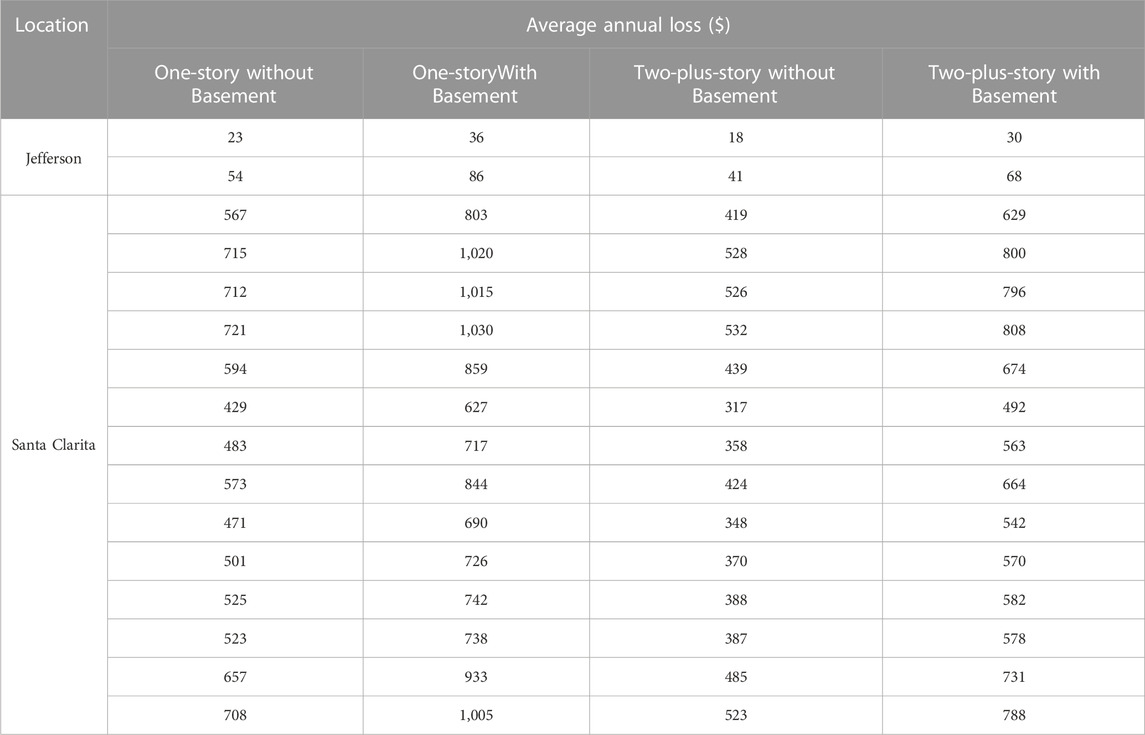
TABLE 10. Average annual loss (i.e., annual flood risk) by type of single-family home in Jefferson Parish, Louisiana, and Santa Clarita, California, implementing spatial interpolation parameters.
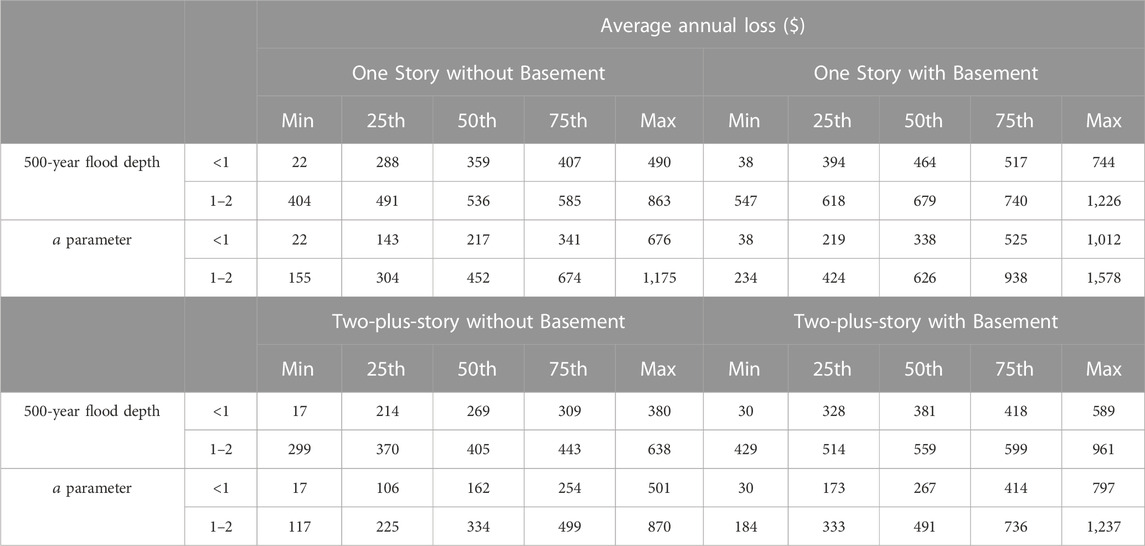
TABLE 11. Descriptive statistics of average annual loss ($; i.e., annual flood risk) by type of single-family home, after implementing synthetic flood parameters, by 500-year flood depth and a parameter.
6 Discussion
The derivation of the synthetic flood parameters (i.e.,
Another strength of this approach is that it overcomes complications associated with the changing value of assets over time. This is because the total annual flood risk (building, contents, and use) for single-family homes in the shaded X Zone is expressed proportionally to
The results show that the median AAL at
Not surprisingly, flood depth is the primary factor involved flood risk, with greater depth causing more damage. Thus, elevating the home is the primary strategy for flood risk reduction, but the improvements vary by 500-year flood depth. For example, while the flood risk reduction is approximately 36, 57, 71, and 81% for one through four feet above
The AALs for the case study subsets of Jefferson Parish (Louisiana) and Santa Clarita (California) generated by spatial interpolation-estimated flood parameters are within the range of AAL results using synthetic flood parameters. In the case of Jefferson Parish, the mean AAL values of $39, $61, $30, and $49 for one-story without basement, one-story with basement, two-plus-story without basement, and two-plus-story with basement single-family home, respectively, calculated using the spatial interpolation-estimated flood parameters, are between the minimum and 25th percentile AAL for the appropriate 500-year flood depth and
7 Conclusion
Although areas outside the SFHA may be highly susceptible to destructive and unanticipated floods at return periods beyond 100 years, they are often overlooked in flood risk assessments, often because they seldom have sufficient data to predict flood parameters. The increased need to have meaningful data outside the SFHA to understand flood hazard risk motivated this new approach to estimate AAL within the shaded X Zone using synthetic flood parameters. The derivation of synthetic flood hazard parameters enables the estimation of flood risk values in the shaded X Zone to assist stakeholders in minimizing flood risk. The major findings are:
• The synthetic data approach improves understanding of flood risk in the shaded X Zone for 1740 scenarios that include a wide range of 500-year flood depths.
• Flood depth-return period relationships provide vital information regarding flood depths at longer return periods that can be used to enhance flood resilience.
• For the analyzed synthetic data, the median AAL for all four types of single-family homes (one- and two-plus-story, each without and with basement) in the shaded X Zone falls between 0.10 and 0.78 percent of
• The median value of AAL reduction falls between 0.06 and 0.23 percent of
• For case study areas within Jefferson Parish (Louisiana) and Santa Clarita (California), AAL values calculated from spatial interpolation-estimated flood parameters fall within the range of those computed from synthetic flood parameters.
Although this study provides an important first step for predicting and enhancing community understanding of the flood risk in the shaded X Zone, some cautions need to be considered. First, the numerical results will differ from those suggested here in areas where the
Data availability statement
The original contributions presented in the study are included in the article/Supplementary Material; further inquiries can be directed to the corresponding author.
Author contributions
AA developed the methodology, analyzed the data, interpreted the findings, and developed the initial text. RM selected the case study area, prepared the input data, and supervised the research. CF supervised the research, provided insight and recommendation for the research, and reviewed and edited the manuscript. RR reviewed and edited the writing of the manuscript and provided insight and recommendations for the research. MR reviewed and edited the manuscript.
Funding
This research was funded by the USDA National Institute of Food and Agriculture, Hatch project LAB 94873, accession number 7008346, U.S. Department of Homeland Security (Award Number: 2015-ST-061-ND0001-01), the Louisiana Sea Grant College Program (Omnibus cycle 2020–2022; Award Number: NA18OAR4170098; Project Number: R/CH-03; Omnibus cycle 2022–2024; Award Number: NA22OAR4710105; Project Number: R/CH-05), the Gulf Research Program of the National Academies of Sciences, Engineering, and Medicine under the Grant Agreement number: 200010880 “The New First Line of Defense: Building Community Resilience through Residential Risk Disclosure,” and the U.S. Department of Housing and Urban Development (HUD; 2019–2022; Award No. H21679CA, Subaward No. S01227-1). The publication of this article is supported by the LSU AgCenter LaHouse Resource Center.
Conflict of interest
The authors declare that the research was conducted in the absence of any commercial or financial relationships that could be construed as a potential conflict of interest.
Publisher’s note
All claims expressed in this article are solely those of the authors and do not necessarily represent those of their affiliated organizations, or those of the publisher, the editors and the reviewers. Any product that may be evaluated in this article, or claim that may be made by its manufacturer, is not guaranteed or endorsed by the publisher.
Author disclaimer
Any opinions, findings, conclusions, and recommendations expressed in this manuscript are those of the author and do not necessarily reflect the official policy or position of the funders.
Supplementary material
The Supplementary Material for this article can be found online at: https://www.frontiersin.org/articles/10.3389/feart.2023.1051546/full#supplementary-material
References
Al Assi, A., Mostafiz, R. B., Friedland, C. J., Rahim, M. A., and Rohli, R. V. (2023a). Flood risk assessment for residences at the neighborhood scale by owner/occupant type and first-floor height. Front. Big Data 5, 997447. doi:10.3389/fdata.2022.997447
Al Assi, A., Mostafiz, R. B., Friedland, C. J., Rohli, R. V., Taghinezhad, A., and Rahim, M. A. (2023b). Cost-effectiveness of federal CDBG-DR Road Home Program mitigation assistance in Jefferson Parish, Louisiana. Nat. Hazards. doi:10.1007/s11069-023-05904-3
American Society of Civil Engineers (Asce), (2014). Flood resistant design and construction. ASCE Stand. 24–14, 1–75. doi:10.1061/9780784413791
Amoroso, S. D., and Fennell, J. P. (2008). “A rational benefit/cost approach to evaluating structural mitigation for wind damage: Learning “the hard way’’ and looking forward,” in Structures congress 2008 (Vancouver, Canada: ASCE). doi:10.1061/41016(314)249
Armal, S., Porter, J. R., Lingle, B., Chu, Z., Marston, M. L., and Wing, O. E. J. (2020). Assessing property level economic impacts of climate in the US, new insights and evidence from a comprehensive flood risk assessment tool. Climate 8 (10), 116–120. doi:10.3390/cli8100116
Association of State Floodplain Managers, (2020). Flood mapping for the nation A cost analysis for completing and maintaining the nation’s NFIP flood map inventory. https://webapps.usgs.gov/infrm/estBFE/.
Bohn, F. H. (2013). Design flood elevations beyond code requirements and current best practices. LSU Master’s Theses. Lsu Press, Baton Rouge, Louisiana, https://digitalcommons.lsu.edu/gradschool_theses/69.
Botzen, W. J. W., and van den Bergh, J. C. J. M. (2008). Insurance against climate change and flooding in The Netherlands: Present, future, and comparison with other countries. Risk Anal. 28 (2), 413–426. doi:10.1111/j.1539-6924.2008.01035.x
Bowers, C., Serafin, K. A., and Baker, J. (2022). A performance-based approach to quantify atmospheric river flood risk. Nat. Hazards Earth Syst. Sci. 22 (4), 1371–1393. doi:10.5194/nhess-22-1371-2022
Collins, E. L., Sanchez, G. M., Terando, A., Stillwell, C. C., Mitasova, H., Sebastian, A., et al. (2022). Predicting flood damage probability across the conterminous United States. Environ. Res. Lett. 17 (3), 34006. doi:10.1088/1748-9326/ac4f0f
Fema, (2013). Designing for flood levels above the BFE after hurricane Sandy. http://www.region2coastal.com/.
Fema, (2019). National flood insurance program flood mitigation measures for multi-family buildings. https://floodawareness.org/wp-content/uploads/2020/08/16-J-0218_Multi-FamilyGuidance_06222020.pdf.
Fema, (2021). Risk mapping, assessment and planning (risk MAP). https://www.fema.gov/flood-maps/tools-resources/risk-map.
Ferguson, A. P., and Ashley, W. S. (2017). Spatiotemporal analysis of residential flood exposure in the Atlanta, Georgia metropolitan area. Nat. Hazards 87 (2), 989–1016. doi:10.1007/s11069-017-2806-6
Friedland, C. J., Lee, Y. C., Mostafiz, R. B., Lee, J., Mithila, S., Rohli, R. V., et al. (2023). FloodSafeHome: Evaluating benefits and savings of freeboard for improved decision-making in flood risk mitigation. Front. Commun. 8, 1060901. doi:10.3389/fcomm.2023.1060901
Gnan, E., Friedland, C. J., Mostafiz, R. B., Rahim, M. A., Gentimis, T., Taghinezhad, A., et al. (2022b). Economically optimizing elevation of new, single-family residences for flood mitigation via life-cycle benefit-cost analysis. Front. Environ. Sci. 10, 889239. doi:10.3389/fenvs.2022.889239
Gnan, E., Friedland, C. J., Rahim, M. A., Mostafiz, R. B., Rohli, R. V., Orooji, F., et al. (2022a). Improved building-specific flood risk assessment and implications of depth-damage function selection. Front. Water 4, 919726. doi:10.3389/frwa.2022.919726
Gnan, E., Mostafiz, R. B., Rahim, M. A., Friedland, C. J., Rohli, R. V., Taghinezhad, A., et al. (2022c). Freeboard life-cycle benefit-cost analysis of a rental single-family residence for landlord, tenant, and insurer. Nat. Hazards Earth Syst. Sci. Discuss. Prepr. [Preprint]. doi:10.5194/nhess-2022-222
Goldberg, N., and Watkins, R. L. (2021). Spatial comparisons in wetland loss, mitigation, and flood hazards among watersheds in the lower St. Johns River basin, northeastern Florida, USA. Nat. Hazards 109 (2), 1743–1757. doi:10.1007/s11069-021-04896-2
Habete, D., and Ferreira, C. M. (2017). Potential impacts of sea-level rise and land-use change on special flood hazard areas and associated risks. Nat. Hazards Rev. 18 (4), 4017017. doi:10.1061/(asce)nh.1527-6996.0000262
Hagen, S. C., and Bacopoulos, P. (2012). Coastal flooding in Florida’s big bend region with application to sea level rise based on synthetic storms analysis. Terr. Atmos. Ocean. Sci. 23 (5), 481–500. doi:10.3319/tao.2012.04.17.01(wmh)
Hallegatte, S., Green, C., Nicholls, R. J., and Corfee-Morlot, J. (2013). Future flood losses in major coastal cities. Nat. Clim. Change 3 (9), 802–806. doi:10.1038/nclimate1979
Hemmati, M., Mahmoud, H. N., Ellingwood, B. R., and Crooks, A. T. (2021). Unraveling the complexity of human behavior and urbanization on community vulnerability to floods. Sci. Rep. 11 (1), 20085. doi:10.1038/s41598-021-99587-0
Hino, M., and Hall, J. W. (2017). Real options analysis of adaptation to changing flood risk: Structural and nonstructural measures. ASCE-ASME J. Risk Uncertain. Eng. Syst. Part A Civ. Eng. 3 (3), 4017005. doi:10.1061/ajrua6.0000905
Kennedy, A., Copp, A., Florence, M., Gradel, A., Gurley, K., Janssen, M., et al. (2020). Hurricane Michael in the area of Mexico beach, Florida. J. Waterw. Port, Coast. Ocean Eng. 146 (5), 5020004. doi:10.1061/(asce)ww.1943-5460.0000590
Kiaghadi, A., Govindarajan, A., Sobel, R. S., and Rifai, H. S. (2020). Environmental damage associated with severe hydrologic events: A LiDAR-based geospatial modeling approach. Nat. Hazards 103 (3), 2711–2729. doi:10.1007/s11069-020-04099-1
Kousky, C., Palim, M., and Pan, Y. (2020a). Flood damage and mortgage credit risk: A case study of hurricane Harvey. J. Hous. Res. 29 (1), S86–S120. doi:10.1080/10527001.2020.1840131
Kousky, C., Shabman, L., Linder-Baptie, Z., and Peter, E. S. (2020b). Perspectives on flood insurance demand outside the 100-year floodplain. https://riskcenter.wharton.upenn.edu/wp-content/uploads/2020/05/Perspectives-on-Flood-Insurance-Demand-Outside-the-100-Year-Floodplain.pdf.
Meyer, V., Haase, D., and Scheuer, S. (2009). Flood risk assessment in European river basins-concept, methods, and challenges exemplified at the Mulde River. Integr. Environ. Assess. Manag. 5 (1), 17–26. doi:10.1897/ieam_2008-031.1
Mostafiz, R. B., Assi, A. A., Friedland, C. J., Rohli, R. V., and Rahim, M. A. (2022a). “A numerically-integrated approach for residential flood loss estimation at the community level”, in EGU general assembly 2022 EGU (Vienna, Austria, 23–27. doi:10.5194/egusphere-egu22-10827
Mostafiz, R. B., Bushra, N., Rohli, R. V., Friedland, C. J., and Rahim, M. A. (2021a). Present vs. future property losses from a 100-year coastal flood: A case study of grand isle, Louisiana. Front. Water 3, 763358. doi:10.3389/frwa.2021.763358
Mostafiz, R. B., Friedland, C. J., Rahman, M. A., Rohli, R. V., Tate, E., Bushra, N., et al. (2021c). Comparison of neighborhood-scale, residential property flood-loss assessment methodologies. Front. Environ. Sci. 9, 734294. doi:10.3389/fenvs.2021.734294
Mostafiz, R. B., Friedland, C., Rahim, M. A., Rohli, R. V., and Bushra, N. (2021b). A data-driven, probabilistic, multiple return period method of flood depth estimation. In American geophysical union fall meeting Agu Fall Meeting Abstracts, Illinois, CH, USA, https://www.authorea.com/doi/full/10.1002/essoar.10509337.1
Mostafiz, R. B., Rahim, M. A., Friedland, C. J., Rohli, R. V., Bushra, N., and Orooji, F. (2022b). A data-driven spatial approach to characterize the flood hazard. Front. Big Data 5, 1022900. doi:10.3389/fdata.2022.1022900
Mostafiz, R. B., Rohli, R. V., Friedland, C. J., and Lee, Y.- C. (2022c). Actionable information in flood risk communications and the potential for new web-based tools for long-term planning for individuals and community. Front. Earth Sci. 10, 840250. doi:10.3389/feart.2022.840250
NOAA, (2022). National centers for environmental information (NCEI) U.S. Billion-dollar weather and climate disasters. https://www.ncei.noaa.gov/access/billions/summary-stats/US/1980-2021.doi:10.25921/stkw-7w73
Patel, M. B. (2020). Flood frequency analysis using Gumbel distribution method at garudeshwar weir, narmada basin. Int. J. Trend Res. Dev. 7 (1), 36–38. http://www.ijtrd.com/papers/IJTRD21899.pdf.
Pistrika, A., Tsakiris, G., and Nalbantis, I. (2014). Flood depth-damage functions for built environment. Environ. Process. 1 (4), 553–572. doi:10.1007/s40710-014-0038-2
Pricope, N. G., Hidalgo, C., Pippin, J. S., and Evans, J. M. (2022). Shifting landscapes of risk: Quantifying pluvial flood vulnerability beyond the regulated floodplain. J. Environ. Manag. 304, 114221. doi:10.1016/j.jenvman.2021.114221
Rahim, M. A., Friedland, C. J., Rohli, R. V., Bushra, N., and Mostafiz, R. B. (2021). “A data-intensive approach to allocating owner vs. NFIP portion of average annual flood losses,” in AGU 2021 fall meeting, 13–17 december (New Orleans, LA, USA. AGU, https://www.authorea.com/doi/full/10.1002/essoar.10509884.1.
Rahim, M. A., Gnan, E. S., Friedland, C. J., Mostafiz, R. B., and Rohli, R. V. (2022). “An improved micro scale average annual flood loss implementation approach”, EGU, in EGU general assembly 2022 (Vienna, Austria, 23–27. doi:10.5194/egusphere-egu22-10940
Rath, W., Kelly, C. P., and Beahm, K. A. (2018). Floodplain building elevation standards current requirements & enhancement options for connecticut shoreline municipalities. University of Connecticut Center for Energy & Environmental Law. University of Connecticut, Storrs, CT, USA, https://circa.uconn.edu/wp-content/uploads/sites/1618/2018/03/Floodplain-Building-Elevation-Standards.pdf.
Singh, P., Sinha, V. S. P., Vijhani, A., and Pahuja, N. (2018). Vulnerability assessment of urban road network from urban flood. Int. J. Disaster Risk Reduct., 28, 237–250. doi:10.1016/j.ijdrr.2018.03.017
Šugareková, M., and Zeleňáková, M. (2021). Flood risk assessment and flood damage evaluation – The review of the case studies. Acta Hydrol. Slovaca 22 (1), 156–163. doi:10.31577/ahs-2021-0022.01.0019
Taghinezhad, A., Friedland, C. J., and Rohli, R. V. (2021). Benefit-cost analysis of flood-mitigated residential buildings in Louisiana. Hous. Soc. 48 (2), 185–202. doi:10.1080/08882746.2020.1796120
Taghinezhad, A., Friedland, C. J., Rohli, R. V., and Marx, B. D. (2020). An imputation of first-floor elevation data for the avoided loss analysis of flood-mitigated single-family homes in Louisiana, United States. Front. Built Environ. 6, 138. doi:10.3389/fbuil.2020.00138
Technical Mapping Advisory Council (TMAC), (2015). TMAC annual report 2015. https://www.fema.gov/sites/default/files/documents/fema_tmac_2015_annual_report.pdf.
Usace, (2000). “Economic guidance memorandum (EGM) 01-03, generic depth damage relationships. 1–3”, in Memorandum from USACE (United States Army Corps of Engineers) OCLC, (Washington, DC, USA.
Wang, Y., and Sebastian, A. (2021). Community flood vulnerability and risk assessment: An empirical predictive modeling approach. J. Flood Risk Manag. 14 (3), 12739. doi:10.1111/jfr3.12739
Wing, O. E. J., Lehman, W., Bates, P. D., Sampson, C. C., Quinn, N., Smith, A. M., et al. (2022). Inequitable patterns of US flood risk in the Anthropocene. Nat. Clim. Change 12 (2), 156–162. doi:10.1038/s41558-021-01265-6
Xian, S., Lin, N., and Hatzikyriakou, A. (2015). Storm surge damage to residential areas: A quantitative analysis for hurricane Sandy in comparison with FEMA flood map. Nat. Hazards 79 (3), 1867–1888. doi:10.1007/s11069-015-1937-x
Xian, S., Lin, N., and Kunreuther, H. (2017). Optimal house elevation for reducing flood-related losses. J. Hydrology, 548, 63–74. doi:10.1016/j.jhydrol.2017.02.057
Keywords: flood risk, average annual loss (AAL), flood mitigation strategy, special flood hazard area (SFHA), shaded X Zone
Citation: Al Assi A, Mostafiz RB, Friedland CJ, Rohli RV and Rahim MA (2023) Homeowner flood risk and risk reduction from home elevation between the limits of the 100- and 500-year floodplains. Front. Earth Sci. 11:1051546. doi: 10.3389/feart.2023.1051546
Received: 22 September 2022; Accepted: 03 April 2023;
Published: 18 April 2023.
Edited by:
Lingling Shen, Beijing Meteorological Information Center, ChinaReviewed by:
Guy Jean-Pierre Schumann, University of Bristol, United KingdomHossein Hamidifar, Shiraz University, Iran
Copyright © 2023 Al Assi, Mostafiz, Friedland, Rohli and Rahim. This is an open-access article distributed under the terms of the Creative Commons Attribution License (CC BY). The use, distribution or reproduction in other forums is permitted, provided the original author(s) and the copyright owner(s) are credited and that the original publication in this journal is cited, in accordance with accepted academic practice. No use, distribution or reproduction is permitted which does not comply with these terms.
*Correspondence: Ayat Al Assi, YWFsYXNzMUBsc3UuZWR1