 Yen-Heng Lin
 Boniface Fosu
 Olawale J. Ikuyajolu
94% of researchers rate our articles as excellent or good
Learn more about the work of our research integrity team to safeguard the quality of each article we publish.
Find out more
ORIGINAL RESEARCH article
Front. Earth Sci., 02 February 2023
Sec. Atmospheric Science
Volume 11 - 2023 | https://doi.org/10.3389/feart.2023.1033789
This article is part of the Research TopicEarly Career Scientists’ Contributions to Tropical Pacific Ocean Dynamics and Its Interaction on Mid-Latitude Weather and Climate: Features, Mechanisms, and PredictionView all 5 articles
Tropical-extratropical teleconnection during boreal summer is characterized by a circumglobal teleconnection (CGT) pattern and is often considered as one of the major predictability sources of extratropical atmospheric circulation. The extent to which the summer circumglobal teleconnection pattern is remotely forced by tropical sea surface temperature (SST) variability remains to be elucidated. Here, we use a suite of pacemaker simulations from the Community Earth System Model (CESM1) to investigate the contribution of tropical sea surface temperature variability in the Eastern Tropical Pacific, Northern Atlantic, and Indo-Western Pacific to the summer circumglobal teleconnection circulation. We find that the variability of circumglobal teleconnection in the summer is dominated by the sea surface temperature variability in the Indo-Western Pacific and its remotely forced ENSO-like anomaly. As a result, the Indo-Western Pacific pacemaker experiment exhibits precipitation and surface temperature teleconnection patterns closest to the observed patterns in the Northern Hemisphere. A better understanding of such tropical-extratropical interactions can inform better seasonal forecasts and model development.
A dominant feature associated with the Northern Hemisphere (NH) upper-tropospheric westerly jet stream is the global circumglobal teleconnection (CGT) pattern. The term describes quasi-stationary Rossby waves that appear ubiquitous in the waveguide of the jet and span the entire hemisphere in a zonal wavenumber five structure (Hoskins and Karoly, 1981; Branstator, 2002; Ding and Wang, 2005; Ding et al., 2011; Wang et al., 2013; Screen and Simmonds, 2014; Wu et al., 2016; Wills et al., 2019). The CGT pattern can prevail over specific regions for days and has been invoked to explain several types of midlatitude extremes, including heat waves and cold spells, making them a potential source of extended predictability for extreme events (Hoskins, 2013; Teng et al., 2013).
The CGT pattern varies by season and is strongest during winter when the jet is at its peak amplitude. The El Niño–Southern Oscillation (ENSO) also peaks in winter and increases the probability of the well-known Pacific-North American (PNA) teleconnection of Wallace and Gutzler (1981). Consequently, studies that emphasize wintertime extratropical circulation tend to focus on the PNA, which is inherently linked to the CGT pattern (Soulard et al., 2021).
Because the westerly jet weakens and shifts poleward in summer, baroclinic disturbances are not as active. Likewise, large-scale teleconnection patterns are less prevalent due to the diminished role of ENSO (Straus and Shukla, 2002). The summertime CGT pattern is thus weaker than its winter counterpart, yet, it is accompanied by significant rainfall and surface air temperature anomalies, which has led to increased research attention in recent decades (Blackburn et al., 2008; Saeed et al., 2014; Wolf et al., 2018; Thompson et al., 2019). Despite this growing attention, several aspects of the summertime waveguide teleconnection, including its underlying mechanisms and sources of variability, remain to be elucidated.
The CGT pattern is generally thought of as an internal mode of atmospheric variability, locally determined by the interplay of the jet, its perturbations, and at times remote diabatic forcing, most notably in the form of tropical convection (Hoskins and Karoly, 1981; Cassou et al., 2005; Yasui and Watanabe, 2010; Wulff et al., 2017; O’Reilly et al., 2018). Of all the forcing mechanisms adept at stimulating summer CGT episodes, the Indian Summer Monsoon (ISM) is the most referenced (Ding and Wang 2005). Several studies have shown that CGTs can form as a result of a two-way interaction between the waveguides of the jet and the Indian summer monsoon (ISM). This relationship is modulated by ENSO, especially during periods of strong ISM–ENSO interactions. Moreover, ENSO can independently force the CGT. It follows that CGTs are favored in the summers that precede the peak phase of ENSO events and a weaker, but sometimes detectable, response in the summer following the event (Ding et al., 2011).
Recent advances in our understanding of tropical interbasin teleconnections has shown that ENSO itself is strongly modulated by SST variability in the tropical Indian and Atlantic Oceans (Wang et al., 2017; Cai et al., 2019). For instance, summer Atlantic Niños (Niñas) favor the development of Pacific Niñas (Niños) the following winter (Keenlyside and Latif, 2007), and the Atlantic multidecadal oscillation can increase the probability of the central Pacific (CP) type of ENSO (Ham et al., 2013; Jia et al., 2016). Similarly, the leading modes of SST variability in the tropical Indian Ocean can trigger the development of ENSO in the subsequent year and contemporaneously enhance ENSO or accelerate its demise (Yue et al., 2021).
The relative contribution of the SST variability in the tropical oceanic basins to the observed variability of the CGT has not been studied. In this study, we leverage a suite of pacemaker experiments from the Community Earth System Model (CESM1) to distinguish the remote impacts of SST variability in the tropical Indo-Western Pacific, Eastern Pacific, and Northern Atlantic (i.e., target regions) on summertime CGTs. These results can help improve the seasonal prediction of summertime atmospheric circulation and weather extremes.
We discriminate the influence of the SST variability in each target region by analyzing a 10-member ensemble of pacemaker experiments that mirrors the CESM Large Ensemble (CESM_LES; Kay et al., 2015). Specifically, we utilize the Pacific (CESM_ETP; Deser et al., 2017), Atlantic (CESM_NAT; Yang et al., 2020), and the Indian Ocean (CESM_IWP; Zhang et al., 2019) pacemaker experiments, in which the model is nudged towards observed historical monthly SST anomalies within the target regions (red boxes, Figure 1). The rest of the model’s coupled climate system is free to evolve. Each member is initialized with slightly different initial conditions as in CESM_LES and forced with historical radiative forcings from 1950 to 2005 and RCP8.5 from 2006 to 13. For additional details on the pacemaker experimental design, see Schneider and Deser (2018).
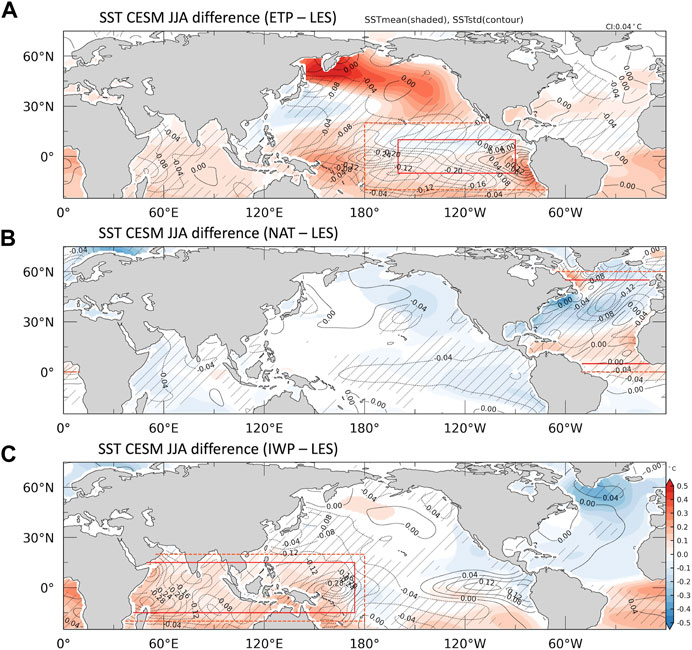
FIGURE 1. The SST mean (shaded) and standard deviation (contour) difference between pacemaker experiments and CESM_LES (pacemaker subtracts CESM_LES) in June—August (JJA) for (A) CESM_ETP, (B) CESM_NAT, and (C) CESM_IWP. The shading (hatching) donates regions in which the mean (standard deviation) difference is significant at the 95% confidence level.
Forcing the model with observations ensures that it integrates realistic SST variability over the tropical Indo-Western Pacific, Eastern Pacific, and Northern Atlantic, free of model biases—this is the so-called “pacemaker.” The CESM_LES ensemble mean can therefore be removed from each pacemaker ensemble mean to estimate the response of the global climate system to the observed SST variations in the target regions (Deser et al., 2017; Holland et al., 2019; Zhang et al., 2019; Meehl et al., 2021). For this reason, we computed the anomaly fields of the pacemaker experiments by subtracting the mean of the CESM_LES. The degrees of freedom afforded by the 10-member ensemble also make it possible to quantify the influence of regional SST variability on the observed time evolution of the climate system more accurately (Amaya et al., 2020). We focused all analysis on the summer (June—August) season, from 1950 to 2013.
The CGT relies on the generation and propagation of Rossby waves. Against this backdrop, we constructed a simple Rossby wave source (RWS, Sardeshmukh and Hoskins, 1988) index and used it to distinguish the SST patterns associated with the CGT in each pacemaker. The RWS formulation describes the forcing of Rossby waves by the divergent flow. It can be written as:
where S is the Rossby wave source (RWS),
The CGT pattern, as presented by Ding and Wang (2005), is characterized by five anomalous high pressure or action centers, located in West-central Asia (WCA, 60°E–75°E and 35°N–45°N), North-West Pacific (NWP, 120°E–135°E and 35°N–45°N), North Pacific (NPA, 170°E–165°W and 35°N–45°N), West America (WAM, 170°E–165°W and 35°N–45°N), and East America (EAM, 65°W–45°W and 40°N–50°N). In both observations and model experiments, the strongest RWS within the waveguide are found in the vicinity of the WCA, as shown in Figures 2A–E. As a result, the RWS index, hereafter RWS_CGT, was defined as the average 200-hPa RWS over the WCA region (30°S–45°N, 50°E−70°E). Alternatively, the principal component of the first Empirical orthogonal function of the 200-hPa RWS over 20°S–60°N and 30°E−110°E can be used.
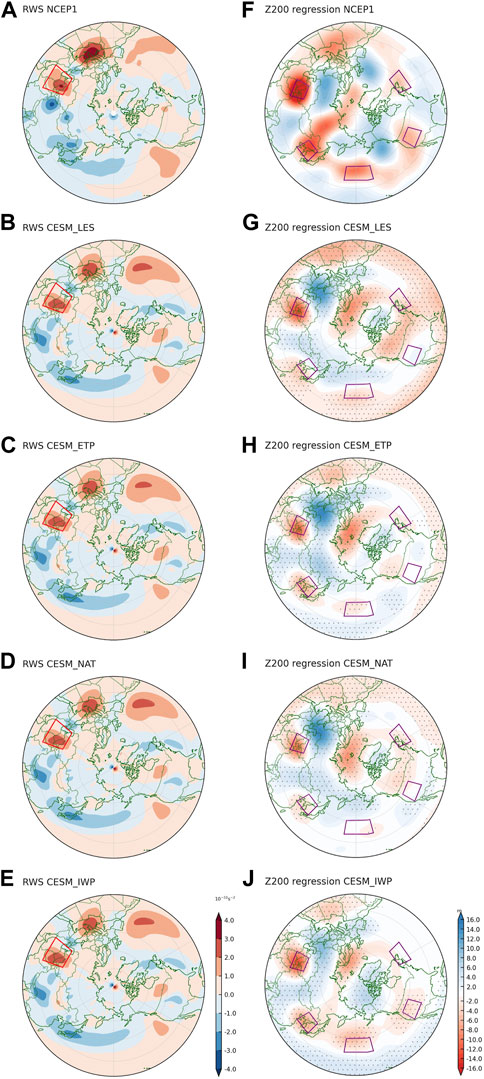
FIGURE 2. The summer mean Rossby wave source (RWS) (A–E), and the regression of the 200 hPa geopotential height (Z200) (F–J) on the RWS_CGT index in summer (June—August) and for (A,F) the NCEP one reanalysis, (B,G) the CESM_LES, (C,H) the CESM_ETP, (D,I) the CESM_NAT, and (E,J) the CESM_IWP. The dotted regions in (A–E) indicate the ensemble mean of regression pattern is significant at the 95% confidence level. The purple boxes show the action centers of CGT.
Results from the pacemaker experiments and CESM_LES are compared to the National Centers for Environmental Prediction (NCEP) and National Center for Atmospheric Research (NCAR) (Kalnay et al., 1996) reanalysis data at 2.5-degree horizontal resolution, NOAA’s Precipitation Reconstruction over Land (PREC/L) (Chen et al., 2002) and land surface temperature from the Climatic Research Unit (CRU_TS version 4; Harris et al., 2020). Unless otherwise noted, statistical significance is determined using a student’s t-test at the 95% confidence level.
Figure 1 shows the anomalous summer SST mean and standard deviation of the pacemaker experiments. Recall that, here, anomalies are calculated as deviations from the CESM_LES to emphasize the effects of the pacemaker (the restored observed SST anomalies over the target region) compared to the model climatology. Significant differences exist in the vicinity of the restoring regions, effectively depicting the observed SST variability associated with each pacemaker. Outside the restoring regions, the differences represent the mean SST response to each pacemaker (Figures 1A–C). As a result of changes in the SST variability, tropical convection is modified, along with the redistribution of heat, which in turn affects tropical-extratropical teleconnection pathways. This is depicted in Supplementary Figure S1, the circulation differences of 200-hPa velocity potential (a proxy for convection), which are induced by the changes in the tropical SST variability associated with each pacemaker experiment.
The fidelity of the CESM to reproduce the CGT is shown in Figure 2, represented by the regression of 200 hPa geopotential height (Z200) anomaly fields on the RWS_CGT index (Figures 2F–J). In comparison to observations (Figure 2F), the anomalous action centers (purple boxes) of all the model simulations (Figures 2G–J), albeit weaker in some instances, are confined to the waveguide. This is a good measure of the model’s realism in the depiction of the CGT.
To objectively deduce the representation of the CGT in each experiment, we present the correlation between the RWS_CGT index and the Z200 time series for each action center as box plots in Figure 3. For model results, correlations were calculated independently for each ensemble member, not the ensemble mean per usual. The idea is to avoid over-emphasizing the forced response to the pacemakers. The results show that correlation coefficients decrease downstream from the WCA, suggesting that regions that are farther away are less instrumental in maintaining the CGT. Judging by this metric, the CESM_IWP experiment is the closest to the observed (Figure 3A), having had the highest correlation coefficient at every action center but the NPA and EAM. This is perhaps the first indication that the Indo-Western Pacific pacemaker is a vital contributor to the variability of the summertime CGT. These findings are summarized in Figure 3B, which compares the mean RWS in observations to the model. The RWS in the CESM_ETP experiment is not as strong as the CESM_IWP experiment but exceeds CESM_LES, whiles the weakest RWS is associated with the North Atlantic pacemaker.
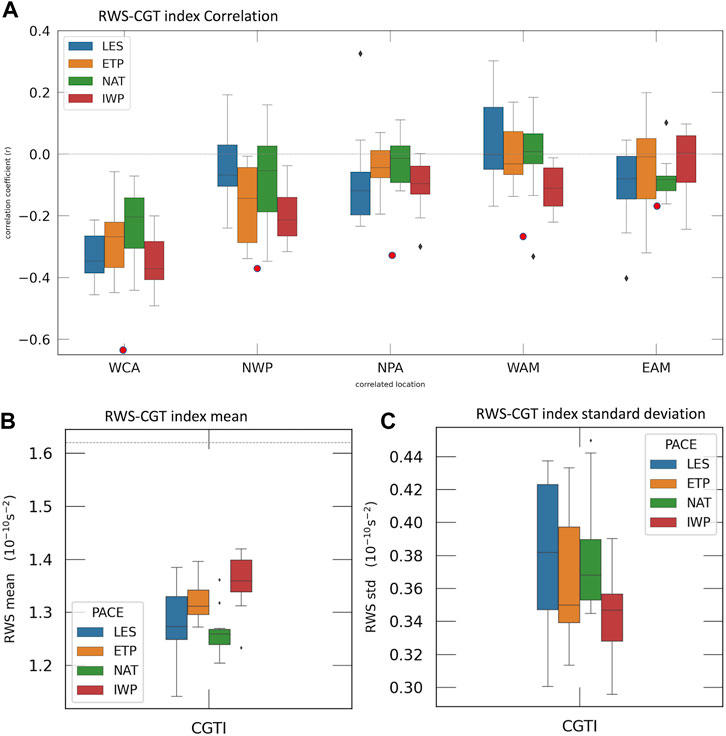
FIGURE 3. (A) The boxplot of 10-ensemble members correlation coefficient between RWS_CGT index (red box in Figures 2A–E) and Z200 at observed centers of CGT pattern (purple boxes in Figures 2F–J) for each pacemaker. Red dots show the correlation coefficients from the observed data. (B) The boxplot of 10-ensemble summertime RWS mean, and the dashed line shows the RWS mean of observation. (C) The boxplot of 10-ensemble summertime RWS standard deviation. The locations of RWS_CGT is at 50°E–70°E and 30°N–45°N. The centers of CGT pattern are at West-central Asia (WCA; 60°E–75°E and 35°N–45°N), North-West Pacific (NWP; 120°E–135°E and 35°N–45°N), North Pacific (NPA; 170°E–165°W and 35°N–45°N), West America (WAM; 120°W–105°W and 35°N–45°N), and East America (EAM; 65°W–45°W and 40°N–50°N).
Although the CESM_IWP experiment manifests the strongest RWS, it has the least RWS spread among the four experiments (Figure 3C). Interestingly, the CESM_LES is characterized by the highest RWS variance, followed by the CESM_ETP and CESM_NAT experiments, respectively (Figure 3C). It is possible that the observed SST pacemakers act to constrain the internal perturbations within the waveguide, nudging the amplitude of the individual ensemble members closer. Thus, the large RWS spread in the CESM_LES is an artifact of a relatively strong internal variability. Figure 3 raises the expectation that if the model’s SST biases were improved, it would lead to a significant improvement in the simulation of the boreal summer CGT.
Next, we use linear regression to diagnose the cause-effect relationship between each pacemaker and the CGT, focusing on ENSO as a conduit for the remote interactions between tropical SST variability and the CGT (Figures 4, 5). The regression of summer SST and 850-hPa winds on the summer RWS_CGT index is first shown in Figure 4. The observed SST regression shows a developing ENSO that is distinguished by stronger westerly wind anomalies across the equatorial Pacific and a well-developed ENSO-like SST anomaly (Figure 4A). Comparatively, the SST and wind patterns in the CESM_ETP (Figure 4C) and CESM_NAT (Figure 4D) experiments are analogous to the CESM_LES instead, with CESM_ETP featuring the more robust pattern of the two. The equatorial Pacific SST anomalies in all three experiments are weaker than the observed and also appear out of phase (Lu and Liu, 2019; Tan et al., 2020). The CESM_IWP experiment (Figure 4E) is more comparable to observations, further suggesting that SST variability in the Indo-Western has the closest association to the boreal summer CGT pattern.
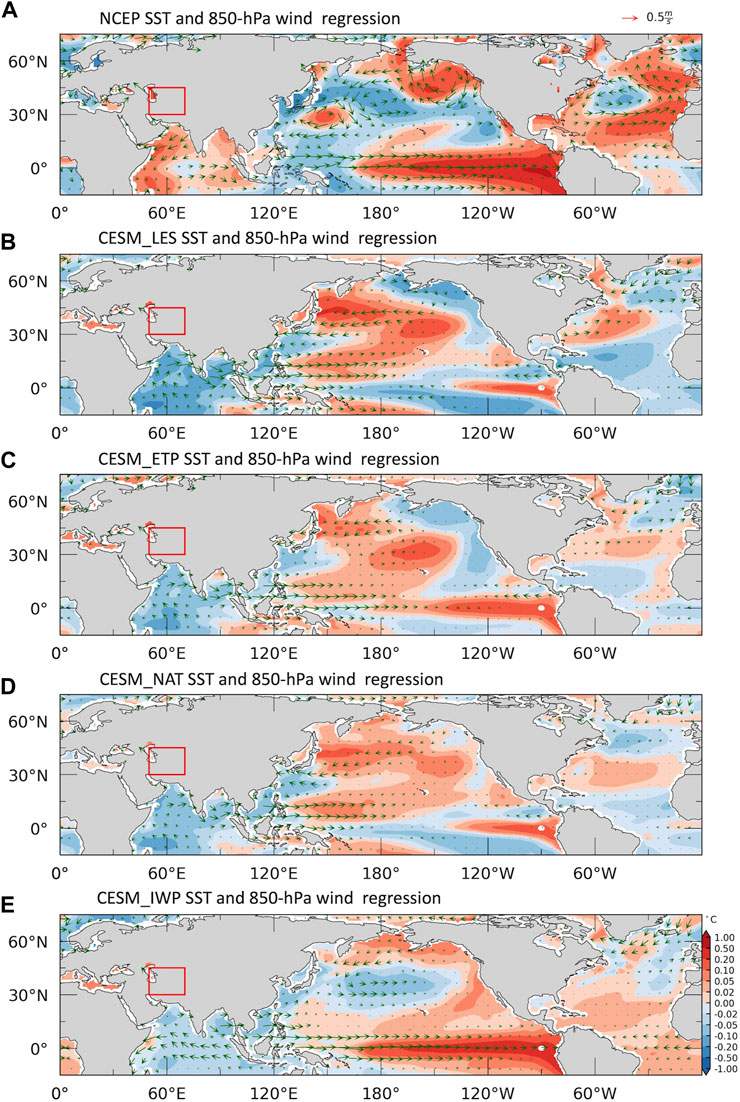
FIGURE 4. Linear regression of summer SST and 850-hPa winds on RWS_CGT index for (A) NCEP, (B) CESM_LES, (C) CESM_ETP, (D) CESM_NAT, and (E) CESM_IWP. The pacemakers use ensemble mean and the red box is the location of RWS_CGT index.
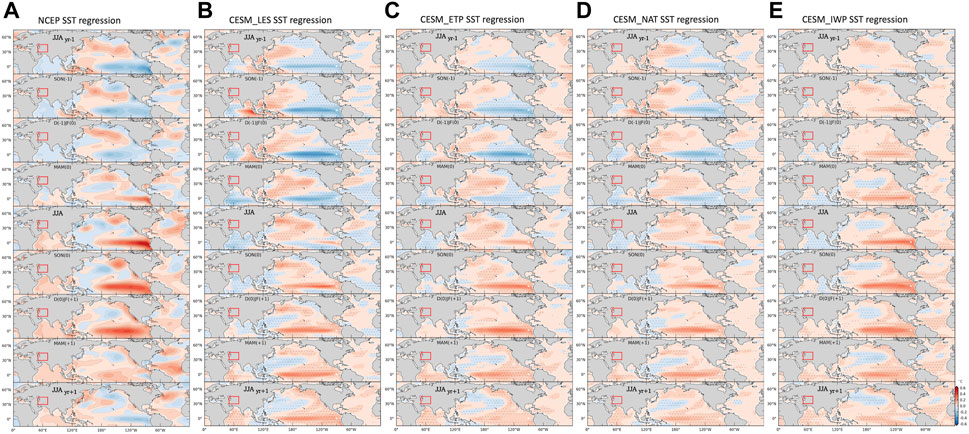
FIGURE 5. The cross regression of SST on summer RWS_CGT index (mean RWS in the red box) from the preceding year’s June—August (JJAyr-1) to the subsequent year’s June—August (JJAyr+1) for (A) NCEP, (B) CESM_LES, (C) CESM_ETP, (D) CESM_NAT, and (E) CESM_IWP. The pacemakers use ensemble mean and the red box is the location of RWS_CGT index. The dotted regions indicate the ensemble members agree with the changes at 95% significance level.
To clarify the nature of the relationship between the CGT and ENSO, we evaluate the lagged regression of SST on the summer RWS_CGT index in Figure 5, starting from the summer of the preceding year JJA(yr-1) to the subsequent year’s summer JJA(yr+1). To the extent that summertime CGT variability is linked to the developing phase of ENSO (Ding et al., 2011; Lee et al., 2014), this clearly discriminates ENSO’s mature stages from its developing stages. As previously alluded to, it becomes increasingly apparent that the evolution of ENSO in the CESM_LES (Figure 5B), CESM_ETP (Figure 5C), and CESM_NAT (Figure 5D) experiments are out of phase with the observed pattern (Figure 5A). The upshot is—the likelihood that the Eastern Pacific and North Atlantic pacemakers strongly pace the summertime CGT variability is further reduced.
Here as well, the CESM_IWP pacemaker induces a strong ENSO anomaly in the Pacific that evolves in a similar manner to a multi-year ENSO event (Figure 5E). This is consistent with research that has shown that the occurrence of multi-year ENSO is most probable when preceded by a strong El Niño or La Niña (Iwakiri and Watanabe, 2021). The Indo-Western Pacific pacemaker also seems to correct, at least in part, the phasing of ENSO in the model, making the maturing phases more concordant with observations. These patterns again confirm the linkages between the CGT and ENSO-like SST anomaly, especially to those remotely forced by the Indo-Western Pacific.
The regression map of the 200-hPa velocity potential shows the physical mechanism by which the Indo-Western Pacific pacemaker impacts the CGT (Supplementary Figure S2). The CESM_IWP SST anomaly induces a strong divergent flow in the Western Indian Ocean, with a magnitude that is consistent with the observation. As has been the common theme in this study, the CESM_NAT and CESM_ETP experiments are rather comparable to the CESM_LENS, indicative of a lesser impact on the CGT. The potency of the Indo-Western Pacific pacemaker experiment potentially derives from the inclusion of the SST variability in the Western Pacific warm pool, which is a critical precondition for both single-year and multi-year ENSO (Meinen and McPhaden, 2000; Fosu et al., 2020; Iwakiri and Watanabe, 2021). This is consistent with the outcome of our CESM_IWP experiment and the relatively weak outcome of the CESM_ETP experiment. For example, the strong ENSO-like SST anomaly influences the walker circulation and tropical deep convection in the Indian Ocean (Latif and Barnett, 1995; Cai et al., 2019; Wang 2019). For instance, during El Niño’s developing summer, strong divergence over the Indian Ocean arises as a response to the enhanced convection in the tropical central to Eastern Pacific. As a result, positive geopotential anomalies are induced over the tropical Indian Ocean, which can in turn perturb the waveguide and thus CGTs. In addition, the lead-lag response of interbasin interactions could impact ENSO variability and further influence the summer CGT.
In this study, we used the CESM pacemaker experiments to investigate the contribution of tropical SST variability on summer CGT variability through the variation of the Rossby wave source in West-central Asia. We find that developing ENSO-like SST anomalies, especially those remotely forced by the Indo-Western Pacific (CESM_IWP), are strongly linked to the summer CGT variability. The CESM_NAT and CESM_ETP experiments are rather comparable to the CESM_LENS, indicative of a lesser impact on the summer CGT. The CESM_IWP pacemaker not only directly impact the overlying atmosphere in Indo-West Pacific region, but also impacts the SST variation at other two ocean basins. In the equatorial Pacific, CESM_IWP is associated with a multi-year ENSO variability. The inclusion of observed SST variability in the Western Pacific warm pool reduces the climatological bias of the atmospheric response (divergent flow) to underlying SSTs, consequently, reducing the CGT mean state bias.
The lagged regression of SST on the summer RWS_CGT index, starting from the summer of the preceding year JJA(yr-1) to the subsequent year’s summer JJA(yr+1), reveal that the evolution of ENSO in the CESM_LES (Figure 5B), CESM_ETP (Figure 5C), and CESM_NAT (Figure 5D) experiments are out of phase with the observed pattern. However, the forced multi-year ENSO and the decrease in CGT mean state bias in CESM_IWP seem to help correct, at least in part, the phasing of ENSO–CGT relationship in the model, making the maturing phases more concordant with observations.
To explore the response of CGT patterns to better simulation of the relationship between the CGT and ENSO-like SST anomaly, we investigate the impacts of CGT on Northern Hemisphere summer precipitation (PR) and surface temperature (TS) in the pacemaker experiments. The PR and TS CGT patterns in CESM_LES are inconsistent with the observed teleconnection patterns over North America, Asia, North and West Africa (Figure 6). In the Eurasian region, the positive and negative TS teleconnection biases in CESM_LES (Figure 6B) in Northeast Asia and the Indian peninsula, respectively, are greatly reduced in CESM_IWP (Figure 6E). The PR teleconnection patterns in CESM_LES, CESM_NAT, and CESM_ETP (Figures 6F–J) are similar, whereas CESM_IWP has a reduced negative bias over Thailand and Vietnam. Similarly, over North America, only the CESM_IWP exhibits TS and PR teleconnection patterns closest to the observed patterns.
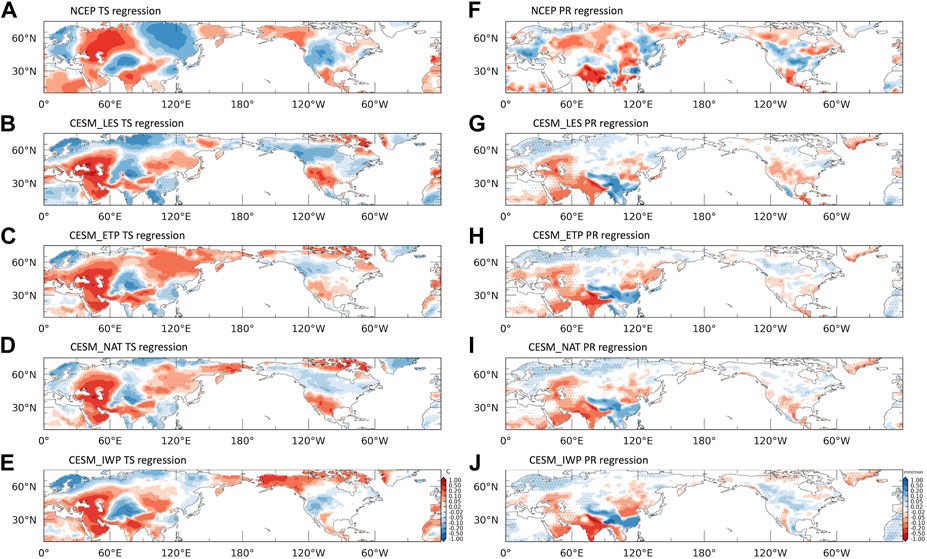
FIGURE 6. The regression coefficient of surface temperature (A–E) and precipitation (F–J) on summer RWS_CGT index for (A,F) the NCEP 1 reanalysis, (B,G) the CESM_LES, (C,H) the CESM_ETP, (D,I) the CESM_NAT, and (E,J) the CESM_IWP. The pacemakers use ensemble mean and the dotted areas indicate that the ensemble mean of regression coefficient is significant at the 95% confidence level.
This study suggests that summer CGT variability is dominated by SST variability in the Indo-Western Pacific, and that ENSO-like anomalies, especially those induced remotely by the Indo-Western Pacific, play a critical role in simulating summer CGT patterns. Therefore, reducing Indo-Western Pacific SST biases would result in significant improvements in the simulation of boreal summer CGT.
The original contributions presented in the study are included in the article/Supplementary Material, further inquiries can be directed to the corresponding author.
Y-HL: Conceptualization; data analysis; writing, reviewing, and editing. BF: Conceptualization; supervision; writing, reviewing, and editing. OI: Guidance, writing, reviewing, and editing.
The authors declare that the research was conducted in the absence of any commercial or financial relationships that could be construed as a potential conflict of interest.
All claims expressed in this article are solely those of the authors and do not necessarily represent those of their affiliated organizations, or those of the publisher, the editors and the reviewers. Any product that may be evaluated in this article, or claim that may be made by its manufacturer, is not guaranteed or endorsed by the publisher.
The Supplementary Material for this article can be found online at: https://www.frontiersin.org/articles/10.3389/feart.2023.1033789/full#supplementary-material
Amaya, D. J., Miller, A. J., Xie, S.-P., and Kosaka, Y. (2020). Physical drivers of the summer 2019 North Pacific marine heatwave. Nat. Commun. 11, 1903. doi:10.1038/s41467-020-15820-w
Blackburn, M., Methven, J., and Roberts, N. (2008). Large-scale context for the UK floods in summer 2007. Weather 63, 280–288. doi:10.1002/wea.322
Branstator, G. (2002). Circumglobal teleconnections, the jet stream waveguide, and the North Atlantic Oscillation. J. Clim. 15, 1893–1910. doi:10.1175/1520-0442(2002)015<1893:cttjsw>2.0.co;2
Cai, W., Wu, L., Lengaigne, M., Li, T., McGregor, S., Kug, J.-S., et al. (2019). Pantropical climate interactions. Science 363, eaav4236. doi:10.1126/science.aav4236
Cassou, C., Terray, L., and Phillips, A. S. (2005). Tropical atlantic influence on European heat waves. J. Clim. 18, 2805–2811. doi:10.1175/JCLI3506.1
Chen, M., Xie, P., Janowiak, J. E., and Arkin, P. A. (2002). Global land precipitation: A 50-yr monthly analysis based on gauge observations. J. Hydrometeorol. 3, 249–266. doi:10.1175/1525-7541(2002)003<0249:glpaym>2.0.co;2
Deser, C., Simpson, I. R., McKinnon, K. A., and Phillips, A. S. (2017). The northern hemisphere extratropical atmospheric circulation response to ENSO: How well do we know it and how do we evaluate models accordingly? J. Clim. 30, 5059–5082. doi:10.1175/JCLI-D-16-0844.1
Ding, Q., and Wang, B. (2005). Circumglobal teleconnection in the northern hemisphere summer. J. Clim. 18, 3483–3505. doi:10.1175/JCLI3473.1
Ding, Q., Wang, B., Wallace, J. M., and Branstator, G. (2011). Tropical–extratropical teleconnections in boreal summer: Observed interannual variability. J. Clim. 24, 1878–1896. doi:10.1175/2011JCLI3621.1
Fosu, B., He, J., and Wang, S.-Y. S. (2020). The influence of wintertime SST variability in the Western North Pacific on ENSO diversity. Clim. Dyn. 54, 3641–3654. doi:10.1007/s00382-020-05193-7
Ham, Y.-G., Kug, J.-S., Park, J.-Y., and Jin, F.-F. (2013). Sea surface temperature in the north tropical Atlantic as a trigger for El Niño/Southern Oscillation events. Nat. Geosci. 6, 112–116. doi:10.1038/ngeo1686
Harris, I., Osborn, T. J., Jones, P., and Lister, D. (2020). Version 4 of the CRU TS monthly high-resolution gridded multivariate climate dataset. Sci. Data 7, 109. doi:10.1038/s41597-020-0453-3
Holland, P. R., Bracegirdle, T. J., Dutrieux, P., Jenkins, A., and Steig, E. J. (2019). West Antarctic ice loss influenced by internal climate variability and anthropogenic forcing. Nat. Geosci. 12, 718–724. doi:10.1038/s41561-019-0420-9
Hoskins, B. J., and Karoly, D. J. (1981). The steady linear response of a spherical atmosphere to thermal and orographic forcing. J. Atmos. Sci. 38, 1179–1196. doi:10.1175/1520-0469(1981)038<1179:TSLROA>2.0.CO;2
Hoskins, B. (2013). The potential for skill across the range of the seamless weather-climate prediction problem: A stimulus for our science. Q. J. R. Meteorol. Soc. 139, 573–584. doi:10.1002/qj.1991
Iwakiri, T., and Watanabe, M. (2021). Mechanisms linking multi-year La Niña with preceding strong El Niño. Sci. Rep. 11, 17465. doi:10.1038/s41598-021-96056-6
Jia, F., Wu, L., Gan, B., and Cai, W. (2016). Global warming attenuates the tropical atlantic-pacific teleconnection. Sci. Rep. 6, 20078. doi:10.1038/srep20078
Kalnay, E., Kanamitsu, M., Kistler, R., Collins, W., Deaven, D., Gandin, L., et al. (1996). The NCEP/NCAR 40-year reanalysis project. Bull. Am. Meteorol. Soc. 77, 437–471. doi:10.1175/1520-0477(1996)077<0437:TNYRP>2.0.CO;2
Kay, J. E., Deser, C., Phillips, A., Mai, A., Hannay, C., Strand, G., et al. (2015). The community Earth system model (CESM) large ensemble project: A community resource for studying climate change in the presence of internal climate variability. Bull. Am. Meteorol. Soc. 96, 1333–1349. doi:10.1175/bams-d-13-00255.1
Keenlyside, N. S., and Latif, M. (2007). Understanding equatorial atlantic interannual variability. J. Clim. 20, 131–142. doi:10.1175/JCLI3992.1
Latif, M., and Barnett, T. P. (1995). Interactions of the tropical oceans. J. Clim. 8, 952–964. doi:10.1175/1520-0442(1995)008<0952:IOTTO>2.0.CO;2
Lee, J.-Y., Wang, B., Seo, K.-H., Kug, J.-S., Choi, Y.-S., Kosaka, Y., et al. (2014). Future change of northern hemisphere summer tropical–extratropical teleconnection in CMIP5 models. J. Clim. 27, 3643–3664. doi:10.1175/JCLI-D-13-00261.1
Lu, Z., and Liu, Z. (2019). Orbital modulation of ENSO seasonal phase locking. Clim. Dyn. 52, 4329–4350. doi:10.1007/s00382-018-4382-1
Meehl, G. A., Hu, A., Castruccio, F., England, M. H., Bates, S. C., Danabasoglu, G., et al. (2021). Atlantic and Pacific tropics connected by mutually interactive decadal-timescale processes. Nat. Geosci. 14, 36–42. doi:10.1038/s41561-020-00669-x
Meinen, C. S., and McPhaden, M. J. (2000). Observations of warm water volume changes in the equatorial pacific and their relationship to El Niño and La Niña. J. Clim. 13, 3551–3559. doi:10.1175/1520-0442(2000)013<3551:OOWWVC>2.0.CO;2
O’Reilly, C. H., Woollings, T., Zanna, L., and Weisheimer, A. (2018). The impact of tropical precipitation on summertime euro-atlantic circulation via a circumglobal wave train. J. Clim. 31, 6481–6504. doi:10.1175/JCLI-D-17-0451.1
Saeed, S., Van Lipzig, N., Müller, W. A., Saeed, F., and Zanchettin, D. (2014). Influence of the circumglobal wave-train on European summer precipitation. Clim. Dyn. 43, 503–515. doi:10.1007/s00382-013-1871-0
Sardeshmukh, P. D., and Hoskins, B. J. (1988). The generation of global rotational flow by steady idealized tropical divergence. J. Atmos. Sci. 45, 1228–1251. doi:10.1175/1520-0469(1988)045<1228:TGOGRF>2.0.CO;2
Schneider, D. P., and Deser, C. (2018). Tropically driven and externally forced patterns of antarctic sea ice change: Reconciling observed and modeled trends. Clim. Dyn. 50, 4599–4618. doi:10.1007/s00382-017-3893-5
Screen, J. A., and Simmonds, I. (2014). Amplified mid-latitude planetary waves favour particular regional weather extremes. Nat. Clim. Chang. 4, 704–709. doi:10.1038/nclimate2271
Soulard, N., Lin, H., Derome, J., and Yu, B. (2021). Tropical forcing of the circumglobal teleconnection pattern in boreal winter. Clim. Dyn. 57, 865–877. doi:10.1007/s00382-021-05744-6
Straus, D. M., and Shukla, J. (2002). Does ENSO force the PNA? J. Clim. 15, 2340–2358. doi:10.1175/1520-0442(2002)015<2340:DEFTP>2.0.CO;2
Tan, X., Tang, Y., Lian, T., Yao, Z., Li, X., and Chen, D. (2020). A study of the effects of westerly wind bursts on ENSO based on CESM. Clim. Dyn. 54, 885–899. doi:10.1007/s00382-019-05034-2
Teng, H., Branstator, G., Wang, H., Meehl, G. A., and Washington, W. M. (2013). Probability of US heat waves affected by a subseasonal planetary wave pattern. Nat. Geosci. 6, 1056–1061. doi:10.1038/ngeo1988
Thompson, V., Dunstone, N. J., Scaife, A. A., Smith, D. M., Hardiman, S. C., Ren, H.-L., et al. (2019). Risk and dynamics of unprecedented hot months in South East China. Clim. Dyn. 52, 2585–2596. doi:10.1007/s00382-018-4281-5
Wallace, J. M., and Gutzler, D. S. (1981). Teleconnections in the geopotential height field during the northern hemisphere winter. Mon. Weather Rev. 109, 784–812. doi:10.1175/1520-0493(1981)109<0784:TITGHF>2.0.CO;2
Wang, C. (2019). Three-ocean interactions and climate variability: A review and perspective. Clim. Dyn. 53, 5119–5136. doi:10.1007/s00382-019-04930-x
Wang, L., Yu, J. Y., and Paek, H. (2017). Enhanced biennial variability in the Pacific due to Atlantic capacitor effect. Nat. Commun. 8, 14887. doi:10.1038/ncomms14887
Wang, S.-Y., Davies, R. E., and Gillies, R. R. (2013). Identification of extreme precipitation threat across midlatitude regions based on short-wave circulations. J. Geophys. Res. Atmos. 118 (11), 11,05974–11,074. doi:10.1002/jgrd.50841
Wills, R. C. J., White, R. H., and Levine, X. J. (2019). Northern hemisphere stationary waves in a changing climate. Curr. Clim. Chang. Rep. 5, 372–389. doi:10.1007/s40641-019-00147-6
Wolf, G., Brayshaw, D. J., Klingaman, N. P., and Czaja, A. (2018). Quasi-stationary waves and their impact on European weather and extreme events. Q. J. R. Meteorol. Soc. 144, 2431–2448. doi:10.1002/qj.3310
Wu, B., Lin, J., and Zhou, T. (2016). Interdecadal circumglobal teleconnection pattern during boreal summer. Atmos. Sci. Lett. 17, 446–452. doi:10.1002/asl.677
Wulff, C. O., Greatbatch, R. J., Domeisen, D. I. V., Gollan, G., and Hansen, F. (2017). Tropical forcing of the summer East atlantic pattern. Geophys. Res. Lett. 44. doi:10.1002/2017GL075493
Yang, D., Arblaster, J. M., Meehl, G. A., England, M. H., Lim, E.-P., Bates, S., et al. (2020). Role of tropical variability in driving decadal shifts in the southern hemisphere summertime eddy-driven jet. J. Clim. 33, 5445–5463. doi:10.1175/JCLI-D-19-0604.1
Yasui, S., and Watanabe, M. (2010). Forcing processes of the summertime circumglobal teleconnection pattern in a dry AGCM. J. Clim. 23, 2093–2114. doi:10.1175/2009JCLI3323.1
Yue, Z., Zhou, W., and Li, T. (2021). Impact of the Indian ocean dipole on evolution of the subsequent ENSO: Relative roles of dynamic and thermodynamic processes. J. Clim. 34, 3591–3607. doi:10.1175/JCLI-D-20-0487.1
Keywords: circumglobal teleconnection, tropical-extratropical teleconnection, pacemaker, Indian Ocean, El niño-Southern Oscillation, Rossby wave source
Citation: Lin Y-H, Fosu B and Ikuyajolu OJ (2023) The impact of tropical SST variability on the northern hemisphere circumglobal teleconnection pattern. Front. Earth Sci. 11:1033789. doi: 10.3389/feart.2023.1033789
Received: 31 August 2022; Accepted: 17 January 2023;
Published: 02 February 2023.
Edited by:
Xiaolin Zhang, University of Hamburg, GermanyReviewed by:
Zachary Freitag Johnson, Purdue University, United StatesCopyright © 2023 Lin, Fosu and Ikuyajolu. This is an open-access article distributed under the terms of the Creative Commons Attribution License (CC BY). The use, distribution or reproduction in other forums is permitted, provided the original author(s) and the copyright owner(s) are credited and that the original publication in this journal is cited, in accordance with accepted academic practice. No use, distribution or reproduction is permitted which does not comply with these terms.
*Correspondence: Boniface Fosu, Ym9uaWZhY2UuZm9zdUBtc3N0YXRlLmVkdQ==
Disclaimer: All claims expressed in this article are solely those of the authors and do not necessarily represent those of their affiliated organizations, or those of the publisher, the editors and the reviewers. Any product that may be evaluated in this article or claim that may be made by its manufacturer is not guaranteed or endorsed by the publisher.
Research integrity at Frontiers
Learn more about the work of our research integrity team to safeguard the quality of each article we publish.