
95% of researchers rate our articles as excellent or good
Learn more about the work of our research integrity team to safeguard the quality of each article we publish.
Find out more
ORIGINAL RESEARCH article
Front. Earth Sci. , 09 May 2023
Sec. Atmospheric Science
Volume 11 - 2023 | https://doi.org/10.3389/feart.2023.1027483
 Fernando Salas-Martínez1†Ofelia Andrea Valdés-Rodríguez1†
 Olivia Margarita Palacios-Wassenaar2*
 Aldo Márquez-Grajales3Leonardo Daniel Rodríguez-Hernández4
Introduction: Drought is a slow evolution phenomenon drastically affecting the environment and human activities. Nowadays, there are several indices to study drought. They can be based on in-site measurements of meteorological stations or remote perception data. However, Mexico’s number of functioning meteorological stations from the National Meteorological Service (NMS) is steadily decreasing. Nevertheless, the NMS reports drought conditions through the Mexican Drought Monitor (MDM), which uses different methods to estimate drought levels. These reports are provided every 15 days for each municipality. However, the methods the NMS utilizes are unknown to the general public. Thus, in-situ studies which try to estimate drought are limited by the MDM data constrictions. Consequently, remote perception is an alternative to solve the lack of stations and the MDM data restrictions, depending on the region. Therefore, this research aims to: 1) Develop a methodology to quantify drought intensity based on the Normalized Difference Drought Index (NDDI) with Landsat 8 multispectral images in the municipalities of the central zone of the Gulf of Mexico for drought and no drought periods. 2) Analyze and compare the NDDI behavior against the MDM from the NMS during the same periods.
Methods: The methodology consisted of estimating the NDDI by using Landsat 8 multispectral images. Further on, NDDI drought values were compared with the MDM.
Results: Results showed that NDDI values increase from July to October during a drought period, coinciding with months when precipitation is low, and temperature is high. Additionally, it was found that the NDDI coincides with the MDM data in 46% of the municipalities having drought conditions when temperatures increased 2.1°C and precipitations decreased by 668 mm. Furthermore, the NDDI coincided in 16% of the municipalities during no drought periods with the maximum increases in temperatures at 1.4°C and precipitation reduced by 386 mm.
Discussion: The NDDI estimated by Landsat 8 images can determine drought behavior in the study zone during periods with limited reduced precipitation and temperature increases.
The global concern about the environment’s vulnerability and human activities to climate phenomena has been the step to develop an international policy regarding climate change study and monitoring: the United Nations Framework Convention on Climate Change (UNFCCC), which in its Paris Agreement (2015), determined the importance of avoiding or minimizing loss and damage caused by extreme and slow-onset weather events related with climate change effects (United Nations, 2015). The same year, the United Nations structured the 2030 Agenda goals for Sustainable Development. The 2030 Agenda´s objective related to climate action is goal 13, which seeks to improve human and institutional capacity regarding education and awareness for mitigation, adaptation, reduction, and early warning of climate change (NU, 2015).
In recent years, a slow-onset phenomenon that has intensified its effects is drought. The Intergovernmental Panel on Climate Change (IPCC) defined drought as a “period of abnormally dry conditions for long enough to cause a serious hydrological imbalance” (Intergovernmental Panel of Climate Change, 2013). However, since the climatic conditions differ depending on the geographical location, defining a fixed period for such conditions is complicated. For example, Valiente (2001) describes that Indonesia defines 5 days without rain as drought, Great Britain considers at least 15 consecutive days with daily rainfall of less than 0.2 mm for defining the phenomenon, and Libya considers annual rainfall below 180 mm to define a dry period, among others. Around the world, impacts generated by the drought have been recorded on agriculture and livestock (Schmidhuber and Tubiello, 2007; Li et al., 2009; Nkedianye et al., 2011; Food and Agriculture Organization of the United Nations, 2018; Salas-Martínez et al., 2021a), electrical energy generation (Bartos and Chester, 2015), water distribution to the population (Iglesias et al., 2009), tourism (Thomas et al., 2013), vegetation stress, and soil degradation (Bai et al., 2008; Vicente-Serrano et al., 2013).
The drought phenomenon study methodologies are based on applying different indices. These indices can be classified into two groups: 1) using on-site measured meteorological information and 2) using remote sensing as an information source. The first group includes the Standardized Precipitation Index (SPI) (McKee et al., 1993), the Standardized Precipitation Evapotranspiration Index (SPEI) (Vicente-Serrano et al., 2010), the Palmer Drought Severity Index (PDSI) (Palmer, 1965), and the Percentage of Normal Precipitation (PNP) (Gibbs and Maher, 1967), among others. However, this type of indices is limited to the meteorological information available for each region. Therefore, its application can be complex without an efficient meteorological measurement network. For example, Latin American countries, like Mexico, are deficient in meteorological stations, and their measurements are often incomplete (SMN, 2010).
Among the indexes that do not use on-site measurements are: the Normalized Difference Vegetation Index (NDVI) (Tucker et al., 1986; Peters et al., 2002), the Vegetation Health Index (VHI) (Kogan et al., 2012), the Vegetation Condition Index (VCI) (Quiring and Ganesh, 2010), and the Normalized Difference Water Index (NDWI) (Gao, 1996; Wang et al., 2008). These indices use different information sources for their calculation. For example, Landsat 8 multispectral images (National Aeronautics and Space Administration, 2013; United States Geological Survey, 2021b) are a significant information source allowing regular monitoring of the phenomena under study (United States Geological Survey, 2021a). However, these images are available every 16 days.
Moreover, combining indices, such as the Normalized Difference Drought Index (NDDI), improves the analysis of drought’s behavior, distribution, and intensity (Gu et al., 2007). Therefore, NDDI has been applied worldwide, concluding that it is a complementary tool to determine drought behavior more efficiently compared to other methodologies (Mongkolsawat et al., 2009; Renza et al., 2010; Lee et al., 2016; Khampeera et al., 2018; Tavazohi and Ahmadi, 2018; Le Hung and Tuyen, 2019; Aksoy and Sertel, 2021; Dobri et al., 2021). However, in Mexico, the NDDI has not been applied to study the phenomenon of drought (Sedeño-Díaz and López-López, 2021).
The National Meteorological Service (NMS) is the Mexican organization for studying, monitoring, and describing drought behavior in this country. Fortnightly, the NMS reports a descriptive drought conditions map called the Mexican Drought Monitor (MDM), which is part of the North American Drought Monitor (NADM). NADM is a collaborative effort among Canada, Mexico, and the United States of America drought experts (Heim Jr, 2002; Lawrimore et al., 2002; Svoboda et al., 2002; Hadwen, 2009; National Centers for Environmental Information, 2022). MDM is based on the indices such as SPI, VHI, and NDVI, as well as rainfall anomalies, humidity model outputs, mean temperature, the water level in dams, and the opinion of local experts based on their personal experiences (SMN, 2020). The MDM information is used by institutions such as the National Center for Disasters Prevention (CENAPRED), which issues Emergency Declarations for Natural Disasters (EDND) when a municipality is affected by a meteorological phenomenon such as drought. Consequently, after the EDND emission, they can request a subsidy from the Federal Government to mitigate the phenomenon effects (CENAPRED, 2017). The subsidy acceptance depends on each municipality’s institutional and public management capacity (Lagunes-Gómez et al., 2022).
For example, significant drought effects were reported in México in 2019. The state of Veracruz was one of the most affected, with a historical record of 75 EDND in that year (CENAPRED, 2017). In addition, the Gulf of Mexico central zone mainly presents a high vulnerability to drought, reporting frequent losses in crops such as corn, sugar cane, and cattle, among others (Gobierno del Estado de Veracruz, 2019; SPC, 2020; Salas-Martínez et al., 2021a; b).
On-site measurements allow the description of the local climate conditions needed to characterize meteorological phenomena. However, the number of meteorological stations operating in Mexico is decreasing (Luna-Díaz-Peón and Valdés-Rodríguez, 2019) and the MDM’s methodology includes on-site measurements. Therefore, there is a need to incorporate remote sensing methods (satellite images) to study the drought. These images combine information on vegetation conditions and humidity distribution. As a result, our research objectives are 1) to develop a methodology to quantify the drought intensity from the NDDI index using Landsat 8 multispectral images in the Gulf of Mexico central zone in periods with and without drought presence; and 2) to analyze and compare the NDDI behavior against the NMS’ MDM during the same periods.
The region under study is located between the geographic coordinates 18.6° and 20.1° N and 97.4° and 96.1° W. It has an area of 8,604.55 km2 and is situated in the central region of the Gulf of Mexico. The region is characterized by devoting more than 80% of its surface to agricultural or livestock activities, which are strongly affected by the drought phenomenon (SEFIPLAN, 2013a; SEFIPLAN, 2013b; SEFIPLAN, 2013c; Gobierno del Estado de Veracruz, 2019). Furthermore, this region contains 37 municipalities of the Veracruz state (Instituto Nacional de Estadítica y Geografía, 2021), which were strongly affected by drought in 2019.
Therefore, this area was selected because it presents the most significant number of EDND by drought (Figure 1). Moreover, the analysis carried out by Salas-Martínez et al. (2021b) found that in this zone, the municipalities reported four EDND in five different years, where the drought effects have been demonstrated. Finally, the government of Veracruz State determined a higher vulnerability in the region because of this phenomenon. Supplementary Annex S1 describes these characteristics in detail.
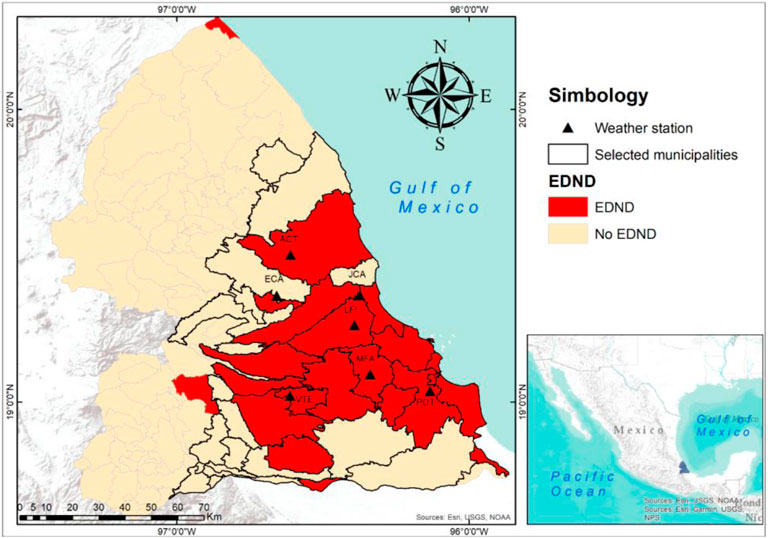
FIGURE 1. Studied region. The black outlines indicate the 37 selected municipalities in the central Gulf of Mexico. In Supplementary Annex S2, the description of each station is provided (SMN, 2010).
Various climate types characterize the interest area, ranging from warm, humid, subhumid, and semi-warm humid (García, 2004). This classification is a climate adaptation to the Köppen classification system for the particular conditions of Mexico, which were verified by meteorological data and several vegetal associations. Most selected municipalities have a warm subhumid climate (Figure 2A). These municipalities’ entire surface is used for productive activities, such as rainfed agriculture, irrigated agriculture, pastures, rainfed vegetation, and human settlements (Instituto Nacional de Estadítica y Geografía, 2021) (Figure 2B).
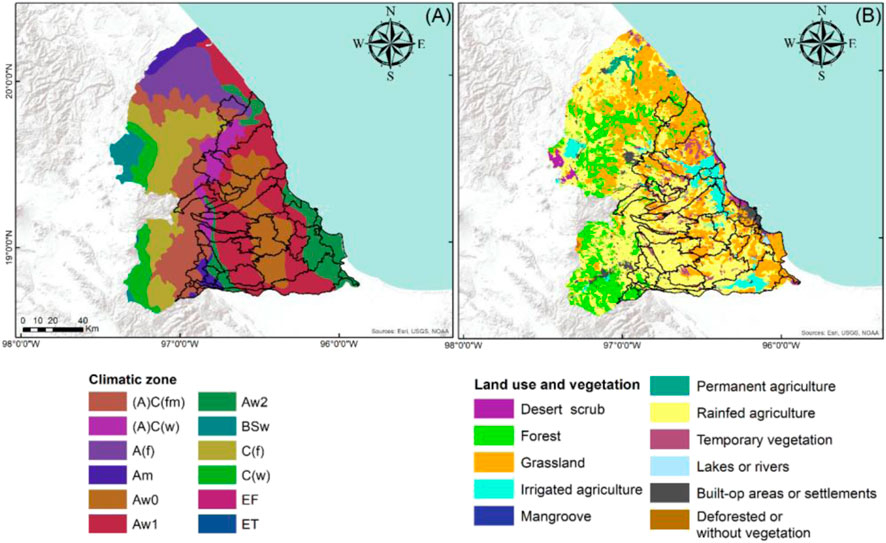
FIGURE 2. Climate zones and land uses in the studied region. (A) Climate. The climate types are (A)C(fm) = Semi-warm humid, (A)C(w) = Semi-warn subhumid, A(f) = Warm humid with rains the whole year, Am = Warm humid with rains in the summer, Aw0= the driest Warm subhumid, Aw1 = middle Warm subhumid, Aw2 = the most humid Warm subhumid, BSw = Semidry with rains in the summer, C(f) = Temperate humid with rains the whole year, C(w) = Temperate humid with rains in the summer, EF = very cold and ET = cold (García, 2004). (B) Land uses and vegetation (Instituto Nacional de Estadítica y Geografía, 2021). The black outline indicates the municipalities selected for the study.
The Normalized Difference Drought Index (NDDI) was created by Gu et al. (2007) and his collaborators in 2007. The primary objective of creating this index was to develop a tool capable of capturing the behavior and intensity of the drought, combining more than one index to study the phenomenon. For this purpose, the NDVI and NDWI indices were selected. The NDDI values are handled on a scale between −1 and 1, where negative values indicate clouds or the presence of water, while positive values close to 1 indicate more intense drought conditions. Several authors have used various scales to measure drought (Renza et al., 2010; Khampeera et al., 2018; Le Hung and Tuyen, 2019; Paniagua et al., 2020; Aksoy and Sertel, 2021; Dobri et al., 2021). However, for the practical purposes of our study, the drought scale described by Paniagua and his collaborators (Paniagua et al., 2020) was used because they analyzed a region with similar conditions to ours and used the same levels as the MDM, facilitating the information comparison. This scale contains six categories: four for drought levels, one for describing the abnormal condition, and waterbodies/no drought. Table 1 shows the drought levels and the NDDI intervals used in this research.
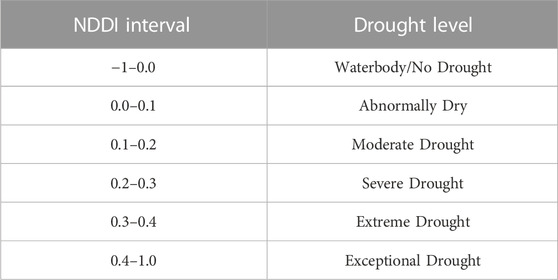
TABLE 1. Proposed NDDI intervals and their equivalent drought levels. This information was taken from Paniagua et al. (2020).
NDDI calculation is performed by combining the NDVI and NDWI values. First, NDVI is calculated using Eq. 1, where
NDWI is calculated by Eq. 2, where
Finally, Eq. 3 expresses the NDDI calculation. NDDI values also range from −1 to 1.
Temperature and precipitation variables were used because both are suitable for describing drought conditions (Stahle et al., 2009; Méndez and Magaña, 2010). The information was obtained from seven meteorological stations of the NMS network (SMN, 2010) located in the interest region. The period comprised from 1980 to 2019. Moreover, only data meeting the following conditions were used.
A) The station was situated within the interest region.
B) The station provided daily records for temperature and precipitation during at least 80% of the analysis period, a percentage suggested by the World Meteorological Organization (WMO) (World Meteorological Organization, 2018).
Supplementary Annex S2 describes the seven stations meeting these conditions. Black triangles represent the location of these stations in Figure 1.
Since 1975, the National Aeronautics and Space Administration (NASA) and the United States Geological Survey (USGS) of the United States of America have incorporated various satellites for monitoring the Earth’s surface called Landsat (Land: Earth and sat: satellite). By February 2013, its eighth version (Landsat 8) was implemented. This one belongs to the “Landsat Data Continuity Mission” (LDCM) program (National Aeronautics and Space Administration, 2013; Corrales-Andino and Ochoa-López, 2016; United States Geological Survey, 2021b).
Landsat 8’s image innovation involves incorporating more sensors, such as the Operational Land Imager (OLI) and the Thermal Infrared Sensor (TIRS). The characteristics presented by the Landsat 8 images are spatial resolutions of 15 m and multispectral resolutions of 30 m along a 185 km strip. Furthermore, the satellite revolves around the Earth in a nearly sun-synchronous polar orbit, reaching an altitude of 705 km and completing one rotation every 99 min, with a repetition cycle of 16 days. Due to the above characteristics, we selected Landsat 8 for our study (National Aeronautics and Space Administration, 2013; Corrales-Andino and Ochoa-López, 2016; United States Geological Survey, 2021b).
The interest region size (8,604.55 km2) and eleven vegetation types required satellite information with a high spatial resolution. Therefore, one Landsat 8 OLI/TIRS C1 Level-1 image was selected by every 16 days. This group of images contains ground data with the highest quality and precision, suitable for time series analysis because of their lower precision error (United States Geological Survey, 2018). The Landsat 8 images are freely available for download from the United States Geological Survey (USGS) EarthExplorer (United States Geological Survey, 2021a). In this research, the images from the years 2018 and 2019 were used because no drought effects were reported in 2018; but drought was present in 2019. Therefore, analyzing these 2 years will allow exploring the NDDI behavior under both conditions.
As aforementioned, the NMS is the Mexican Government entity responsible for studying and monitoring the impact of drought (SMN, 2020). In addition, the MDM fortnightly performs drought monitoring at the municipal level in the overall country (SMN, 2020). The collected data from MDM are labeled regarding the drought intensity based on its effects on human activities and the environment. Furthermore, the information provided by the MDM is available for consultation on its official page (SMN, 2020). The MDM’s classification and drought intensity levels are presented in Table 2.
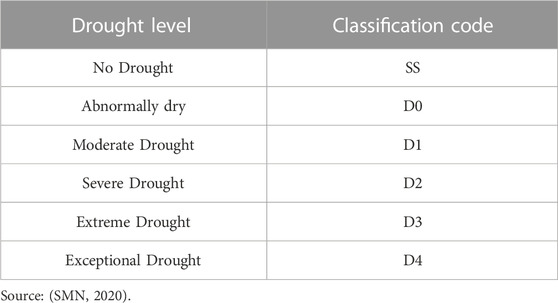
TABLE 2. Classification and intensity levels of drought defined by the MDM.
Landsat 8 images were used for each fortnight during 2018 and 2019 to calculate the NDDI values. The employed procedure is described below.
1. NDVI was calculated according to Eq. 1.
2. NDWI was calculated regarding Eq. 2.
3. The information generated in steps (1) and (2) was transformed into a TIFF format for manipulation.
4. Once the data in step (3) was obtained, the NDDI was calculated based on Eq. 3.
5. The proposed intervals for each NDDI drought level are described in Table 1.
It is essential to mention that NDDI cannot be calculated if the images present a cloud cover greater than 20% because the cloud cover interference would cause an erroneous description of drought conditions. The image information was processed using the ArcGIS geographic information system version 10.8 of the Environmental Systems Research Institute (ESRI) (ESRI, 2018).
In order to compare the NDDI and MDM results, we proposed a New Numerical Drought Assignment (NNDA) by combining the NDDI intervals and the MDM classification. The NNDA values range from 0 to 5. Table 3 shows this assignment.
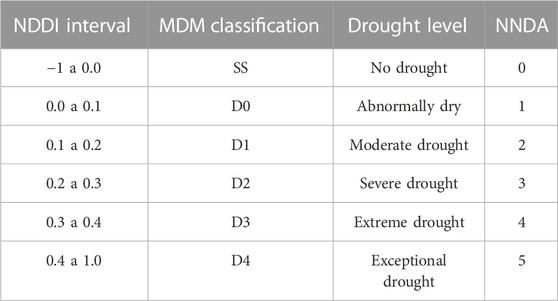
TABLE 3. NNDA description for NDDI and MDM values.
A unique NNDA value was assigned to each municipality because the NDDI information is distributed by pixels and not by municipal boundaries. This value was given by making a frequency table of each pixel by its corresponding NNDA value. The NNDA value with the highest frequency was taken as the municipality value because this way we can highlight the extreme values. It is essential to highlight that, within the processing of the pixels, these must be converted to polygons to handle the information adequately. Such polygons are formed with several contiguous pixels of the same NNDA. However, if a polygon is located among two municipalities, the pixels corresponding to each municipality are counted; that is, a proportional count is made depending on the polygon size covering each municipality. Figure 3 describes the NNDA assignation process for each municipality.
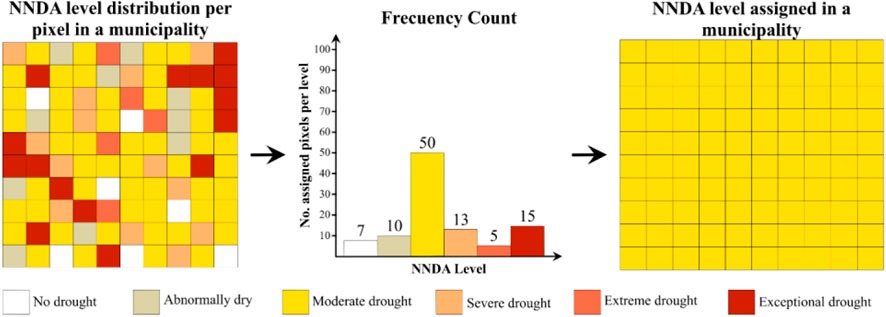
FIGURE 3. NNDA value assignation criteria for each municipality in the studied region. The assigned NNDA value was the one with the highest frequency.
Once the NNDA value assignment was made, it was compared against the MDM results for each fortnight of 2018 and 2019.
A Mann-Whitney U statistical test was applied to compare data from each year, with a confidence level of 95%, because the data showed non-parametric behavior (Saldaña, 2013; Sánchez, 2015). Figure 4 presents a diagram of the methodological process proposed for this study.
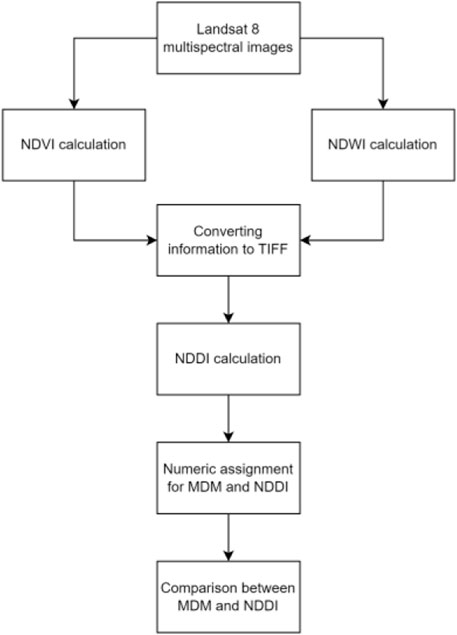
FIGURE 4. Methodological process diagram performed in this work.
Figure 5 describes the monthly temperature behavior and precipitation anomalies between the long-term mean climatology (1980-2019) and 2018 and 2019. In 2019 (Figure 5B), positive temperature anomalies were obtained except for April, when a negative anomaly was obtained. Positive anomalies ranged from +3% to +11% compared to the long-term mean climatology for each month. These positive anomalies expressed monthly increases of between +0.5°C and +2.1°C. Moreover, in 2019, 10 months registered higher values outside the 25% and 75% quartiles, indicating that the temperature values were further from the mean in that year. On the contrary, April registered a negative anomaly of −16% (−0.5°C) and reported the lowest temperature compared to the long-term mean climatology. In the case of 2018 (Figure 5A), 7 months recorded positive temperature anomalies ranging from +2% to +7%, which translates into temperature increases of between +0.1°C and +1.4°C. Meanwhile, 5 months registered negative anomalies of −2% to −4% (reductions between −0.1°C and −0.7°C). It is essential to mention that only 4 months registered higher temperature values outside the 25% and 75% quartiles, indicating that the temperature values for 2018 were close to the average. In summary, 2019 was the warmest year compared to 2018 and the long-term mean climatology.
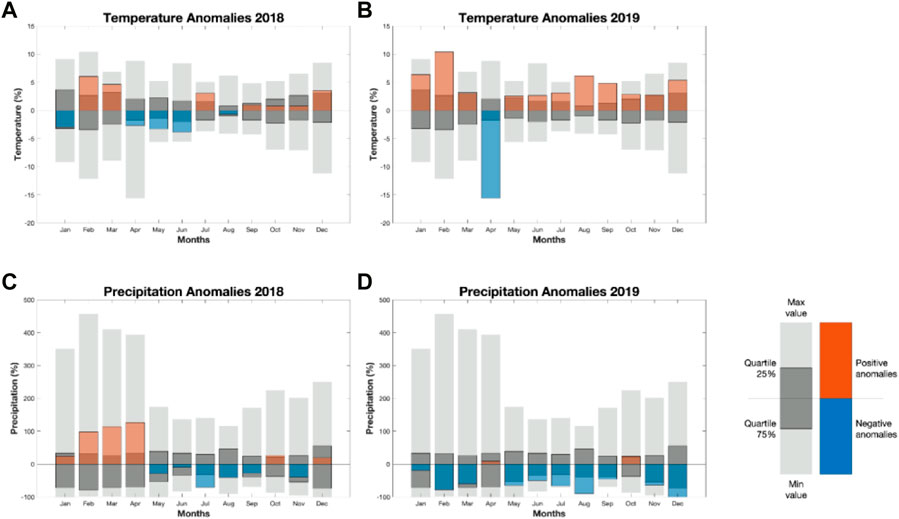
FIGURE 5. Monthly anomalies behavior for temperature and precipitation between long-term mean climatology and 2018 and 2019. (A) represents Anomalies Temperatures in 2018, (B) represents Anomalies Temperatures in 2019, (C) represents precipitation anomalies in 2018, y (D) represents precipitation anomalies in 2019.
Regarding precipitation, in 2018, 6 months were recorded with positive monthly anomalies ranging from +20% to +120%, contrary to negative monthly anomalies reported between −10% and −70% compared to long-term mean climatology. It is essential to mention that 7 months obtained precipitation values between the 25% and 75% quartiles (Figure 5C). This year, a reduction in annual precipitation of −386.6 mm per year was registered compared to the long-term mean climatology (−36% of annual rainfall). In the case of 2019 (Figure 5D), 10 months recorded rainfall with negative monthly anomalies ranging from −20% to −100%. Only April and October present positive anomalies of +10 and +25%, respectively. Negative anomalies translate into a reduction in annual precipitation of −668.7 mm per year (−62% of annual rainfall) compared to mean climatology.
Concerning the values of the 25% and 75% quartiles, May to September, November, and December registered values outside these quartiles, indicating that they have values that are further from the mean. On the other hand, the positive anomalies are within the reference quartiles, indicating that the increases are close to the average. In summary, 2019 presented the highest values of negative anomalies in 83% of the year, which is why EDND was introduced this year due to drought.
Figure 6 shows the NNDA behavior in the evaluated municipalities. The no drought condition (NNDA=0) in 2018 (blue line) occurred in seven localities. However, only two localities were observed for 2019 (orange line) with no drought conditions (Figure 6A).
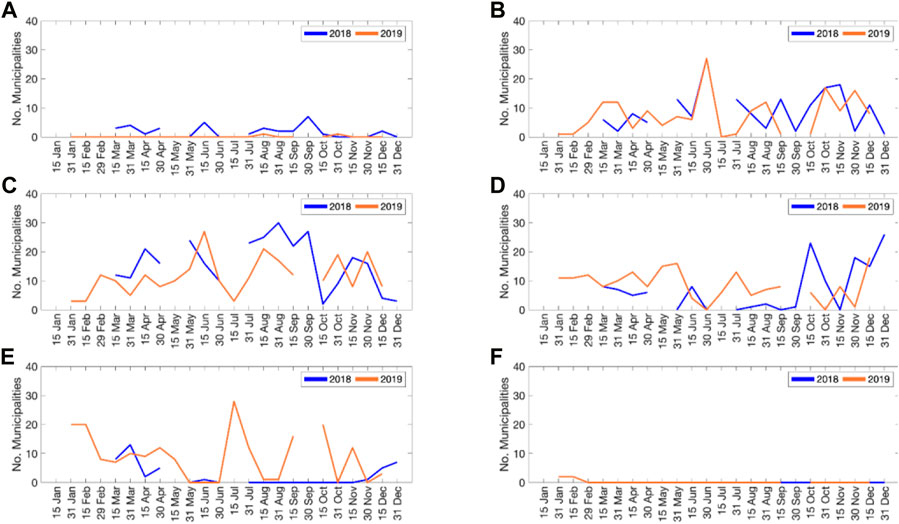
FIGURE 6. Number of municipalities per NNDA value. (A) NNDA = 0, (B) NNDA = 1, (C) NNDA = 2, (D) NNDA = 3, (E) NNDA = 4; and (F) NNDA = 5. The blue lines represent the year without drought reports (2018), and the orange lines the year with drought reports (2019).
On the other hand, the abnormally dry condition (NNDA = 1) occurred in more municipalities in 2019 than in 2018, exceeding by 25 municipalities in June. One essential aspect to highlight is that 2018 presented the most significant number of locations affected by drought at this level from July to November, reporting 20 events (Figure 6B).
A considerable increase in the number of municipalities (30) presented moderate drought (NNDA = 2) in both years, 2018 and 2019. Moreover, the maximum number at this level was concentrated between June and September (Figure 6C).
Furthermore, the highest incidents of severe drought conditions (NNDA = 3) were reported from October to December in 2018, while in 2019, they occurred from January to May and December (Figure 6D).
The extreme drought condition (NNDA = 4) increased to 30 municipalities in July 2019, maintaining this behavior during the last semester of this year, with the most significant number of locations affected under this condition. However, contrary to what occurred in 2019, during 2018, NNDA cases occurred in less than 15 municipalities in March, April, June, and December (Figure 6E).
The exceptional drought level (NNDA = 5) was only recorded in January and February 2019, with zero precipitation in February (Figure 6F). As a result, the highest number of municipalities with a relevant drought presence (NNDA between 2 and 5) occurred from June to December 2019. In summary, 2019 was a year with substantial drought effects reporting the highest NNDA values in the study region.
Figure 7 describes the NNDA average behavior reported in the MDM and NDDI for each fortnight. In 2018, the MDM did not report drought conditions from January to June, nor for November and December (Figure 7A). However, NDDI reported levels 1–3 of NNDA in those same months. Furthermore, the MDM reported an increase in drought conditions in the year’s second half, coinciding from August to October with the NDDI. It is essential to mention that the maximum NDDI values occurred in March and December, reporting an average NNDA value of 2 in 2018.
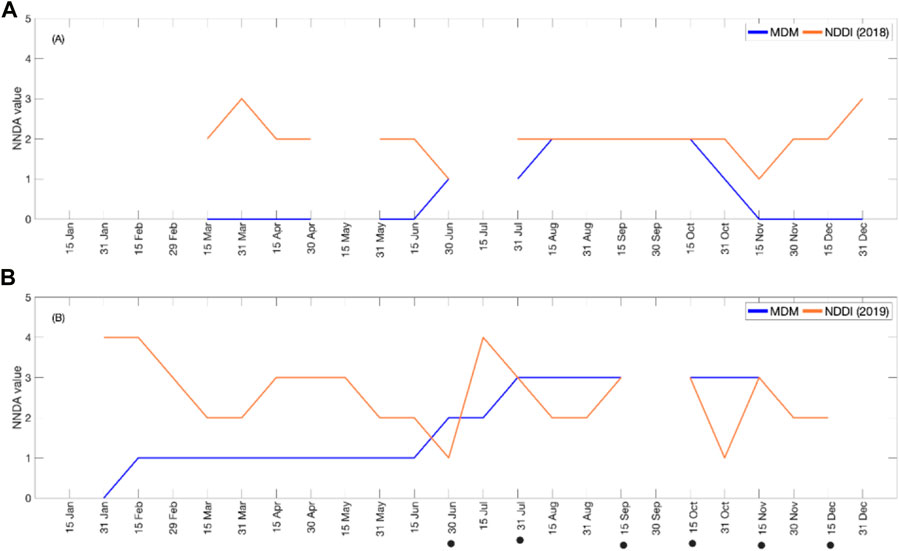
FIGURE 7. NNDA average value comparison between MDM and NDDI by analysis period. (A) Represents 2018 and (B) represents 2019. The black dots indicate the periods with no significant statistical difference (p>0.05) between the MDM and the NDDI.
Regarding 2019 (Figure 7B), the MDM reported that, from February to June, abnormally dry conditions took place (NNDA = 1). Subsequently, the drought levels increased, reaching NNDA values of 3 (severe drought). Moreover, the NDDI indicates extreme drought occurred in January and February, reporting the same value in July. For the second semester of the year, the NDDI behavior indicates conditions ranging from 1 to 4, coinciding with the MDM in September, October, and November. Besides, the Mann-Whitney U test revealed no significant difference between MDM and NDDI in the second half of 2019. This situation was not reported in 2018 when no year’s fortnight presented this condition.
Figure 8 describes the NNDA behavior for each municipality between MDN and NDDI. For 2018, the MSN reported an average of abnormally dry conditions (NNDA = 1) throughout the year, while the NDDI indicated more pronounced drought conditions (NNDA 1–3). A coincidence of 16% (six municipalities) of the total municipalities is shown for the NNDA values between MDM and NDDI. It is essential to mention that the NDDI values were equal to or higher than the MDM values in all the municipalities for this year. Concerning the U Mann-Whitney statistical test, 14% of the locations do not present a significant difference (Figure 8A).
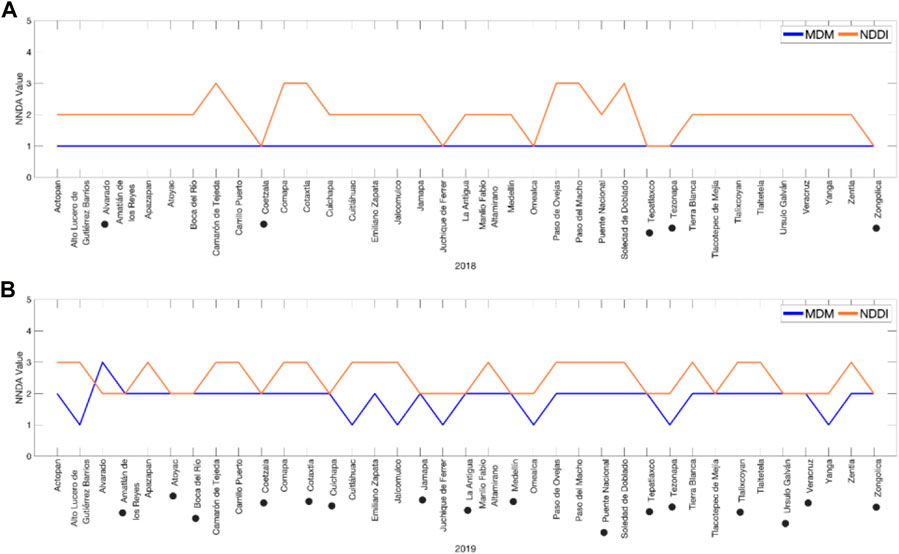
FIGURE 8. NNDA average values comparison of MDM and NDDI by municipalities. (A) 2018 and (B) 2019. The black dots indicate the municipalities with no significant statistical difference (p>0.05) between the MDM and the NDDI.
On the other hand, for 2019, the MDM reported an average drought behavior ranging from 1 to 2 in NNDA values, except in the Alvarado municipality, where an average value of 3 occurred. Regarding the NDDI, NNDA values were reported between 2 and 3 in all the locations. A coincidence of 38%, 14 of the municipalities, is shown for the NNDA values in MDM and in NDDI. It is essential to highlight that the only time MDM’s value was greater than NDDI in NNDA was in the Alvarado municipality for 2019. Regarding the U Mann-Whitney statistical test, 46% of the places did not present a significant difference. In summary, NDDI achieves to capture the difference between a year with drought conditions (2019) and a year without drought (2018) (Figure 8B).
Results indicate that in this study, in 2019, the temperature in the region rose +2.1°C from 1980 to 2019. This data is congruent with increments reported previously in the studied region (Salas-Martínez et al., 2021a). Several authors agree with temperature increments, reporting temperature increases between +3 and +11°C in the first decades of the 21st century in the Mexican territory (Santillán-Espinoza et al., 2011; García-Cueto et al., 2014; Ruiz-Corral et al., 2016; Navarro-Estupiñan et al., 2018; Cuervo-Robayo et al., 2020). Temperature increases are related to vegetation cover reduction provoked by human activities. As a result, the cooling by evapotranspiration is reduced, with a consequent increment in the sensible and latent heat flux (Englehart and Douglas, 2005; Stahle et al., 2009; Salas-Martínez et al., 2020). Remarkably, more than 80% of the studied region’s surface is used for irrigated and rainfed agriculture, pastures, vegetation, and human settlements (Figure 2B), causing the abovementioned situation.
On the other hand, as we know, temperature increases are closely related to drought behavior since the heating on the surface generates drier conditions derived from changes in the surface humidity and in the atmosphere. For this reason, an increase in temperature may translate into an increase in drought conditions (Stahle et al., 2009; Spinoni et al., 2019; Del-Toro-Guerrero and Kretzschmar, 2020).
Regarding precipitation, an annual rain reduction of 386.6 (36%) and 668.7 mm (62%) was found for the years 2018 and 2019, respectively. Consequently, the year 2019 presented more pronounced drought conditions. In general, the decrease in precipitation is a consequence of anthropogenic activities and changes in vegetation cover (Seager et al., 2009; Wehner et al., 2011; Cook et al., 2015; Touma et al., 2015; Spinoni et al., 2020). Furthermore, changes in climate systems have shown negative trends in precipitation volumes and positive trends in environmental temperatures in Mexico, generating an intensification of the drought conditions (Alexander et al., 2006; Li et al., 2009; Tabari and Talaee, 2011; Salman et al., 2017; Del-Toro-Guerrero and Kretzschmar, 2020).
Results show that most municipalities with more severe drought conditions (NNDA between 3 and 5) occurred in 2019, while NNDA values 1 and 2 occurred more frequently in 2018. This behavior helps us to conclude that the NNDA can capture years with severe drought effects.
Maximum rainfall in summer (June to October) is determined by the prevailing warm subhumid climate in the studied region (SMN, 2010; Instituto Nacional de Estadítica y Geografía, 2021). Moreover, the absence of precipitation in these months favored a severe drought (Englehart and Douglas, 2005; Stahle et al., 2009; Méndez and Magaña, 2010; Wehner et al., 2011). This behavior was observed from June to October 2019, when the municipalities with high NNDA values (3–5) were more frequent, coinciding with a precipitation reduction of more than 570 mm (38% or more) in those months.
Results show that 2019 NDDI values were higher than 2018 NDDI values. Additionally, NDDI and MDN coincide from June to October, when the maximum precipitation reduction occurred compared with the long-term mean climatology (1980-2019). Furthermore, the statistical test shows no significant difference between the NDDI and MDN values from June to December, concluding that a better approximation among these values was observed in the year’s second half.
Since land use in the studied region is mainly dedicated to agricultural practices, NDDI can help to capture the drought behavior in these areas, according to several authors (Khampeera et al., 2018; Le Hung and Tuyen, 2019; Dobri et al., 2021). This region has two periods of agricultural production, called Spring-Summer (April to September) and Autumn-Winter (October to December and January to March) (Secretaría de Agricultura Ganadería Desarrollo Rural Pesca y Alimentación, 2010; Secretaria de Agricultura y Desarrollo Rural, 2017; Servicio de Información Agroalimentaria y Pesquera, 2020). The first period ends in March, when the existing vegetation in the interest region is removed to start a new cycle, generating an increase in NNDA values in 2018. The same behavior occurred in April 2019, when the planting of the new production cycle began, as well as considerable reductions in precipitation for January and February were observed. This situation caused high NNDA values derived from the NDDI calculation method, which includes the vegetation characteristics through the NDVI values (Tucker et al., 1986; Peters et al., 2002) and the existing humidity through the NDWI (Gao, 1996; Wang et al., 2008). Harvesting and subsequent planting activities on these surfaces altered the NDVI and NDWI values, thereby obtaining high NDDI values indicating more severe drought conditions.
Regarding the results per municipality, the NDDI and MDM values matched in 38% of the considered places (14 municipalities) for 2019, in contrast to 2018, when the coincidence was lower, with 16% (six municipalities). However, the NDDI and MDM values in 46% of the municipalities analyzed in 2019 and only 14% for 2018 did not present significant statistical differences. This behavior is a consequence of the ability of NDDI to describe the conditions and drought intensity in years where precipitation reductions occur in the wet period of the year (June-October). Furthermore, when the decrements happen in another period of the year, the NDDI reflects drought conditions less accurately (Khampeera et al., 2018; Dobri et al., 2021).
Drought is a slow-onset phenomenon; thus, its effects are not immediate. For this reason, quantifying its intensity and describing its behavior is a complex task compared to other natural phenomena. In this work, we conclude that the NDDI calculated with Landsat 8 images is a powerful indicator for monitoring and quantifying drought in the interest region, where periods with lower precipitation and higher environmental temperature occur. However, NDDI is useless when satellite images present an excess of clouds or when drastic changes in vegetation cover occur. NDDI shows a more significant similarity with the MDM from June to October in years when precipitation registered reductions of 500 mm (32%) compared to the climate normals. Likewise, NDDI detects higher drought levels when the temperature increases to +2.1°C compared to the long-term mean climatology (1980-2019). When there are no significant differences, the maximum coincidence percentage between the MDM and NDDI is 46%. Finally, it is essential to note that in the central Gulf of Mexico, the NDDI presented higher values in agricultural areas with two production periods, in which the characteristics of the vegetation and soil moisture are constantly modified by harvesting and planting, a situation, that is, important to consider in the use of the NDDI. Therefore, NDDI can be used as an auxiliary tool for the MDM in the drought behavior description when agricultural lands are covered by vegetation; otherwise, it may not provide accurate results due to the bare soils caused by the tillage activities. In particular, NDDI can be used as a complement in regions where the climate information is not updated, as in the studied region.
NDDI calculation with another type of satellite images with high resolution and available in our interest region, or intercomparison with VHI, VCI, among other indices, should be explored for future works, which could also serve to understand the phenomenon in question.
The raw data supporting the conclusion of this article will be made available by the authors, without undue reservation.
Conceptualization FS-M, OV-R; methodology FS-M, OV-R, OP-W, AM-G, and LR-H; formal analysis FS-M, OV-R, OP-W, and AM-G; investigation FS-M; writing—original draft preparation FS-M; Writing—review and editing OV-R, OP-W, and AM-G; visualization AM-G; supervision OV-R, OP-W. All authors have read and agreed to the published version of the manuscript.
National Council of Sciences and Technology (CONACYT) and the scholarship number 782922.
The authors declare that the research was conducted in the absence of any commercial or financial relationships that could be construed as a potential conflict of interest.
The reviewers JLVA and SA declared a shared affiliation with the author AMG to the handling editor at the time of review.
All claims expressed in this article are solely those of the authors and do not necessarily represent those of their affiliated organizations, or those of the publisher, the editors and the reviewers. Any product that may be evaluated in this article, or claim that may be made by its manufacturer, is not guaranteed or endorsed by the publisher.
The Supplementary Material for this article can be found online at: https://www.frontiersin.org/articles/10.3389/feart.2023.1027483/full#supplementary-material
Aksoy, S., and Sertel, E. (2021). “Comparison of drought monitoring indices derived from MODIS and CHIRPS data using google earth engine,” in 9th Global Conference on Global Warming (GCGW-2021), Croatia, August 1-4, 2021.
Alexander, L. V., Zhang, X., Peterson, T. C., Caesar, J., Gleason, B., Klein Tank, A., et al. (2006). Global observed changes in daily climate extremes of temperature and precipitation. J. Geophys. Res. Atmos. 111 (D5), D05109–D05122. doi:10.1029/2005JD006290
Bai, Z. G., Dent, D. L., Olsson, L., and Schaepman, M. E. (2008). Proxy global assessment of land degradation. Soil use Manag. 24 (3), 223–234. doi:10.1111/j.1475-2743.2008.00169.x
Bartos, M. D., and Chester, M. V. (2015). Impacts of climate change on electric power supply in the Western United States. Nat. Clim. Change 5 (8), 748–752. doi:10.1038/nclimate2648
CENAPRED (2017). Declaratorias sobre emergencia, desastres y contingencias climatológicas a nivel municipal entre 2000 y 2019. [Online]. México. Available: https://datos.gob.mx/busca/dataset/declaratorias-sobre-emergencia-desastre-y-contingencia-climatologica (Accessed October, 2020).
Cook, B. I., Ault, T. R., and Smerdon, J. E. (2015). Unprecedented 21st century drought risk in the American southwest and central plains. Sci. Adv. 1 (1), e1400082. doi:10.1126/sciadv.1400082
Corrales-Andino, R. E., and Ochoa-López, V. L. (2016). Cálculo de reflectancia en imágenes Landsat OLI-8, sobre la región central de Honduras, mediante software libre SEXTANTE. Ciencias Espac. 9 (1), 81–96. doi:10.5377/ce.v9i1.3127
Cuervo-Robayo, A. P., Ureta, C., Gómez-Albores, M. A., Meneses-Mosquera, A. K., Téllez-Valdés, O., and Martínez-Meyer, E. (2020). One hundred years of climate change in Mexico. Plos one 15 (7), e0209808–e0209819. doi:10.1371/journal.pone.0209808
Del-Toro-Guerrero, F. J., and Kretzschmar, T. (2020). Precipitation-temperature variability and drought episodes in northwest Baja California, México. J. Hydrology Regional Stud. 27, 100653. doi:10.1016/j.ejrh.2019.100653
Dobri, R.-V., Sfîcă, L., Amihăesei, V.-A., Apostol, L., and Țîmpu, S. (2021). Drought extent and severity on arable lands in Romania derived from normalized difference drought index (2001–2020). Remote Sens. Environ. 13 (8), 1478. doi:10.3390/rs13081478
Englehart, P. J., and Douglas, A. V. (2005). Changing behavior in the diurnal range of surface air temperatures over Mexico. Geophys. Res. Lett. 32 (1), 1–4. doi:10.1029/2004GL021139
ESRI (2018). Plataforma ArcGIS. [Online]. United States of America. Available: https://www.sigsa.info/productos/esri/plataforma-arcgis (Accessed).
Food and Agriculture Organization of the United Nations (2018). The impact of disasters and crises on agriculture and food security. Rome, Italy: FAO.
Gao, B.-C. (1996). NDWI—a normalized difference water index for remote sensing of vegetation liquid water from space. Remote Sens. Environ. 58 (3), 257–266. doi:10.1016/S0034-4257(96)00067-3
García, E. (2004). Modificaciones al sistema de clasificación climática de Köppen. de México: Universidad Nacional Autónoma.
García-Cueto, O. R., Cavazos, M. T., de Grau, P., and Santillán-Soto, N. (2014). Analysis and modeling of extreme temperatures in several cities in northwestern Mexico under climate change conditions. Theor. Appl. Climatol. 116 (1), 211–225. doi:10.1007/s00704-013-0933-x
Gibbs, W. J., and Maher, J. V. (1967). Rainfall deciles as drought indicators. Melbourne: Bureau of Meteorology.
Gobierno del Estado de Veracruz, G. O. E. V. (2019). Plan Veracruzano de Desarrollo 2019-2024 Veracruz. México: Gobierno del Estado de Veracruz.
Gu, Y., Brown, J. F., Verdin, J. P., and Wardlow, B. (2007). A five-year analysis of MODIS NDVI and NDWI for grassland drought assessment over the central Great Plains of the United States. Geophys. Res. Lett. 34 (6), 064077–L6416. doi:10.1029/2006GL029127
Hadwen, T. (2009). “The North American drought monitor. History, approach and benefits,” in Workshop caribbean Institute for meteorology and hydrology (Barbados: Agriculture and Agri-Food Canada).
Heim, R. R. (2002). A review of twentieth-century drought indices used in the United States. Bull. Am. Meteorological Soc. 83 (8), 1149–1166. doi:10.1175/1520-0477-83.8.1149
Iglesias, A., Garrote, L., Cancelliere, A., Cubillo, F., and Wilhite, D. A. (2009). Coping with drought risk in agriculture and water supply systems: Drought management and policy development in the Mediterranean. Springer Science & Business Media.
Instituto Nacional de Estadítica y Geografía (2021). [Online]. México. Available: https://www.inegi.org.mx/app/mapas/(Accessed July, 2021).
Intergovernmental Panel of Climate Change (2013). Glosario. Nueva York, Estados Unidos de América: Cambridge University Press.
Khampeera, A., Yongchalermchai, C., and Techato, K. (2018). Drought monitoring using drought indices and GIS techniques in Kuan Kreng peat swamp, Southern Thailand. Walailak J. Sci. Technol. 15 (5), 357–370. doi:10.48048/wjst.2018.2723
Kogan, F., Salazar, L., and Roytman, L. (2012). Forecasting crop production using satellite-based vegetation health indices in Kansas, USA. Int. J. remote Sens. 33 (9), 2798–2814. doi:10.1080/01431161.2011.621464
Lagunes-Gómez, I., Hernández-Orduña, M. G., Murrieta-Galindo, R., Hernández-Pitalua, D., and Mayorga-Cruz, D. (2022). Spatial analysis of the empirical behavior of municipal institutional capacity for the formulation of sustainable growth management strategies with a regional focus: State of Veracruz, Mexico. Sustainability 14 (4), 2000. doi:10.3390/su14042000
Lawrimore, J., Heim, R. R., Svoboda, M. D., Swail, V., and Englehart, P. J. (2002). Beginning a new era of drought monitoring across North America. Bull. Am. Meteorological Soc. 83, 1191–1192. doi:10.1175/1520-0477-83.8.1191
Le Hung, T., and Tuyen, V. D. (2019). Application of remote sensing technique for drought assessment based on normalized difference drought index, a case study of Bac Binh district, Binh Thuan province (Vietnam). Russ. J. Earth Sci. 19 (2), 1–9. doi:10.2205/2018ES000647
Lee, S.-J., Cho, J., Hong, S., Ha, K.-J., Lee, H., and Lee, Y.-W. (2016). On the relationships between satellite-based drought index and gross primary production in the North Korean croplands, 2000–2012. Remote Sens. Lett. 7 (8), 790–799. doi:10.1080/2150704X.2016.1187315
Li, Y., Ye, W., Wang, M., and Yan, X. (2009). Climate change and drought: A risk assessment of crop-yield impacts. Clim. Res. 39 (1), 31–46. doi:10.3354/cr00797
Luna-Díaz-Peón, A., and Valdés-Rodríguez, O. A. (2019). Implicaciones de las Bases de Datos Climatológicas del Estado de Veracruz Sobre Investigaciones de Cambio Climático: Tres Estudios de Caso. Quehacer científico chiapas 14 (2), 15–20.
McKee, T. B., Doesken, N. J., and Kleist, J. (1993). “The relationship of drought frequency and duration to time scales,” in Proceedings of the 8th Conference on Applied Climatology: Boston, Anaheim, California, 17-22 January 1993, 179–183.
Méndez, M., and Magaña, V. (2010). Regional aspects of prolonged meteorological droughts over Mexico and Central America. J. Clim. 23 (5), 1175–1188. doi:10.1175/2009JCLI3080.1
Mongkolsawat, C., Wattanakij, N., Kamchai, T., Mongkolsawat, K., and Chuyakhai, D. (2009). “Exploration of spatio-temporal drought patterns using satellite-derived indices for crop management in northeastern Thailand,” in Proceedings of the 30th Asian Conference on Remote Sensing China.
National Aeronautics and Space Administration (2013). Landsat data contrinuity mission (LDCM). [Online]. Washington, States United of America. Available: https://www.nasa.gov/pdf/723395main_LDCMpresskit2013-final.pdf (Accessed October 16, 2021).
National Centers for Environmental Information (2022). North American drought monitor (NADM). USA: National Oceanic and Atmospheric Administration. Available: https://www.ncei.noaa.gov/access/monitoring/nadm/#:∼:text=The%20North%20American%20Drought%20Monitor,continent%20on%20an%20ongoing%20basis (Accessed November, 2022).
Navarro-Estupiñan, J., Robles-Morua, A., Vivoni, E. R., Zepeda, J. E., Montoya, J. A., and Verduzco, V. S. (2018). Observed trends and future projections of extreme heat events in Sonora, Mexico. Int. J. Climatol. 38 (14), 5168–5181. doi:10.1002/joc.5719
Nkedianye, D., de Leeuw, J., Ogutu, J. O., Said, M. Y., Saidimu, T. L., Kifugo, S. C., et al. (2011). Mobility and livestock mortality in communally used pastoral areas: The impact of the 2005-2006 drought on livestock mortality in maasailand. Pastor. Res. Policy 1 (1), 17. doi:10.1186/2041-7136-1-17
NU (2015). Objetivos de Desarrollo sostenible [online]. Naciones unidas. Available: https://www.un.org/sustainabledevelopment/es/objetivos-de-desarrollo-sostenible/(Accessed Septiembre 16, 2020).
Palmer, W. C. (1965). Meteorological drought. Washington, D.C., United States: US Department of Commerce.
Paniagua, M., Villalba, J., and Pasten, M. (2020). “Spatial-temporal distribution of drought in the western region of Paraguay (2005-2017),” in 2020 IEEE Latin American GRSS & ISPRS Remote Sensing Conference (LAGIRS), Santiago, Chile, 22-26 March 2020.
Peters, A. J., Walter-Shea, E. A., Ji, L., Vina, A., Hayes, M., and Svoboda, M. D. (2002). Drought monitoring with NDVI-based standardized vegetation index. Photogrammetric Eng. remote Sens. 68 (1), 71–75.
Quiring, S. M., and Ganesh, S. (2010). Evaluating the utility of the Vegetation Condition Index (VCI) for monitoring meteorological drought in Texas. Agric. For. Meteorology 150 (3), 330–339. doi:10.1016/j.agrformet.2009.11.015
Renza, D., Martinez, E., Arquero, A., and Sanchez, J. (2010). “Drought estimation maps by means of multidate Landsat fused images,” in Proceedings of the 30th EARSeL Symposium, Paris, France, 2010-05-31.
Ruiz-Corral, J. A., Medina-García, G., Rodríguez-Moreno, V. M., Sánchez-González, J. d. J., Villavicencio García, R., Durán Puga, N., et al. (2016). Regionalización del cambio climático en México. Rev. Mex. ciencias agrícolas 7, 2451–2464.
Salas-Martínez, F., Valdés-Rodríguez, O. A., and Méndez-Pérez, M. (2020). Changes in temperature and rainfall caused by three crops in the state of Veracruz, Mexico. Rev. Chapingo Ser. Ciencias For. 26 (2), 273–289. doi:10.5154/r.rchscfa.2019.04.028
Salas-Martínez, F., Valdés-Rodríguez, O. A., Palacios-Wassenaar, O. M., and Márquez-Grajales, A. (2021a). Analysis of the evolution of drought through SPI and its relationship with the agricultural sector in the central zone of the state of Veracruz, Mexico. Agronomy 11 (11), 2099. doi:10.3390/agronomy11112099
Salas-Martínez, F., Valdés-Rodríguez, O. A., Palacios-Wassenaar, O. M., and Márquez-Grajales, A. (2021b). “Reducciones sobre el rendieminto del maíz en grano en la región central de Veracruz, México,” in Ciencia y Tecnología para el Campo Mexicano: Retos y Oportunidades (México: INIFAP), 1530–1541.
Saldaña, R. M. (2013). Contraste de Hipótesis Comparación de dos medias independientes mediante pruebas no paramétricas: Prueba U de Mann-Whitney. Enfermería del Trab. 3 (2), 77–84.
Salman, S. A., Shahid, S., Ismail, T., Chung, E.-S., and Al-Abadi, A. M. (2017). Long-term trends in daily temperature extremes in Iraq. Atmos. Res. 198, 97–107. doi:10.1016/j.atmosres.2017.08.011
Sánchez, T. R. A. (2015). Prueba de Wilcoxon-Mann-Whitney: Mitos y realidades. Rev. Mex. Endocrinol. Metab. Nutr. 2, 18–21.
Santillán-Espinoza, L. E., Blanco-Macías, F., Magallanes-Quintanar, R., García-Hernández, J. L., Cerano-Paredes, J., Delgadillo-Ruiz, O., et al. (2011). Tendencias de temperaturas extremas en Zacatecas, México. Rev. Mex. ciencias agrícolas 2, 207–219.
Schmidhuber, J., and Tubiello, F. N. (2007). Global food security under climate change. Proc. Natl. Acad. Sci. U. S. A. 104 (50), 19703–19708. doi:10.1073/pnas.0701976104
Seager, R., Ting, M., Davis, M., Cane, M., Naik, N., Nakamura, J., et al. (2009). Mexican drought: An observational modeling and tree ring study of variability and climate change. Atmósfera 22 (1), 1–31.
Secretaría de Agricultura Ganadería Desarrollo Rural Pesca y Alimentación (2010). Servicio de Información Agroalimentaria y Pesquera. Datos abiertos [online]. Available: https://www.gob.mx/siap (Accessed Diciembre 15, 2020 2020).
Secretaria de Agricultura y Desarrollo Rural (2017). Siap. [Online]. México: 2017. Available: http://infosiap.siap.gob.mx/gobmx/datosAbiertos_a.php (Accessed May, 2021).
Sedeño-Díaz, J. E., and López-López, E. (2021). The influence of climate change on river corridors in drylands: The case of the tehuacán-cuicatlán biosphere reserve. Front. Environ. Sci. 9, 1–12. doi:10.3389/fenvs.2021.681703
SEFIPLAN (2013a). Programa región capital 2013 – 2016 Veracruz. México: Gobierno del Estado de Veracruz.
SEFIPLAN (2013b). Programa región las montañas 2013 – 2016. Veracruz. México: Gobierno del Estado de Veracruz.
SEFIPLAN (2013c). Programa región sotavento 2013-2016 Veracruz. México: Gobierno del Estado de Veracruz.
Servicio de Información Agroalimentaria y Pesquera (2020). Avance de Siembras y Cosechas. Resumen por estado. [Online]. Available: http://infosiap.siap.gob.mx:8080/agricola_siap_gobmx/ResumenProducto.do (Accessed June, 2021).
SMN (2010). Información estadística climatológica [online]. México: Servicio meteorológico nacional. Available: https://smn.conagua.gob.mx/es/climatologia/informacion-climatologica/informacion-estadistica-climatologica (Accessed Septiembre 16, 2020).
SMN (2020). Monitor de Sequía en México. [Online]. Available: https://smn.conagua.gob.mx/es/climatologia/monitor-de-sequia/monitor-de-sequia-en-mexico (Accessed Septiembre 16, 2020).
SPC (2020). Temporada de Estiaje “Sequía Meteorológica en el Estado de Veracruz” (1° de febrero al 31 de mayo). Veracruz, México: Secretaría de Protección Civil.
Spinoni, J., Barbosa, P., Bucchignani, E., Cassano, J., Cavazos, T., Christensen, J. H., et al. (2020). Future global meteorological drought hot spots: A study based on cordex data. J. Clim. 33 (9), 3635–3661. doi:10.1175/JCLI-D-19-0084.1
Spinoni, J., Barbosa, P., De Jager, A., McCormick, N., Naumann, G., Vogt, J. V., et al. (2019). A new global database of meteorological drought events from 1951 to 2016. J. Hydrology Regional Stud. 22, 100593. doi:10.1016/j.ejrh.2019.100593
Stahle, D. W., Cook, E. R., Diaz, J. V., Fye, F. K., Burnette, D. J., Griffin, D., et al. (2009). Early 21st-century drought in Mexico. Eos, Trans. Am. Geophys. Union 90 (11), 89–90. doi:10.1029/2009EO110001
Svoboda, M., LeComte, D., Hayes, M., Heim, R., Gleason, K., Angel, J., et al. (2002). The drought monitor. Bull. Am. Meteorological Soc. 83 (8), 1181–1190. doi:10.1175/1520-0477-83.8.1181
Tabari, H., and Talaee, P. H. (2011). Analysis of trends in temperature data in arid and semi-arid regions of Iran. Glob. Planet. Change 79 (1-2), 1–10. doi:10.1016/j.gloplacha.2011.07.008
Tavazohi, E., and Ahmadi, M. (2018). Assessment of drought in the Zayandehroud basin during 2000-2015 using NDDI and SPI indices. Fresenius Environ. Bull. 27 (4), 2332–2340.
Thomas, D. S., Wilhelmi, O. V., Finnessey, T. N., and Deheza, V. (2013). A comprehensive framework for tourism and recreation drought vulnerability reduction. Environ. Res. Lett. 8 (4), 044004. doi:10.1088/1748-9326/8/4/044004
Touma, D., Ashfaq, M., Nayak, M. A., Kao, S.-C., and Diffenbaugh, N. S. (2015). A multi-model and multi-index evaluation of drought characteristics in the 21st century. J. Hydrology 526, 196–207. doi:10.1016/j.jhydrol.2014.12.011
Tucker, C. J., Justice, C., and Prince, S. (1986). Monitoring the grasslands of the sahel 1984-1985. Int. J. Remote Sens. 7 (11), 1571–1581. doi:10.1080/01431168608948954
United Nations (2015). Acuerdo de parís [online]. París: Naciones Unidas. Available: https://unfccc.int/files/meetings/paris_nov_2015/application/pdf/paris_agreement_spanish.pdf (Accessed June 13, 2021).
United States Geological Survey (2021a). EarthExplorer. [Online]. Available: https://earthexplorer.usgs.gov/(Accessed August 15, 2021).
United States Geological Survey (2021b). Landsat 8. [Online]. Available: https://www.usgs.gov/landsat-missions/landsat-8 (Accessed August 15, 2021).
United States Geological Survey (2018). USGS EROS archive - Landsat 8 OLI (operational land imager) and TIRS (thermal infrared sensor) level-1 data products. Available: https://www.usgs.gov/centers/eros/science/usgs-eros-archive-landsat-archives-landsat-8-oli-operational-land-imager-and (Accessed september 19, 2021).
Valiente, Ó. M. (2001). Sequía: Definiciones, tipologías y métodos de cuantificación. Investig. Geográficas 26, 59–80. doi:10.14198/INGEO2001.26.06
Vicente-Serrano, S. M., Beguería, S., and López-Moreno, J. I. (2010). A multiscalar drought index sensitive to global warming: The standardized precipitation evapotranspiration index. J. Clim. 23 (7), 1696–1718. doi:10.1175/2009JCLI2909.1
Vicente-Serrano, S. M., Gouveia, C., Camarero, J. J., Beguería, S., Trigo, R., López-Moreno, J. I., et al. (2013). Response of vegetation to drought time-scales across global land biomes. Proc. Natl. Acad. Sci. U. S. A. 110 (1), 52–57. doi:10.1073/pnas.1207068110
Wang, L., Qu, J. J., and Hao, X. (2008). Forest fire detection using the normalized multi-band drought index (NMDI) with satellite measurements. Agric. For. meteorology 148 (11), 1767–1776. doi:10.1016/j.agrformet.2008.06.005
Wehner, M., Easterling, D. R., Lawrimore, J. H., Heim, R. R., Vose, R. S., and Santer, B. D. (2011). Projections of future drought in the continental United States and Mexico. J. Hydrometeorol. 12 (6), 1359–1377. doi:10.1175/2011JHM1351.1
Keywords: drought, NDDI index, Landsat 8, Gulf of Mexico, climate change
Citation: Salas-Martínez F, Valdés-Rodríguez OA, Palacios-Wassenaar OM, Márquez-Grajales A and Rodríguez-Hernández LD (2023) Methodological estimation to quantify drought intensity based on the NDDI index with Landsat 8 multispectral images in the central zone of the Gulf of Mexico. Front. Earth Sci. 11:1027483. doi: 10.3389/feart.2023.1027483
Received: 25 August 2022; Accepted: 17 April 2023;
Published: 09 May 2023.
Edited by:
Rajesh Mall, Banaras Hindu University, IndiaReviewed by:
Samaria Armenta, Tropical Research Center, Veracruzana University, MexicoCopyright © 2023 Salas-Martínez, Valdés-Rodríguez, Palacios-Wassenaar, Márquez-Grajales and Rodríguez-Hernández. This is an open-access article distributed under the terms of the Creative Commons Attribution License (CC BY). The use, distribution or reproduction in other forums is permitted, provided the original author(s) and the copyright owner(s) are credited and that the original publication in this journal is cited, in accordance with accepted academic practice. No use, distribution or reproduction is permitted which does not comply with these terms.
*Correspondence: Olivia Margarita Palacios-Wassenaar, b2xpdmlhLnBhbGFjaW9zQGluZWNvbC5teA==
†These authors have contributed equally to this work and share first authorship
Disclaimer: All claims expressed in this article are solely those of the authors and do not necessarily represent those of their affiliated organizations, or those of the publisher, the editors and the reviewers. Any product that may be evaluated in this article or claim that may be made by its manufacturer is not guaranteed or endorsed by the publisher.
Research integrity at Frontiers
Learn more about the work of our research integrity team to safeguard the quality of each article we publish.