 Steven P. Chavez1
 Ana P. Barros1,2*
- 1Department of Civil and Environmental Engineering, Duke University, Durham, NC, United States
- 2Department of Civil and Environmental Engineering, University of Illinois Urbana-Champaign, Champaign, IL, United States
The sensitivity of warm orographic cloud development to aerosol indirect effects was investigated through aerosol-aware Weather Research and Forecast model simulations contrasting aerosol-cloud-precipitation interactions using the default (generic) aerosol and regional aerosol measurements from the Integrated Precipitation and Hydrology Experiment in the Southern Appalachian Mountains for three rainfall events: 1) enhanced local convection; 2) a frontal system, and 3) a tropical system. Using the regional aerosol activation spectrum yields higher number of drops than using the default, smaller cloud droplets and delayed rainfall onset under weak synoptic forcing conditions. Evaluation against aircraft measurements in isolated convective clouds reveals that while the model microphysics falls short of reproducing the vertical structure of nonprecipitating clouds, the liquid water content, and the concentration of cloud droplets near cloud base are in keeping with observations. The simulated cloud vertical structure shows the regional signature of orographic enhancement over the mountains vis-a-vis the adjacent plains. In the inner region, valley-ridge circulations organize the spatial patterns of cloudiness under weak synoptic forcing. The formation of early afternoon low-level clouds over the ridges in the summertime reflects the aerosol indirect effect. By contrast, for large-scale systems with strong and sustained moisture convergence at low levels (frontal and tropical systems), mechanically forced rainfall efficiency is enhanced, there is no delay in the onset of precipitation, and the aerosol indirect effect is negligible. This study shows that the impact of aerosol-cloud-precipitation interactions on the spatial variability of orographic rainfall is conditional on weather regime.
Highlights
• Persistent warm clouds develop from enhanced cloud droplet nucleation (CDN) under limited diurnal moisture flux convergence at low levels.
• Orographic precipitation maxima occur when enhanced CDN is supported by strong synoptic moisture flux convergence at mid-levels, resulting in high rainfall efficiency.
• Moisture flux convergence overcomes the Aerosol Indirect Effect (AIE) impact on synoptic-scale orographic cloud development and rainfall onset.
• The vertical structure and spatial variability of clouds are directly tied to the steepness of the aerosol activation spectra
1 Introduction
The aerosol indirect effect (AIE) refers to the role of Aerosol-Cloud-Precipitation-Interactions (ACPI) in modifying the structure of clouds and the timing of the precipitation at the ground due to changes in precipitation efficiency. In mountainous regions, complex atmospheric circulations at multiple scales can further modulate ACPI and consequently significantly impact the spatial allocation of freshwater input into adjacent mountain catchments (e.g., Barros et al., 2018).
Depending on cloud dynamical processes and synoptic conditions, variations in aerosol number concentration and chemical properties can have distinct influences on the microphysical pathways of ACPI, resulting in either enhancement or suppression of precipitation (Rosenfeld et al., 2008; Khain and Lynn, 2009; Fan et al., 2016). Large amounts of tiny particles in the smoke from biomass burning can serve as small cloud condensation nuclei (CCN) and inhibit or suppress the onset of precipitation due to reduced efficiencies of collision and coalescence of tiny droplets (Andreae et al., 2004). Yang et al. (2016) explicitly linked the suppression of warm rain in Mt. Hua of Central China to valley-mountain circulation. In mixed-phase clouds, aerosols act as ice nucleating particles (INP) enhancing the production of ice crystals, the cloud glaciation effect, impacting cloud life-time and the efficiency of precipitation processes. Aerosol size and composition, and aerosol surface properties such as surface coating determine the nucleation mode (i.e., contact or immersion nucleation), and hence INP concentrations and ice nucleation efficiency (e.g., Lohmann and Hoose, 2009). Increased aerosol concentrations may lead to the increase in the numbers of very small cloud droplets, causing a delayed onset of precipitation; however, more cloud water can be uplifted above the freezing level and release additional latent heating, which invigorates deep convection, leading to violent storms and heavy rainfall (Khain et al., 2005; Bell et al., 2008). Lohmann and Feichter (2005) referred to this indirect aerosol effect as the thermodynamic effect, especially for deep convective clouds involving mixed-phase hydrometeors. Fan et al. (2016) report invigoration effects in orographic mixed-phase clouds through increased production of snow precipitation under the condition of high CCN concentrations (> 1,000 cm−3). Muhlbauer et al. (2010) pointed out that the response of cloud and precipitation to changes in aerosol concentrations is less sensitive in mixed-phase clouds because of the buffering effect of mixed-phase microphysics. Saleeby and Heever (2013) showed that in deep convection simulations the dynamical influence overwhelms the reduction of precipitation efficiency due to increased aerosol concentrations. Nevertheless, the sensitivity of precipitation to aerosol variations depends on the environmental conditions and cloud regime (Iguchi et al., 2008; Khain et al., 2008; Lynn et al., 2007). Nugent et al. (2016) investigated the impacts of surface aerosol, cloud-layer moisture, and wind field on thermally driven orographic clouds over the island of Dominica in the Caribbean. They found that wind and cloud-layer moisture play a more significant role in cloud and precipitation formation than aerosols. Shrestha and Barros (2010) investigated the joint spatial variability of aerosol, clouds, and rainfall at the scale of the Himalayan range using satellite observations and found that the regions with aerosol buildup as measured by Aerosol Optical Depth in the pre-monsoon season (i.e., under water supply deficit) coincide with regions of high cloudiness and rainfall accumulation along the southern facing slopes during the active phases of the monsoon, and identified the Central Himalayan region as a region where aerosol-cloud-interactions play an important role on precipitation hydroclimatology at the seasonal scale likely modulated by the active and break phases of the monsoon (Barros et al., 2014; Henriksson et al., 2014). At the event-scale, Brun et al. (2011) mapped patterns of aerosol intrusion from the Indo-Gangetic Plains into the Himalayan range, including long-lived persistence in the inner region valleys until they are washed by precipitation, as documented by Shrestha et al. (2013).
Field campaigns and mostly numerical model simulations have been used extensively to explore processes associated with aerosol indirect effects. For instance, Borys et al. (2000) and Borys et al. (2003) showed that higher concentrations of anthropogenic aerosols at low levels in mountainous regions lead to very high concentrations of small droplets in low level cold season orographic clouds that are less effective at riming snowflakes from higher level feeder clouds, resulting in lower snowfall rates. Rosenfeld and Givati (2006) found that a decreasing trend in orographic winter precipitation along coastal mountains in the western United States is associated with a decrease in coarse aerosols that may initiate and enhance precipitation. Saleeby et al. (2009) reported that where precipitation formation is dominated by the ice phase, the INP concentration alters the efficiency of droplet collection by ice crystals affecting their trajectories and determining snowfall efficiency and spatial distribution. Xiao et al. (2016) investigated the sensitivity of orographic clouds and precipitation to changes in aerosol and freezing levels by using the WRF model coupled with a bin microphysics scheme. They attributed increased surface precipitation to intensified riming processes due to a larger amount of cloud droplets (10—30 μm in diameter). Furthermore, they linked the enhancement in precipitation to faster growth of ice-phase particles via the riming process at lower freezing levels. Using the modified ice-nucleation in the Morrison microphysical scheme in WRF, Halder et al. (2015) showed that larger latent heating due to deposition in the upper troposphere drives stronger updrafts, thus contributing to the enhanced intensity of the simulated thunderstorm. Khain et al. (2011) conducted 2D simulations of a hailstorm using the Hebrew University Cloud Model (HUCM) with spectral microphysics. The model results demonstrated that an increase in CCN concentration from 100 cm−3 to 3,000 cm−3 results in higher rainfall accumulations and a considerable increase in hail formation with larger sizes up to 1—4 cm.
The non-linear feedbacks among radiation, microphysics, convection, and surface fluxes pose further challenges in mountainous regions due to complex interactions with regional circulation patterns. In the Southern Appalachian Mountains (SAM), various studies (Prat and Barros, 2010; Wilson and Barros, 2015; Duan and Barros, 2017; Wilson and Barros, 2017) have shown that moisture availability and cloud condensation nuclei (CCN) are necessary to maintain the levels of cloudiness and precipitation observed. Complex topography affects moisture flow patterns along the valleys, and solar forcing organizes mountain-valley circulations, which govern cloud organization when large-scale moisture transport is weak at low levels or limited to higher levels in the atmosphere in the SAM (Wilson and Barros, 2015). Changes in latent heat in the vicinity of the orographic precipitation maximum contribute to enhancing mountain-valley circulations (Magagi and Barros, 2004; Seo et al., 2020). Barros et al. (2018), using aerosol size distribution, chemical composition, and hygroscopicity measured in the inner region of the Central Himalayas by Shrestha et al. (2013) during JAMEX (Lau et al., 2008), demonstrated the importance of using regional aerosol properties as opposed to standard continental aerosol on the dynamical evolution of an intense convective storm and modification of the vertical structure of hydrometeors including ice particles and the spatial distribution of precipitation, with implications for regional water resources (Shrestha, 2011). Through aerosol-cloud-radiation feedbacks, Duan (2017) showed that impacts on the surface energy budget result in surface temperature changes in the range of 5–10 K among adjacent slopes in the SAM.
Long-term observations from a high-altitude ground rain gauge (RG) network in the Southern Appalachian Mountains (SAM) reveal a distinct seasonal variability in the diurnal cycle of rainfall. The diurnal cycle of warm-season (spring and summer) precipitation is characterized by late afternoon peaks, attributed to isolated thunderstorms and mesoscale convective systems (Duan et al., 2015). Nevertheless, most precipitation in this region is associated with stratiform systems and light rainfall (≤3 mm/h) that contribute up to 30%–50% of annual rainfall accumulation in the SAM (Wilson and Barros, 2014). Another regional feature in the SAM is the persistent low-level clouds and fog (LLCF) layers in all seasons. In the warm season, higher frequencies of LLCF are found over mountain ridges in the daytime and mountain valleys at nighttime (Duan and Barros, 2017). In the absence of large-scale forcing, the diurnal cycle of LLCF in the SAM can be explained by atmospheric moisture mesoscale convergence patterns modulated by the topography. Predominantly easterly and south-easterly low-level moisture convergence is associated with the early afternoon formation of low-level clouds (LLC) in the inner mountainous regions of the SAM (Wilson and Barros, 2017). In the presence of LLC, reverse orographic enhancement occurs, which refers to enhancement in rainfall intensity at low elevations in the Valleys but not in the ridges due to higher coalescence efficiency through the seeder feeder mechanism (Wilson and Barros, 2014 and; Wilson and Barros, 2015). In the SAM, the factors previously mentioned are linked to cloud heterogeneity and precipitation intensity. However, the linkages of cloudiness and precipitation patterns to cloud condensation nuclei (CCN) availability alongside local processes are yet to be determined.
In this study, realistic aerosol activation spectra observed during the Integrated Precipitation and Hydrology Experiment (IPHEx) are used in high–resolution mesoscale simulations using WRF to characterize AIE under different synoptic regimes. IPHEx is a ground validation campaign in the SAM after the Global Precipitation Measurement (GPM) core satellite launch that includes a dense network of rain gauges and aircraft measurements of microphysics in the Pigeon Basin (Barros et al., 2014). First, simulations are compared against aircraft observations of clouds for a warm-season rainfall during IPHEx. Spatial and temporal considerations for comparison between the model and aircraft observations are described in the methodology section and were initially restricted to the southern part of the basin, where the aircraft measurements in non-precipitating clouds were performed. Second, IPHEx and standard Continental aerosol spectra are analyzed to elucidate the impact of aerosols on the timing of rainfall onset and in the spatial distribution of rainfall under distinct regional versus local scale dynamics. To this end, we analyze three warm season precipitation events over the SAM: Case 1 (C1)—a day of isolated enhanced convection; Case 2 (C2)—a frontal wave - Case 2, and Case 3 (C3)—a tropical depression. The vertical structure of precipitating species (rain, cloud, graupel, hail, ice, and snow) was examined conditional on cloud depth and precipitation intensity. The manuscript is organized as follows. The modeling experiments are described in Section 2, and the Data are presented in Section 3. Results and the main findings are analyzed In Section 4, followed by Conclusion in Section 5.
2 Modeling experiments
2.1 The WRF ARW model configuration
The Advanced Weather Research and Forecasting (WRF) model Version 4.2.2 was used to perform numerical simulations over the southern Appalachian Mountains (SAM) for different large-scale atmospheric conditions. The model configuration was set up with four one-way nested domains with a horizontal grid spacing of 27- 9-, 3-, and 1-km (Figure 1). Initialization and lateral boundary conditions are updated every 6-h using the National Centers for Environmental Prediction (NCEP) Final Operational Global Analysis (FNL) with 1 × 1 horizontal resolution.
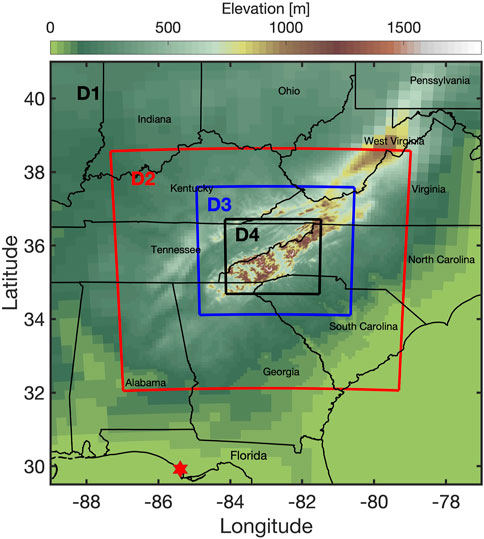
FIGURE 1. Domain setup for numerical simulations with 4 nested domains with increasingly higher grid resolution: D1 (27 km), D2 (9 km), D3 (3 km) and D4 (1 km).
To resolve low-level cloud formation and precipitation processes, a hybrid terrain-following vertical grid with 90 layers was constructed. For each simulation, the same parameterization was used, and the first 7 hours were disregarded to isolate model spin-up artifacts. In addition, for the 4th domain, 20 pixels at each edge of the domain were dropped to avoid unphysical artifacts entering from the 3rd domain to the 4th domain.
The Kain-Fritsch cumulus parameterization scheme (Kain, 2004) is used in the first and second domains (27 and 9 km resolution), and convection is resolved explicitly in the third (3 km) and fourth (1 km) domains. Other physics options include Milbrandt and Yau 2005 (Milbrandt and Yau, 2005; hereafter MY05) double moment microphysics, the Rapid Radiative Transfer Model radiation scheme for longwave and shortwave (Iacono et al., 2008), and the unified Noah land-surface model (Tewari et al., 2004) applied in all four domains. In addition, the Mellor-Yamada-Nakanishi-Niino (MYNN) planetary boundary layer scheme (Nakanishi and Niino, 2004) is selected along with the Monin-Obukhov (Janjic Eta) surface layer scheme to capture low-level cloud formation (Wilson and Barros, 2015 and; Wilson and Barros, 2017). The soil temperature and moisture fields are also initialized from the NCEP FNL data. Regarding WRF dynamics, the scheme for advection transport of moist and scalars was the fifth-order weighted, non-oscillatory scheme (WENO). Rayleigh damping was applied to avoid reflections from gravity waves at the top of the domain.
2.1.1 Modelling experiments with Milbrandt-Yau microphysics
The double moment Milbrandt-Yau microphysics scheme (total number concentration and mixing ratio), hereafter MY05, is used to investigate the effects of aerosol properties on the sensitivity of ACPI. Number concentrations of nucleated cloud droplets (NCCN) in MY05 are calculated based on a four-parameter CCN activation spectrum (Eq. 1), which is a more realistic representation of CCN populations for supersaturations greater than 0.01% compared to a single power-law expression in (Twomey, 1959). This CCN activation scheme (Cohard et al., 1998; CPB98) has demonstrated improved estimation of cloud droplet numbers as it accounts for the limited availability of small-sized condensation nuclei with increasing supersaturation.
where sv, wmax is the maximum water vapor supersaturation, and F (a, b, c; x) is the hypergeometric function. For the four parameters of the fit, C is a scaling factor, k can be estimated as the slope for a small supersaturation region in a log-log plot of NCCN and s, β indicates the location of the slope break, and μ represents the flat aspect of the curves at high supersaturation (see Figure 2 in CPB98). The CCN activation spectrum fitted for “representative” continental and maritime aerosol types by CPB98 are the MY05 standard, but the formula in Eq. 1 and corresponding fitting parameters for each aerosol type are not directly employed for computing NCCN in the microphysics scheme. Instead, maximum supersaturation is first expressed as a function of updraft speed w, temperature T, and pressure p using an iterative method as outlined by (Cohard and Pinty, 2000). While there have been more recent updates in the microphysics schemes available in WRF, the choice of MY05 is due to the relative simplicity of its formulation, the straightforward path to incorporate field measurements directly in the parameterization, and the opportunity to contrast this work with previous orographic ACPI studies (e.g., Barros et al., 2018). The impact of different atmospheric conditions on moist convergence and ACPI is analyzed for WRF simulations using Continental and IPHEx aerosols, hereafter referred to as IPHEx and Continental simulations. The focus is on the evolution of the space-time organization of clouds and precipitation, including the vertical structure and phase of cloud mixing ratio and hydrometeors.
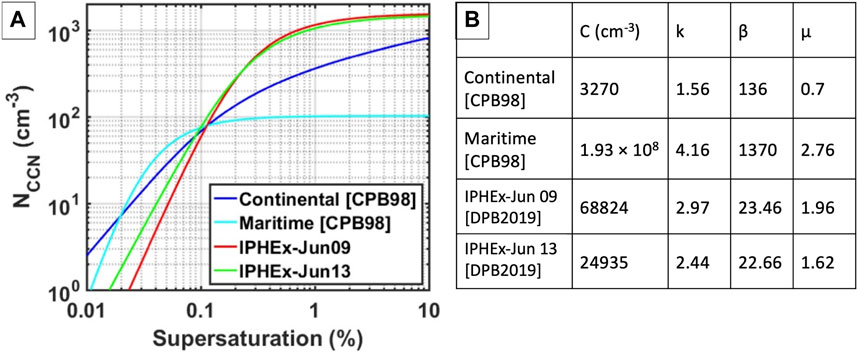
FIGURE 2. (A) CCN activation spectra estimated from surface measurements at Maggie Valley on June 09 and June 13 during IPHEx obtained by Duan et al. (2019), abbreviated as DPB 2019, and the continental and maritime CCN activation from CPB98 (default CCN types in MY05). (B) Table shows the fitted parameters of the analytical estimate of NCCN by CPB98 and DPB2019 for the activation spectra.
3 Data
3.1 IPHEx data
The IPHEx campaign was held in North Carolina in 2013 and 2014 with an intense study period from May 01 to 15 June 2014. A supersite was deployed at Maggie Valley with a complete suite of instruments to characterize local aerosols and rainfall, including disdrometers, rain gauges, microwave radiometers, and Ka- and W-band radars (see Supplementary Figure S1 for time-series of reflectivity profiles). CCN activation spectra estimated from in situ measurements at Maggie Valley (Figure 2A, red and green lines) were obtained, the activation spectra from June 9, hereafter called IPHEx aerosols, was applied to the MY05 parameterization in the WRF model. The standard continental CCN activation spectra is henceforth referred to as Continental aerosols (Figure 2A, dark blue line). Clouds from both simulations were compared against the aircraft measurements of liquid water content (LWC) and cloud drop number concentration (CDNC) in cumulus congestus clouds near Maggie Valley on 12 June 2014, a day of enhanced convection. In addition, simulations during the passage of frontal and tropical systems were performed with the Continental and IPHEx aerosols to examine the effect of large-scale atmospheric conditions on the vertical structure of clouds and the onset of precipitation. For the three different weather cases, the analysis aimed to elucidate the spatial organization of clouds and vertical microstructure characteristics by landform, specifically differentiating among plains, valleys, and ridges based on threshold terrain elevation criteria.
A dense network of 40 Tipping Bucket (TB3 Model) rain gauges that measure the amount of fallen precipitation in increments of 0.1 mm were operational during the intense period of IPHEx in the Pigeon River basin (PRB) In addition, aircraft measurements of cloud microphysics were available in the PRB south of 35.7oN near Maggie Valley (e.g., Duan et al., 2019). A subset of 28 rain gauges in the same region was used to detect rainfall onset (Figure 3A).
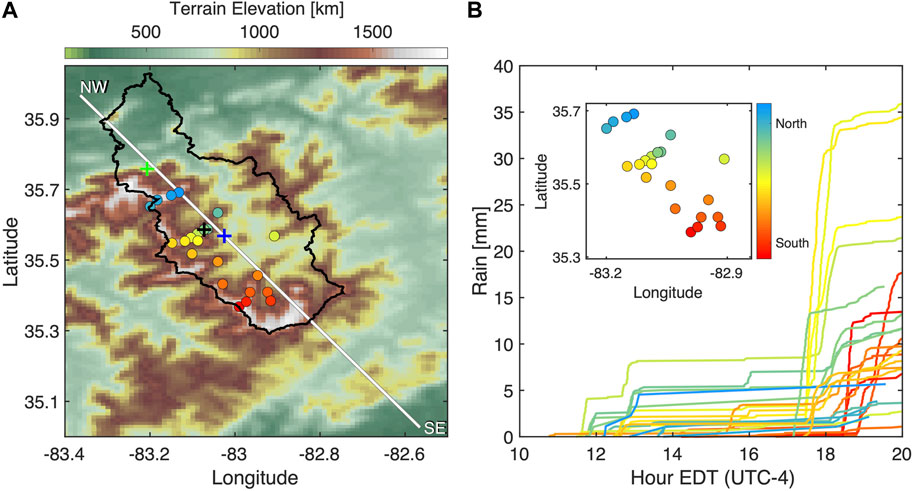
FIGURE 3. (A) Elevation map showing the Pigeon Basin as a black contour line, rain gauge locations are colored based on latitude, cool (warm) colors for North (South) relative positions, crosses are the locations of disdrometers, the red cross is the location of the Maggie Valley supersite and a cross-section from NW to SE is the white line. (B) Temporal evolution of cumulative rainfall from 26 rain gauges located in the Pigeon basin at latitudes South of 35.7oN. The colors in the inset figure show the latitude of each rain gauge for reference.
Cloud drop number concentration (CDNC) and size distributions for particles with diameters between 2 and 50 um in 30 bin sizes were measured with the cloud droplet probe (CDP) installed on the University of North Dakota Citation aircraft (Duan et al., 2019). Bulk LWC values were retrieved from a King-type probe and a Nevzorov probe. Only aircraft measurements inside the Pigeon basin at fixed altitudes (Supplementary Figure S2) and avoiding aircraft ascending paths were selected for assessmeent of WRF simulations. The flight period is 16:03 to 17:54 UTC.
3.2 Analysis of WRF simulations
Simulations were conducted with IPHEx and Continental aerosols for the three weather regimes described earlier, thus a total of six simulations over the SAM region. The first weather regime (Case 1, C1) is characterized by enhanced isolated convective activity on 12 June 2014, during the IPHEx campaign: convective cells formed first on the western ridges and throughout the afternoon isolated cells develop eastward across the SAM. Precipitation maxima were observed in the inner mountain region linked to the development of a cumulonimbus cloud in the central PRB at Maggie Valley (Figure 3B). The two other regimes are associated with large-scale weather systems: a frontal system propagating over the SAM on May 14–15 of 2014 (Case 2, C2; Wilson and Barros, 2015), and tropical system Fred (Case 3, C3) on August 17–18 of 2021 that made landfall in Florida on August 16.
For analysis, a cloud was defined as a region where the vertically integrated mixing ratio of the sum of cloud, graupel, hail, snow, and ice are at least 30 g kg−1, which is suitable for the study of the clouds observed in the SAM region although it is not adequate to detect fog and, or cirrus clouds. Once the clouds are identified, the vertical profiles of cloud, rain (if present), and ice (where ice = graupel + hail + snow + ice) mixing ratios were averaged for each cloud. Finally, for all the clouds in each simulation, we obtained three cloud profiles per cloud. Besides, the vertical development of clouds was calculated as cloud depth, which is defined as the difference between cloud top height and cloud base height. Finally, the mixing ratios of cloud, rain, and ice are shown for different cloud depths for the three different weather regimes. A less restrictive threshold for clouds of 1 g kg−1 was used to obtain the CDNC and to capture the onset of cloud formation.
The mass-weighted mean raindrop diameter (Dm) is used to explore the link between cloud and precipitation microphysics in the model and to compare it against disdrometer measurements. Dm was calculated using the total number concentration (NT) and mixing ratio (q) from the two-moment Milbrandt-Yau scheme (MY05) following Wilson and Barros (2017). As the information on the exact distribution of raindrops is not available, Dm is estimated as
where air density ρ is obtained from pressure and temperature outputs from the model and the coefficient c = (π/6)103. To avoid artifacts in Dm estimates when NT is small, Dm was calculated only for mixing ratios greater than 0.05 g kg−1.
4 Results and discussion
Case one model results using IPHEx and Continental aerosols are evaluated against observations in the SAM’s inner region during the IPHEx campaign in Section 4.1. A comprehensive analysis of the space-time variability of the vertical structure of hydrometeors extended to the SAM domain and for the three representative study Cases is presented in Section 4.2.
4.1 Observations and WRF simulations over the PRB during IPHEx—case 1
Because of the dynamical feedback of ACPI, comparing observations against WRF IPHEx and Continental is a challenge as the location and timing of convective initiation, cloud formation and growth, and precipitation onset are different. Consequently, we follow a strategy that consists of tracking the spatial and temporal distribution of rainfall within the PRB in the inner region of SAM, South of 35.7°N (Figure 3), and across the SAM (Supplementary Figure S2). The rain gauges (Figure 3B) began registering light rainfall between 16:00–18:00 UTC (12 p.m. and 2p.m. EDT) on the western ridges that extended to the inner region before 20:00 UTC (4p.m. EDT). Heavy rainfall was observed everywhere after 21 UTC (5 p.m. EDT), with higher intensity in the inner region and eastern ridges. An inspection of simulated hourly rainfall accumulation fields (Figure 4B) shows overall similar rainfall patterns in the inner region for IPHEx and Continental runs throughout the event at the regional scale. Continental shows more accumulated rainfall than IPHEx (Figure 4C) during the total period (12-16 EDT) and difference is larger at the South of the PRB. At midday, moderate rainfall cells are well developed over the western ridges in the Continental and 1 hour later in the IPHEx run (Figure 4A). Both simulations capture the timing and spatial patterns of the development of convective activity on the eastern ridges with more intense rainfall for the IPHEx case. Both simulations miss the afternoon rainfall peak between 21:00—22:00 UTC (5 and 6 p.m. EDT) in the inner region resulting in severe underestimation of daily precipitation in the PRB. The mid-afternoon rainfall peak in the inner SAM region is a well-established feature of regional hydrometeorology (Prat and Barros, 2010; Wilson and Barros, 2014; Wilson and Barros, 2015). Previous work (e.g., Wilson and Barros, 2014; Wilson and Barros, 2015 and; Wilson and Barros, 2017) indicates that easterly low-level convergence from Piedmont to the inner region in SAM provides moisture supply to support cloud development in the inner region. Evidence of seeder-feeder interactions (SFI) showing a significant increase in drop size (Dm) in the valleys (Supplementary Figure S3, bottom left panel) tied to persistent mid-day and early afternoon low-level clouds and fog is also presented by Wilson and Barros (2015, their Figure 4) consistent with the observed high reflectivity at low levels in the Ka-band radar (Supplementary Figure S1) and high intensity of precipitation measurements near the ground (Wilson and Barros, 2015 their Figure 5; Wilson and Barros, 2017 their Figure 11).
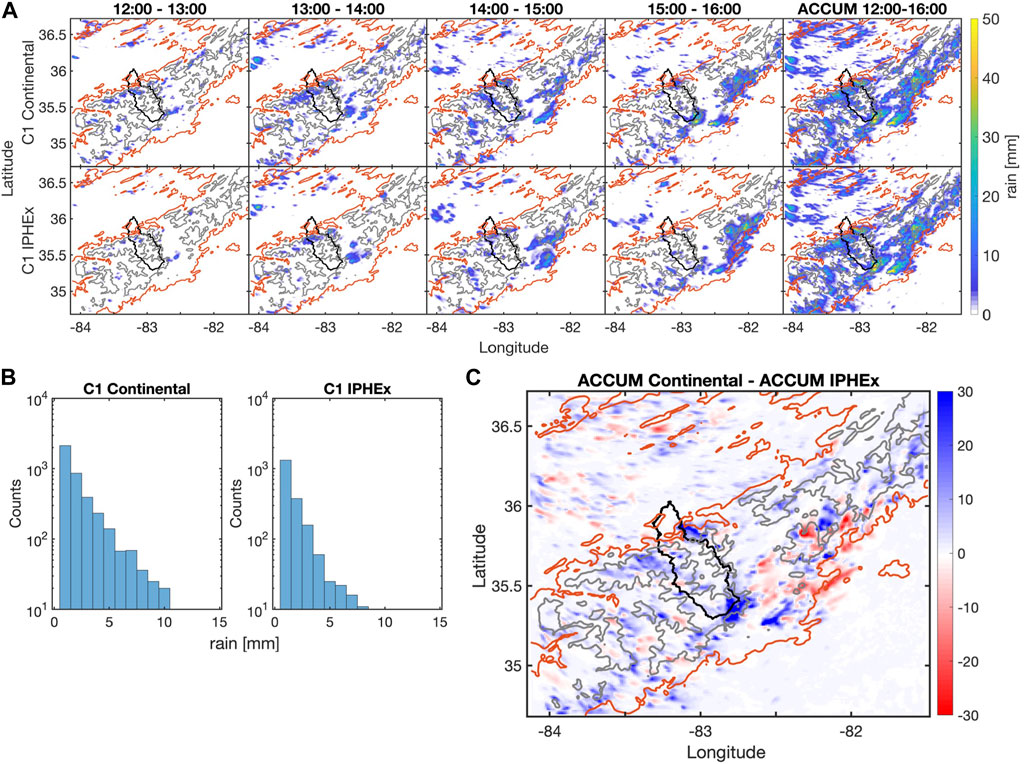
FIGURE 4. (A) Maps of accumulated rain during 1-h intervals, hours in Eastern daylight time (EDT) for Continental and IPHEx simulations for Case 1 (C1), the last column show the total cumulative rain during the period (12-16 EDT). The orange and gray lines are the topographic contour of 500 m and 1,000 m, respectively. The Black line delimited the Pigeon River Basin (PRB). (B) Histograms of rain every 15 min for Case 1 for Continental and IPHEx simulations during 12-16 EDT. (C) Difference between the cumulative rain in Continental minus IPHEx for the 12-16 LT period.
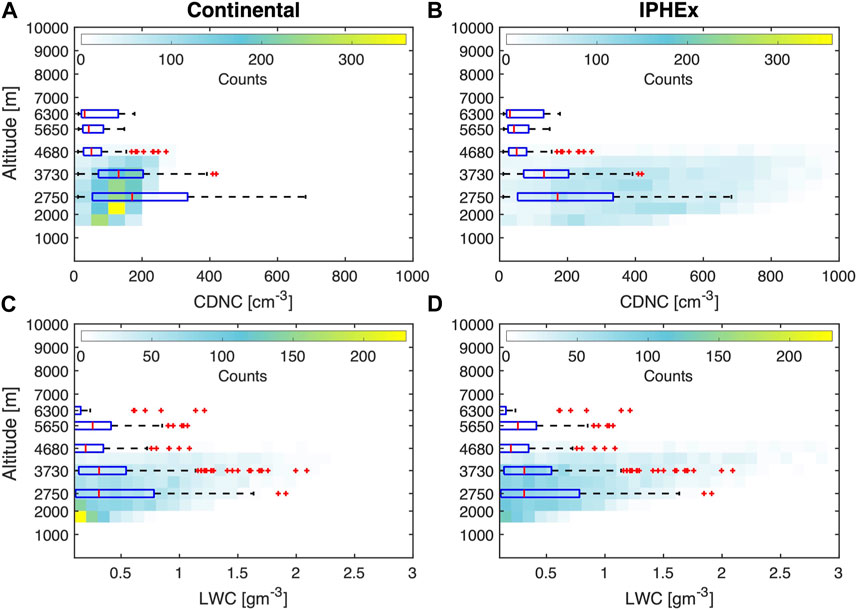
FIGURE 5. Vertical structure of cloud drop number concentration (CDNC) and liquid water content (LWC). CFADs show the distribution of simulated CDNC and LWC at different altitudes for non-precipitating clouds in the period 9:00-12:00 LT: (A) CDNC Continental; (B) CDNC IPHEx; (C) LWC Continental; (D) LWC IPHEx simulations. The boxplots are the aircraft observations at fixed elevations during 12:03-13:54 LT.
The vertical structure of WRF simulations of non-precipitating morning clouds 13:00–16:00 UTC (9—12 a.m. EDT) in the inner mountain region is compared against aircraft observations of CDNC and LWC in non-precipitating clouds at mid-day (12:03 - 13:54 EDT). Simulated CDNC and LWC are shown as Contoured Frequency by Altitude Diagrams (CFADs), and the observations are overlain as box plots (Figure 5). The distributions are generated at each altitude using the values from grid-points within the Pigeon River basin (PRB) South of 35.7°N in D4. The aircraft measurements are conducted in a spiral trajectory and point measurements within a control volume are averaged (e.g., Duan et al., 2019). Thus, the aircraft measurements can be viewed as sub-grid scale samples compared to the grid-scale samples of the simulations. Figures 5A, B shows that the median values in the measurements overlap well with the most frequent simulated values (CFADs’ peak). While the LWC CFADs (Figures 5C, D) are quite similar for both runs, the CDNC CFADs are very different for Continental and IPHEx. Indeed, there is close agreement between the IPHEx wide range of CDNC variability and the upper quartiles and outliers in the aircraft measurements in contrast with Continental. This behavior is consistent with the activation spectra in Figure 2A, which show that a higher supersaturation is required for activation in IPHEx compared to Continental, up to 0.1%, and a significant increase in activation effectiveness at higher supersaturations for IPHEx. Thus, in realistic conditions, a much wider range of CDNC is expected for IPHEx. The simulated mid-level morning clouds in the inner mountain region (cloud base ∼2,750 m) are shallower than the early afternoon cumulonimbus penetrated by the aircraft over the PRB valley, reflecting the difference in the timing of cloud formation. Furthermore, the aircraft data reveals a high LWC down to ∼1 km altitude, whereas at the same location, the LWC is high down to 1.5 km. While there is no significant difference between IPHEx and Continental LWC, IPHEx captures the observed variability of CDNC at mid-levels and Continental has little variability.
The model does not capture the formation of LLCs (below 2 km) in the inner region, which are necessary for SFI to produce early afternoon rainfall in the inner mountain region. Smaller CDNC for the same LWC implies larger cloud drops near the cloud base in the Continental run and explains the differences in the histograms of rainfall intensity (Figure 4B). Besides, it explains the IPHEx run underestimation of rainfall in the inner PRB. The importance of SFI in producing the afternoon heavy rainfall in the inner region shown in Figure 3B is illustrated by the disdrometer observations in Supplementary Figure S3. Note the difference between drop the drop size distributions at two disdrometers P7 (western ridges) and P21 (inner region) in Supplementary Figure S3, as well as the smaller drops at higher elevations (P3). Despite a more realistic vertical structure of mid-level cloud microphysics in the IPHEx simulation, the model’s failure to simulate layered LLCs and SFI handicaps precipitation processes.
4.2 ACPI conditional on weather regime
Figure 6 shows the Continental and IPHEx accumulated average rainfall from grid points in the PRB for the three weather regimes. For both Case 1 (enhanced convection) and Case 3 (tropical system Fred), more rainfall is produced using Continental aerosols, while for the frontal system (Case 2), more rainfall occurs with IPHEx aerosols. There is a delay in the onset of precipitation of around 1 h between IPHEx and Continental for Case 1 (Figure 6A). However, the arrival of large-scale frontal and tropical systems reach the PRB shows no delay (Figures 6B, C). The contrast between WRF simulations of the precipitation fields for the frontal wave and the tropical storm Fred over the SAM is shown in Supplementary Figure S4. There is a close agreement in the spatial patterns for the frontal system simulations, and differences in rainfall intensity between Continental and IPHEX are localized. Substantial differences exist for Case 3, even if the overall rainy pattern is similar. Fred’s southerly trajectory after landfall in the Florida panhandle was on a head-on collision with the SAM, specifically following closely the topography along the western slopes of the SAM. The IPHEX run does not capture the intense orographic enhancement of rainfall along the western ridges for the entire duration of the storm, and rainfall over the PRB ends earlier than in the Continental case. The difference in the duration and precipitation intensity over the Pigeon Basin explains the large difference in accumulated rainfall observed in Figure 6C. The morphology of the simulated storm as it propagated over the SAM was like radar observations1, which also show patterns of enhanced high rainfall intensity as depicted by the Continental run. The simulations suggest that ACPI impacts on surface precipitation in the inner region of SAM are more important for the afternoon convective weather regimes. Next, the focus is on the vertical structure of hydrometeors, including land-atmosphere interactions and cloud dynamics linked to ACPI over the larger SAM region.
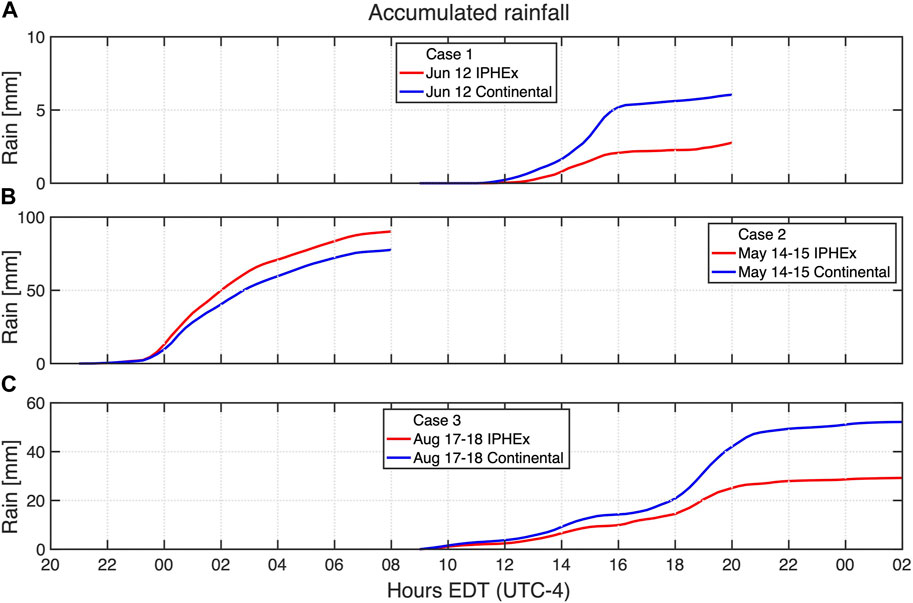
FIGURE 6. Cumulative mean rainfall from pixels inside the Pigeon Basin for: (A) Case 1; (B) Case 2; and (C) Case 3.
4.2.1 Vertical structure of clouds
Figure 7 shows histograms of cloud metrics (cloud base and cloud top heights, and cloud depth) for the six simulations. IPHEx runs for all weather regimes show a larger number of shallower low-level clouds compared to Continental runs. However, the shapes of the histograms are significantly different between the frontal system (Figure 7B-C2) and the two convective weather regimes (Figure 7A-C1 and Figure 7C-C3). In the case of Case 1 and Case 3, all the IPHEx distributions are positively skewed in contrast with symmetric distributions for Continental except for cloud base in Case 3. The large numbers of shallow low-level clouds in IPHEx indicate a predominance of warm cloud and precipitation processes because of IPHEx ACPI. This artifact is examined further by focusing on the vertical structure of clouds (Figure 8).
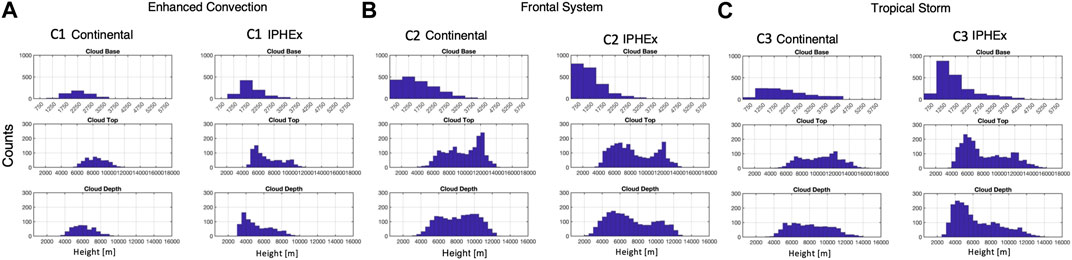
FIGURE 7. Continental and IPHEX histograms of Cloud Base, Cloud Top and Cloud Depth: (A) Enhanced Convection—Case 1 (C1); (B) Frontal System—Case 2(C2); and (C) Tropical Storm—Case 3 (C3).
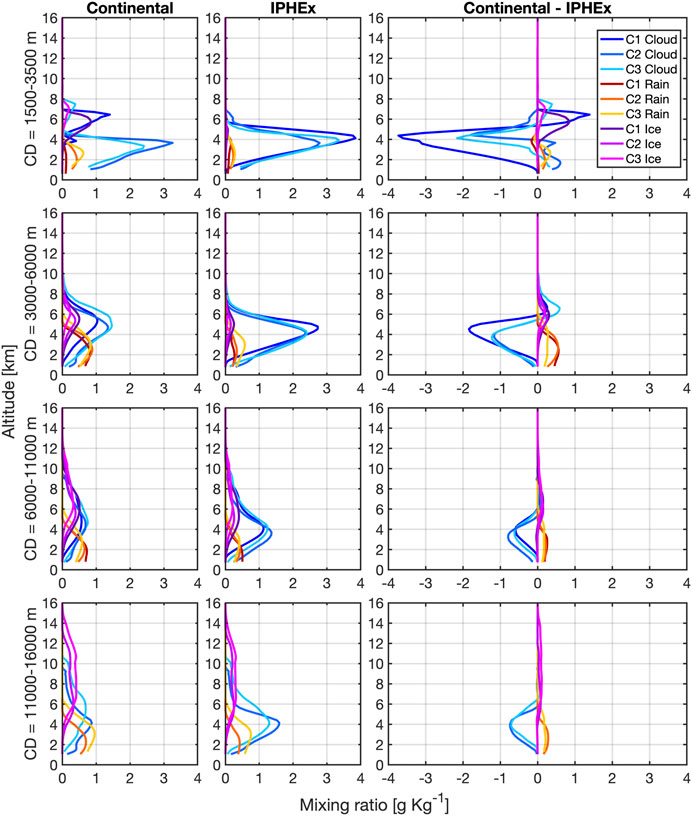
FIGURE 8. Continental and IPHEx profiles of the mixing ratios of cloud, rain, and ice species extracted from individual clouds in domain D4 and averaged for groups of clouds with different cloud depths (CD) for Case 1, Case 2, and Case 3. Top row: CD = 1,500–3,000 m; 2nd row: CD = 3000–6000 m; 3rd row: CD = 6,000–11000 m; and bottom row: CD = 11,000—16,000 m. The rightmost column shows the difference between Continental and IPHEx profiles for each case.
The average profiles of mixing ratios of cloud, rain, and ice water for four different cloud depths (CDs) for each Continental (left column) and IPHEx simulations (mid column) independently and the difference between Continental and IPHEX profiles (right column) are shown in Figure 8. In general, negative differences in cloud water mixing ratio at low levels and positive differences in ice water mixing ratio are larger for shallower clouds, cloud depths (CD) < 3500 m, and for C1 with major impacts on low-level rainfall from low-level and mid-level clouds. High ice mixing rations above the freezing level (∼4 km) for C1 are associated with changes in efficiency of precipitation processes. For Cases 2 and 3, there is little difference between the profiles of ice mixing ratio for Continental and IPHEx for low-level clouds (cloud base <2000 m, and cloud depth <6,000 m) which are dominant, as shown in Figures 7B, C. In general, cloud mixing ratios are much larger for IPHEx than Continental simulations, and rain and ice mixing ratios are larger and slightly larger for Continental than IPHEx respectively. Furthermore, for all cloud depths, the difference in ice and cloudiness between Continental and IPHEx decreases with altitude. Higher CCN activation in IPHEx runs results in more clouds and less rain than in the Continental simulations. These results suggest that rainfall efficiency is lower with increased CCN activation. A decrease in rainfall efficiency is expected to be associated with higher CDNC and smaller drop sizes (second aerosol indirect effect).
Figure 9 displays the Hovmöller diagrams of estimated rain Dm at 120 m above ground level (AGL) for Case 1 (June 12) along the Northwest-Southeast (left to right) cross-section in Figure 3. The Continental and IPHEx simulated rain Dm maxima approach 1.3 mm near the surface, which is significantly smaller than the range of disdrometer Dm. Both simulations show rain first in the Western region. However, Dm maxima in IPHEx are over the western region around 14 LT, while Dm maxima in Continental are over the eastern region around 16 LT. The larger Dm values (up to ∼5 mm) at the valley location P21 can be explained by the reverse orographic enhancement in the inner SAM with significantly increased rainfall intensity at low elevations compared to adjacent ridges due to SFI between low-level clouds and incoming precipitating systems (Wilson and Barros, 2014; Wilson and Barros, 2015; Duan and Barros, 2017). The surface precipitation enhancement by SFI is not captured in either model simulation because LLC below ∼2 km do not form. The modeled Dm profiles in both simulations at the time of precipitation onset (12-13 LT) show small variations in the vertical structure of Dm (Figure 9 panels e, f and i, j) in contrast with ground radar observations that exhibited strong gradients in reflectivity due to an increase in the rain droplet diameters toward the surface (Supplementary Figure S3). The fact that the MY05 microphysics cannot capture the low-level intensification of rainfall was pointed out previously by Wilson and Barros (2017). Therefore, without including SFI processes in the model, total rainfall is underestimated.
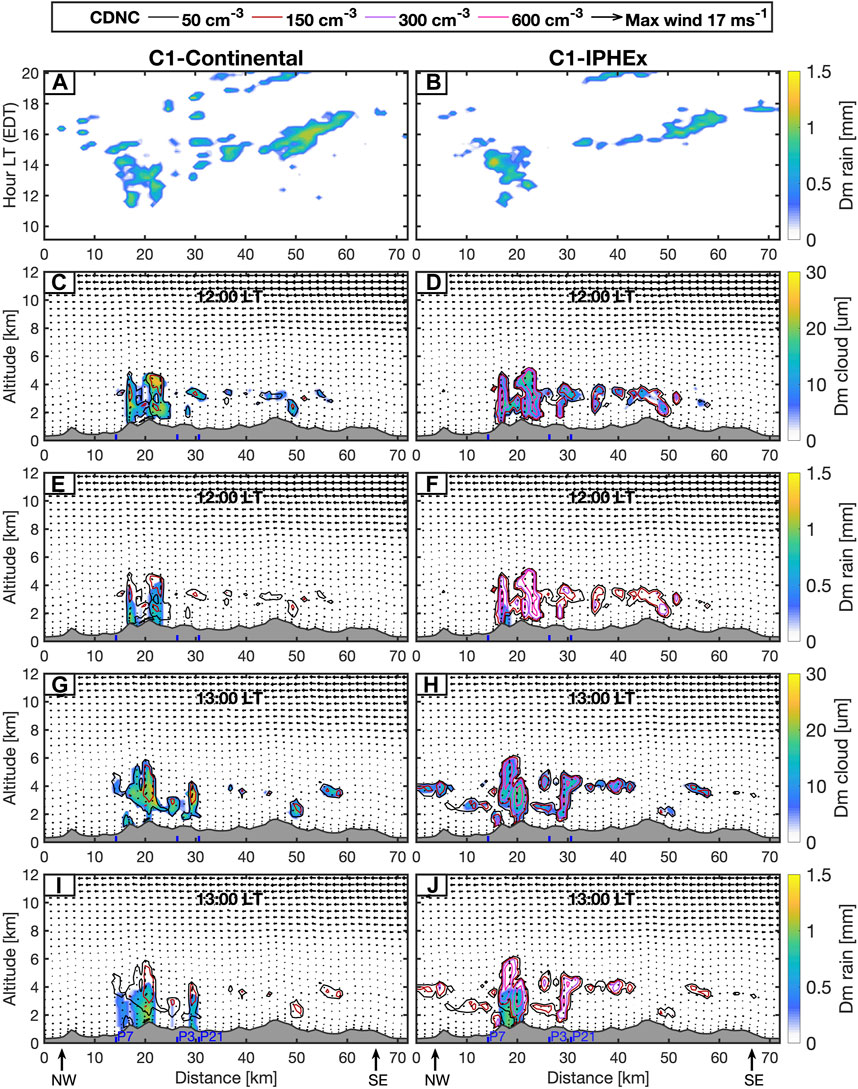
FIGURE 9. Case 1 simulation. Panels (A) and (B) show Hovemӧller diagrams of Continental and IPHEx rain along the cross-section marked in Figure 3 during the period (9-20 LT). Panels (C–J) show snapshots of cloud and rain Dm fields along the same cross-section during the onset of rainfall and 1 hour later (at 12 and 13 LT). Colored contours are for CDNC with the magnitude increasing from black to pink as indicated in the legend. Winds are projected in the direction of the cross-section. The maximum wind scale is shown in the legend. Blue lines at the bottom of each panel are the locations of disdrometers. The cross-section is oriented NW to SE (Figure 3) as marked in the x-axis of the bottom row plots.
The vertical structure of cloud and rain Dm are analyzed to investigate the role of microphysics in the difference in the timing of the onset of precipitation between Continental and IPHEx simulations for Case 1 (Figure 6A) versus no relative delay for Cases 2 and 3 (Figures 6B, C). Figures 9, 10, 11 show cross-sections (marked in Figure 3) of cloud and rain Dm fields at the hour of precipitation onset and 1 hour later based on rain gauge observations over the Pigeon Basin (Figure 6A). For reference, distances 10–45 in the x-axis are in the PRB. In Case 1 cloud Dm values are larger (up to 25 μm) for Continental than IPHEx (up to 18 μm), and CDNC values for IPHEx are up to 600 cm−3 in contrast with 300 cm−3 for Continental (Figures 9C, D, G, H). In addition, from the cross-sections, the area of the clouds in IPHEx is more extensive than in Continental, while the area of rain and rain Dm are smaller for IPHEx than Continental. Note that despite high CDNC at P3 (x ∼ 27 km) at 13:00 LT in IPHEx, no rain is produced at the ground, whereas Continental produces rainfall due to the much larger cloud Dm (25 μm vs. 10 μm). Low-level clouds and valley fog do not form due to the lack of low-level moisture convergence tied to the very weak winds from the surface to 8 km. Orographic enhancement effects explain the clouds and rainfall over the western ridges (x∼20 km). Therefore, in agreement with the aerosol first and second indirect effects, we found that more activation of aerosols in IPHEx compared to Continental produces a larger number of small cloud droplets. These droplets reduce the precipitation efficiency (smaller rain Dm and rain areas), leading to the delay of the onset of warm rain and a decrease in the accumulated rainfall.
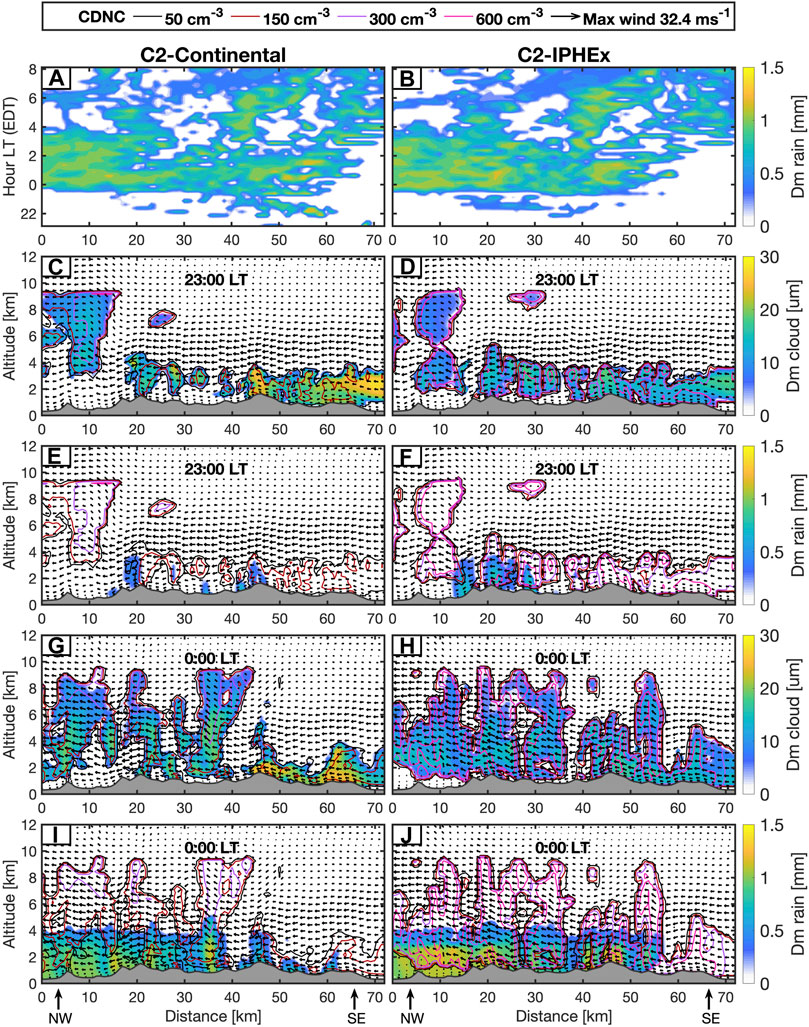
FIGURE 10. Same as Figure 9 for Case 2.
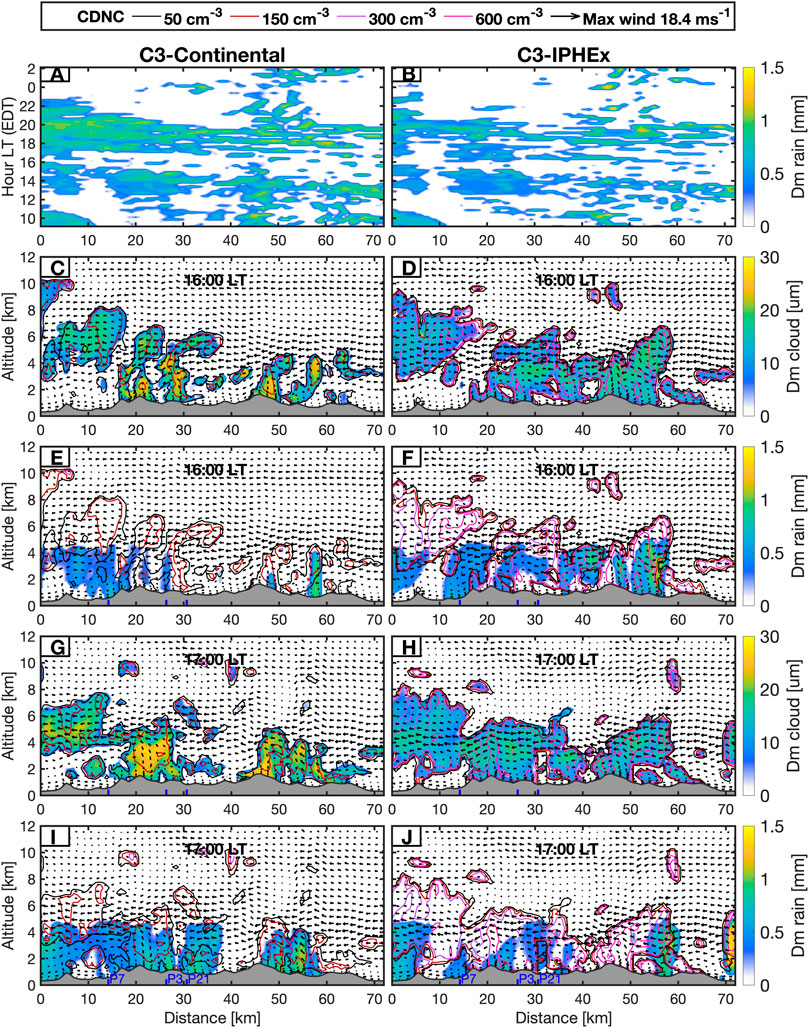
FIGURE 11. Same as Figure 9 for Case 3.
For Cases 2 and 3, the large-scale circulation is organized by the SAM topography resulting in easterly winds that are aligned with the cross-section. In Case 2, CDNC values are larger in IPHEx than continental (Figure 10), and clouds are deeper and more widespread. Despite smaller cloud Dm, greater rain Dm values are observed for IPHEx than for Continental, suggesting enhanced auto-conversion and accretion in IPHEx than in Continental associated with the large-scale moisture convergence (Wilson and Barros, 2017). For Case 3, Figure 11 shows that, similarly to Case 2, the CDNC values are larger, clouds are deeper and more widespread and cloud Dm values are smaller in IPHEx than in Continental. However, in Case 3 there is no significant difference in rain Dm values between IPHEx and Continental. Figures 10, 11 show that for the two large scale Cases 2 and 3, there is no difference in the timing of precipitation onset (similar rain Dm and rain areas) associated to mechanically forced rainfall efficiency at the time of storm arrival to the Pigeon River Basin. In Case 2, 1 hour after of the arrival of the storm at 00 LT, larger rain Dm values in IPHEx than in Continental explain the higher rainfall accumulation in the IPHEx run (Figure 6B; Supplementary Figure S4). In Case 3, the rain areas in the Continental run are larger than IPHEx (Supplementary Figure S3) explaining higher rainfall accumulations in the Continental run (Figure 6C). In summary, there is no delay in the onset of precipitation in IPHEx relative to Continental for Cases 2 and 3. However, the aerosol impact in the rain Dm, rainfall area and ice processes leads to differences in cumulative rainfall (Figures 6B, C).
4.2.2 Vertical structure of winds
To examine further the signature of ACPI processes on the onset of precipitation and precipitation efficiency, the vertical distribution of latent heating and radar reflectivity from the Continental and IPHEx simulations are examined. Below the zero degrees isotherm located around 4,000 m, the vertical distribution of latent heat reveals regions of condensation and evaporation. Above 4,000 m, mixed clouds add complexity. In the following analysis, we focus on warm rain and orographic enhanced rain below 4,000 m. Radar reflectivity, hereafter reflectivity, allows us to identify embedded convection. Figure 12 shows a convective cloud developing over the western region (x ∼ 20 km) in Case 1. In both Continental and IPHEx simulations, there is condensation in the updraft (positive latent heat). The reflectivity values at the convective core are at least 5 dBZ higher for Continental at the onset of precipitation (12 LT); 1 hour later, they are comparable. The arrival of the frontal system (Case 2) at 23 LT with strong horizontal winds at low and mid-levels (0.4–6 km altitude) leads to the formation of cumulus clouds over each ridge, and updrafts in the windward slopes of those ridges. The positive values of latent heat on the windward slopes (Figure 13) indicate condensation by cooling of uplifted air parcels driven by the strong horizontal winds (up to 32 m s−1) at low levels (0.4—4 km). The negative latent heat values on the leeward slopes show the evaporation of cloud and rain droplets (see Figure 10), which is characteristic of mechanically forced orographic rainfall. The rapid increase in accumulated rainfall after 16 LT (Figure 6C) coincides with the arrival of a spiral rainband of tropical storm Fred (Case 3, Figure 14). However, precipitation was happening hours before, as shown by the Hovmöller diagram of rain Dm (Figures 11A, B). The spatial patterns in Figures 13, 14 show similarities between Cases 2 and 3: clouds develop over preferred regions (at 20, 30, and 45 km), and latent heat values are positive in the updraft regions on the windward slopes. However, a significant difference between the two cases is the wind speed and vertical structure. There is directional wind shear in Case 3 (stronger for IPHEx) with westerly winds at lower levels and a mid-level easterly jet aloft that steps up over the western ridges in the Continental run due to the orographic enhancement of a rainband with embedded convection locked to upwind east-facing slopes. This feature explains the higher rainfall intensities and longer duration of precipitation over the SAM in the Continental run, as previously noted in the context of Supplementary Figure S4. High wind shear and stronger low-level westerly winds in the IPHEx run are not favorable to precipitation in the inner mountain region.
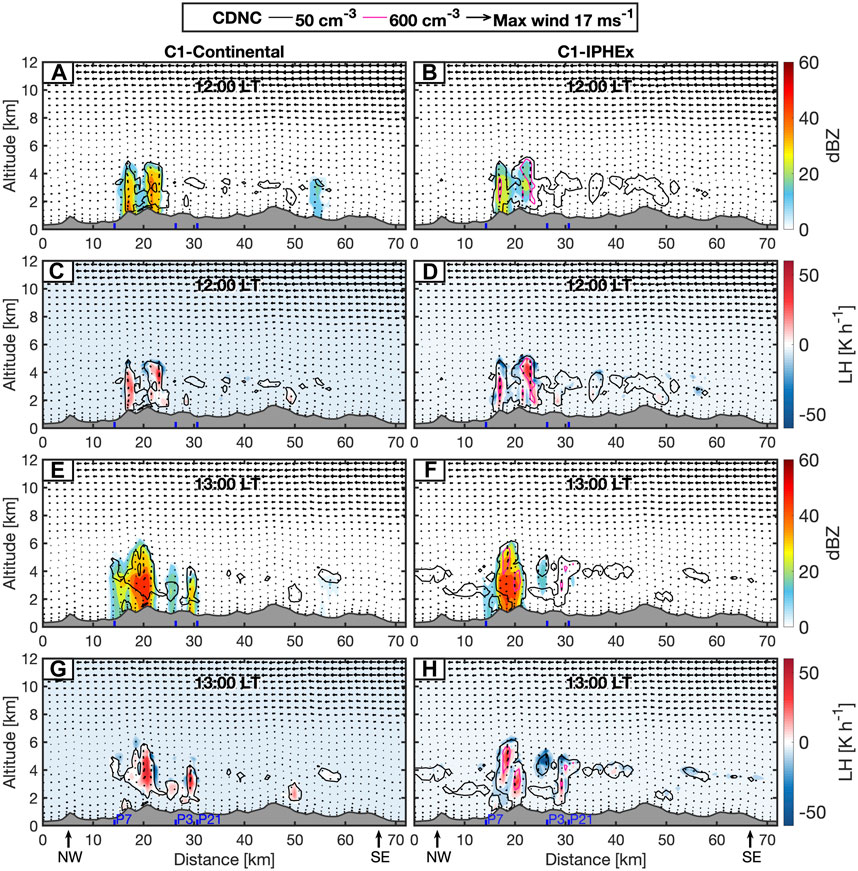
FIGURE 12. For Case 1, radar reflectivity in dBZ, CDNC contours as indicated in the legend, and latent heating (LH) in K h-1 along the cross-section marked in Figure 3 from Continental and IPHEx simulations around the time of rainfall onset (12 LT, panels (A–D)) and 1 hour later (13 LT, panels (E–H)). Winds are projected in the direction of the cross-section. The maximum wind scale is shown in the legend. The cross-section is oriented NW to SE (Figure 3) as marked in the x-axis of the bottom row plots.
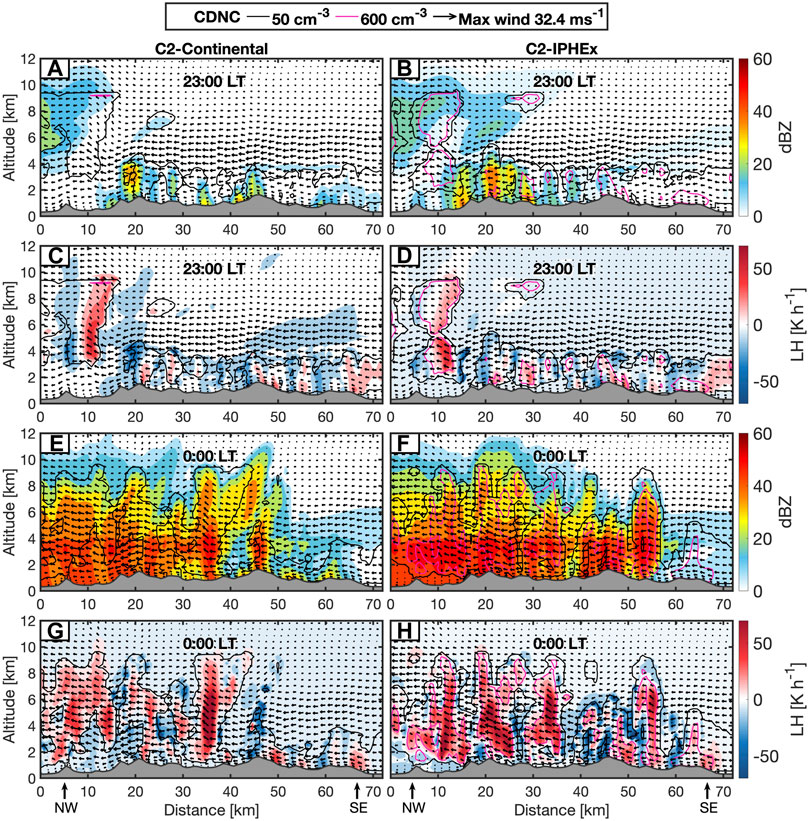
FIGURE 13. Same as Figure 12 for Case 2.
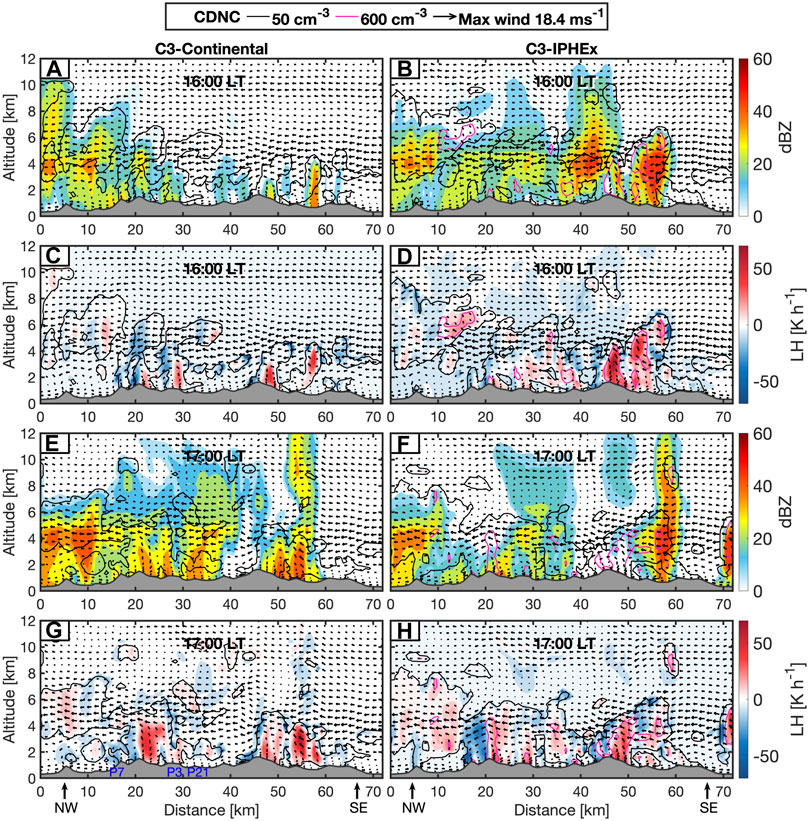
FIGURE 14. Same as Figure 12 for Case 3.
In Case 1, the clouds are tied to small updraft regions driven by thermodynamics in almost neutral wind conditions. In Case 2, the formation of precipitating clouds is driven by westerly horizontal winds over the topography, mechanically driving cloud formation and orographic precipitation overcoming the thermodynamics. Furthermore, Case 2 convective cells have larger reflectivity values and extensive cloud formation, suggesting more vertical transport of water to upper levels with the release of latent heat up to 8 km invigorating the cloud system. In Case 3, mechanically forced orographic precipitation takes place, but in contrast with Case 2, directional wind shear and IPHEx ACPI weaken embedded convection at lower levels. These characteristics indicate that higher-level invigoration occurs in Case 2 but not in Case 3.
4.2.3 Landform organization of aerosol-cloud interactions
The role of landform controls on moisture convergence, cloud, and precipitation processes in the SAM (Wilson and Barros, 2015) and the impact of Aerosol-Cloud Interactions (ACI) on the spatial organization of cloud systems is examined here by contrasting IPHEx and Continental simulations for different landform classes (Supplementary Figure S3). Figure 15 shows the temporal variability of CDNC over ridges, valleys, and the adjacent SAM plains (Piedmont) for the three weather regimes at the relevant time-of-day. Albeit with CDNC concentrations 3–4 times higher in IPHEx, the temporal evolution and vertical structure of CDNC distributions in the inner region valleys and ridges exhibit the same patterns in both simulations. This suggests the dynamic feedback of ACPI is not significant, and thus the thermodynamic effect prevails overall.
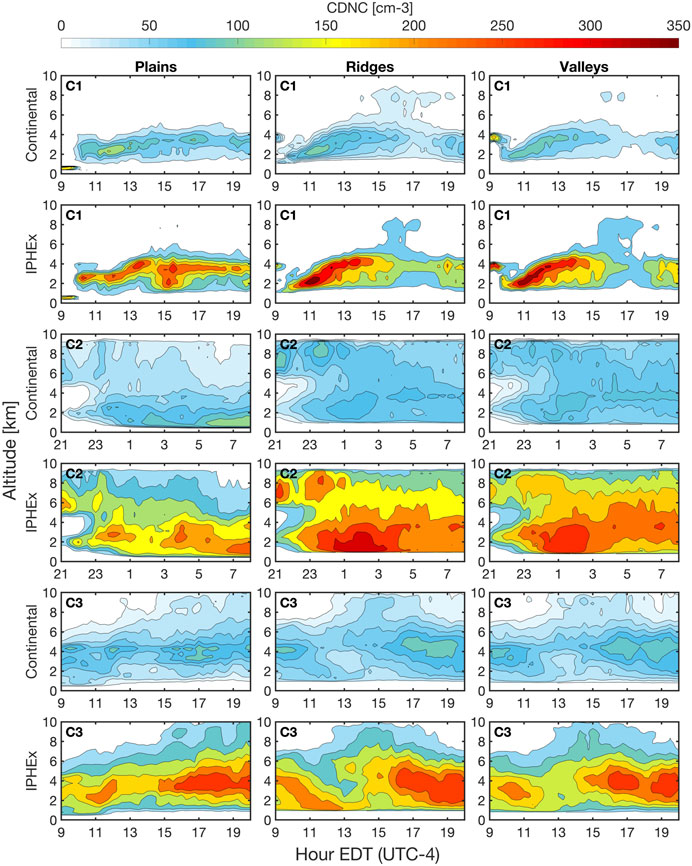
FIGURE 15. Temporal evolution of the mean values of cloud drop number noncentration (CDNC) vertical profiles for different landform classes as defined in Supplementary Figure S3 for Continental and IPHEx simulations and for the 3 study cases (C1, C2, C3): left column—Plains; mid column—Ridges; right column—Valleys.
Smaller values of CDNC are always observed in both simulations in the plains to the west and east of the SAM in contrast with the orographic enhancement effects on cloud development over the mountains. In the inner region, CDNC is lower at lower elevations in the valleys than in the ridges, except for the enhanced convection case (C1) in IPHEx in keeping with observations (e.g., Wilson and Barros, 2014; Arulraj and Barros, 2019). C1 CDNC values around 100 cm−3 over the ridges are already present around 9–10 ETD and peak at 350 cm−3 by mid-day followed by mixing and upward transport tied to the diurnal cycle of convection. CDNC maxima at mid-day, along with higher cloud water mixing ratio and smaller mass-weighted cloud droplet size peak (not shown), are consistent with the regional climatology of LLCF (e.g., Duan and Barros, 2017). The passage of two rainbands associated with tropical Storm Fred, by then a tropical depression, is apparent from the CDNC peaking in the morning and then in the afternoon in C3. The difference in rainfall intensity increases after local noon and is maximum after 4 p.m. EDT when the large numbers of CDNC for IPHEx result in very small cloud droplet sizes (<25 μm, Figure 11), strongly reducing raindrop the effectiveness of coalescence processes and thus rainfall intensity. For Case 2, values of CDNC around 200–250 cm−3 reach altitudes up to 9 km at the onset of precipitation, consistent with storm invigoration due to latent heat release by condensation and freezing of cloud and rain droplets (e.g., Barros et al., 2018).
5 Conclusion
This study builds on previous work examining Aerosol-Cloud-Precipitation-Interactions (ACPI) interactions in complex terrain by contrasting simulations using generic CCN activation spectra with simulations using local activation CCN spectra. In the Himalayas (Shrestha et al., 2013) as in the Southern Appalachians (Duan et al., 2019), CCN activation spectra are significantly steeper at low supersaturations than typical Continental and marine aerosol, which has a significant impact on cloud formation and development. Whereas these differences are not uniquely tied to topography and instead reflect the hygroscopic properties of regional aerosol sources, emissions, and transport, they point to the importance of CCN activation to capture the diurnal cycle of clouds and precipitation at high spatial resolution and short time-scales, and to characterize the diurnal cycle of orographic ACPI. Steeper activation spectra result in larger CDNCs at lower levels and smaller cloud droplet sizes, delaying the onset of warm rainfall, and sustaining more persistent cloudiness.
High atmospheric moist convergence favors cloud development and precipitation. Due to the lack of explicit microphysics, stochastic drop-drop interactions process such as coalescence and seeder-feeder interactions (SFI) cannot be captured in WRF. This explains the lack of low-level clouds in either IPHEx or Continental simulations, which in turn leads to lower rainfall efficiency for IPHEx simulations except in C2 when moist convergence is not the limiting factor, the precipitation rate is determined by liquid water mass in the cloud. When moist convergence is the limiting factor (e.g., C1 and C3), the delay and underestimation of precipitation by the model is tied to the missing microphysics.
Increasing the aerosol activation in IPHEx simulations produce a higher cloud drop number concentration (CDNC) than Continental simulations. Having higher concentrations of small droplets would be expected to delay rainfall onset by reducing coalescence rate and rainfall efficiency in warm rain according to the second aerosol indirect effect. Larger values of CDNC and smaller mass-weighted mean diameters (Dm) are estimated in all 3 IPHEx cases. However, a delay of 30–60 min in the onset of precipitation occurs only in Case 1 when horizontal winds at low levels (0.4–4 km altitude) are weak and clouds are driven by thermodynamics. Strong horizontal winds (up to 32 ms−1) force mechanically driven orographic precipitation for Cases 2 and 3, a frontal wave and a tropical depression, respectively. Therefore, there is no delay in the onset of precipitation. The main difference between the frontal system and the tropical depression is that when they impinge upon the SAM, the wind speeds of the frontal system are almost double those of the tropical system at low levels enabling more moisture convergence and vertical transport that invigorates the system producing stronger, deeper embedded convection.
Furthermore, when differentiating by plains, ridges, and valleys, the CDNC is very different between the inner region of SAM (ridges and valleys) and the adjacent plains, showing higher values of CDNC reaching higher altitudes in the inner region with respect to the plains. These results agree with the orographic effect and landform control on moisture convergence and cloudiness reported by previous studies (Duan et al., 2015; Wilson and Barros, 2015; Wilson and Barros, 2017), and the dynamic feedback of ACPI can be neglected at regional scale. The comparison against IPHEx aircraft data for C1 revealed that where and when clouds form, using IPHEx aerosols results in realistic subgrid scale variability of CDNC.
These results highlight the complexity of the ACPI processes and the limiting role of moist convergence that governs atmospheric moisture supply vis-à-vis aerosols as found in other mountainous regions in the Island of Dominica (Nugent et al., 2016), the European Alps (Napoli et al., 2019). If moisture supply is abundant, then aerosol properties constrain the vertical structure and spatial heterogeneity of cloud microphysics that determine precipitation efficiency. Along the upwind slopes of mountains, when moisture supply is abundant due to incoming air masses and strong updrafts that result from the compounding effect of orographic lifting and atmospheric instability, activated CCN determines the vertical structure of hydrometeors, and thus CCN availability and the pace of CCN activation are the limiting factors of rainfall efficiency (C2). When moisture supply is limited (C3), the formation of LLC and SFI is essential to achieve high rainfall efficiency. That is, the model cannot simulate key ACPI, which explains the lower rainfall efficiency in IPHEx. This analysis highlights the challenges of rainfall efficiency calibration in models separately from the underlying processes.
In the eastern slopes of the Andes in the Western Amazon, previous studies using Continental aerosol reported severe underestimation of precipitation rates at hot spots of orographic precipitation (Espinoza et al., 2015; Chavez and Takahashi, 2017; Eghdami and Barros, 2019; Chavez et al., 2020). Furthermore, aerosol-cloud-radiation feedbacks modify the land-surface energy budget and establish gradients in surface temperature and surface fluxes can either enhance or suppress updrafts. Differences in surface skin temperature between Continental and IPHEx on June 12 at mid-day of up to ± 8°C (Supplementary Figure S5), with IPHEx being cooler over the ridges and warmer in the valleys, are consistent with the cloud climatology in the SAM (Duan and Barros, 2017). This significantly impacts surface hydrology and the latent and sensible heat fluxes and thus regional microclimate. Further research on this region is underway, motivated by the reports of aerosol concentrations changing at a fast pace due to anthropogenic factors and rampant deforestation that impact instability in the lower troposphere and upslope moisture transport (Sun and Barros, 2015).
Data availability statement
Publicly available datasets were analyzed in this study. This data can be found here: https://ghrc.nsstc.nasa.gov/home/field-campaigns/iphex/instruments1.
Author contributions
The research plan was designed by AB building on preliminary work by Duan (2017) and Barros et al. (2018). SC implemented the research plan, performed WRF simulations, and processed data. SC and AB conducted analysis and interpretation of the results. The two authors worked collaboratively in the preparation of the manuscript.
Funding
This research was supported in part by NASA Grant 80NSSC19K0685 with the second author.
Acknowledgments
The first author acknowledges support from ProCiencia Peru for his doctoral fellowship (Contract No. 2017-14).
Conflict of interest
The authors declare that the research was conducted in the absence of any commercial or financial relationships that could be construed as a potential conflict of interest.
Publisher’s note
All claims expressed in this article are solely those of the authors and do not necessarily represent those of their affiliated organizations, or those of the publisher, the editors and the reviewers. Any product that may be evaluated in this article, or claim that may be made by its manufacturer, is not guaranteed or endorsed by the publisher.
Supplementary material
The Supplementary Material for this article can be found online at: https://www.frontiersin.org/articles/10.3389/feart.2023.1025266/full#supplementary-material
SUPPLEMENTARY FIGURE S1 | MRR radar and W band radar measurements during June 12–13 of 2014.
SUPPLEMENTARY FIGURE S2 | Aircraft observations over the Pigeon basin. The gray mesh is the terrain, and the red lines are the aircraft path inside the pigeon basin. The circles’ sizes and colors represent the values of cloud droplet number concentration (CDNC) and liquid water content (LWC).
SUPPLEMENTARY FIGURE S3 | On the top left, the SAM terrain elevation corresponds to the fourth WRF Domain. The location of disdrometers P3, P7, and P21 along a cross-section (black line) is shown as black cross and green and blue circles, respectively. On the top right, the classification of the terrain in plains, valleys/slopes, and ridges. On the bottom, the rain Dm values measured by the disdrometers.
SUPPLEMENTARY FIGURE S4 | Maps of accumulated rain during 1-hour intervals, hours in eastern daylight time (EDT) for Continental and IPHEx simulations for C2, and C3. The orange and gray lines are the topographic contour of 500 m and 1000 m, respectively. The Pigeon basin is delimited using a black line.
SUPPLEMENTARY FIGURE S5 | Skin surface temperature difference between Continental and IPHEx between 14–16 LT.
Footnotes
1Tropical Storm Fred Heavy Rainfall and Flooding (weather.gov).
References
Andreae, M. O., Rosenfeld, D., Artaxo, P., Costa, A. A., Frank, G. P., Longo, K. M., et al. (2004). Smoking rain clouds over the Amazon. Science 303 (5662), 1337–1342. doi:10.1126/science.1092779
Arulraj, M., and Barros, A. P. (2019). Improving quantitative precipitation estimates in mountainous regions by modelling low-level seeder-feeder interactions constrained by Global precipitation measurement dual-frequency precipitation radar measurements. Remote Sensing of Environment 231, 111213. doi:10.1016/j.rse.2019.111213
Barros, A. P., Petersen, W., Schwaller, M., Cifelli, R., Mahoney, K., Peters-Liddard, C., et al. (2014). NASA GPM- ground validation: Integrated precipitation and hydrology experiment 2014 science plan. Durham, NC: EPL/Duke University, 64. doi:10.7924/G8CC0XMR
Barros, A. P., Shrestha, P., Chavez, S., and Duan, Y. (2018). Modeling aerosol-cloud-precipitation interactions in mountainous regions: Challenges in the representation of indirect microphysical effects with impacts at subregional scales, in Rainfall - extremes, distribution and properties. London, United Kingdom: IntechOpen. Online: https://www.intechopen.com/chapters/62952. doi:10.5772/intechopen.80025
Bell, T. L., Rosenfeld, D., Kim, K., Yoo, J., Lee, M., and Hahnenberger, M. (2008). Midweek increase in U.S. summer rain and storm heights suggests air pollution invigorates rainstorms. J. Geophys. Res. Atmos. 113 (D2), 113. doi:10.1029/2007jd008623
Borys, R. D., Lowenthal, D. H., and Mitchell, D. L. (2000). The relationships among cloud microphysics, chemistry, and precipitation rate in cold mountain clouds. Atmos. Environ. 34 (16), 2593–2602. doi:10.1016/s1352-2310(99)00492-6
Borys, R. D., Lowenthal, D. H., Cohn, S. A., and Brown, W. O. J. (2003). Mountaintop and radar measurements of anthropogenic aerosol effects on snow growth and snowfall rate. Geophys. Res. Lett. 30 (10). doi:10.1029/2002gl016855
Brun, J., Shrestha, P., and Barros, A. P. (2011). Mapping aerosol intrusion in himalayan valleys using the moderate resolution imaging spectroradiometer (MODIS) and cloud-aerosol lidar and infrared pathfinder satellite observation (CALIPSO). Atmos. Environ. 45, 6382–6392. doi:10.1016/j.atmosenv.2011.08.026
Chavez, S. P., and Takahashi, K. (2017). Orographic rainfall hot spots in the Andes-Amazon transition according to the TRMM precipitation radar and in situ data. J. Geophys. Res. Atmos. 122 (11), 5870–5882. doi:10.1002/2016jd026282
Chavez, S. P., Silva, Y., and Barros, A. P. (2020). High-elevation monsoon precipitation processes in the central Andes of Peru. J. Geophys. Res. Atmos. 125 (24). doi:10.1029/2020jd032947
Cohard, J., and Pinty, J. (2000). A comprehensive two-moment warm microphysical bulk scheme. I: Description and tests. Q. J. R. Meteorological Soc. 126 (566), 1815–1842. doi:10.1002/qj.49712656613
Cohard, J.-M., Pinty, J.-P., and Bedos, C. (1998). Extending twomey's analytical estimate of nucleated cloud droplet concentrations from CCN spectra. J. Atmos. Sci. 55 (22), 3348–3357. doi:10.1175/1520-0469(1998)055<3348:etsaeo>2.0.co;2
Duan, Y., and Barros, A. P. (2017). Understanding how low-level clouds and fog modify the diurnal cycle of orographic precipitation using in situ and satellite observations. Remote Sens. 9 (9), 920. doi:10.3390/rs9090920
Duan, Y., Wilson, A. M., and Barros, A. P. (2015). Scoping a field experiment: Error diagnostics of TRMM precipitation radar estimates in complex terrain as a basis for IPHEx2014. Hydrology Earth Syst. Sci. 19 (3), 1501–1520. doi:10.5194/hess-19-1501-2015
Duan, Y., Petters, M. D., and Barros, A. P. (2019). Understanding aerosol–cloud interactions through modeling the development of orographic cumulus congestus during IPHEx. Atmos. Chem. Phys. 19 (3), 1413–1437. doi:10.5194/acp-19-1413-2019
Duan, Y. (2017). Mapping the impact of aerosol-cloud interactions on cloud formation and warm-season rainfall in mountainous regions using observations and models. Dissertation. Durham, NC: Duke University. Available at: https:/hdl.handle.net/10161/16307.
Eghdami, M., and Barros, A. P. (2019). Extreme orographic rainfall in the eastern Andes tied to cold air intrusions. Front. Environ. Sci. 7, 101. doi:10.3389/fenvs.2019.00101
Espinoza, J. C., Chavez, S., Ronchail, J., Junquas, C., Takahashi, K., and Lavado, W. (2015). Rainfall hotspots over the southern tropical Andes: Spatial distribution, rainfall intensity, and relations with large-scale atmospheric circulation. Water Resour. Res. 51 (5), 3459–3475. doi:10.1002/2014wr016273
Fan, J., Leung, L. R., Rosenfeld, D., and DeMott, P. J. (2016). Effects of cloud condensation nuclei and ice nucleating particles on precipitation processes and supercooled liquid in mixed-phase orographic clouds. Atmos. Chem. Phys. 17 (2), 1017–1035. doi:10.5194/acp-17-1017-2017
Halder, M., Hazra, A., Mukhopadhyay, P., and Singh, D. (2015). Effect of the better representation of the cloud ice-nucleation in WRF microphysics schemes: A case study of a severe storm in India. Atmos. Res. 154, 155–174. doi:10.1016/j.atmosres.2014.10.022
Henriksson, S., Pietikäinen, J.-P., Hyvärian, S., Räisänen, P., Kupiainen, K., Tonttla, J., et al. (2014). Spatial distributions and seasonal cycles of aerosol climate effects in India seen in a global-climate-aerosol model. Atmos. Chem. Phys. 14, 10177–10192. doi:10.5194/acp-14-10177-2014
Iacono, M. J., Delamere, J. S., Mlawer, E. J., Shephard, M. W., Clough, S. A., and Collins, W. D. (2008). Radiative forcing by long-lived greenhouse gases: Calculations with the AER radiative transfer models. J. Geophys. Res. Atmos. 113 (D13), 113. doi:10.1029/2008jd009944
Iguchi, T., Nakajima, T., Khain, A. P., Saito, K., Takemura, T., and Suzuki, K. (2008). Modeling the influence of aerosols on cloud microphysical properties in the East Asia region using a mesoscale model coupled with a bin-based cloud microphysics scheme. J. Geophys. Res. Atmos. 113 (D14), 113. doi:10.1029/2007jd009774
Kain, J. S. (2004). The kain–fritsch convective parameterization: An update. J. Appl. Meteorology 43 (1), 170–181. doi:10.1175/1520-0450(2004)043<0170:tkcpau>2.0.co;2
Khain, A., and Lynn, B. (2009). Simulation of a supercell storm in clean and dirty atmosphere using weather research and forecast model with spectral bin microphysics. J. Geophys. Res. Atmos. 114 (D19), 11827. doi:10.1029/2009jd011827
Khain, A., Rosenfeld, D., and Pokrovsky, A. (2005). Aerosol impact on the dynamics and microphysics of deep convective clouds. Q. J. R. Meteorological Soc. 131 (611), 2639–2663. doi:10.1256/qj.04.62
Khain, A. P., BenMoshe, N., and Pokrovsky, A. (2008). Factors determining the impact of aerosols on surface precipitation from clouds: An attempt at classification. J. Atmos. Sci. 65 (6), 1721–1748. doi:10.1175/2007jas2515.1
Khain, A., Rosenfeld, D., Pokrovsky, A., Blahak, U., and Ryzhkov, A. (2011). The role of CCN in precipitation and hail in a mid-latitude storm as seen in simulations using a spectral (bin) microphysics model in a 2D dynamic frame. Atmos. Res. 99 (1), 129–146. doi:10.1016/j.atmosres.2010.09.015
Lau, K.-M., Tsay, S. C., Hsu, C., Chin, M., Ramanathan, V., Wu, G.-X., et al. (2008). The joint aerosol–monsoon experiment: A new challenge for monsoon climate research. Bull. Am. Meteorological Soc. 89 (3), 369–384. doi:10.1175/bams-89-3-369
Lohmann, U., and Feichter, J. (2005). Global indirect aerosol effects: A review. Atmos. Chem. Phys. 5 (3), 715–737. doi:10.5194/acp-5-715-2005
Lohmann, U., and Hoose, C. (2009). Sensitivity studies of different aerosol indirect effects in mixed-phase clouds. Atmos. Chem. Phys. 9 (22), 8917–8934. doi:10.5194/acp-9-8917-2009
Lynn, B., Khain, A., Rosenfeld, D., and Woodley, W. L. (2007). Effects of aerosols on precipitation from orographic clouds. J. Geophys. Res. Atmos. 112 (D10). doi:10.1029/2006jd007537
Magagi, R., and Barros, A. P. (2004). Estimation of latent heating of rainfall during the onset of the Indian monsoon using TRMM PR and radiosonde data. J. Appl. Meteorology 43 (2), 328–349. doi:10.1175/1520-0450(2004)043<0328:eolhor>2.0.co;2
Milbrandt, J. A., and Yau, M. K. (2005). A multimoment bulk microphysics parameterization. Part II: A proposed three-moment closure and scheme description. J. Atmos. Sci. 62 (9), 3065–3081. doi:10.1175/jas3535.1
Muhlbauer, A., Hashino, T., Xue, L., Teller, A., Lohmann, U., Rasmussen, R. M., et al. (2010). Intercomparison of aerosol-cloud-precipitation interactions in stratiform orographic mixed-phase clouds. Atmos. Chem. Phys. 10 (17), 8173–8196. doi:10.5194/acp-10-8173-2010
Nakanishi, M., and Niino, H. (2004). An improved mellor–yamada level-3 model with condensation physics: Its design and verification. Boundary-Layer Meteorol. 112 (1), 1–31. doi:10.1023/b:boun.0000020164.04146.98
Napoli, A., Crespi, A., Ragone, F., Maugeri, M., and Pasquero, C. (2019). Variability of orographic enhancement of precipitation in the Alpine region. Sci. Rep. 9 (1), 13352. doi:10.1038/s41598-019-49974-5
Nugent, A. D., Watson, C. D., Thompson, G., and Smith, R. B. (2016). Aerosol impacts on thermally driven orographic convection. J. Atmos. Sci. 73 (8), 3115–3132. doi:10.1175/jas-d-15-0320.1
Prat, O. P., and Barros, A. P. (2010). Ground observations to characterize the spatial gradients and vertical structure of orographic precipitation – experiments in the inner region of the Great Smoky Mountains. J. Hydrology 391 (1–2), 141–156. doi:10.1016/j.jhydrol.2010.07.013
Rosenfeld, D., and Givati, A. (2006). Evidence of orographic precipitation suppression by air pollution–induced aerosols in the western United States. J. Appl. Meteorology Climatol. 45 (7), 893–911. doi:10.1175/jam2380.1
Rosenfeld, D., Lohmann, U., Raga, G. B., O’Dowd, C. D., Kulmala, M., Fuzzi, S., et al. (2008). Flood or drought: How do aerosols affect precipitation? Science 321 (5894), 1309–1313. doi:10.1126/science.1160606
Saleeby, S. M., and Heever, S. C. van den. (2013). Developments in the CSU-rams aerosol model: Emissions, nucleation, regeneration, deposition, and radiation. J. Appl. Meteorology Climatol. 52 (12), 2601–2622. doi:10.1175/jamc-d-12-0312.1
Saleeby, S. M., Cotton, W. R., Lowenthal, D., Borys, R. D., and Wetzel, M. A. (2009). Influence of cloud condensation nuclei on orographic snowfall. J. Appl. Meteorology Climatol. 48 (5), 903–922. doi:10.1175/2008jamc1989.1
Seo, J. M., Lee, H., Moon, S., and Baik, J.-J. (2020). How Mountain geometry affects aerosol-cloud-precipitation interactions: Part I. Shallow convective clouds. J. Meteorological Soc. Jpn. Ser. II 98 (1), 43–60. doi:10.2151/jmsj.2020-003
Shrestha, P., and Barros, A. P. (2010). Joint spatial variability of aerosol, clouds, and rainfall in the Himalayas from satellite data. Atmos. Chem. Phys. 10, 8305–8317. doi:10.5194/acp-10-8305-2010
Shrestha, P., Barros, A. P., and Khlystov, A. (2013). CCN estimates from bulk hygroscopic growth factors of ambient aerosols during the pre-monsoon season over Central Nepal. Atmos. Environ. 67, 120–129. doi:10.1016/j.atmosenv.2012.10.042
Shrestha, P. (2011). Characterization of pre-monsoon aerosol and aerosol-cloud-rainfall interactions in Central Nepal. Dissertation, Durham, NC: Duke University. Available at: https://hdl.handle.net/10161/3836.
Sun, X., and Barros, A. P. (2015). Isolating the role of surface evapotranspiration on moist convection along the eastern flanks of the tropical Andes using a quasi-idealized approach. J. Atmos. Sci. 72 (1), 243–261. doi:10.1175/jas-d-14-0048.1
Tewari, M., Chen, F., Wang, W., Dudhia, J., Lemone, M. A., and Mitchell, K. E. (2004). “Implementation and verification of the unified Noah land-surface model in the WRF model [presentation],” in 20th conference on weather analysis and forecasting/16th conference on numerical weather prediction (Seattle, WA, US: American Meteorological Society).
Twomey, S. (1959). The nuclei of natural cloud formation part II: The supersaturation in natural clouds and the variation of cloud droplet concentration. Geofis. Pura Appl. 43 (1), 243–249. doi:10.1007/bf01993560
Wilson, A. M., and Barros, A. P. (2014). An investigation of warm rainfall microphysics in the southern Appalachians: Orographic enhancement via low-level seeder–feeder interactions. J. Atmos. Sci. 71 (5), 1783–1805. doi:10.1175/jas-d-13-0228.1
Wilson, A. M., and Barros, A. P. (2015). Landform controls on low level moisture convergence and the diurnal cycle of warm season orographic rainfall in the Southern Appalachians. J. Hydrology 531, 475–493. doi:10.1016/j.jhydrol.2015.10.068
Wilson, A. M., and Barros, A. P. (2017). Orographic land–atmosphere interactions and the diurnal cycle of low-level clouds and fog. J. Hydrometeorol. 18 (5), 1513–1533. doi:10.1175/jhm-d-16-0186.1
Xiao, H., Yin, Y., Chen, Q., and Zhao, P. (2016). Impact of aerosol and freezing level on orographic clouds: A sensitivity study. Atmos. Res. 176, 19–28. doi:10.1016/j.atmosres.2016.02.014
Keywords: aerosols, orographic rainfall, cloud microphysics, aircraft measurement, WRF (weather research and forecasting)
Citation: Chavez SP and Barros AP (2023) Aerosol indirect effects on orographic clouds and precipitation. Front. Earth Sci. 11:1025266. doi: 10.3389/feart.2023.1025266
Received: 22 August 2022; Accepted: 13 April 2023;
Published: 09 May 2023.
Edited by:
Andreas Franz Prein, National Center for Atmospheric Research (UCAR), United StatesReviewed by:
Hui Xiao, Guangzhou Institute of Tropical and Marine Meteorology (GITMM), ChinaRobert Oscar David, University of Oslo, Norway
Copyright © 2023 Chavez and Barros. This is an open-access article distributed under the terms of the Creative Commons Attribution License (CC BY). The use, distribution or reproduction in other forums is permitted, provided the original author(s) and the copyright owner(s) are credited and that the original publication in this journal is cited, in accordance with accepted academic practice. No use, distribution or reproduction is permitted which does not comply with these terms.
*Correspondence: Ana P. Barros, YmFycm9zQGlsbGlub2lzLmVkdQ==