 Wolfgang Stremme1*
 Michel Grutter1*
 Jorge Baylón1
 Noemie Taquet1
 Alejandro Bezanilla1Eddy Plaza-Medina1
 Benedetto Schiavo1
 Claudia Rivera1
 Thomas Blumenstock2Frank Hase2
- 1Insituto de Ciencias de la Atmosfera y Cambio Climatico, Universidad Nacional Autonoma de Mexico, Mexico, Mexico
- 2Insitute for Meteorology y Climate Research, Karlsruhe Insitute of Technology, Karlsruhe, Germany
Volcanic CO2 emissions inventories have great importance in the understanding of the geological carbon cycle. Volcanoes provide the primary pathway for solid-earth volatiles to reach the Earth’s atmosphere and have the potential to significantly contribute to the carbon-climate feedback. Volcanic carbon emissions (both passive and eruptive degassing) included in inventories, largely stem from patchy surface measurements that suffer from difficulties in removing the atmospheric background. With a 27-year-long ongoing open-vent eruption, Popocatépetl ranks as one of the highest permanent volcanic CO2 emitters worldwide and provides an excellent natural laboratory to design and experiment with new remote sensing methods for volcanic gas emission measurements. Since October 2012, infrared spectra at different spectral regions have been recorded with a solar occultation FTIR spectrometer. The near-infrared spectra allow for high precision measurements of CO2 and HCl columns. Under favorable conditions, the continuous observations during sunrise allow the reconstruction of a plume cross-section of HCl and the estimation of the emission flux using wind data. Despite that the detection of CO2 is more challenging, on April 26th, 2015 we captured a volcanic plume under favourable wind conditions which allowed us to reconstruct from this particular event a CO2 emission rate of 116.10 ± 17.2 kg/s. The volcanic HCl emission on this event was the highest detected during the 2012-2016 period. An annual average CO2 emission estimate of (41.2 ± 16.7) kg/s ((1.30 ± 0.53) Tg/yr) could be determined from a statistical treatment of the detected CO2 and HCl columns in the IR spectra, and their corresponding molecular ratios, during this period. A total of 25 events were used to derive a mean CO2/HCl molecule ratio of 11.4 ± 4.4 and an average HCl emission rate of (3.0 ± 0.3) kg/s could be determined. The CO2 emissions of Popocatépetl were found to be around 0.32% of the total anthropogenic CO2 emissions reported in the country and 3.6% of those corresponding to the Mexico City Metropolitan Area (MCMA). CO2 emissions from the Popocatépetl volcano can be considered to play a negligible role in the global CO2 budget, but should be taken into account.
1 Introduction
Located in Central Mexico and in the vicinity of highly populated urban centers, Popocatépetl is an active stratovolcano only 50 km SE from the Mexico City Metropolitan Area (MCMA) and 30 km SW from Puebla. Large pyroclastic flows have reached the MCMA in former epochs (Siebe et al., 1996) and after 70 years of dormancy the volcano reawakened in 1994, starting its current eruption. The current activity is characterized by permanent passive degassing, interrupted by periodic dacitic dome growth episodes accompanied by strombolian-type activity and Vulcanian explosions.
Popocatépetl is known to have one of the largest contributions of volcanic gas emissions worldwide (Gerlach, 1991), with a total SO2-emission between 1993 and 2001 that is estimated to surpass the accumulated SO2-emissions from the climatic 1991 eruption of Pinatubo (Delgado et al., 2001). In current years, Popocatépetl has been estimated to be among the top ten emitters, with around 2.8% of the total global volcanic SO2 emissions (McLinden et al., 2016). The SO2 plume of Popocatépetl has occasionally been detected by air quality monitoring stations in Mexico City (Raga et al., 1999; de Foy et al., 2009) and Puebla (Juarez et al., 2005) and, under certain meteorological conditions, it can impact regional air quality. Ash emissions from the volcano also affect local aviation.
Ground-based ultraviolet (UV) remote sensing techniques have shown to be effective in the measurement of SO2 gas emissions from this active volcano from a safe distance Fickel and Delgado Granados, (2017); Platt et al. (2018); Galle et al. (2010); Delgado et al. (2001); Grutter et al. (2008); Campion et al. (2012); Campion et al. (2018); Schiavo et al. (2019). Additionally, other volcanic trace gases such as HCl, HF, SiF4 have been detected in the Popocatépetl plume by passive infrared (IR) spectroscopy and give valuable information about this volcano (Love et al., 1998; 2000; Goff et al., 2001; Stremme et al., 2011; 2012; Taquet et al., 2017; 2019).
One of the most abundant volcanic gases, carbon dioxide (CO2) is difficult to measure with remote sensing techniques because the high atmospheric CO2 background concentration means that the relative contribution of volcanic plumes to the measured total atmospheric column is generally very small. On the other hand, in situ measurements are often associated with risk and are generally temporally sparse and spatially localized. Nevertheless, the CO2 signal from the Popocatépetl plume was detected in the past by passive IR spectroscopy (Goff et al., 2001) during extraordinarily strong CO2 emission episodes of 1998, for which the high CO2/SO2 ratios were interpreted to reflect a possible episodic assimilation of limestone during magma migration (Goff et al., 2001). These events were associated with very variable CO2/SO2 ratios and therefore the reported CO2 emission rate is most likely not a representative mean value. Emission rates of up to 100 Gg/d (36.5 Tg/yr) were calculated during this exhalation (Goff et al., 2001).
Aiuppa et al. (2019) combined the estimated CO2/SO2 molecular ratio of 8.2 (Aiuppa et al., 2017), which was based on earlier successful measurements Goff et al. (2001), together with the satellite-based SO2 flux estimate by McLinden et al. (2016) and Carn et al. (2017) in order to estimate an average CO2 emission from Popocatépetl of 9.284 Gg/day, 3.4 Tg/yr or 107 kg/s. However, the assumed volcanic CO2 emissions from earlier measurements of the CO2/SO2 ratio and the extrapolation to quiescent average out-gassing phases using more recent SO2 emission estimates could overestimate the CO2 contribution of Popocatépetl to the global carbon cycle Werner et al. (2019).
It is important to measurements (Goff et al., 2001), together CO2 during various days in the typical and more frequent passive degassing state of the volcanic activity in order to obtain more statistically solid results and gain knowledge of the role these prolonged volcanic emissions play in the local, regional and global carbon budget. In recent years, the remote sensing technique using solar absorption high-resolution spectroscopy in the near-infrared has gained sufficient precision to detect enhancements of the CO2 total column of less than one percent (Wunch et al., 2011). Instruments with lower spectral resolution (Gisi et al., 2012) using a similar measurement configuration have been successful in detecting CO2 enhancements in the volcanic plume of Mount Etna (Butz et al., 2017) during field campaigns of short duration. In that study, the CO2/HCl ratios and those of other molecular ratios showed high temporal variability.
In this work, we measured the volcanic gas composition from a fixed site during an extended time period using a high-resolution Fourier Transform Infrared (FTIR) spectrometer that has been used to document not only the atmospheric variability of CO2 (Baylon et al., 2017), but also ozone (Plaza-Medina et al., 2017) and various gases of volcanic origin (Taquet et al., 2019). This station, the Altzomoni Atmospheric Observatory, forms part of the Network for Detection of Atmospheric Composition Change (NDACC) (De Mazière et al., 2018). In this paper we include information about the site, instrumentation (Section 1.1), and about our measurement strategy (Section 2). Further on, we describe how the volcanic gas emission rate is reconstructed from the given information (Section 3.1). For a particular day (26 April 2015), we present the retrieval strategy (Section 2.2) and how to deal with the airmass dependence (Section 2.2), how to improve the precision of the derived molecular ratio (Section 2.3) and calculate the cross-section (Section 3.2) and emission rate (Section 3.3). In that section, we also describe how we combine the CO2/HCl molecular ratios and the HCl emission rates to obtain a statistically more significant estimation of the total CO2 emission (Section 3.5), to provide then a discussion of the principal uncertainties (Section 3.4). The results are finally presented in Section 3.6, discussed in Section 4, and the conclusions are provided in Section 5.
1.1 Site, instrument, and measurements
Our measurements are taken from the Altzomoni Atmospheric Observatory (19.1187°N, 98.655°W, 3,985 m a.s.l.) using a high-resolution FTIR spectrometer from Bruker, model IFS HR120/5, that contributes to NDACC (De Mazière et al., 2018). The high-altitude station is located 11 km away from the crater of Popocatépetl, as can be seen in Figure 1. A solar tracker (Gisi et al., 2011) directs the radiation of the Sun to the interferometer, which measures spectra with a 0.02 cm−1 resolution (optical path difference = 45 cm), as commonly used in the Total Carbon Column Observing Network (TCCON) (Wunch et al., 2011). In the near-infrared spectral region (NIR), an aperture of 0.8 mm is chosen, which results together with the 418 mm focal length of the focusing and collimating mirror in an external and internal field of view of 2 mrad (approx 0.1°). Thus, the field of view diameter is less than 1/5 that of the Sun (the Sun has a size of approx 10 mrad or 0.5°.). The internal divergence and resulting self-apodization are not critical for the used spectral resolution. The remotely-operated FTIR instrument is started manually by an operator and then programmed to continuously measure a sequence of filters and detectors covering the range from 600 cm−1 (17 μm) to 10,000 cm−1 (1 μm). For these measurements in the NIR region, both CaF2 and KBr beam splitters are utilized and an InGaAs detector records the signal of the interferograms (4,000 - 10,000 cm−1). Unlike the MCT and InSb detectors used for the mid-infrared (MIR), the InGaAs detector is not cooled by liquid nitrogen (LN2). All applied detectors are able to record the interferograms in direct current mode making it possible to monitor the solar intensity variations and correct them before the Fourier transformation is performed (Keppel-Aleks et al., 2007). These intensity variations originate from thin clouds, or specifically in our case, from the volcanic plumes that move across the field of view during a single measurement (time of the forward and backward scan is 30–40 s). The correction, which removes smoothed intensity fluctuations of the interferogram outside of the center burst, located at zero path difference, is realized in this work using routines from the “CALPY” software package (Kiel et al., 2016) and slightly improve the precision, Supplementary Section S2.
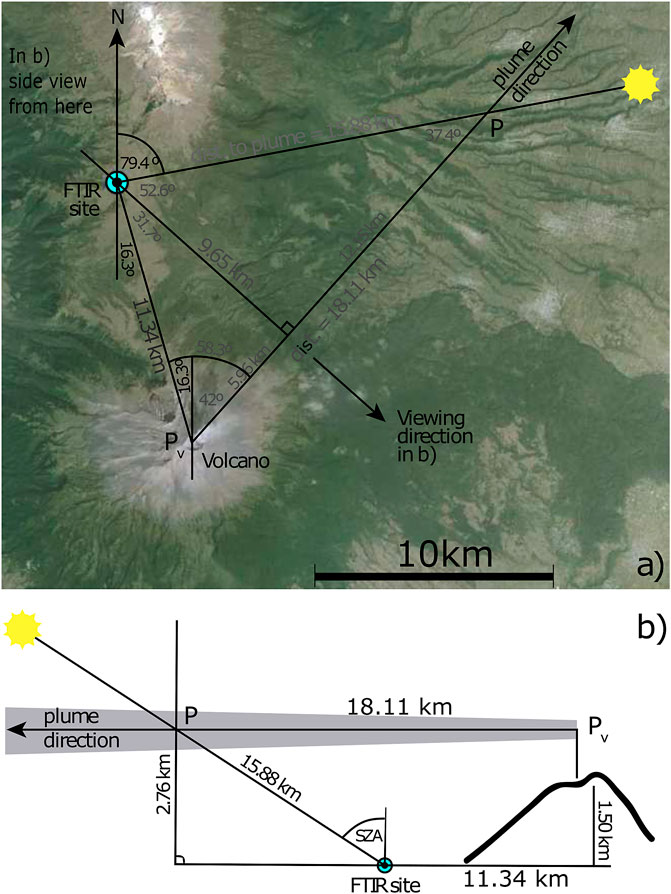
FIGURE 1. Observation geometry around the Popocatépetl volcano from two different perspectives at 06:45 LT on the morning of 26 April 2015: The top view in the upper panel (A) shows the plume propagation direction inferred from a wind direction = 222°. In the map, the FTIR site and the solar azimuth angle (79.4°) at that time are depicted, as well as the absolute distances from the measurement site to the plume position above the volcano (Pv) and at the point where the recorded solar radiation passed through the plume (P). (B) shows the side view with the observation site at the front looking perpendicularly towards the plume, while the instrument points to the rising sun. The side view illustrates how the solar beam reaching the instrument crossed the plume as the sun was rising. Again the absolute distances and heights are given for this particular event and are assumed constant while the sza decreased. A volcanic plume height of 2.76 km above the observation site was estimated from a plume distance at solar crossing point P of 15.88 km and a plume propagation direction towards 42.0° NE. The summit of Popocatépetl is located 1.5 km above the observation site.
Measurements are possible almost every morning, but rising clouds typically prevent measurements in the afternoon. As shown in Figure 2, predominant wind directions at pressure level 500 hPa (around 6 km a.s.l.) are west to east and east to west. However for the detection of the plume, wind towards the north (WD=180°) is necessary. Figure 2 shows the wind speed and direction on all days with concurrent HCl measurements. The wind data (500 hPa) are taken for the time at which the highest by PROFFIT96 calculated HCl vertical column of the corresponding day was measured. Of all measurement days, 14% (approx once per week) show a maximum HCl column greater than 1.5E17 Molec/cm2. This value is twice the median value μ (7.6E16 Molec/cm2) and ad hoc chosen to classify days with a clear volcanic signal in the measurements. The corresponding wind direction frequency distribution for days on which a volcanic plume was detected shows a distribution around the wind directions towards North. Applying different, stricter criteria for the classifying of days with volcanic event detection, as 3 or 4 times of the median value results in a subset of 10% or only 6% of all days being chosen, but the relative distribution of wind directions shows a similar pattern and is valid for the subset of 25 measurement days with a HCl slant columns
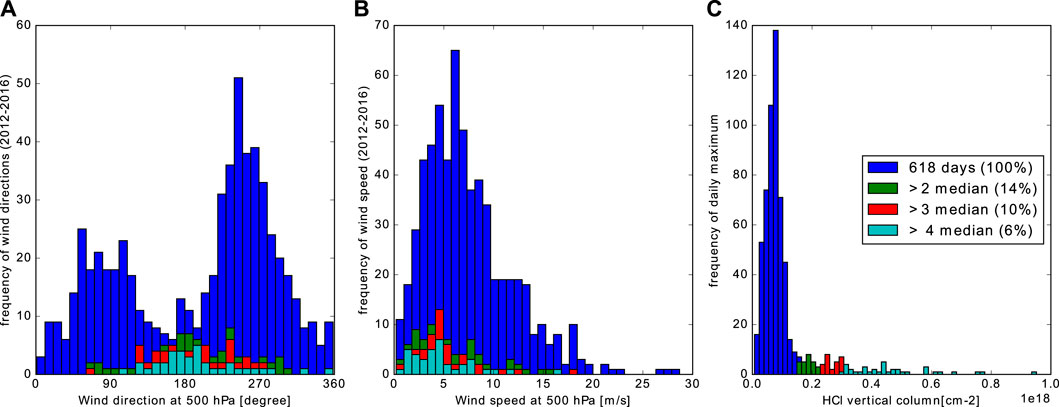
FIGURE 2. Frequency distribution of the meteorological Wind direction (A), Wind speed (B), and daily maximum of the vertical HCl columns (C). The maximum HCl column retrievals are classified into subgroups based on the frequency of their occurrence (C). The different colors represent measurement days for all measurements (blue), the highest 14% (green), highest 10% (red), or highest 6% (light blue). For these different sets of measurements, the histograms of the corresponding wind direction (WD) and windspeed (WS) are shown in panels (A, B). The retrieval errors of the HCl product, retrieved in the NIR, is larger than the vertical HCl column density of the atmospheric background. The wind direction and wind speed used here were obtained from North American Regional Reanalysis (NARR) simulations for the 500 hPa pressure level as also described in the text. The most frequent wind direction for measurement with a significant HCl enhancement is towards the North. The two general most frequent wind directions however are towards the east (WD=270°)and west (WD=90°).
2 Methodology
We present a new methodology to determine CO2 emission rates from volcanoes using solar absorption IR spectral measurements taken from a fixed site. Solar IR spectra are continuously measured while the direct sunlight passes through the volcanic plume, allowing for an enhancement in the slant column density of CO2 to be measured as a function of time. Accurate raytracing allowed for retrieving slant columns even for high
2.1 Solar occultation measurements of gas plumes: vertical column, slant column, plume cross-section and emission rates
In solar-tracking FTIR measurements all detected photons take the same light path and the slant column is well defined by the integration of the gas concentration along the line of sight. The vertical column is the vertical integral of the gas density independent from the observer geometry. The airmass factor is defined by the quotient of slant and vertical column and therefore approximately
According to the equation of continuity and the integrated form of the law of Gauss, the emission from a point source can be calculated by the integration of the flux through a closed surface around the point source. Typically we think in a cylinder or cone where only the sides contribute as the top is outside of the atmosphere.
Where E represents the emission rate in molecules per time, A represents the closed surface, ρ is the number density of the considered gas,
Platt and Stutz (2008); Galle et al. (2010); Platt et al. (2018) discuss in more detail different measurement geometries and measurement spectroscopic techniques using the photons scattered or emitted by the sky to calculate these integrals, plume cross-sections, and emission rates, as, for example, i) zenith sky DOAS from mobile platforms or ii) multi axis DOAS (MAXDOAS) using different viewing angles as done by the NOVAC network Galle et al. (2010). For solar absorption spectroscopy in the IR, our viewing angle has to follow the Sun and is identical to the solar zenith angle, and the plume cross-section is given by the integral iii) in Equation 4. It is calculated from the fixed site looking to the Sun and only under favorable conditions once a day. In contrast to the MAXDOAS, we are not able to choose a scanning geometry, but in principle, the plume cross-section is measured in principle the same way. Only a small area contributes to the integral of the closed surface so just this small part of the closed surface has to be measured. For gases with non-negligible atmospheric background concentration such as CO2, the part of the slant column which represents the recently emitted gas is calculated by subtracting the background column. The vertical columns are subtracted and afterward the corresponding slant column anomaly of the target gas is calculated. Inside the retrieval code (PROFFIT9.6), the ray-tracing in the atmosphere is calculated with high precision as already mentioned, but the calculation of the slant column anomaly from vertical column anomaly is done in this work using the simplified airmass factor 1/cos (sza). The solar zenith angle (sza) is the apparent solar zenith angle, the angle at which the instrument is aimed to align the field of view to the center of the Sun and the angle of the line of sight in the lower atmosphere.
The slant columns (HCl) or slant column enhancements above background (CO2) Δcol represent the integrated gas concentration (or gas concentration anomaly) along the line of sight. v⊥ is the wind velocity component perpendicular to the viewing angle and to
Similarly, we estimate the distance between the instrument and the plume center dist. During several minutes required to measure the full plume cross-section, the distance changes slightly as a function of the sza and the spatial extent of the plume. The estimation of distance and height are not independent and a consistency check is possible. The spatial extent and geometrical form of the plume influence the estimation of ds (sza) and therefore the plume cross-section. However, if a constant distance is assumed to be valid for the whole plume cross-section, as is done here, knowledge about the geometrical form of the plume is not needed (Platt et al., 2018).
2.2 Spectral analysis and retrieval strategy
The retrieval strategies used in this work are adapted from Baylon et al. (2017), Taquet et al. (2019) and the standard NDACC and TCCON procedures, thus in this section we only detail the changes from the standard retrievals.
2.2.1 CO2
The analysis of the spectra was performed with the retrieval code PROFFIT9.6 using the CO2 band around 1.6 μm which is used by the Total Carbon Column Observing Network (TCCON) (Wunch et al., 2011), reaching precisions of 0.1% or better in the total CO2 columns (Baylon et al., 2017).
There are some adjustments to the retrieval settings for the volcanic application to the common PROFFIT retrievals at the Altzomoni site. The a priori profile has a constant volume mixing ratio (VMR) of 400 ppm and the chosen constraint is a block Tikhonov type (Rodgers, 2000; Clarmann and Grabowski, 2007), similarly used for retrievals of carbon monoxide within the boundary layer of Mexico City (Stremme et al., 2009; Stremme et al., 2011) but with a free block for the altitudes 4–8 km. This approach ensures that the total column sensitivity, which is also called averaging kernel (AK) is around 1.0 in the lower troposphere and in the altitude of the volcanic plume. The strategy is similar to previous studies conducting either a plume model (Taquet et al., 2017) or scaling the profile of the troposphere (Butz et al., 2017).
2.2.2 O2
In the TCCON and COCCON networks, the vertical O2 column is retrieved from the same spectra as CO2 and used to ensure the quality of the spectrum and to calculate the dry air mol fraction XCO2. In Section 2.3 we describe how we use the O2 column in a similar way to improve the estimation of the CO2/HCl ratio. We slightly adapted the O2 retrieval described by Baylon et al. (2017), in which tropospheric HF is not simulated in the spectra. However, HF is an important interference species and tropospheric HF should be fitted for volcanic application. A constructed HF profile which is constant from 4–7 km (possible altitudes for the volcanic plume) and zero above is scaled in the O2 retrieval. Consequently the interference error between volcanic and tropospheric HF (first-overtone) and O2 is small and irrelevant and no artificial correlation between O2 with any volcanic trace gas (HCl, HF) can be observed.
2.2.3 HCl
HCl is the fourth most abundant volcanic gas emitted by Popocatépetl after H2O, CO2, and SO2 (Love et al., 1998; Goff et al., 2001). Because HCl has a higher solubility in silicate melt than CO2 and SO2, HCl outgassing generally occurs at shallower depths/lower pressure (Aiuppa et al., 2009). In the mid-IR it is normally retrieved at around 2,800 cm−1 together with SO2 at 2,500 cm−1 (Francis et al., 1998; Love et al., 1998; Stremme et al., 2011; Taquet et al., 2019), but can also be retrieved from its first overtone at 5,700 cm−1 (Butz et al., 2017). For this study, we retrieved HCl using the following three microwindows; 5,738.30–5,740.00 cm−1, 5,767.00–5,767.75 cm−1 and 5,779.25–5,779.80 cm−1 with H2O and CH4 as interference gases and the HITRAN 2004, 2006, and 2012 spectral line lists, respectively. The line positions of HCl, H2O, and CH4 have been experimentally slightly adjusted to improve the fit. The HCl retrieval from the first-overtone results in slightly lower column amounts than when using the fundamental band. However, we restricted our analysis to the use of HCl results from retrievals in the NIR region in this work. As a priori, an average of HCl profiles, modeled with the Whole Atmospheric Community Climate Model (WACCM) is calculated and the constraint fixes the retrieved profile above 8 km a.s.l. to this apriori, but allows for free scaling of the lower part from 4 to 8 km. As a consequence, the averaging kernel for total column HCl is close to 1 around the plume height (6 km).
The most important PROFFIT retrieval settings of CO2, O2, and HCl are summarized in Table 1 and more details about the HCl retrieval strategy can be found in Taquet et al. (2019).

TABLE 1. PROFFIT retrieval setting.
2.2.4 Airmass dependence of CO2
It is known that a slightly incorrect simulation of the CO2 line shape and errors in the spectroscopic parameters result in a small artificial airmass dependence of the retrieved CO2 columns. This artifact is especially important and visible at high solar zenith angles (sza) (Wunch et al., 2010). If the chosen a priori CO2 profile differs from the true background atmosphere, the airmass dependence of the sensitivity of CO2 impacts the retrieval as well. Thus the dependence on the solar zenith angle can be eliminated by the use of a specially reconstructed a priori profile ρo (see Supplementary Material). Such correction was applied for the event of 26 April 2015, which is the most relevant CO2 anomaly of our time series, so that it minimizes the air mass dependence and allows for better quantification of the anomaly. As shown in Figure 3, no significant sza-dependance was observed after applying the correction.
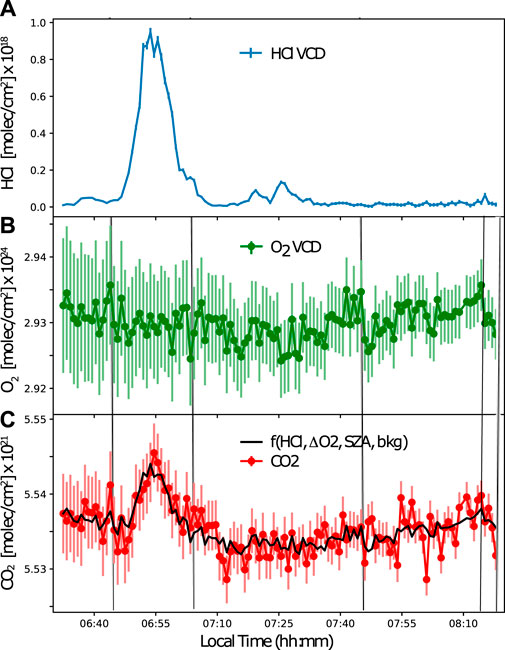
FIGURE 3. HCl (A) O2 (B) and CO2 (C) vertical columns measured on 26 April 2015 from the Altzomoni Atmospheric Observatory. The volcanic plume crossed the line-of-sight of the sun at around 06:55 LT. An enhancement in the columns of CO2 and HCl can be clearly observed as the plume was crossed. The detected vertical CO2 column anomaly, fitted by a function (black trace), follows the HCl volcanic enhancement but also the anomalies in the O2 columns accounting for correlative errors (e.g., pointing error). In panel b in the middle, we see at 6:43, 7:00, 7:45, and 8:12 LT small variations of the O2 column which can be seen also in the CO2-time series. Subtraction of the sza-dependence (airmass, fitted with a second order polynomial) and the background CO2 value works as a high pass filter.
To analyze the CO2/HCl ratios in all identified volcanic events, we did not reconstruct an a priori for each individual event. Instead, we fit and subtracted a polynomial of order 2, jointly with the time series of the volcanic tracer HCl and the O2—anomaly and explain the CO2 time series as the instrument viewing direction passes through the volcanic plume as a linear combination of different contributions (Section 3.5). For each measurement, the random and systematic errors in the CO2 column are estimated by the internal error analysis of PROFFIT9.6 (i.e., Barthlott et al. (2015); Plaza-Medina et al. (2017); Baylon et al. (2017)).
2.3 Three strategies to quantify the volcanic CO2 emissions and CO2/HCl ratio
Three slightly different strategies for reconstruction of the CO2 emission rate were applied to data recorded on 26 of April 2015, the day on which the strongest volcanic signal was measured. Strategy i), calculates the plume cross-section directly from the slant column anomalies of CO2 and does not need the retrieval of another volcanic gas. This approach works for the quantification of the CO2 emission even if the composition of the volcanic gas is variable as recently observed by Butz et al. (2017) for Etna volcano.
Strategy ii) assumes a constant molecular ratio between HCl and CO2 in the volcanic gas plume. It calculates the emission flux for HCl, for which the atmospheric background can be neglected, and then multiplies the emission flux by the CO2/HCl ratio. The ratio is obtained as the slope of the fitted straight line in a CO2 HCl correlation plot.
Strategy i) and ii) work only if the CO2 atmospheric background is constant in time. This assumption is rather likely for the remote site Altzomoni and the duration of only a few minutes in which the spectra with a volcanic plume are recorded. Unfortunately, there is a solar zenith angle-dependent bias observed, which is also called air mass dependence (Wunch et al., 2011) as already mentioned above. This solar zenith angle-dependent bias in the CO2 measurements, if not corrected, would affect both strategies (i and ii) as it complicates the determination of the constant atmospheric background of CO2 in strategy (i). This is the reason why an HCl-CO2 scatter plot does not show a very nice and simple linear correlation, which is however needed for strategy (ii).
Knowing the total vertical column of CO2 before and after the field of view intersects the plume allows us to determine the airmass dependence and correct it in the first step. Afterward, in a second step, either the plume cross-section can be calculated from the continuously observed slant columns (strategy i), or the assumed constant CO2/HCl ratio is determined from the CO2 vs HCl scatter plot (strategy ii).
However, the analysis in two steps required by these two strategies can increase the CO2 emission uncertainties and the error propagation from the bias correction to the CO2/HCl ratio is complicated.
Therefore strategy (iii), was designed to retrieve the CO2/HCl ratios from all 25 plume intersections with slant column of HCl
1) A atmospheric background CO2 column
2) Solar zenith angle dependence
3) the contribution of the volcanic gas to the measured absorption
4) Differences between calculated and real atmospheric path length
The first two points are modeled by a polynomial. The background column might change either because of a growing mixing layer of Mexico City, which might reach the altitude of the site (Baumgardner et al., 2009; Garcia-Franco et al., 2018), or a different mass of background air might be observed due to the change in the solar angle. In addition, the apparent change in the background column rising from the airmass-dependent bias impacts the behavior of the retrieved background column. A polynomial of the second degree is used to reproduce the function of the solar zenith angle and works for all 25 analyzed events. The pointing error, which affects all gases with an atmospheric background in the same way, can be corrected with the retrieved O2 column anomaly. The TCCON (Wunch et al., 2011) and COCCON (Hase et al., 2015; Alberti et al., 2022) analysis and in the recent work of (Butz et al., 2017) XCO2, the quotient of both columns (CO2 and O2), is calculated and therefore the pointing error is reduced. The retrieval of CO2, O2, and XCO2 time series at Altzomoni and their independent and correlative errors have been studied and described by Baylon et al. (2017). Adding a new parameter (in this case O2 columns) also adds a new error source (Baylon et al., 2017), so that unfortunately a contribution in the error in the XCO2-product arises from the noise in the independent O2 retrieval. Because the cam tracker (Gisi et al., 2011) used at the Altzomoni site is quite accurate, the pointing error is sometimes almost negligible and the use of the retrieved O2 column might sometimes increase the statistical error. An erroneous estimation of the optical path length of the sunlight through the atmosphere affects the retrieved vertical columns of all gases in the same way. Any error in the line of sight results in the anomaly δO2 in the retrieved vertical O2 column, which is expected to be constant in time. This anomaly related to the optical path can be converted to an anomaly δCO2 in the vertical column of CO2 using the factor 400 ppm/21% based on the background concentration of both gases, Eq. 5. We can then subtract the estimated δCO2 vertical column anomaly calculated from the δO2, either completely or also partly (weighting with the parameter α (0 < α < 1). There are plenty of reasons why the pointing error and the measurement noise error vary on some of the 25 events, for example, The impact of the pointing error increases with the solar zenith angle in general, and the signal-to-noise ratio varies depending on the instrument’s optical configuration (KBr or CaF2-beamsplitter), the presence of thin clouds or the volcanic plume might affect the signal to noise ratio. The solar tracking might be degraded through dust and dirt on the optics of the solar tracker and even some transient effects such as oscillations of the solar tracker around the Sun have been observed occasionally. The relative precision in the XCO2 retrieval product might be worse than the CO2 vertical column if the tracker works perfectly, but if the solar tracking is one relevant error source and O2 could be retrieved from spectra with a high signal-to-noise ratio, it is possible to correct for the error in the line of sight successfully. Each short time series of a volcanic event has, according to the different error contributions, one optimal weighting factor α, which will optimize the statistical error in the anomaly of CO2 during the short time that the field of view passes through the volcanic plume.
In Eq. 6 σCO2 is the error in the finalized, optimized and corrected CO2 column, σCO2−independent refers to the statistical error in the retrieved vertical CO2 column, which does not correlate with the retrieved vertical O2 column. σO2−independent is the error in the retrieved O2 column which does not correlate with the CO2 column.
Therefore, we adjust the factor α to minimize the error in the CO2 column anomalies for both higher sza or lower signal-to-noise ratio, which is theoretically given as a function of the correlated error between CO2 and O2 and the independent error of the O2 column. The mean values of the correlative and independent errors have be estimated either by PROFFIT9.6 or the analysis of consecutive measurements in large ensembles (Baylon et al., 2017), but are not known specifically for the measurements of different days and intervals with the volcanic plume measurements.
Figure 3 presents the CO2, O2, and HCl vertical columns, with corresponding error bars calculated with PROFFIT9.6, for the volcanic plume intersection detected on 26 April 2015. The CO2/HCl-molecular ratio was retrieved simultaneously by adjusting of the O2-column anomaly and the sza-dependence as shown in Figure 3. The error in the CO2/HCl-molecular ratio is estimated from the resulting residual as usually done for the measurement noise error in least-squares fitting.
The linear combination of different contributions should approximate the observed time series. The set of factors are the coordinates of the vector x and we describe this linear combination as matrix multiplication of the matrix K and the vector x. The calculated vector x minimizes the cost function
The weighting functions (the columns of the matrix K correspond to the background, linear and squared airmass dependence, the proxy for volcanic plume and the proxy for a pointing error in the last column in Eq. 8.
The fourth coordinate from above is the CO2/HCl ratio. With the definition of the Gain-matrix, we can easily calculate the measurement noise error in this ratio as shown in (Eq. 12).
The error in the ratio (Eq. 12) is calculated from the linear regression and helps to weight the events with different strong volcanic signals and quality of measurements.
The CO2 background column can be calculated using the following equation.
Subtracting this background column from the CO2 time series measured on 26 April 2015, we isolate the volcanic CO2 as shown in Figure 4.
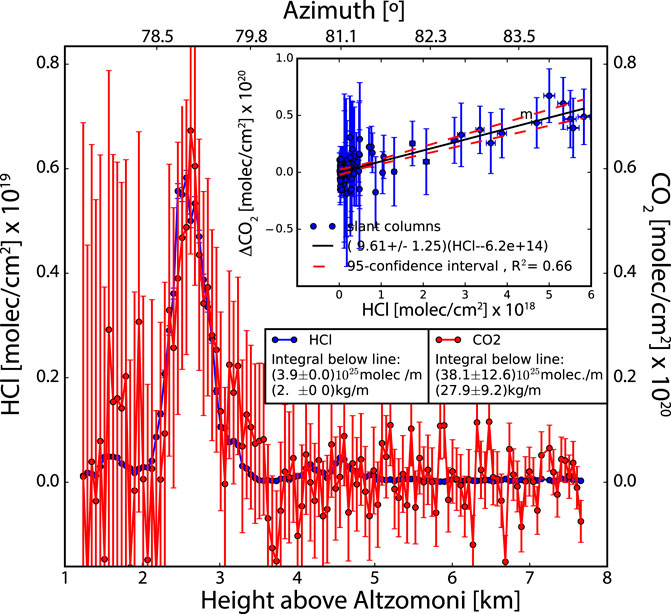
FIGURE 4. Measured slant column densities (SCD) of HCl and CO2 anomaly versus reconstructed height (h=dist Cos(SZA); dist = 15.88 km) above the observation site (lower axis) and sza (upper axis). The CO2 anomaly in the slant column is corrected for airmass dependence and improved by reducing the correlating error using the retrieved O2 anomaly as shown in Fig.3. The inset is the scatter plot of HCl and CO2 SCD’s showing a strong correlation indicating that the detected CO2 anomaly is of volcanic origin, and a valid and representative CO2/HCl molecular ratio of 9.6 ± 1.3 has been calculated for the event.
3 Results
3.1 The event on 26 April 2015
On the early morning of 26 April 2015, just after sunrise, Popocatépetl was passively degassing as it most frequently does and the sky was clear of clouds. The wind conditions at altitudes between 5,500 and 6,800 m a.s.l. were fairly constant as can be observed from the images captured every minute with the camera at the station pointing towards the volcano (see Supplementary Material). The plume was propagating towards the NE (wind direction = 222°) at a speed of approximately 8.2 m/s according to the radiosonde, launched daily at 06 LT from Mexico City. Continuous measurements of solar absorption spectra resulted in a full cross-section of the volcanic plume at around 06:44 LT, that together with the wind parameters, allowed for the emission flux of volcanic CO2 and HCl to be determined. A schematic of the measurement geometry for this particular day is presented in Figure 1.
3.2 Plume cross-section
As already stated, on the early morning of 26 April 2015, consecutive solar absorption spectra were recorded just after sunrise starting at 06:30 LT. Each measurement had a duration of 37 s. At sunrise, the change in sza is rather fast and a complete cross-section through the volcanic plume was realized in about 15 min. The cross-section is directly given as a set of slant columns for which the time and the sza are known (see Figure 4). The plume cross-section can be converted to a function of height, as shown in Figure 4), since the distance from the observation site to the volcanic plume could be determined based on the known solar azimuth angle, the average wind direction, and the known distance between Popocatépetl’s crater and the observation site (Figure 1).
With the above constraints, we have calculated a distance to the plume of 15.88 km, assuming that the height of the plume is 2.76 km above the observation site and 1.26 km above the crater. That the plume which propagated 18.11 km during about half an hour to reach the instrument line-of-sight, was rising to a height corresponding to its potential temperature (altitude of 6.75 km a.s.l). This propagation can be confirmed by a set of images taken from the Altzomoni Site (See animation in Supplementary Material).
Alternatively, data from the North American Regional Re-analysis Data (NARR) (Mesinger et al., 2006) were used for the determination of wind velocity, plume height, and plume distance, leading to slightly different results (Table 2). This difference is used later to estimate the error associated with wind speed and direction uncertainties. However, the plume was observed at different times and the time intervals between our observation and the last available daily radiosonde observation could be quite large on some days. Instead, we decided to use the NARR data, which are available every 3 h and also assimilate the information of the radiosonde measurements. The statistical analysis that we present is therefore based on the combination of the FTIR cross-section measurements and wind information from model reanalysis data.
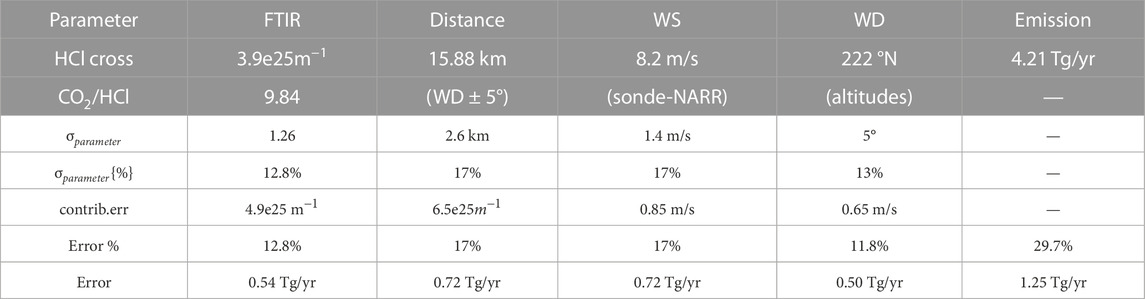
TABLE 2. Errors considered in the CO2 emission estimation for 26 April 2015 using the CO2/HCl ratio.
3.3 CO2 emission rate calculation
For the calculation of the flux, or the instantaneous emission rate for a particular event, the wind velocity perpendicular to the plume cross-section is needed. This perpendicular component of the wind vector is estimated from the geometry as shown in Figure 1 and based on the radiosonde and/or the NARR model data. For the 26 April 2015 case study, the wind speed and direction used for the calculation are 8.2 m/s and 222°, respectively, leading to an angle between the measurement line-of-sight and the direction in which the plume propagates of 37.4°. The velocity component perpendicular to the cross-section is 8.2/sin (37.4°) = 4.98 m/s. The amount of molecules in the plume slice measured as the Sun increased its elevation angle across the plume is obtained by integrating the SCD over height. The instantaneous emission rate is then calculated by multiplying these two values, thus ECO2 = 36.7 × 1025 Molec/m × 4.98 m/s = 3.0 kMol/s, or in terms of mass, ECO2 = 134 kg/s (116 kg/s using NARR).
3.4 Errors and uncertainties
3.4.1 Gas ratios versus direct CO2 emissions
The main uncertainty is given by the precision in the total CO2 slant column measurement. The volcanic anomaly in the slant column of CO2 is less than 1% of the atmospheric background (vertical column) and the precision of the measurement determined as the random error is around 0.2% of the total slant column, which results in a relative error greater than 20% in each slant column measurement. Figure 4 shows the retrieved slant column anomaly
The statistical error in the retrieval
3.4.2 Wind data
The uncertainty in the wind direction affects the emission rate in two different ways: a) The wind direction is an essential ingredient for reconstructing the measurement geometry, as in Figure 1, and impacts the calculation of the distance between the observation site and the plume cross-section. b) The wind direction is used to calculate the component of the wind velocity perpendicular to the plume cross-section as it is needed for the application of Gauss’s Law. In a) the average wind direction of the plume is required, while in b) the wind direction just during the measurement of the plume cross-section is needed.
We assume both the mean and the final wind direction to be 222°, but we count them as two independent components for the calculation of the emission rate. The error in both the mean and the final wind direction is estimated to be ±5°. This ad hoc estimated uncertainty in the wind direction corresponds to the median of the deviations of the two wind directions at 500 hPa and at 450 hPa pressure level of the NARR-reanalysis data. The +5° and −5° error propagates to an error of around +2.9 km or −2.3 km, respectively, resulting in an average of 17% for the reconstructed distance between the measurement site and the plume cross-section. The +5° or −5° error in the final wind direction results in an error in the wind component perpendicular to the cross-section of −11.8% and +11.0%.
Wind speed is critical for the flux calculation. In our case study, the wind speed measured by the radiosonde was almost constant 8.2 m/s over the various altitudes around the plume height (Table.2). The wind speed from the NARR model can be obtained from both its meridional (v) and zonal (u) components as WS =
3.5 Time series: HCl emission rates and CO2/HCl ratios
In total, we analyzed 25 occurrences during which our instrument field of view intersected the volcanic plume and during which HCl and CO2 could be simultaneously detected. All of these plume intersections have HCl slant columns greater than 1.0E18 Molec/cm2 but volcanic CO2 anomalies close to their detection limit. Applying strategy (iii) (see Section 2.3) and using scaling factor applied to the HCl time series yields the CO2/HCl molecular ratio and its standard error for each event.
Figures 5A, B show the variability of the CO2/HCl ratio for each plume intersect in the time series. The correlation of each molecular ratio with the HCl emission rate is shown in Figure 5D). The time series does not show a significant pattern or trend. The histogram of the derived ratios might be explained by a log-normal distribution convolved by a normal distribution, since all ratios should be positive, but are determined by relatively large measurement errors (Figure 5D). The weighted average CO2/HCl ratio is found to be 11.4 ± 4.4 Molec. ratio and the correlation plot (inset d)) shows no significant correlation between the emission strength and the Molec. ratios (R2=0.03).
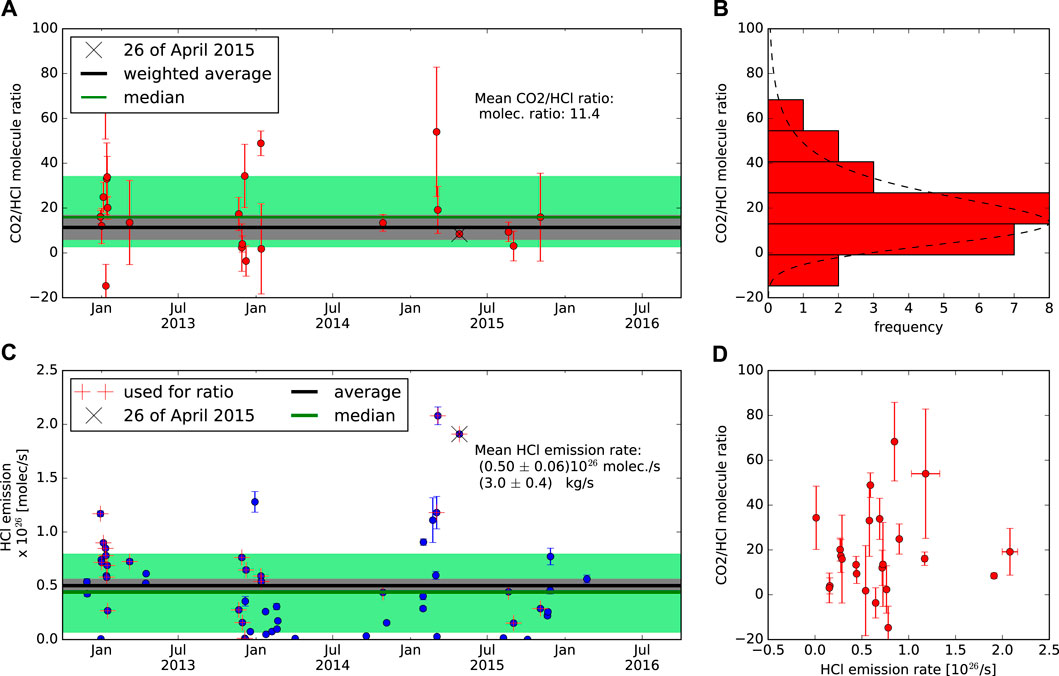
FIGURE 5. (A) The 25 events for which CO2/HCl ratios were determined, shown as time series (A) and in a histogram (B). (A) The green area marks the central region which contains 68% of the measured ratios, the black line and grey region represent the average and its standard error (uncertainty of type A). (B) The histogram of the measured CO2/HCl ratios shows an asymmetrical distribution as expected for a positive quantity with natural variability and also negative values as a result of measurement errors. The dashed line models a distribution
The Figure 5C shows the time series of the 54 events for which the mean emission rate of HCl could be calculated. The HCl flux is rather variable ranges from 0.007 kg/s to 12.6 kg/s, with a median of 2.7 kg/s and an average and standard deviation of (3.0 ± 3.5) kg/s. From those, the 25 events which were also chosen for the estimation of the mean CO2/HCl molecular ratio are plotted in red and marked with a plus in the same figure.
The use of O2 anomalies for the determination of the volcanic CO2 is not crucial for the case study (26 April 2015), but useful for the other 25 volcanic events, which are used to determine a mean CO2/HCl molecular ratio of 11.4 ± 4.4 and have rather large errorbars. Figure 3B shows scattering in the vertical O2 column of around 0.2%, which is a similar magnitude as the volcanic anomaly in the CO2 column. Interestingly, the CO2/HCl molecular ratio determined for the above average emission rate on 26 April 2015 (8.46–9.6) is similar to the average ratio obtained from the full time series (11.4 ± 4.4, see Table 3).
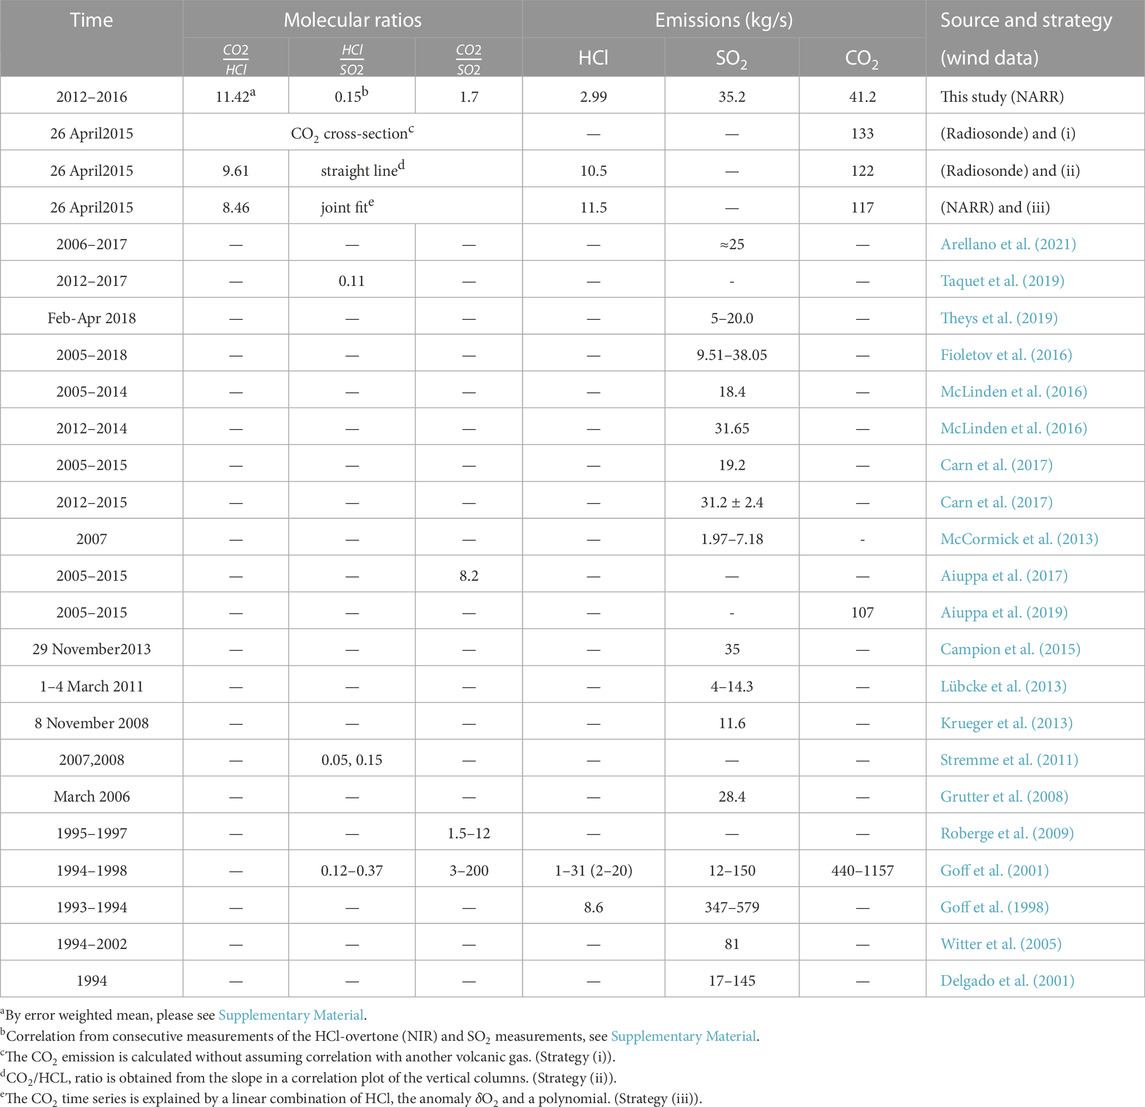
TABLE 3. Comparison of molecular ratios and emissions of HCl, SO2 and CO2 from Popocatépetl.
As can be noticed from Figures 5A, B, despite the larger emission on 26 April 2015 (Figure 5C), the molecular ratio of the event lies very close to the mean value.
3.6 Total emissions
The CO2 signature was only found strong enough to calculate the CO2 plume cross-section with a reliable error (35%) during a single plume intersect, occurring during passive degassing. The maximal slant column anomaly of CO2 reached a value of 1.6% above the vertical background column, which is clearly larger than the detection limit and precision. In general, the CO2/HCl ratio is variable from day to day (Figure 5) and initially, it was not clear whether this single measurement occurred through an extraordinary enhancement of the CO2/HCl ratio as found by (Goff et al., 2001) or due to an enhancement of the overall gas emission. On the event of 26 April 2015 the volcanic emissions reflected a typical behavior of passive degassing, during a dome destruction period (photos, Supplementary Figure S1).
Overall, we found that the CO2/HCl ratio on 26 April 2015 was similar to the mean ratio of CO2/HCl for the entire 2012–2016 measurement period. This hypothesis is supported by the analysis of 25 of 54 volcanic events, for which we found an average CO2/HCl molecular ratio of 11.42 ± 4.44. Thus the CO2/HCl ratio of 9.84 ± 1.26 measured on 26 April 2015 seems to be a typical ratio.
The CO2 annual emission rate for the 2012 to 2016 period is estimated from the average CO2/HCl molecular ratio (11.42 ± 4.44) and the HCl emission flux (3.0 ± 0.3 kg/s) and found to be (41.2± 16.7) kg/s.
Using the HCl-product from this work and the SO2 column retrieval from spectra recorded with the NDACC-filter 3 and 6 and detectors InSb and MCT, (Taquet et al., 2019), but measured within a 5 min coincidence criteria, an average molecule ratio SO2/HCl of 6.6 was determined for the time period of this work (Supplementary Section S4). This ratio allows us a comparison with SO2 emission data taken from the literature. Recent studies reporting SO2 emissions of Popocatepetl based on different techniques are summarized in Table.3. Among these studies are UV-cam measurements (of 29 November 2013 (Campion et al., 2015) and 27 days between November and December 2016 (Schiavo et al., 2019), a former study using data of 1 month from various techniques during the MILAGRO field campaign in March 2006 (Grutter et al., 2008), results from the NOVAC-project (Arellano et al., 2021) and with the space-based SO2 emission estimation covering the period 2007–2014 (McLinden et al., 2016). These studies cover a similar period as ours and help us to validate our new method to calculate volcanic gas emissions. The average emission rates of HCl, SO2, and CO2 in the period from October 2012 to June 2016 yield to (3.0 ± 0.3) kg/s, (35.7 ± 4.2) kg/s, and (41.2 ± 16.7) kg/s respectively (corresponding to the annual emission rates of (0.094± 0.011) Tg/yr, (1.13± 0.12)Tg/yr and (1.30 ± 0.53) Tg/yr).
4 Discussion
The linear combination of a CO2 background column, sza-dependence, pointing error, and volcanic anomaly successfully, gives us the confidence to apply this correction to the 25 plume intersections (days) where the highest HCl-slant columns have been measured and the slant HCl columns were greater than 1018 Molec/cm2. The indirect estimate of the CO2 emission, based on the CO2/HCl ratio (11.4 ± 4.4 molecular ratio) and the HCl flux, avoids statistical bias since even events with CO2 anomalies below the detection limit are taken into account in the determination of the emission rate.
4.1 Comparison of volcanic gas flux measurements with other methods
For the comparison of the volcanic gas flux from Popocatépetl with other measurements, in general, only SO2 flux measurements are available from the literature, thus a comparison has to estimate the average molecular ratio of SO2/HCl during passive degassing of the Popocatépetl which is around 6.6 ± 0.3 for the period 2012 to 2016 and using the HCl retrieval from the first overtone. The slight difference in the SO2/HCl molecular ratio values reported by Stremme et al. (2011); Taquet et al. (2019) (6.8 and 9.1) are due to the spectroscopic inconsistency and differences in the time period. Since SO2 can be readily measured with conventional volcano monitoring techniques (e.g., Mobile DOAS, Scanning DOAS and SO2 camera (Grutter et al., 2008; Campion et al., 2018; Platt et al., 2018; Schiavo et al., 2019; Arellano et al., 2021), it is common practice to determine the emission rate with the X/SO2 ratio, where X represents CO2, HCl, etc. To apply this method we need to calculate the CO2/SO2 ratio which we do by measuring the HCl/SO2 ratio and scaling this with the previously determined CO2/HCl ratio. The resulting CO2/SO2 molecular ratio is 2.06 ± 0.7. The uncertainty of 33% in the average ratio is dominated by the uncertainty in the CO2/HCl ratio and takes both into account i) the natural variability of the ratios and ii) the measurement errors. While the derived average CO2/SO2 ratio is in the range reported by Roberge et al. (2009), it is smaller than the estimation for the average ratio by (Aiuppa et al., 2019), as shown in Table 3 and on the lower range from the values of Goff et al. (2001).
In order to validate our method with previous studies, such as the study by Grutter et al. (2008) that combines various methods using thermal emission and UV-based techniques, or the studies by (Krueger et al., 2013), (Lübcke et al., 2013) and (Campion et al., 2015) using 2D visualisation methods with either a thermal emission spectrometer or a UV camera on particular days and (McLinden et al., 2016) or (Carn et al., 2017) basing their studies on long term satellite measurements, we have converted our HCl-flux results to SO2 fluxes. HCl and SO2 are both volcanic gases with low tropospheric background, however, SO2 is also emitted by anthropogenic sources (de Foy et al., 2009). HCl, on the other hand, is less abundant in volcanic plumes, can only be measured effectively by IR spectroscopy and has not yet been measured by imaging techniques. The HCl-flux in this work multiplied by an average molecular SO2/HCl ratio of 6.6 and corrected for the different molecular weights of SO2 and HCl correspond to a SO2 flux of (35.7 ± 4.2) kg/s which can be compared to different measurements and estimations reported in the literature and summarized in Table 3. These reported SO2 emissions range from 5 kg/s to 579 kg/s in different periods. Especially if we consider the activity of the Popocatepetl during the period 2012–2014 (McLinden et al., 2016; Carn et al., 2017; Boulesteix et al., 2022), we find values corresponding to the 35.7 kg/s obtained from this work. The methodology presented here benefits from the location of both the Altzomoni Atmospheric Observatory and the volcano, and from the typical wind direction during the early morning driving the plume in the line of sight of the instrument and allowing a large number of solar absorption plume measurements. Our HCl-fluxes time series did not capture plumes from any strombolian phases associated with dome growth episodes or Vulcanian explosive activity accompanying dome destruction. In the long-term record both of these episodes are relatively rare compared to passive degassing and excluding these episodes of Strombolian and Vulcanian-style eruptions will bias the estimation only slightly. In and after the explosions a larger amount of gas is released and therefore a positive anomaly is expected, but prior to these explosions a decrease in gas emissions is typically observed. Somehow gas is retained until the explosions and the negative anomaly in the emission just before this explosion compensates for the positive anomaly due to the explosion (Love et al., 2000; Taquet et al., 2017). Our SO2 flux of (36 ± 4) kg/s agrees well with the 31.2 ± 2.4 kg/s average reported for the 2012–2015 period Supplementary Material of Carn et al. (2017) and Boulesteix et al. (2022) and supports the assumption that quiescent emissions dominate the overall emissions from Popocatépetl.
4.2 Quantification of volcanic CO2/HCl ratio by a linear joint fit
Measuring the CO2 flux and the CO2/HCl ratios is challenging because the volcanic part of the slant column of CO2 is in the subpercentage region. The high CO2 background and the sza-dependence for measurements with low solar elevation angles are much larger than the volcanic contribution to the total column as described before. However, a joint fit of different proxies for different contributions can explain the measuredtime series of CO2. Here the HCl time series is used as proxy for the volcanic plume, the columnar O2 anomalies
During decompression of magma rising from depth towards the surface, CO2 first partitions to the vapor phase, only later followed by sulfur and chlorine (Edmonds et al., 2022). We, therefore, expect that deep magmatic recharge could lead to an increase in the CO2/HCl ratio in the gases emitted from the top of the volcano. On the other hand, efficient release of chlorine from the magma can only occur as it reaches very shallow depths or even atmospheric pressure (Edmonds et al., 2001). Therefore, the HCl flux will primarily be driven by the availability of fresh magma at the surface.
Our measurements provide some limited information on magma migration in Popocatepetl’s plumbing system. For one, the variability of the HCl flux is significant and exceeds the errors associated with each individual measurement. This variability is likely related to very shallow processes, in particular, the volume of chlorine-rich magma at or very close to the surface at the time of measurement. The variability of the measured CO2/HCl ratio, on the other hand, is mostly smaller than the measurement uncertainty. We therefore cannot interpret individual measurements with regard to their underlying magmatic processes. We can, however, establish a baseline for the CO2/HCl ratio to which future measurements can be compared. Based on the range of values we detected (see Figures 5A, B), any future measurements of CO2/HCl significantly higher than 100 (after accounting for measurement accuracy and precision) should be considered anomalous and could be an indicator of deep magmatic recharge at Popocatépetl. Thus, our measurement techniques may provide valuable information on magma migration and possible future eruptive episodes.
The CO2/HCl (11.42) molecular ratio might be converted to a CO2/SO2 ≈ 1.7 using the SO2/HCl ratio of 6.6. Our average CO2/SO2 ratio is consistent with that measured by Roberge et al. (2009) in a melt inclusion (i.e.,: ≈1 Molec. ratio for an inclusion captured at 400 MPa (15 km) representative of primary magma). The CO2/SO2 molecular ratio of around 2 is however in general lower than those obtained in studies carried out in 1993 and 1994 using remote sensing (Goff et al., 2001). Since we also see a large variability in our results and a distribution with a larger tail towards positive anomalies (Figure 5B), this ratio might have significantly higher values during some periods of short duration. However, in this work the number of measurements of the ratio is limited and the precision of the retrieved ratio does not allow to determine the variability, just the overall background value of the CO2/HCl ratio in the plume of Popocatépetl.
5 Conclusion
In this contribution, we determine the average CO2 and HCl emission rates of the active Popocatépetl stratovolcano by near-infrared solar absorption spectroscopy from a fixed site. Our measurements indicate that Popocatépetl has emitted in recent years an average of 1.3 Tg of CO2 and 95 kt of HCl per year. The CO2/HCl molecular ratio is on average around 11.42 but shows a large variability. No significant correlation between the HCl flux and the CO2/HCl ratio was found. A particular case study is presented for a measurement recorded during the early morning of 26 April 2015. An anomaly in the CO2 column on this day was visualized and the emission rate of Popocatépetl could be calculated directly from the CO2 column measurements. Three different strategies for CO2 and HCl flux analysis have been compared and cross validated. For the estimation of a representative mean emission rate for HCl and CO2 during the period between 2012 and 2016, only one of these strategies were followed since the CO2 signal was not always strong enough for a direct estimation. During 54 days in the measurement period, a cross-section of the volcanic plume was measured and the HCl emission rate was determined. The CO2/HCl ratio could be measured in about half of these events and a mean emission rate of CO2 could be calculated using this ratio and the HCl-flux.
Assuming a SO2/HCl molecular ratio of 6.6, the average HCl emission during 2012–2016 obtained in this study corresponds to an annual emission rate of (36 ± 4) kg/s (3.1 ± 0.4) kt/d or (1.14 ± 0.13) Tg/yr) of SO2. This result is completely independent of other methods used so far and is in agreement with other reported SO2 emission rates. The CO2/SO2 molecular ratio of 1.7 is in accordance with some ratios measured by Roberge et al. (2009). However, the 41.2 kg/s average CO2 emissions obtained in this study (equivalent to 1.3 ± 0.5 Tg/yr) is significantly lower than what has been estimated and assumed in former studies (Delgado et al., 2001; Goff et al., 2001; Witter et al., 2005; Aiuppa et al., 2017). According to these new results, the total CO2 emissions of Popocatépetl contribute only with about 1% and 3.4% of the estimated anthropogenic CO2 emissions in the Mexican territory (130 Tg/yr) and in the Mexico City Metropolitan Area (44 Tg/yr). Nevertheless, these CO2 emissions from volcanic origin can be as strong as a coal-fired power plant and should be considered in regional carbon cycle studies and also included in global volcanic emission inventories.
Data availability statement
The original contributions presented in the study are included in the article/Supplementary Material, further inquiries can be directed to the corresponding authors.
Author contributions
WS coordinated the work and carried out the early morning. MG contributed in the reconstruction of the volcanic emission rate from solar absorption measurements, combining perpendicular cross-section, the geometry and writing of the manuscript. JB retrieved the CO2 and O2 columns from the NIR spectra. TB leads the German-Mexican collaboration for long-term operation as part of NDACC. FH has helped in the design and setup of the spectrometer and solar tracker and has developed the retrieval code PROFFIT. NT is responsible for the volcanological aspects and interpretation of the gas composition, reviewing the retrievals and the results. She has contributed to the analysis and writing parts of the paper. AB is responsible for the data acquisition, managing and processing of the spectra, as well as in the operation of the spectrometer. BS reviewed the emission of Popocatepetl and calculated the SO2 emissions. EP-M helped to set up the spectrometer and carried out most of the solar FTIR measurements in Altzomoni. She contributed to the analysis, interpretation and writing of the paper. CR helped with the estimation of the SO2 flux from Popcatepetl. CR has contributed to the analysis, interpretation and writing. All authors contributed to the article and approved the submitted version.
Funding
We acknowledge the financial support of DGAPA-UNAM PAPIIT (IN107417, IN111521, IA101620) and CONACYT (275239, 290589).
Acknowledgments
WS thanks DGAPA PASPA for supporting this research during the sabbatical 2019/2020 and The IMK-KIT for hospitality. CONACYT is acknowledged for the studentship of JB. We are grateful for the technical assistance provided by Alfredo Rodriguez, Miguel Robles, Delibes Flores, Omar López, and the Insituto de Ciencias de la Atmósfera and Cambio Climatico (UNAM) for the institutional support to carry out this study. Especially we thank Dr. Thomas Boulesteix for his help at the Altzomoni site, his fruitful discussions, and his motivation. We thank both reviewers for their constructive critics and helpful comments. Especially we thank Nicole Bobrowski (reviewer 2) for her good ideas and very careful revisions which have improved the manuscript substantially.
Conflict of interest
The authors declare that the research was conducted in the absence of any commercial or financial relationships that could be construed as a potential conflict of interest.
The reviewer AB declared a past co-authorship with the authors FH, TB to the handling editor.
Publisher’s note
All claims expressed in this article are solely those of the authors and do not necessarily represent those of their affiliated organizations, or those of the publisher, the editors and the reviewers. Any product that may be evaluated in this article, or claim that may be made by its manufacturer, is not guaranteed or endorsed by the publisher.
Supplementary material
The Supplementary Material for this article can be found online at: https://www.frontiersin.org/articles/10.3389/feart.2023.1022976/full#supplementary-material
References
Aiuppa, A., Baker, D., and Webster, J. (2009). Halogens in volcanic systems. Chem. Geol. 263, 1–18. doi:10.1016/j.chemgeo.2008.10.005
Aiuppa, A., Fischer, T., Plank, T., and Bani, P. (2019). Co 2 flux emissions from the earth’s most actively degassing volcanoes, 2005–2015. Sci. Rep. 9, 5442. doi:10.1038/s41598-019-41901-y
Aiuppa, A., Fischer, T., Plank, T., Robidoux, P., and Di Napoli, R. (2017). Along-arc, inter-arc and arc-to-arc variations in volcanic gas co 2/st ratios reveal dual source of carbon in arc volcanism. Earth-Science Rev. 168, 24–47. doi:10.1016/j.earscirev.2017.03.005
Alberti, C., Hase, F., Frey, M., Dubravica, D., Blumenstock, T., Dehn, A., et al. (2022). Improved calibration procedures for the em27/sun spectrometers of the collaborative carbon column observing network (coccon). Atmos. Meas. Tech. 15, 2433–2463. doi:10.5194/amt-15-2433-2022
Arellano, S., Galle, B., Apaza, F., Avard, G., Barrington, C., Bobrowski, N., et al. (2021). Synoptic analysis of a decade of daily measurements of so2 emission in the troposphere from volcanoes of the global ground-based network for observation of volcanic and atmospheric change. Earth Syst. Sci. Data 13, 1167–1188. doi:10.5194/essd-13-1167-2021
Barthlott, S., Schneider, M., Hase, F., Wiegele, A., Christner, E., González, Y., et al. (2015). Using xco2 retrievals for assessing the long-term consistency of ndacc/ftir data sets. Atmos. Meas. Tech. 8, 1555–1573. doi:10.5194/amt-8-1555-2015
Baumgardner, D., Grutter, M., Allan, J. D., Ochoa, C., Rappenglück, B., Russell, L., et al. (2009). Physical and chemical properties of the regional mixed layer of Mexico’s megapolis. Atmos. Chem. Phys. 9, 5711–5727. doi:10.5194/acp-9-5711-2009
Baylon, J. L., Stremme, W., Grutter, M., Hase, F., and Blumenstock, T. (2017). Background co2 levels and error analysis from ground-based solar absorption ir measurements in central Mexico. Atmos. Meas. Tech. Discuss., 1–18. doi:10.5194/amt-2016-418
Boulesteix, T., Legrand, D., Taquet, N., Coppola, D., Laiolo, M., Valade, S., et al. (2022). Modulation of popocatépetl’s activity by regional and worldwide earthquakes. Bull. Volcanol. 84, 80. doi:10.1007/s00445-022-01584-2
Butz, A., Dinger, A. S., Bobrowski, N., Kostinek, J., Fieber, L., Fischerkeller, C., et al. (2017). Remote sensing of volcanic CO2, HF, HCl, SO2, and BrO in the downwind plume of Mt. Etna. Atmos. Meas. Tech. 10, 1–14. doi:10.5194/amt-10-1-2017
Campion, R., Delgado-Granados, H., Legrand, D., Taquet, N., Boulesteix, T., Pedraza-Espitía, S., et al. (2018). Breathing and coughing: The extraordinarily high degassing of popocatépetl volcano investigated with an so2 camera. Front. Earth Sci. 6, 163. doi:10.3389/feart.2018.00163
Campion, R., Delgado-Granados, H., and Mori, T. (2015). Image-based correction of the light dilution effect for SO 2 camera measurements. J. Volcanol. Geotherm. Res. 300, 48–57. doi:10.1016/j.jvolgeores.2015.01.004
Campion, R., Martinez-Cruz, M., Lecocq, T., Caudron, C., Pacheco, J., Pinardi, G., et al. (2012). Space- and ground-based measurements of sulphur dioxide emissions from Turrialba Volcano (Costa Rica). Bull. Volcanol. 74, 1757–1770. doi:10.1007/s00445-012-0631-z
Carn, S., Fioletov, V., Mclinden, C., Li, C., and Krotkov, N. (2017). A decade of global volcanic so2 emissions measured from space. Sci. Rep. 7, 44095. doi:10.1038/srep44095
Clarmann, T. v., and Grabowski, U. (2007). Elimination of hidden a priori information from remotely sensed profile data. Atmos. Chem. Phys. 7, 397–408. doi:10.5194/acp-7-397-2007
de Foy, B., Krotkov, N. A., Bei, N., Herndon, S. C., Huey, L. G., Martínez, A.-P., et al. (2009). Hit from both sides: Tracking industrial and volcanic plumes in Mexico city with surface measurements and omi so2 retrievals during the milagro field campaign. Atmos. Chem. Phys. 9, 9599–9617. doi:10.5194/acp-9-9599-2009
De Mazière, M., Thompson, A. M., Kurylo, M. J., Wild, J. D., Bernhard, G., Blumenstock, T., et al. (2018). The network for the detection of atmospheric composition change (ndacc): History, status and perspectives. Atmos. Chem. Phys. 18, 4935–4964. doi:10.5194/acp-18-4935-2018
Delgado, H., Cardenas Gonzalez, L., and Piedad Sanchez, N. (2001). Sulfur dioxide emissions from Popocatépetl volcano (Mexico): Case study of a high-emission rate, passively degassing erupting volcano. J. Volcanol. Geotherm. Res. 108, 107–120. doi:10.1016/S0377-0273(00)00280-8
Edmonds, M., Liu, E., and Cashman, K. (2022). Open-vent volcanoes fuelled by depth-integrated magma degassing. Bull. Volcanol. 84, 28. doi:10.1007/s00445-021-01522-8
Edmonds, M., Pyle, D., and Oppenheimer, C. (2001). A model for degassing at the Soufriere hills volcano, Montserrat, west indies, based on geochemical data. Earth Planet. Sci. Lett. 186, 159–173. doi:10.1016/s0012-821x(01)00242-4
Espinoza, M. A. M., Garcia, T. M., Sahagun, A. M., and Torres, D. G. (2018). Inventario de Emisiones de de la CDMX 2014: Contaminantes criterio, toxicos y de efecto invernadero. Tech. rep., Secretaria del Medio Ambiente del Gobierno de la Ciudad de México.
Fickel, M., and Delgado Granados, H. (2017). On the use of different spectral windows in doas evaluations: Effects on the estimation of so2 emission rate and mixing ratios during strong emission of popocatépetl volcano. Chem. Geol. 462, 67–73. doi:10.1016/j.chemgeo.2017.05.001
Fioletov, V. E., McLinden, C. A., Krotkov, N., Li, C., Joiner, J., Theys, N., et al. (2016). A global catalogue of large so2 sources and emissions derived from the ozone monitoring instrument. Atmos. Chem. Phys. 16, 11497–11519. doi:10.5194/acp-16-11497-2016
Francis, P., Burton, M. R., and Oppenheimer, C. (1998). Remote measurements of volcanic gas compositions by solar occultation spectroscopy. Nature 396, 567–570. doi:10.1038/25115
Galle, B., Johansson, M., Rivera, C., Zhang, Y., Kihlman, M., Kern, C., et al. (2010). Network for observation of volcanic and atmospheric change (novac)—A global network for volcanic gas monitoring: Network layout and instrument description. J. Geophys. Res. Atmos. 115, D05304. doi:10.1029/2009JD011823
Garcia-Franco, J., Stremme, W., Bezanilla, A., Ruiz-Angulo, A., and Grutter, M. (2018). Variability of the mixed-layer height over Mexico city. Boundary-Layer Meteorol. 167, 493–507. doi:10.1007/s10546-018-0334-x
Gerlach, T. M. (1991). Present-day CO2 emissions from volcanos. Eos, Trans. Am. Geophys. Union 72, 249–255.
Gisi, M., Hase, F., Dohe, S., and Blumenstock, T. (2011). Camtracker: A new camera controlled high precision solar tracker system for ftir-spectrometers. Atmos. Meas. Tech. 4, 47–54. doi:10.5194/amt-4-47-2011
Gisi, M., Hase, F., Dohe, S., Blumenstock, T., Simon, A., and Keens, A. (2012). XCO&lt;sub&gt;2&lt;/sub&gt;-measurements with a tabletop FTS using solar absorption spectroscopy. Atmos. Meas. Tech. 5, 2969–2980. doi:10.5194/amt-5-2969-2012
Goff, F., Janik, C. J., Delgado, H., Werner, C., Counce, D., Stimac, J. A., et al. (1998). Geochemical surveillance of magmatic volatiles at popocatépetl volcano, Mexico. Geol. Soc. Am. Bull. 110, 695–710.
Goff, F., Love, S. P., Warren, R., Counce, D., Obenholzner, J., Siebe, C., et al. (2001). Passive infrared remote sensing evidence for large, intermittent CO2 emissions at Popocatépetl volcano, Mexico. Chem. Geol. 177, 133–156. doi:10.1016/S0009-2541(00)00387-9
Grutter, M., Basaldud, R., Rivera, C., Harig, R., Junkerman, W., Caetano, E., et al. (2008). SO2 emissions from Popocatépetl volcano: Emission rates and plume imaging using optical remote sensing techniques. Atmos. Chem. Phys. 8, 6655–6663. doi:10.5194/acp-8-6655-2008
Hase, F., Frey, M., Blumenstock, T., Groß, J., Kiel, M., Kohlhepp, R., et al. (2015). Application of portable ftir spectrometers for detecting greenhouse gas emissions of the major city berlin. Atmos. Meas. Tech. 8, 3059–3068. doi:10.5194/amt-8-3059-2015
Instituto Nacional de Ecología y Cambio Climático (INECC) (2018). Mexico: Inventario nacional de Emisiones de Gases y compuestos de Efecto invernadero 1990-2015 (version revisado). Tech. rep., Secretaría de Medio Ambiente y Recursos Naturales (SMARNAT).
Juarez, A., Gay, C., and Flores, Y. (2005). Impact of the Popocatepetl’s volcanic activity on the air quality of Puebla City, Mexico. Atmosfera 18, 57–69.
Keppel-Aleks, G., Toon, G. C., Wennberg, P. O., and Deutscher, N. M. (2007). Reducing the impact of source brightness fluctuations on spectra obtained by Fourier-transform spectrometry. Appl. Opt. 46, 4774–4779. doi:10.1364/AO.46.004774
Kiel, M., Wunch, D., Wennberg, P. O., Toon, G. C., Hase, F., and Blumenstock, T. (2016). Improved retrieval of gas abundances from near-infrared solar ftir spectra measured at the Karlsruhe tccon station. Atmos. Meas. Tech. 9, 669–682. doi:10.5194/amt-9-669-2016
Krueger, A., Stremme, W., Harig, R., and Grutter, M. (2013). Volcanic SO2 and SiF4 visualization using 2-D thermal emission spectroscopy - Part 2: Wind propagation and emission rates. Atmos. Meas. Tech. 6, 47–61. doi:10.5194/amt-6-47-2013
Love, S. P., Goff, F., Counce, D., Siebe, C., and Delgado, H. (1998). Passive infrared spectroscopy of the eruption plume at Popocatépetl volcano, Mexico. Nature 396, 563–567. doi:10.1038/25109
Love, S. P., Goff, F., Schmidt, S. C., Counce, D., Pettit, D., Christenson, B. W., et al. (2000). Passive infrared spectroscopic remote sensing of volcanic gases: Ground-based studies at White Island and Ruapehu, New Zealand, and Popocatépetl, Mexico, 116. Washington DC American Geophysical Union Geophysical Monograph Series, 117–138. doi:10.1029/GM116p0117
Lübcke, P., Bobrowski, N., Illing, S., Kern, C., Alvarez Nieves, J. M., Vogel, L., et al. (2013). On the absolute calibration of so2 cameras. Atmos. Meas. Tech. 6, 677–696. doi:10.5194/amt-6-677-2013
McCormick, B. T., Edmonds, M., Mather, T. A., Campion, R., Hayer, C. S. L., Thomas, H. E., et al. (2013). Volcano monitoring applications of the ozone monitoring instrument. Geol. Soc. Lond. Spec. Publ. 380, 259–291. doi:10.1144/SP380.11
McLinden, C. A., Fioletov, V., Shephard, M. W., Krotkov, N., Li, C., Martin, R. V., et al. (2016). Space-based detection of missing sulfur dioxide sources of global air pollution. Nat. Geosci. 9, 496–500. doi:10.1038/ngeo2724
Mesinger, F., DeMago, G., Kalnay, E., Mitchell, K., Shafran, P., Ebisuzake, W., et al. (2006). North American regional reanalysis. North Am. regional reanalysis. BAMS 87, 343–360. BAMS-87-3-343. doi:10.1175/bams-87-3-343
Platt, U., Bobrowski, N., and Butz, A. (2018). Ground-based remote sensing and imaging of volcanic gases and quantitative determination of multi-species emission fluxes. Geosciences 8, 44. doi:10.3390/geosciences8020044
Platt, U., and Stutz, J. (2008). Physics of Earth and space environments. Springer Berlin Heidelberg.Differential optical absorption spectroscopy: Principles and applications
Plaza-Medina, E. F., Stremme, W., Bezanilla, A., Grutter, M., Schneider, M., Hase, F., et al. (2017). Ground-based remote sensing of o3 by high- and medium-resolution ftir spectrometers over the Mexico city basin. Atmos. Meas. Tech. 10, 2703–2725. doi:10.5194/amt-10-2703-2017
Raga, G. B., Kok, G. L., Baumgardner, D., Báez, A., and Rosas, I. (1999). Evidence for volcanic influence on Mexico city aerosols. Geophys. Res. Lett. 26, 1149–1152. doi:10.1029/1999GL900154
Roberge, J., Delgado-Granados, H., and Wallace, P. J. (2009). Mafic magma recharge supplies high co2 and so2 gas fluxes from popocatépetl volcano, Mexico. Geology 37, 107–110. doi:10.1130/G25242A.1
Rodgers, C. D. (2000). “Inverse methods for atmospheric sounding - theory and practice,” in Inverse methods for atmospheric sounding - theory and practice. Series: Series on atmospheric oceanic and planetary physics. Editor D. R. Clive (World Scientific Publishing Co. Pte. Ltd.). doi:10.1142/9789812813718
Schiavo, B., Stremme, W., Grutter, M., Campion, R., Guarin, C. A., Rivera, C., et al. (2019). Characterization of a uv camera system for so2 measurements from popocatépetl volcano. J. Volcanol. Geotherm. Res. 370, 82–94. doi:10.1016/j.jvolgeores.2018.09.001
Siebe, C., Abrams, M., Macias, J. L., and Obenholzner, J. (1996). Repeated volcanic disasters in Prehispanic time at Popocatépetl, central Mexico: Past key to the future?Geology 24, 399. doi:10.1130/0091-7613(1996)024⟨0399;RVDIPT⟩2.3.CO;2
Stremme, W., Krueger, A., Harig, R., and Grutter, M. (2012). Volcanic SO2 and SiF4 visualization using 2-D thermal emission spectroscopy - Part 1: Slant-columns and their ratios. Atmos. Meas. Tech. 5, 275–288. doi:10.5194/amt-5-275-2012
Stremme, W., Ortega, I., and Grutter, M. (2009). Using ground-based solar and lunar infrared spectroscopy to study the diurnal trend of carbon monoxide in the Mexico city boundary layer. Atmos. Chem. Phys. 9, 8061–8078. doi:10.5194/acp-9-8061-2009
Stremme, W., Ortega, I., Siebe, C., and Grutter, M. (2011). Gas composition of Popocatépetl volcano between 2007 and 2008: FTIR spectroscopic measurements of an explosive event and during quiescent degassing. Earth Planet. Sci. Lett. 301, 502–510. doi:10.1016/j.epsl.2010.11.032
Taquet, N., Hernández, I. M., Stremme, W., Bezanilla, A., Grutter, M., Campion, R., et al. (2017). Continuous measurements of sif4 and so2 by thermal emission spectroscopy: Insight from a 6-month survey at the popocatépetl volcano. J. Volcanol. Geotherm. Res. 341, 255–268. doi:10.1016/j.jvolgeores.2017.05.009
Taquet, N., Stremme, W., Baylon, J., Bezanilla, A., Schiavo, B., Rivera, C., et al. (2019). Variability in the gas composition of the popocatepetl volcanic plume. Front. Earth Sci. 7, 114. doi:10.3389/feart.2019.00114
Theys, N., Hedelt, P., De Smedt, I., Lerot, C., Yu, H., Vlietinck, J., et al. (2019). Global monitoring of volcanic so2 degassing with unprecedented resolution from tropomi onboard sentinel-5 precursor. Sci. Rep. 9, 2643. doi:10.1038/s41598-019-39279-y
Werner, C., Fischer, T. P., Aiuppa, A., Edmonds, M., Cardellini, C., Carn, S., et al. (2019). “Carbon dioxide emissions from subaerial volcanic regions,” in Deep carbon past to present (Cambridge University Press).
Witter, J. B., Kress, V. C., and Newhall, C. G. (2005). Volcan popocatepetl, Mexico. petrology, magma mixing, and immediate sources of volatiles for the 1994–present eruption. J. Petrology 46, 2337–2366. doi:10.1093/petrology/egi058
Wunch, D., Toon, G. C., Blavier, J.-F. L., Washenfelder, R. A., Notholt, J., Connor, B. J., et al. (2011). The total carbon column observing network. Philosophical Trans. R. Soc. Lond. A Math. Phys. Eng. Sci. 369, 2087–2112. doi:10.1098/rsta.2010.0240
Keywords: CO2, Popocatépetl, volcano, solar absorption, gas emissions, FTIR frontiers
Citation: Stremme W, Grutter M, Baylón J, Taquet N, Bezanilla A, Plaza-Medina E, Schiavo B, Rivera C, Blumenstock T and Hase F (2023) Direct solar FTIR measurements of CO2 and HCl in the plume of Popocatépetl Volcano, Mexico. Front. Earth Sci. 11:1022976. doi: 10.3389/feart.2023.1022976
Received: 19 August 2022; Accepted: 30 June 2023;
Published: 04 August 2023.
Edited by:
Christoph Kern, United States Geological Survey (USGS), United StatesReviewed by:
Andre Butz, Heidelberg University, GermanyNicole Bobrowski, Heidelberg University, Germany
Copyright © 2023 Stremme, Grutter, Baylón, Taquet, Bezanilla, Plaza-Medina, Schiavo, Rivera, Blumenstock and Hase. This is an open-access article distributed under the terms of the Creative Commons Attribution License (CC BY). The use, distribution or reproduction in other forums is permitted, provided the original author(s) and the copyright owner(s) are credited and that the original publication in this journal is cited, in accordance with accepted academic practice. No use, distribution or reproduction is permitted which does not comply with these terms.
*Correspondence: Wolfgang Stremme, c3RyZW1tZUBhdG1vc2ZlcmEudW5hbS5teA==; Michel Grutter, Z3J1dHRlckB1bmFtLm14