 Kuoyu Yang
 Congxin Chen2
 Kaizong Xia
- 1School of Civil Engineering and Architecture, Henan University, Kaifeng, Henan, China
- 2State Key Laboratory of Geomechanics and Geotechnical Engineering, Institute of Rock and Soil Mechanics, Chinese Academy of Sciences, Wuhan, Hubei, China
- 3China Coal Technology and Engineering Group Xi’an Research Institute, Xi’an, Shanxi, China
- 4School of Mines, China University of Mining and Technology, Xuzhou, Jiangsu, China
In this paper, mining-induced deformation for haulage drifts of the hanging wall at Jinshandian Iron Mine is investigated, based on 8 monitoring stations adopted laser convergence meters. Monitoring results are analyzed to divide deformation-time curves into three types: fluctuation type, partial folding type and whole folding type. Moreover, it is found that tensile deformation is easy to occur in the roadway section corresponding to no folding type and partial folding type. And in the roadway section with folding type curve, it is obviously affected by the steeply anti-inclined structural plane. Furthermore, the relative position relationship between mining activities and a monitoring station is established through local coordinate system. Mining effects on roadway deformation are studied based on rectangular coordinate components and polar coordinate components respectively. The critical value of coordinate components that have a significant impact on roadway deformation have been determined. At last, combined with results of mining impact analysis, deformation mechanisms corresponding to the three deformation curves are revealed. These results help determine the appropriate support time and adopt targeted support schemes.
1 Introduction
The mining method known as sublevel caving (SLC) is widely used underground in steeply inclined metal mines, utilizing gravity to shift the blasted ore and waste rock (Brady and Brown 2006; Brunton et al., 2010; Xia et al., 2019a; Pang et al., 2020; Wang et al., 2022). The mines that have adopted this mining method are characterized by a large number of roadways excavated along and perpendicular to the body of the metal ore strike. In general, the roadways with the shortest service cycles are arranged closer to the ore body, including haulage drifts, loading cross-cuts, etc. This type of roadways is more vulnerable to mining-induced stress after removal of ore and is more likely to suffer from ground deformation and failure. Haulage drifts are utilized for transporting the blasted ore from a whole sublevel range (Abdellah et al., 2011), and damage to this type of roadways will seriously affect the routine production and increase the economic loss of a metal mine (Zhang and Mitri. 2008; Abdellah et al., 2011; Raju et al., 2013; Abdellah et al., 2014; Shnorhokian et al., 2016; Johnson et al., 2017; Shnorhokian et al., 2018).
In an SLC metal mine, the evaluation, prediction, and control of convergence deformation of haulage drifts is intimately connected to the safety and efficiency of the production, which continues for the whole lifespan of the mine. In general, as the footwall is more stable than the hanging wall (Svartsjaern, 2018), haulage drifts are more inclined to be arranged in footwalls (Svartsjaern, 2018). However, in the case of two or more parallel ore bodies with short distances, similar to the Jinshandian Iron Mine, haulage drifts arranged as hanging walls can also be an alternative. In steeply inclined metal mines, the ore bodies usually extend along the vertical direction with the larger dimension, therefore the deformation of haulage drift roadways in hanging walls is likely to have different characteristics and mechanisms at different depth levels. The conditions for stability depend on several factors, which can be classified into two categories: naturally occurring factors and those arising from the mining work itself. Because of the complexity of the factors influencing roadway stability, empirical research has been a very effective tool for revealing the convergence deformation mechanism. In coal mines, empirical research on the relationship between mining progress and roadway deformation has achieved good results, which have been applied successfully in domestic and foreign sectors (Wagner 1974; Bai et al., 2015; Tulu et al., 2016; Gao et al., 2017; Luan et al., 2018). Also, much progress has been made in the study of rock dynamics in coal mines (Dai et al., 2022; Xu et al., 2022). However, with regard to the use of haulage drifts in metal mining, the level of empirical research has not kept pace.
To better understand the geomechanical behavior of the roadways in a metal mine, it is necessary to analyze their deformation under various conditions. A deformation model needs to be developed with relationships linking rock mass data, distance to undercut front, mining depth, relative position of the mining activity and the type of researched roadway, geotechnical indexing, support pattern, etc. (Fernandez et al., 2012; Jones et al., 2019; Lai et al., 2020). In the Malmberget mine, blast-instrument vectors were established in a spherical coordinate system to represent the spatial geometric relationship between mining blast and monitoring instrument. The typical patterns of accumulated deformation were revealed with respect to production-blast distance and inclination angle (Jones et al., 2019). However, in reality the deformation patterns of roadways were investigated only when situated at the same level or above the active mining level. In most metal mines utilizing the SLC method, several levels are mined at the same time. When the mining level extends under the haulage drift, the stability of the haulage drift will be significantly degraded, and the problems of staff safety and sustainable utilization of the roadway will be more serious. Therefore, it is particularly important to consider the influence of mining activities on the deformation of haulage drifts. This paper focused on the problem of stability of haulage drifts in the hanging wall of the Jinshandian iron mine, located at the same mining level or at lower levels. Based on analysis of the deformation monitoring results of haulage drifts, we described the deformation regulation of haulage drifts in the hanging wall to reveal typical deformation patterns and failure modes of haulage drifts at the Jinshandian Iron mine. Along with monitoring the ore body mining progress, the influence of regulation of ore body mining on roadway convergence deformation was also analyzed. This paper provides guidance for the evaluation of deformation and the prediction and control of deformation of the haulage drifts in a hanging wall at an SLC metal mine.
2 Study project
The Jinshandian iron ore company (an SLC mine) is an important ore production facility of the Wuhan iron and steel group company, which is distributed between exploration line 3 and exploration line 52 (Wang et al., 2012). The Jinshandian iron mine is divided into eastern and western parts by exploration line 25. The east part ranges from exploration line 25 to exploration line 43, which is nearly 1000 m long from east to west, 990 m wide from south to north and covers an area of about 0.9 km2. The main ore bodies are No. 1 and No. 2, which strike from east to west. Ore body No. 2 is located to the north of ore body No. 1, with a distance of 15–200 m. These two ore bodies are arranged in an imbricate shape in side-view profile. Ore body No. 1 strikes approximately east to west with an inclination of 48°–76° and an occurrence elevation range of +16 m to about -1000 m. The ore body is simple and regular in shape, layered, thin at the top and thick at the bottom, thick in the east and thin in the west. Its thickness is generally 20–80 m. The occurrence elevation range of ore body No. 2 is +70 to about -719 m. The ore body is exposed to the surface between exploration lines 26 and 34. The shape of ore body 2 is more complex than that of ore body 1, with a thickness range of 10–150 m.
The lithology of the rock mass surrounding the haulage drift in the hanging wall mainly consists of hornstone and magmatic rock in a fault-fracture zone. The hornstone is divided into two parts by the magmatic rock layer, which has high strength, relatively high completeness, and a low degree of alteration. The comprehensive rating of rock mass quality is grade 2. Hornstone distributed close to the ore body is strongly affected by tectonism and alteration, which causes the rock mass to have poor quality and low strength. Fault F4 strikes east to west across the eastern part with a dip range of 55°–85°and average width of 35 m. Along the strike and F4 inclination fault, the main lithology is black skarn present as the current waveform, and the dip angle decreases with increasing depth. The rock mass in fault F4 is highly fissured, and the tensile fractures are well developed and filled with later calcite veins, indicating that F4 has experienced tensional tectonism activity. Based on the comprehensive rating of rock mass quality, fault F4 is graded as 5, with average strength generally less than 55 MPa. Because the geological conditions of the strata in the Jinshandian iron mine are characterized by variability, support schemes of haulage drifts should be designed and conducted according to the actual situation of rock mass exposed by excavation of haulage drifts. The following principles must be followed in the actual support designs: 1) stable haulage drifts with small exposed area and hard surrounding rock mass should be supported by shotcreting or shotcreting combined with bolts; 2) if surrounding rock mass exposed by haulage drifts excavation has large surface area, the support strength should be improved by one level, within a radius of 5 m around the exposed center; and 3) unstable rock should be supported by double-layer shotcreting combined with anchors and reinforcement mesh, and highly fractured rock should be supported by steel I-beams.
The field investigation of the occurrence and properties of structural joints was carried out in the haulage drift and roadways near the ore body. The investigation sites mainly include the well-developed geological outcrops of ground-surface, the roadways of the -340, -354, -368, -382, and -396 m sublevels. The survey results showed that the rock mass surrounding the haulage drift in the hanging wall contained three groups of major joints. Most of the joints were closed and smooth, showing obvious shear characteristics, but a few joints had openings <3 mm. In addition, because of the fault structure, there were cracks distributed in the rock mass surrounding the roadways with small openings, most of which were filled with calcite. The specific information about the joints in hanging wall obtained from geological exploration are shown in Figure 1 and Table 1 (Ge et al., 1999; Chen 2006; Xia et al., 2019b). Due to the cutting of these joints, the geological strength of the rock mass in the hanging wall was greatly reduced (Xia et al., 2022).
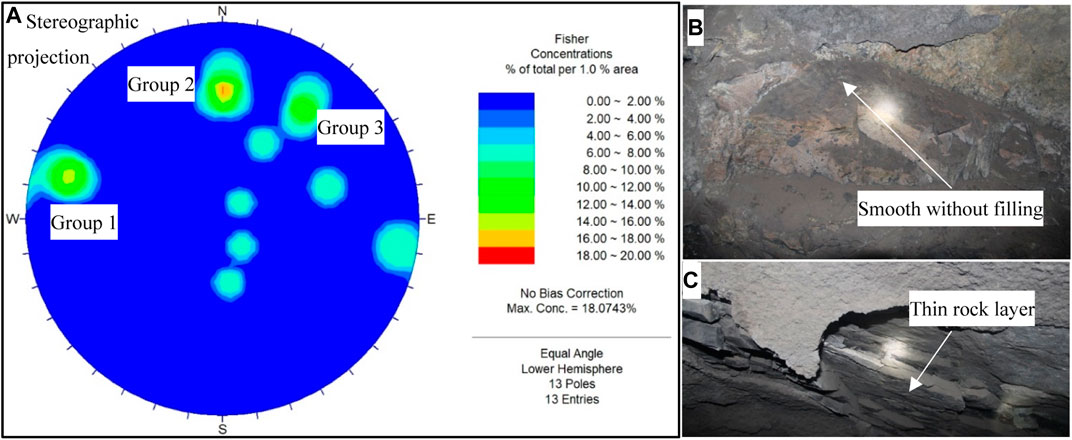
FIGURE 1. Stereographic projection and observed characteristics for the discontinuities in the hanging wall. (A) Stereographic projection. (B) Group 1. (C) Group 2.
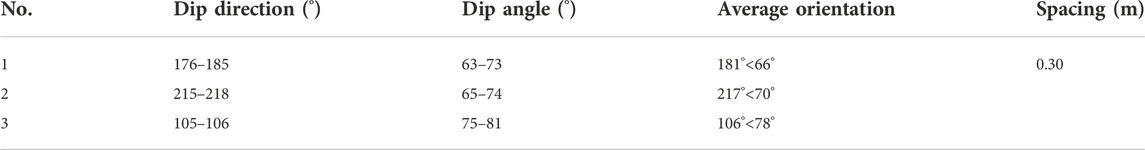
TABLE 1. Attitude of the major joints in the hanging wall.
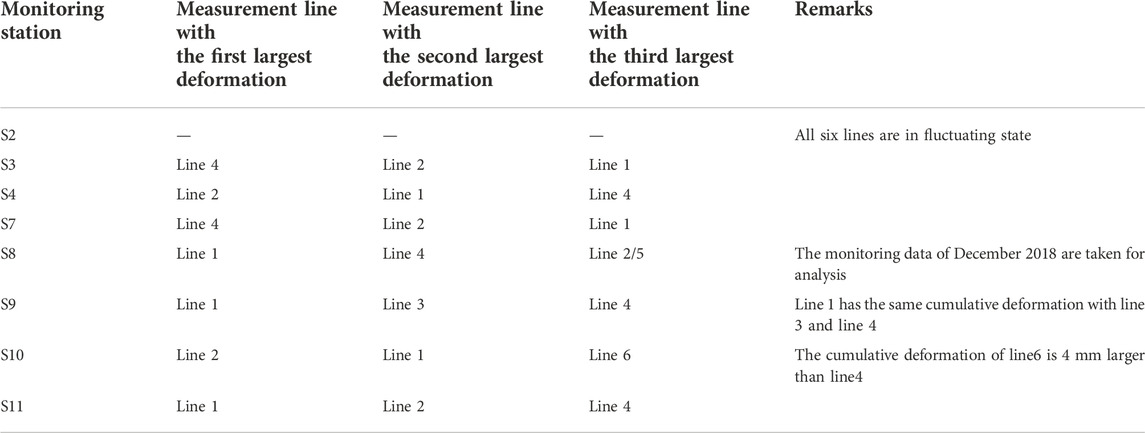
TABLE 2. Deformation situation of measurement lines in each monitoring station.
In the eastern part of the Jinshandian mine, the activities of production blasting, caving, and ore removal mainly occurred primarily in the crosscuts. The rows of production blasting holes were distributed along a crosscut at the same distance of 3 m, and each row of blasting holes was arranged in a fan-shaped drilling pattern upwards to the roof. The orebody fragmented by blasting was allowed to cave in by gravity, then removed to the next destination in the sublevel haulage drift. To facilitate transportation, the sublevel haulage drifts were designed parallel to the orebody strike and excavated outside of ore body No. 1 and No. 2 in the hanging wall and footwall. This paper focused on the haulage drifts at different sublevels in the hanging wall, which had a similar average distance from ore body No. 1. In September 2005, the mine began to carry out forced roof caving by blasting at the -270 m level as an essential preparation before mining was begun. The sequence of forced roof caving was from east to west in ore body No. 1 and from west to east in ore body No. 2. Because of unresolved surface problems, the forced roof caving was stopped and restricted many times, which postponed operations. From April 2009 to February 2012, mining in the eastern part was suspended. Production resumed in March 2012, with an average annual decline rate of 12 m. In December 2015, the mining of the sublevel at -354 m was started, which was the first sublevel of the -410 m level. During this period, ore body No. 1 was divided into east and west slopes for mining, of which the west slope was the main one, with an area of about 11,700 m2. The crosscuts were arranged in a north-south direction, and the mining sequence in the crosscut was from north to south. Ore body No. 2 was also divided into east and west slopes for mining, of which the east slope was the main one. The crosscuts were excavated in the north-south direction, and the mining sequence was from south to north. By May 2019, the mining in the east part had been extended downward to the -382 m sublevel. The mining boundaries of each level and the specific time schedule are shown in Figure 3.
3 Monitoring method and deformation data
3.1 Structure of monitoring station and in situ monitoring
Measurement of roadway convergence is widely conducted in a mine and can assist in evaluating the stability of the roadway. To ensure that the measurement job does not interfere with production, the measurement method must be easy to implement. Usually, the roadway convergence deformation is obtained by measuring the distance of a detachable steel wire between two measuring points arranged on the roadway surface (Liu et al., 2011; Meng et al., 2013; Yi et al., 2014; Yao et al., 2016; Lu et al., 2019). However, this measurement method has the disadvantage of large manual error. In order to monitor roadway deformation both conveniently and accurately, a method based on optical measurement principles was developed. Specifically, a monitoring station included two devices for fixing and rotating the laser rangefinder and five measuring points made of reflective materials. Two of the devices were positioned at the bottom corners of the two sidewalls, respectively, and the five measuring points were evenly distributed around the roadway section, as shown in Figure 2. The fixing and rotating device of the laser rangefinder consisted of an anchoring part, a part for adjusting direction, and a base. Since the field construction method cannot ensure that the five measuring points and two fixing devices are completely within the same section, the direction adjusting part of the laser rangefinder is made to rotate 360° to allow smooth implementation of the measurement, which is vital for the in-situ application.
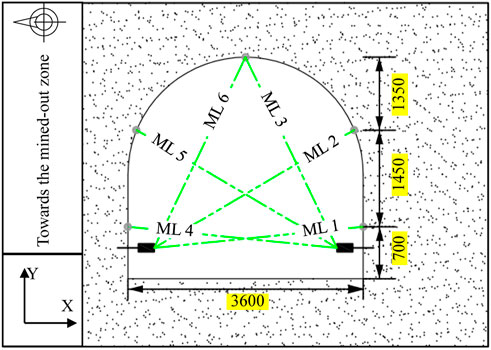
FIGURE 2. Measurement line layout of the laser convergence meter monitoring stations (ML means measurement line).
The on-site measurement process of the monitoring station of the laser convergence meter can be summarized as follows: 1) The laser rangefinder is fixed on the base of the fixing and rotating device anchored to the northern sidewall closer to the mined-out zone. 2) The beam from the laser rangefinder is aimed at the three measuring points on the opposite sidewall from bottom to top, and the distances are recorded in sequence (line 1, line 2, and line 3, respectively). 3) The laser rangefinder is fixed on the base of the fixing and rotating device anchored to the opposite sidewall and step (2) is repeated. The results obtained are the lengths of lines 4, 5, and 6, respectively. Each line is measured three times, and the results are averaged. The measurement accuracy is 1 mm, and the included angles between the six measurement lines and the x-axis are 5°, 30°, 65°, 115°, 150°, and 175°. Monitoring data were acquired manually approximately once a month. The difference between the measured values of two adjacent months is how the convergence deformation rate is calculated for each month. A negative value represents convergence deformation of the roadway, while a positive value represents tensile deformation of the roadway. Through the analysis of monitoring data, the deformation characteristics of a roadway section can be determined (Shen et al., 2018).
3.2 Monitoring station layouts
In order to comprehensively and systematically study the deformation regulation of haulage drift in a hanging wall during mining, a monitoring network composed of laser convergence meter monitoring stations has been gradually installed beginning February 2018 at the -354 and -368 m sublevels. Due to the proximate distance between each haulage drift and the boundary of the mined-out zone along the strike direction of the ore body, the evenly distributed data from the monitoring stations in each haulage drift are helpful for comparative analysis of the different haulage drifts; a comparison of the deformation regulations of a haulage drift could also be made along the strike. Based on the mining schedule of the ore body at the -410 m level, eight groups of monitoring stations were installed in the haulage drift at the -354 and -368 m sublevels, with the serial numbers of S2, S3, S4, S7, S8, S9, S10, and S11, respectively (Figure 3).
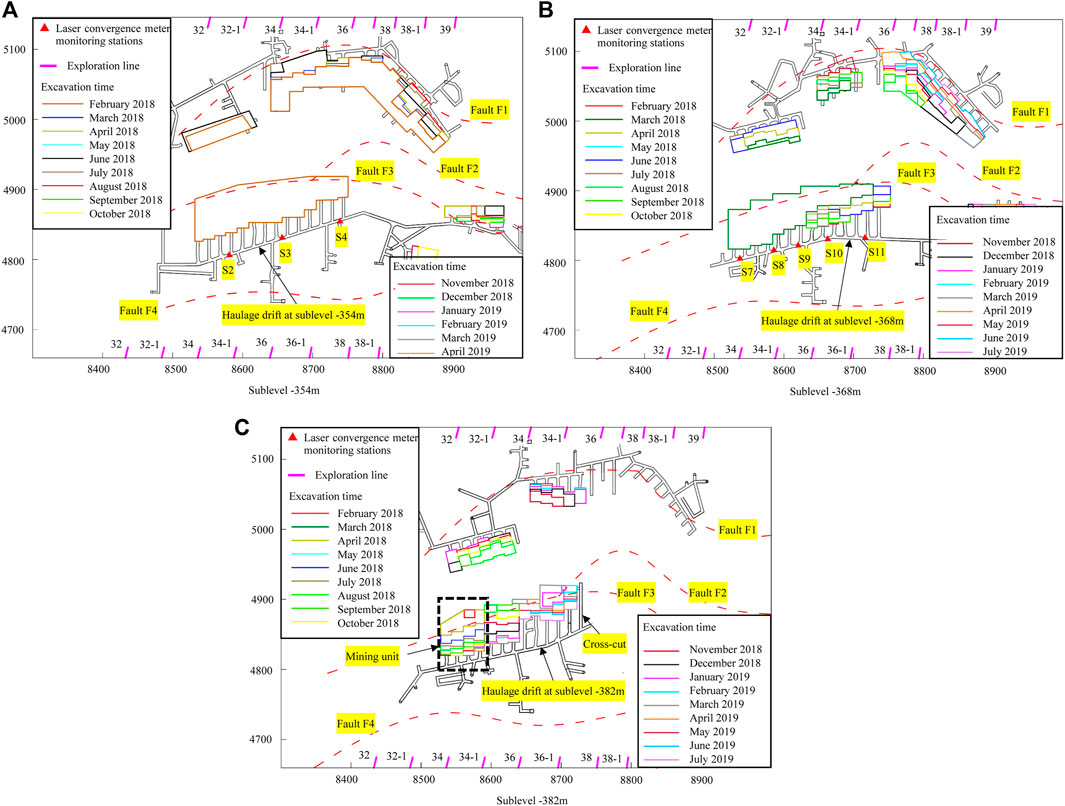
FIGURE 3. Planar projection of the laser convergence meter monitoring stations and the mined-out areas. (A) Sublevel -354 m. (B) Sublevel -368 m. (C) Sublevel -382 m.
In February 2018, all eight groups of laser convergence meter monitoring stations at the -354 and -368 m levels were in operation, and the first deformation data was acquired in February. In March 2018, because of the steel pipe suspended on the side wall, the deformation data of measurement line 6 of S10 and S11 could not be acquired. The location of roof measurement points was redesigned in early May 2018. At the beginning of May 2018, monitoring station S4 was damaged by an on-site operation and could not be used until it was repaired in June 2018.
3.3 Deformation data
For analysis of the deformation regulation and mode of the roadway, the deformation mechanism of the roadway where each monitoring station was located was inferred through the cumulative deformation relationships of the six measurement lines at each monitoring station. To directly compare the influence of mining laws at different roadway sections, we selected the measurement line with the largest cumulative deformation among the six measurement lines for most of the analysis and determined the cumulative deformation. In a mine with a horizontally stratified ore body, the deformation of the roadways near the mined-out zone was mainly affected by mining at the same level. For studies on the regulatory influence of mining, the horizontal distance between individual monitoring instruments and the location of mining activity were sufficient to determine the simple relative position relationships. In a steeply inclined metal mine, however, the roadways were affected by multi-level mining activities. In order to quantitatively analyze the influence of mining on roadway deformation, we selected the four variables, distance, inclination angle, horizontal distance and vertical distance to describe the geometric relationship between each individual instrument, and the location of mining activity. It should be noted that in this study we only considered the two working conditions in which the monitoring stations were at the same level or above the active mining level.
4 Investigation of roadway deformation
4.1 Cumulative deformation character
Monitoring stations S2 and S7 were installed at the -354 and -368 m sublevels, respectively, between exploration lines 32-1 and 34, and the deformation curves are shown in Figure 4. Because of the high rock quality of the rock mass surrounding monitoring station S2, the cumulative deformation-time curves of monitoring station S2 with six measurement lines showed a fluctuating state, but without an increasing trend. Specifically, the lower and upper limits of fluctuation were -4 and 2 mm, respectively. In contrast to monitoring station S2, the cumulative deformation of measurement lines 1, 2, and 4 of monitoring station S7 increased slowly from March 2018 to May 2019 and had positive values that represented tensile deformation of the roadway. There were several lapses in the general increase of the curves. For example, the cumulative deformation of measurement line 4 decreased by 1 mm in October 2018 and measurement line 2 decreased by 3 mm in November 2018, while the other measurement lines were in a fluctuating state without clear deformation. The maximum cumulative deformation of station S7 was 6 mm, which appeared on measurement line 4. It should be noted that the research for this paper focused on the mining-induced deformation of haulage drift in a mine that had adopted SLC, wherein the mining was done at the same level as the haulage drift or below it. The deformation of this kind of roadway is not only affected by mining stress, lithology, and the structural plane but also by movement of the hanging wall. It is not difficult to understand why tensile deformation appeared on measurement lines 1, 2, and 4. Considering that one end of these three measurement lines was located at the bottom corner of the northern sidewall closer to the mined-out zone, it was proved that this area was the first part of the roadway section affected by movement of the hanging wall toward the mined-out zone. The appearance of interruptions in the data trends which implies convergence deformation of the roadway could be caused by changes in mining-induced stress. Because the horizontal mining sequence of ore body 1 is from west to east, monitoring station S7 should be the most affected by mining activities. During the monitoring period, the mining near monitoring station S7 was extended to the level of -396 m. However, the tensile deformation in this area was very small and still in the stage of elastic deformation. It corresponded to the geological engineering situation of the surrounding rock in this area, which was characterized by hardness and high strength. The field rock-hitting test also reflected that the rock was strongly resistant to impact.
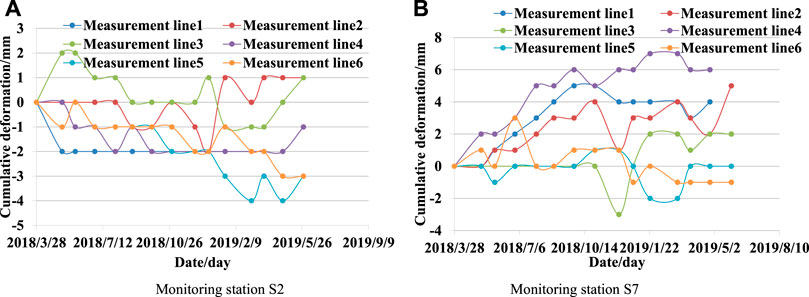
FIGURE 4. Displacement–time curve of the monitoring stations between exploration line 32-1 and exploration line 34. (A) Monitoring station S2. (B) Monitoring station S7.
Monitoring stations S8 and S9 were operated at the -368 m sublevel, between exploration lines 34 and 34-1. Six measurement lines at station S8 had convergent deformation toward the inner roadway space. Before March 2019, these six measurement lines were in the process of slow and stable deformation, as shown in Figure 5. The deformation of measurement line 4 began to accelerate in March 2019. Overall, the cumulative deformation of station S8 was small, as the cumulative deformation of measurement line 4 was only 2 cm. It should be noted that in December 2018, lines1, 2, and 3 were damaged, because an error by the staff caused the fixing device of the laser rangefinder on the sidewall near the mined-out zone to be covered by shotcrete. Therefore, in order to analyze the deformation mode of the roadway section near station S8 through the six measurement lines, the data of December 2018 were used. Among the six measurement lines, 1 and 4 were the highest in cumulative deformation range in descending order followed by lines 2 and 5, with 3 and 6 coming in last. This implies that the convergent deformation of the roadway section had good symmetry. Although the joints were more developed compared with S2, there was no asymmetric deformation caused by the action of dominant joints. Even though the distance between stations S8 and S9 was small, the six measurement lines of station S9 fluctuated from March 2018 to January 2019, which proved that the deformation modulus of the surrounding rock was larger. Since January 2019, the four measurement lines, 1, 3, 4, and 6, began to show accelerated deformation, but the trends were different. Specifically, tensile deformation occurred on lines 1 and 4 in January 2019, which were similar to lines 1, 2, and 4 of station S7. This indicated that the bottom corner of the northern sidewall moved toward the mined-out zone. However, 1 and 2 months later, convergent deformation occurred on lines 3 and 6. The convergence value of line 3 was greater than that of survey line 6, which implied that the roof of the roadway sank toward the mined-out zone. Then, a month later in April 2019, a roof collapse occurred in the area of S9, and the station was damaged. After this disaster, an I-beam support was installed at the site. The deformation rate of measurement lines 1, 4, 3, and 6 increased significantly before the roof collapse. In particular, the deformation rate of line 3 (one end was located on the roof) reached 8 mm/month, which served as a good early warning of the roof collapse. The maximum cumulative deformation of station S9 before the failure was only 1 cm, which represented a typical elastic brittle failure. The contrary growth trend of lines 1, 3, 4, and 6 of station S9 provided a good basis for revealing the mechanism of the roof collapse, which is explained in Chapter 6.
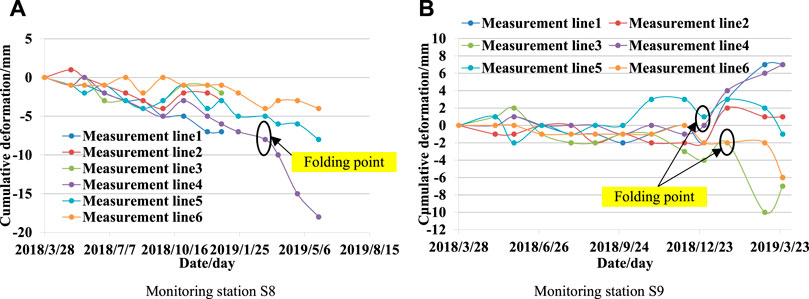
FIGURE 5. Displacement–time curve of the monitoring stations between exploration line 34 and exploration line 34-1. (A) Monitoring station S8. (B) Monitoring station S9.
Monitoring stations S3, S4, S10, and S11 were located between exploration lines 34-1 and 36-1. The deformation of all measurement lines of S3, S4, S10, and S11 decreased monotonically with time, which meant that the deformation could be attributed to the convergence of the roadway caused by mining-induced stress (Figure 6). The deformation of these four monitoring stations showed similar characteristics. The top three measurement lines of largest deformation at S3, S4, and S11 were lines 1, 2, and 4 (not in order). Although line 6 ranked third in section S10, the cumulative deformation was only 4 mm larger than line 4. Therefore, generally the deformation regulation and mode was consistent with those of sections S3, S4, and S11. The on-site damage investigation of the surrounding rock showed that in these areas, the roadway section deformations were mainly concentrated in the bottom corner of the northern sidewall and the shoulder position of the southern sidewall. Combined with the distribution characteristics of the on-site structural planes, it is not difficult to see that the most developed group of structural planes was the steep anti-inclined structural plane that resulted in the buckling deformation of the bottom corner of the northern sidewall, and the bending and toppling deformation of the southern sidewall. Structural planes and mining-induced stresses were the main reasons for the deformation mode in this area. Except for the station S10, the minimum deformation of all other monitoring stations occurred in the direction of measurement line 6, connecting the roof and the bottom corner of the northern sidewall. Compared to the roof developed with horizontal structural planes, the roof with more developed steep structural planes had significantly better stability, which is also the main reason for the minimum deformation of line 6.
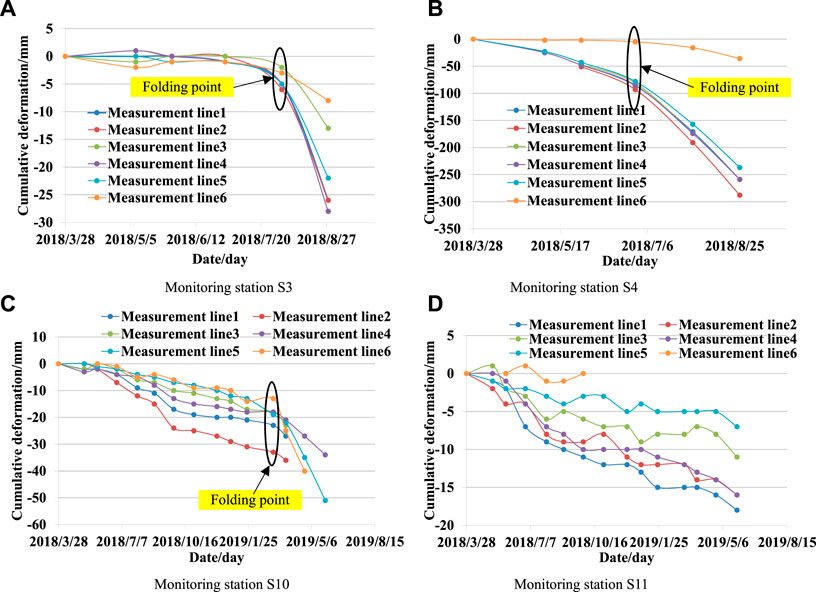
FIGURE 6. Displacement–time curve of the monitoring stations between exploration line 34-1 and exploration line 36-1. (A) Monitoring station S3. (B) Monitoring station S4. (C) Monitoring station S10 (D) Monitoring station S11.
4.2 Curve types for cumulative deformation
In a metal mine, the classification of deformation curve based on an apparent folding point which signifies the onset of rapid increases, can effectively help in determining the deformation and failure mechanism (Xia et al., 2016). According to the cumulative deformation characteristics of the six measurement lines in the monitoring stations, the cumulative deformation curves of the haulage drifts in hanging walls could be divided into three types: no folding, partial folding and whole folding. For example, the deformation curve of station S2 was in a fluctuating state, and the cumulative deformation of lines 1, 2, and 4 of station S3 increased slowly and linearly with time. There was no folding point followed by deformation acceleration in the deformation curve, and the largest cumulative deformation value in the two monitoring stations did not exceed 10 mm, meaning that the surrounding rock stability was good. In stations S8 and S9, parts of the measurement lines have folding points, including line 4 of station S8 and lines 1 and 4 of station S9. In these areas the joints were relatively developed, resulting in accelerating deformation without convergence at the part of the roadway section under the influence of mining-induced stress. It should be noted that, in the roadway sections of stations S3, S4, S10, and S11, the cumulative deformation curve belonged to the whole folding type. The six measurement lines had entered the accelerating deformation stage without convergence after appearance of the folding points. The maximum cumulative deformation at these four stations occurred on line 2 in station S4, and exceeded 280 mm. It was found that tensile deformation occurred more easily in roadway sections of the no-folding and the partial-folding types, because in these areas, most of the rocks surrounding the roadway had elastic and brittle characteristics and were little affected by mining stress. Generally, when the mining activity was below the roadway, the northern sidewall of the roadway moved toward the mined-out zone under the influence of the movement of the hanging wall. Roadway sections with folding type curves were more obviously affected by the steely anti-inclined structural planes under the influence of mining-induced stress. Therefore, the surrounding rock of the roadway showed great ductility and obvious convergent deformation, which was dominated by the buckling deformation of the bottom corner of the northern sidewall and the bending and toppling deformation of the southern sidewall.
5 Mining effect on roadway deformation regulation
At the Jinshandian iron mine, three or four crosscuts form a mining unit with a width of 48 or 64 m. These crosscuts almost maintain consistent mining progress (Figure 3C). During the mining period of the nearest mining unit, the deformation at the monitoring station increased rapidly. To determine the effects of mining on roadway deformation, it was necessary to establish the relationship between the position of the mining activities and the monitoring stations. Since this distance was sufficiently large, only the excavation of the mining unit nearest to the monitoring station had a significant impact on rock mass deformation. Therefore, vertical to the strike direction of the ore body, the geological profiles were drawn through eight monitoring stations. Eight local coordinate systems were established with the eight monitoring stations as the origins. Monitoring station S2 was taken as an example to illustrate the establishment rules of local coordinate system (Figure 7). The local coordinate systems stipulated that the north direction was the positive direction of the x-axis and the vertical upward direction was the positive direction of the y-axis. Manual reading of the measured data was done at the end of each month. The mining progress at the end of each month was also updated in the geological section in time. In this way, we could conveniently quantitate the relative positions of the mining progress and the monitoring stations monthly. It can be seen in Figure 7 that the relative positions can be characterized by four variables, namely, x (x-coordinate of withdrawal line position), y (y-coordinate of withdrawal line position), r (length of connecting line between withdrawal line and monitoring stations), and φ (angle between the connecting line of withdrawal line and survey station and x-axis), where x and y are rectangular coordinate components, and r and φ are polar coordinates components.
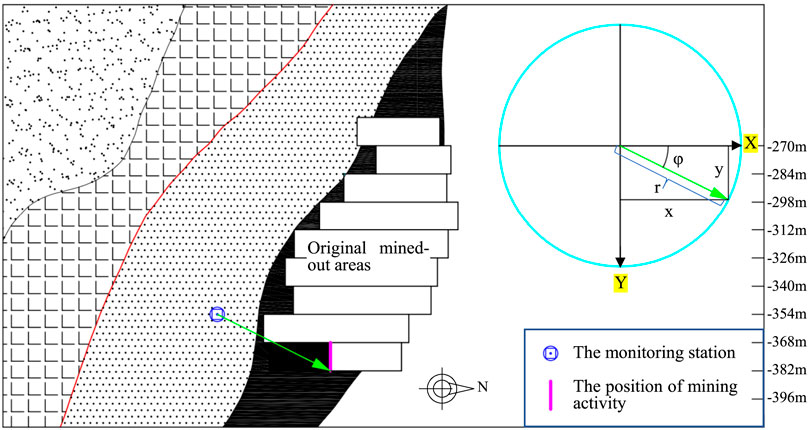
FIGURE 7. Relative position relationship between the monitoring station and the mining activity (section of exploration line 34).
Polar coordinates or rectangular coordinates can be applied to the above eight local coordinate systems. In order to illustrate the applicability of the two coordinate systems, the mining effects under the two coordinate systems are analyzed below. Using only a single coordinate system alone cannot accurately explain the impact of mining, and could even cause confusion. For example, in a rectangular coordinate system, when the ore body at the same level as the monitoring station is mined toward the hanging wall, the deformation amount and deformation rate increase continuously as mining activity moves toward the monitoring station. However, when mining extends to the next level below, the activity will begin at the southern end of the mining unit, which causes the coordinate component x to rapidly increase. The increase in deformation rate of the monitoring station would be difficult to explain under these conditions, unless the increase in coordinate component y was also considered. The same phenomenon exists with polar coordinates. Therefore, we employed a tool that included both coordinate components and deformation information in a graph at the same time. The influence of mining on roadway deformation was analyzed comprehensively through the graphs. It should be noted that the deformation curve of the monitoring station in the graph selects the measurement line with the largest cumulative deformation among the six monitoring lines. The deformation of this type of measurement line is the most sensitive to the influence of mining and can accurately analyze the influence of mining on the deformation measured at the monitoring station.
5.1 Mining effects under the polar coordination system
Figures 8A, 9A, 10A show the relationship between the cumulative deformation at each monitoring station and the distance between the mining activity and each monitoring station. Figures 8B, 9B, 10B reflect the cumulative deformation at each monitoring station and the inclination angle of the connection between the mining activity and each monitoring station. In all figures, the left coordinate axis represents the cumulative deformation of the monitoring station. In part A of figures 8, 9 and 10 the distance of the mining activity is plotted on the right coordinate axis, and in part B of figure 8, 9 and 10 the inclination angle of the connection between the mining activity and each monitoring station is plotted on the right coordinate axis.
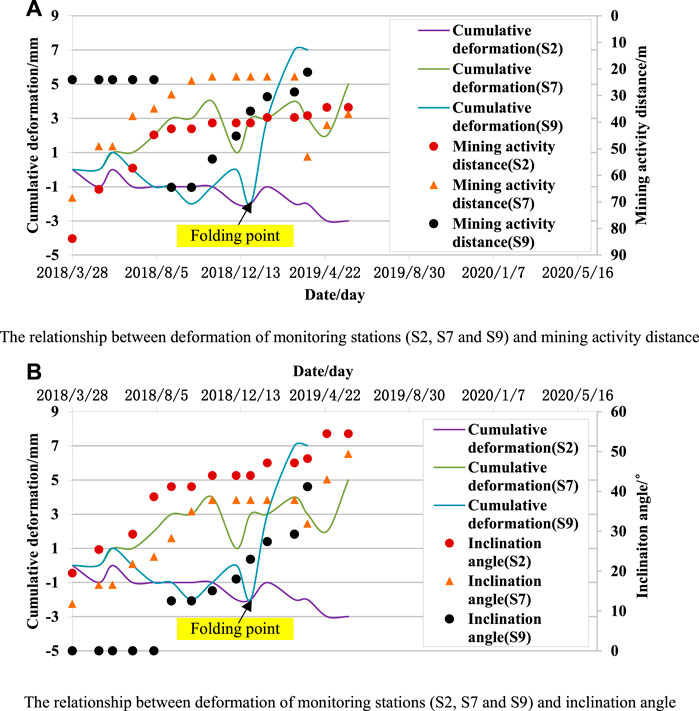
FIGURE 8. Relationship between deformation of monitoring stations (S2, S7, and S9) and mining under polar coordination system. (A) The relationship between deformation of monitoring stations (S2, S7, and S9) and mining activity distance. (B) The relationship between deformation of monitoring stations (S2, S7, and S9) and inclination angle.
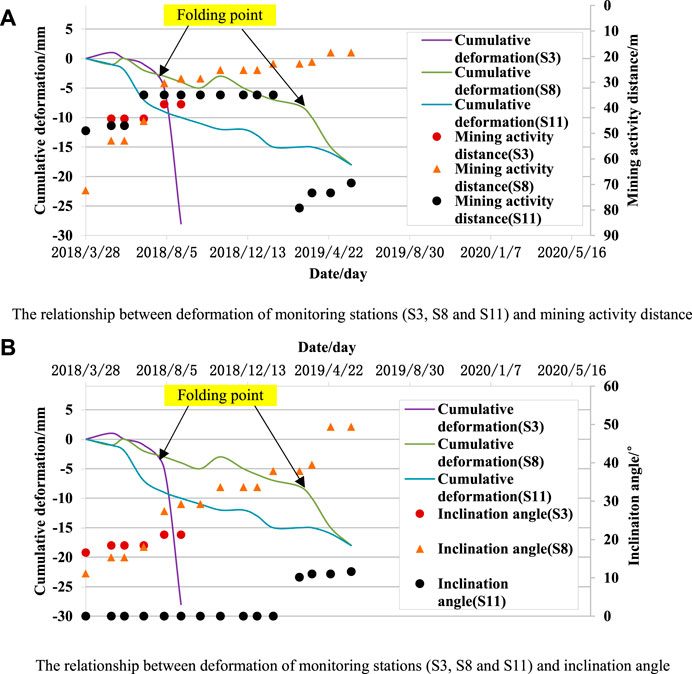
FIGURE 9. Relationship between deformation of monitoring stations (S3, S8, and S11) and mining under polar coordination system. (A) The relationship between deformation of monitoring stations (S3, S8, and S11) and mining activity distance. (B) The relationship between deformation of monitoring stations (S3, S8, and S11) and inclination angle.
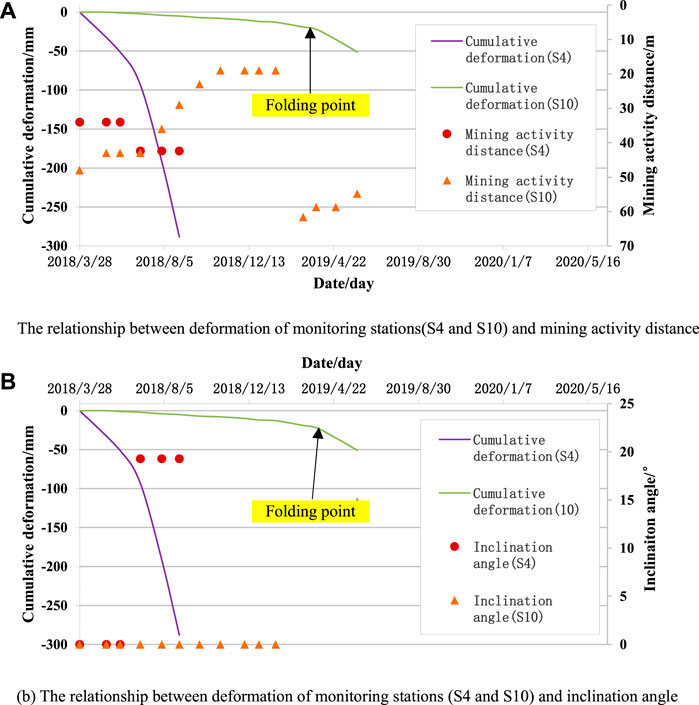
FIGURE 10. Relationship between deformation of monitoring stations (S4 and S10) and mining under polar coordination system. (A) The relationship between deformation of monitoring stations (S4 and S10) and mining activity distance. (B) The relationship between deformation of monitoring stations (S4 and S10) and inclination angle.
Some situations need to be explained in advance before determining the effects of mining on the deformation of haulage drifts. In some figures, the mining activity distance (part A) or the inclination angle (part B) does not change with date in some periods, indicating that the ore body near the monitoring station was not being mined during that period. In general, as mining continues, the mining activity distance gradually decreases and the inclination angle increases with time. However, in some situations, the two variables show a sudden change. Taking monitoring station S10 as an example, the mining activity distance suddenly increased 42.6 m and the inclination angle suddenly increased 13.13° in February 2019. This is because the mining operation was moved to the next sublevel, and at each sublevel, the mining starts from the north end of the ore body.
Based on parts A and B of the figures, the correlation between mining activity distance, inclination angle, and deformation at the monitoring station can be determined. The deformation curve at S2 basically fluctuated around 0 mm, and thus had no obvious correlation with mining activity distance and inclination angle, which was mainly due to the high quality of the rock mass surrounding station S2. However, on the whole, the deformation magnitude of most monitoring stations was negatively correlated with mining activity distance and positively correlated with inclination angle. From an engineering perspective, the decrease in the distance between the mining activity and the monitoring station and the increase in the inclination angle will reduce the distance between the monitoring station and the mined-out zone, which is not conducive to roadway stability. Acceleration occurs in the cumulative deformation curve of most monitoring stations following the folding point, which is marked by the arrow in Figures 8–10. According to statistics, in several stations with deformation acceleration, a deformation rate of 85% of the measurement lines exceeds 5 mm/day after acceleration, and they all entered the accelerating deformation stage without convergence. Therefore, a deformation rate of 5 mm/day was established as the threshold for the haulage drift in the hanging wall to enter the accelerating deformation stage without convergence, and the folding point before accelerated deformation of reaching this threshold of deformation rate was particularly noteworthy. Here, the inclination angle and the mining activity distance corresponding to date for this type of folding point were defined as the critical inclination angle and the critical mining activity distance respectively. The critical initiation angle and critical mining activity distance of each monitoring station are shown in Table 3. Most of the reasons for this difference of critical initiation angle and critical mining activity distance were related to the rock mass structure and alteration degree of the monitoring stations. Although the lithology remained unchanged from west to east along the strike of the ore body, the rock mass structure was gradually broken and the alteration degree gradually increased. Therefore, from another perspective, the change in rock mass structure and alteration degree along the strike can be reflected in the relationship between the position of a monitoring station along the strike direction of the ore body and the critical inclination angle or critical mining activity distance of each monitoring station.
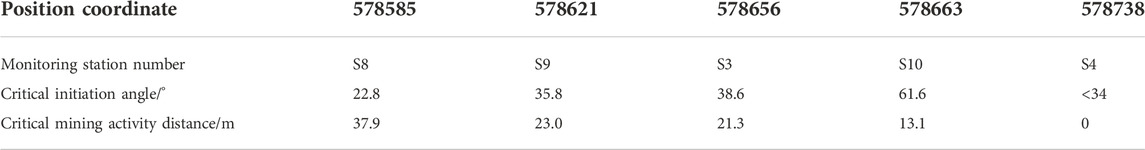
TABLE 3. Critical initiation angles and critical mining activity distances at different positions in the haulage drift.
5.2 Mining effects under the rectangular coordinate system
During the deformation-monitoring period, the deepest mining level of the ore body near stations S2 and S7 was the second sublevel, 28 m below. Although the horizontal distance from the monitoring station S2 to the mining activity changed continuously, the deformation at the six measurement lines of station S2 fluctuated throughout the entire monitoring period (Figure 11). During the monitoring period of S7, the main mining activity was at the -382 m sublevel. In the later stage of the monitoring period (March 2019–May 2019) a small amount of ore body at the -396 m level was also mined. However, regardless of the mining level, station S7 had always been in a state of slow elastic deformation without creep deformation.
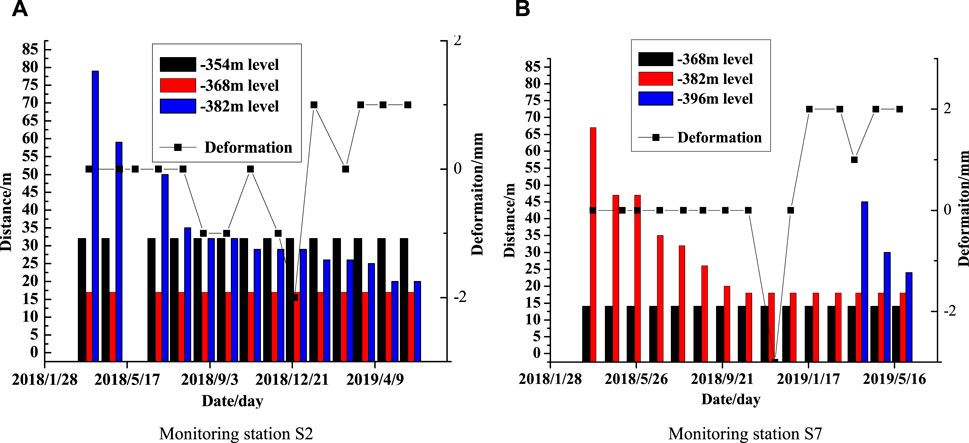
FIGURE 11. Relationship between deformation of monitoring stations (S2 and S7) and mining under rectangular coordination system. (A) Monitoring station S2. (B) Monitoring station S7.
The deepest mining level experienced by the other six monitoring stations during the monitoring period was the first level below. During the monitoring period of S8 and S9, the nearby ore body at the -368 m sublevel was mined out, and the main mining activity was changed to -382 m. Obviously, the deformation at the two monitoring stations was in an elastic state at the beginning of mining at the -382 m sublevel. S8 showed a slow elastic deformation rate (<2 mm/month), and S9 showed no clear deformation (Figure 12). When the horizontal distance between mining activity and monitoring station reached a certain threshold, the stress of the rock mass surrounding the station exceeded the compressive strength and entered an accelerating stage of deformation without convergence or brittle failure. For example, in April 2019, when station S8 was 12 m away horizontally from the mining activity at sublevel -382 m, the deformation began to accelerate, exceeding 5 mm/month. At station S9, when the mining activity at sublevel -382 m was moved to a position 15 m away, the deformation accelerated and S9 was rapidly destroyed. The analysis above shows that the deformation acceleration without convergence of S8 and S9 occurred at the moment when the horizontal distance between the mining activity and the monitoring station was less than 12–15 m at -382 m (the first sublevel below the monitoring station).
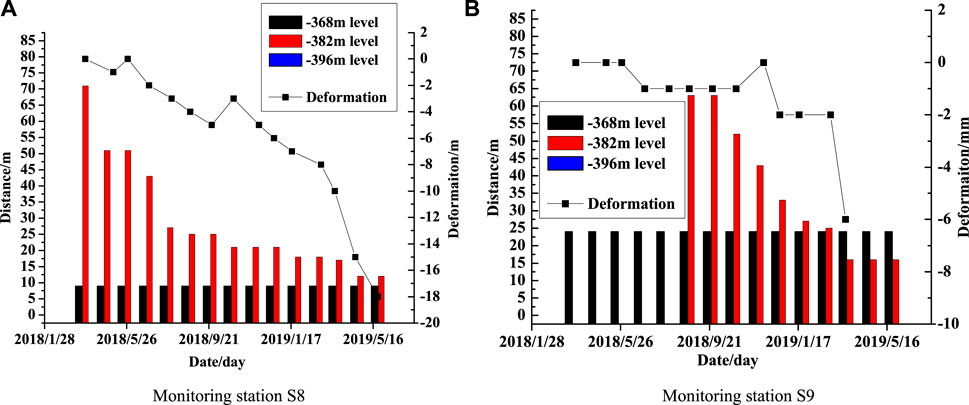
FIGURE 12. Relationship between deformation of monitoring stations (S8 and S9) and mining under rectangular coordination system. (A) Monitoring station S8. (B) Monitoring station S9.
The other stations S3, S4, S10 and S11 belong to the whole folding type, and the deformation curves of the six measurement lines all have obvious folding points (Figure 13). The folding points of S3 and S10 appeared during mining one sublevel below, while the folding points of S4 and S11 occurred during mining at the same sublevel as the monitoring stations. Although the deformation modes of the four stations were similar, the folding points at S4 and S11 appeared earlier than at the other two. This can be attributed to the more broken rock mass surrounding S4 and S11, which was located to the east of S3 and S10. It should be noted that S4 did not show a true folding point, because the initial deformation rate reached nearly 50 mm/month. Obviously, the folding point had appeared before the initial deformation value. It can be seen from Figure 13 that in the month when the folding points occurred at S3 and S10, the horizontal distance from the mining activity to the monitoring station was 36 and 57 m, respectively. While the folding point of S4 was not monitored, it can be inferred that it occurred before March 2018, which was the first month of the monitoring period.
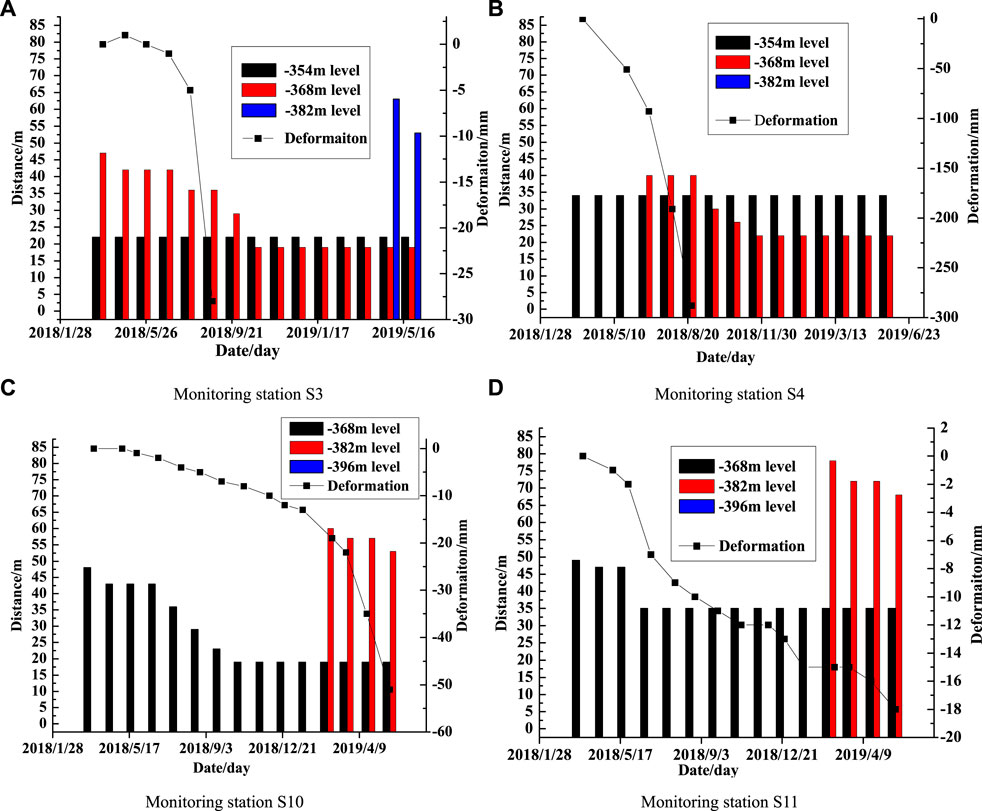
FIGURE 13. Relationship between deformation of monitoring stations (S3, S4, S10, and S11) and mining under rectangular coordination system. (A) Monitoring station S3. (B) Monitoring station S4. (C) Monitoring station S10. (D) Monitoring station S11.
6 Deformation mechanism of a haulage drift in a hanging wall
Three types of deformation curves of a haulage drift in a hanging wall were proposed above, the no-folding type, the partial-folding type and the whole-folding type from west to east along the ore body strike. Combined with the influence of mining on deformation, the lithology and rock mass structure conditions, the deformation mechanisms of the three deformation types are analyzed below.
6.1 Roadway with no folding type curve
Although several groups of dominant structural planes with occurrence of 181°<66°, 217°<70° and 106°<78° exist in the Jinshandian iron mine, the distribution regularity of structural planes is not clear. For example, the rock mass surrounding a roadway with the no-folding type of deformation mode is more stable, leading to less exposure of rock mass from destruction of the roadway spray layer. Based on only one exposure of surrounding rock at the -354 m sublevel, the geological survey results showed that the exposed lithology was breccia and the rock mass was relatively complete and dense with high strength. A structural plane with an attitude of 227°<14° was found, which had high strength and was tightly closed without filling. To analyze the deformation mechanism of the roadway with no folding type under the influence of mining, profile A-A was chosen along a direction perpendicular to the strike of the ore body through station S7 (Figure 14). During mining at the same sublevel and the first sublevel below the roadway, it maintained good stability and there was no clear deformation in the rock mass despite the mining stress. Compared with the steeply inclined structural plane, the structure plane with a small dip angle had less influence on roadway stability under mining conditions. The deformation of the roadway with no folding began at the stage when the mining level extends to 28 m below. Affected by the overall movement of the hanging wall, the rock mass surrounding the roadway also moved toward the mined-out zone. Because of the smaller distance between the bottom corner of the northern sidewall and the mined-out zone, its displacement was the largest, while the displacement of the other parts of the roadway section decreased gradually with increasing distance from the mined-out zone (Figure 14). There was an abnormal tension deformation phenomenon in the roadway as a result of the difference in overall displacement movement of the roadway section.
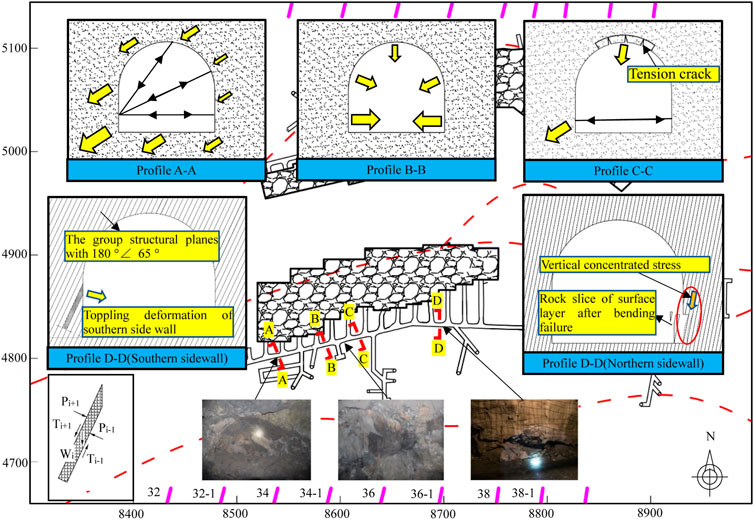
FIGURE 14. Deformation mechanism of each part of the haulage drift in hanging wall.
6.2 Roadways with partial-folding type curves
The section of haulage drift with a partial folding deformation curve was located between the types of section with no folding and those with whole folding, which is known as the transition zone. Breccia with variable rock mass structure was exposed through geological investigation on several rock outcrops, and the residual structure was found locally. The tension fracture of the rock mass filled and cemented again by the later calcite vein was well developed. The deformation mechanisms of this area were complex because of the diversity of the rock mass structure, and were analyzed using typical examples from monitoring stations S8 and S9.
The section perpendicular to the strike of the ore body was drawn through station S8 (profile B-B), as shown in Figure 14. Due to the cataclastic structure in this area, the strength and stiffness of the rock mass was significantly lower than in the area with the no-folding type. Thus, the roadway deformation was more sensitive to mining-induced stress. According to the analysis of the mining effect on deformation, the monitoring station had entered the deformation stage at a deformation rate of around 1 mm/month from the date of initial monitoring, when mining in the first sublevel below had just started. It is likely that the roadway deformation had begun to be affected by the mining stress field caused by mining at the same sublevel as the monitoring station. Then, when the mining activity at the first sublevel below moved to the position at a distance of 17 m away from S8, the roadway deformation began to accelerate and entered the stage of rapid deformation. Production water accumulating on the floor over a long time, especially in areas with poor drainage aggravated the progress of weakening and disintegration of the rock mass near the floor. Thus, the process of roadway deformation to failure was accelerated. The previous analysis of the deformation influenced by the rock mass surrounding S8 showed that the deformation mode of the roadway section had good symmetry. Although the joints were more developed than at S2, there was no asymmetric deformation caused by the action of dominant joints. The deformation mode conformed to the typical deformation mode of a roadway section with this type of shape. The deformation of the bottom corner was more serious than that of the arch foot, which has a higher position compared to the roof in the deformation ranking.
The roadway section perpendicular to the strike of the ore body through station S9 (profile C-C) is shown in Figure 14. The structure of the rock mass surrounding S9 was similar to that of S8, but the degree of fracture development was lower than that of S8 and the rock mass stiffness was higher than that of S8; thus, there was no roadway deformation at the early stages of monitoring. In January 2019, the deformation of measurement lines 1 and 4 suddenly began to accelerate, when the mining activity of the ore body was located at the first sublevel below and the horizontal distance from the monitoring station to the mining activity was 27 m. As the mining continued to move toward the monitoring station in February 2019, the deformation of lines 3 and 6 also began to accelerate. The rapid deformation lasted for 2 months, and the roof near S9 collapsed in April 2019, damaging the station. I-beam support was afterwards installed at the site. The deformation mechanism of station 9 can be well analyzed from the deformation influence at each measurement line. In January 2019, tension deformation began to occur on lines 1 and 4 connected between the bottom corners of the two sides, which was caused by the whole movement of the roadway toward the mined-out zone-the same cause as that at the S7 measuring point. However, unlike S7, the rock mass surrounding S9 was cut by joints and relatively broken. Because of the tension deformation of the bottom corners of the two sides, the shear and tensile strength of the joints in the roof were reduced, so that as the mining advanced, the deterioration in strength became worse. The subsidence and deformation of the roof accelerated the compression deformation of survey lines 3 and 6 in February 2019, and the roof collapse accident occurred in April 2019.
6.3 Roadways with whole-folding type curves
A group of structural planes with strikes parallel to the roadway were developed in the rock mass surrounding the monitoring stations with whole-folding type roadways. This group of dominant structural planes with an occurrence of 181°<66° was well developed, dividing the rock mass into a thin stratified shape. Affected by this group of structural planes, the two sidewalls of the roadway in this area developed different deformation modes. A buckling deformation occurred at the bottom corner of the northern sidewall, while a toppling deformation occurred on the other side (profile D-D, Figure 14).
6.3.1 Toppling deformation in the southern sidewall
In the southern sidewall with whole folding type of roadway, the rock mass was cut into a stratified shape parallel to the strike of the roadway by a group of structural planes with a stratum of 181°<66°. The inclination of the stratified rock mass pointed south, away from the roadway, which led to the toppling deformation of the stratified rock mass and it’s collapse into the roadway space. The simplified mechanical model of the southern sidewall is shown as profile D-D in Figure 14. Any particular rock layer is subject to the normal pressure and tangential shear force of two adjacent rock layers as well as its own gravity, W. The rock layer was under the influence of the deformation force and the moment balance before the mining disturbance, then the normal stress and shear-force of deep adjacent rock layer (Pj+1, Tj+1) changed first under the influence of mining. At the same time, in order to keep the rock layer in balance, the normal pressure and shear-force of the shallow adjacent rock layer (Pj-1, Tj-1) changed accordingly. When mining is continued to the point at which the mining disturbance increases enough to make the internal tension between the rock layers exceed its own tensile strength, bending and toppling failure will occur. Because of the influence of the roadway free space, the rock layer adjacent to it was the first to be bent and damaged. In terms of specific damage, the first rock layer was relaxed and cracked at the outcrop, and then the tensile crack extended along the steep joint to the bottom corner of the roadway side. Under the compression of the deep rock layer, the tensile stress in the thin rock body exceeded its bending stiffness, and bending and breaking occurred at the bottom corner. The second rock layer was destroyed after the first layer, and the damage of the rock layer decreased gradually with the increase in depth of the surrounding rock.
Along the strike direction of the ore body, the toppling deformation influence of whole-folding type roadways was not exactly the same. Based on the deformation curves at S3, S4, S10 and S11, we found that the bending and toppling deformation of the southern sidewall between exploration lines 36 and 38 was more serious. In addition, the mining in this area lagged behind the area between lines 34–1 and 36, and acceleration in the deformation of the surrounding rock of the roadway occurred later. The damage to the rock layer was obviously more serious than that between lines 34–1 and 36 , mainly because of the thinner rock layer cut by the group structure planes at 181°<66° between lines 36 and 38. Even before the influence of mining stress, the several rock layers of the southern sidewall adjacent to the roadway space experienced bending and fracture along the structure planes under the influence of redistribution stress of the roadway excavation over time.
6.3.2 Buckling deformation in the northern sidewall
Because it was affected by a group of dominant structural planes with 181°<66°, a layered rock mass structure with inclination toward the roadway space was formed in the northern sidewall by a whole-folding type roadway. Roadway excavation led to a release of stress on the two sidewalls, causing the surface rock layer of the northern sidewall to move toward the roadway space. Because of the thinness of the surface layer near the bottom corner, this part was more likely to separate from the deep rock mass along the structure plane and release a free end. As the deformation increased, the surface layer near the bottom corner was subjected to bending failure, resulting in rock slices on the floor and exposure of the bottom end of the deep rock layer fixed in the floor. The trend of sliding movement of the deep rock layer toward the floor was generated by the concentrated vertical stress induced by mining, leading to concentrated principal stress distributed along the layer (Li et al., 2018), and the part close to the bottom corner buckling and deforming to the roadway space (Figure 14, encircled by a red ellipse). After mining near the roadway, it is especially likely that the northern sidewall will be subjected to the concentrated vertical stress caused by mining, resulting in more serious buckling deformation of the bottom corner under downward compression. Based on analysis of data gathered from all the stations in this area, the top three measurement lines showing large deformations at nearly all monitoring stations were lines 1, 2 and 4 (not in order), because one end of these measurement lines was located at the bottom corner of the northern sidewall. Moreover, the bottom corner buckling from the roadway deformation produced in this area before and after deformation acceleration was significantly greater than that from roadways in other areas. The maximum deformation rate after deformation acceleration reache 98 mm/month (S4). The time of non-convergent deformation acceleration was earlier than that at other zones.
7 Conclusion
To guarantee the annual production in an SLC mine, the mining activities at several sublevels were always implemented at the same time. Therefore, besides the mining stress itself, the deformation of a haulage drift in a hanging wall will be affected by the overall movement of the hanging wall after mining at sublevels below the haulage drift. The data in this study was obtained by on-site monitoring at stations using laser convergence meters. The deformation data of roadways was recorded and analyzed, revealing the influence of deformation of a haulage drift on a hanging wall. Combined with the on-site mining results of the test engineering, the effects of mining on deformation of a haulage drift in a hanging wall under both a rectangular coordinate system and a polar coordinate system were analyzed. The major results were as follows:
(1) The cumulative deformation curve of the haulage drifts in a hanging wall comprised three types: no folding, partial folding and whole folding type. Among them, the no-folding type of deformation was in a fluctuating state or was increasing linearly with time at a very slow deformation rate. However, the curves of the partial-folding type and the whole-folding type showed apparent folding points that signified the onset of rapid increases without convergence in roadway deformation. If folding points occurred on some of the measurement lines of a monitoring station, it was concluded that part of the roadway section had entered the rapid deformation stage. Usually, the bottom corner of the roadway was the most likely part to suffer deformation. If folding points occurred on all measurement lines of a monitoring station, the accelerated deformation occurred in the whole roadway section. As it extended eastward along the strike of ore body I, the roadway deformation was more severe, accompanied by larger distribution density and stronger regularity of structural planes.
(2) Utilizing rectangular coordinate and polar coordinate systems, the spatial geometric relationship between mining activity and a monitoring station were investigated to determine the effect of mining on deformation of a haulage drift on a hanging wall. On the whole, the deformation magnitude of a monitoring station with partial-folding or whole-folding types was negatively correlated with distance from mining activity and positively correlated with inclination angle. When an apparent folding point which marked the onset of a rapid increase in the deformation curve occurred, the corresponding inclination angle was defined as the critical inclination angle. Along the strike of ore body I, the critical inclination angle from west to east decreased linearly with the coordinate. With regard to the influence of the deformation of the haulage drift on the hanging wall, the time of the apparent folding point which marked the onset of a rapid increase in the deformation curve shifted from west to east earlier. This could be attributed to the difference in geological structure, which meant that compared to the eastern part of a haulage drift, the western part had a larger distribution density and stronger regularity of structure planes.
(3) Based on the deformation regulation of monitoring stations and mining effect analysis, the deformation mechanisms corresponding to the three deformation curves were revealed. In a monitoring station with no folding type, the bottom corner of the northern wall side showed more obvious overall movement toward the mined-out zone than other part of the roadway section, which cause abnormal tension deformation phenomenon in the roadway section. In a monitoring station with whole-folding type, the deformation of the two sidewalls had larger values and occurred earlier, which could be attributed to the occurrence of buckling deformation in the northern sidewall, and toppling deformation in the southern sidewall under the combined effect of the mining-induced stress and the group of structure planes at 181°<66°. The haulage drift with whole-folding type belongs to a transition region between whole-folding type and no-folding type, and the deformation mechanism is more complex.
Data availability statement
The original contributions presented in the study are included in the article/supplementary material. Further inquiries can be directed to the corresponding author.
Author contributions
Conceptualization, KY and CC; data curation, KY and KX; methodology and writing-review, KY, YS and TW; formal analysis and writing-original draft, KY. All authors have read and agreed to the published version of the manuscript.
Funding
This work was financially supported by the National Natural Science Foundation for Young Scientists of China (Grant No. 42002292).
Acknowledgments
The authors gratefully acknowledge the Foundation’s continuous support and kindly help of our colleagues.
Conflict of interest
Author YS was employed by the company China Coal Technology and Engineering Group Xi’an Research Institute.
The remaining authors declare that the research was conducted in the absence of any commercial or financial relationships that could be construed as a potential conflict of interest.
Publisher’s note
All claims expressed in this article are solely those of the authors and do not necessarily represent those of their affiliated organizations, or those of the publisher, the editors and the reviewers. Any product that may be evaluated in this article, or claim that may be made by its manufacturer, is not guaranteed or endorsed by the publisher.
References
Abdellah, W., Mitri, H. S., and Thibodeau, D. (2011). Assessment of mine haulage drift safety using probabilistic methods of analysis. Procedia Eng. 26, 2099–2111. doi:10.1016/j.proeng.2011.11.2412
Abdellah, W., Raju, G. D., Mitri, H. S., and Thibodeau, D. (2014). Stability of underground mine development intersections during the life of a mine plan. Int. J. Rock Mech. Min. Sci. (1997). 72, 173–181. doi:10.1016/j.ijrmms.2014.09.002
Bai, J. B., Shen, W. L., Guo, G. L., Wang, X. y., and Yu, Y. (2015). Roof deformation, failure characteristics, and preventive techniques of gob-side entry driving heading adjacent to the advancing working face. Rock Mech. Rock Eng. 48 (6), 2447–2458. doi:10.1007/s00603-015-0713-2
Brady, B. H. G., and Brown, E. T. (2006). Rock mechanics for underground mining. London: George Allen Unwin.
Brunton, I. D., Fraser, S. J., Hodgkinson, J. H., and Stewart, P. C. (2010). Parameters influencing full scale sublevel caving material recovery at the Ridgeway gold mine. Int. J. Rock Mech. Min. Sci. (1997). 47 (4), 647–656. doi:10.1016/j.ijrmms.2009.12.011
Chen, Q. Y. (2006). Research on strata movement in sub-level caving for parallel ore bodies in Jinshandian iron ore mine. Beijing: University of science and technology Beijing. Ph. D. Thesis.
Dai, L. P., Pan, Y. S., Zhang, C. G., Wang, A. W., Canbulat, I., Shi, T. W., et al. (2022). New Criterion of Critical mining stress index for Risk evaluation of roadway Rockburst. Rock Mech. Rock Eng. 55, 4783–4799. doi:10.1007/s00603-022-02888-7
Fernandez, F., Watt, G., and Ooi, J. (2012). Strategic management for squeezing ground conditions at the argyle diamonds block cave project. Aust. J. Civ. Eng. 10. doi:10.7158/c12-002.2012.10.2
Gao, Y. B., Liu, D. Q., Zhang, X. Y., and He, M. C. (2017). Analysis and optimization of entry stability in underground longwall mining. Sustainability 9 (11), 2079. doi:10.3390/su9112079
Ge, X. R., Bai, S. W., and Chen, C. X. (1999). Research on surface deformation problems and control strategies of underground mining in east area of Jinshandian iron mine. Wuhan: Institute of Rock and Soil Mechanics, Chinese Academy of Sciences.
Johnson, J., Jacobs, C., Ferster, M., and Tadolini, S. (2017). Void fill and support techniques to stabilize drift excavated through a transition zone mined by a TBM at the Stillwater mine. Int. J. Min. Sci. Technol. 27 (1), 71–76. doi:10.1016/j.ijmst.2016.11.007
Jones, T., Nordlund, E., and Wettainen, T. (2019). Mining-induced deformation in the Malmberget mine. Rock Mech. Rock Eng. 52 (6), 1903–1916. doi:10.1007/s00603-018-1716-6
Lai, X., Xu, H., Fan, J., Wang, Z., Yan, Z., Shan, P., et al. (2020). Study on the mechanism and Control of rock Burst of Coal Pillar under Complex Conditions. Geofluids 2020, 1–19. doi:10.1155/2020/8847003
Li, A., Xu, N. W., Dai, F., Gu, G. K., Hu, Z. H., and Liu, Y. (2018). Stability analysis and failure mechanism of the steeply inclined bedded rock masses surrounding a large underground opening. Tunn. Undergr. Space Technol. 77, 45–58. doi:10.1016/j.tust.2018.03.023
Liu, Q. S., Shi, K., and Huang, X. (2011). Analysis on site monitoring of roadway under disturbed effects by excavation of neighboring roadways. J. China Coal Soc. 36 (6), 897–902.
Lu, R., Ma, F. S., Guo, J., and Zhao, H. J. (2019). Analysis and monitoring of roadway deformation mechanisms in nickel mine, China. Concurr. Comput. Pract. Exper. 31 (10), e4832. doi:10.1002/cpe.4832
Luan, H. J., Jiang, Y. J., Zhou, L. J., and Lin, H. L. (2018). Stability control and quick retaining technology of gob-side entry: A case study. Adv. Civ. Eng. 2018 (7), 1–13. doi:10.1155/2018/7357320
Meng, Q. B., Han, L. J., Qiao, W. G., Lin, D. G., and Fan, J. D. (2013). Evolution of surrounding rock in pioneering roadway with very weakly cemented strata through monitoring and analysising. J. China Coal Soc. 38 (4), 572–579.
Pang, H. S., Chen, C. X., Xia, K. Z., and Zhang, C. Q. (2020). Study on the methodology for determining the ground Acceptable deformation limit in sublevel Caving mining based on monitoring data. Chin. J. Rock Mech. Eng. 39 (4), 736–748. doi:10.13722/j.cnki.jrme.2019.0966
Raju, G. D., Mitri, H., Thibodeau, D., and Moreau-Verlaan, L. (2013). Numerical modelling and in situ monitoring of drift support performance with respect to mining sequence. Int. J. Min. Reclam. Environ. 29 (2), 83–95. doi:10.1080/17480930.2013.815400
Shen, W. L., Bai, J. B., Li, W. F., and Qang, X. Y. (2018). Prediction of relative displacement for entry roof with weak plane under the effect of mining abutment stress. Tunn. Undergr. Space Technol. 71, 309–317. doi:10.1016/j.tust.2017.08.023
Shnorhokian, S., MacNeil, B., and Mitri, H. S. “Quantitative analysis of haulage system instability in deep hard rock mines using numerical modelling,” in 3rd International Symposium on Mine Safety Science and Engineering, November 2016, 96–101.
Shnorhokian, S., Macneil, B., and Mitri, H. S. (2018). Volumetric analysis of rock mass instability around haulage drifts in underground mines. J. Rock Mech. Geotechnical Eng. 10 (01), 60–71. doi:10.1016/j.jrmge.2017.09.003
Svartsjaern, M. (2018). A prognosis methodology for underground infrastructure damage in sublevel cave mining. Rock Mech. Rock Eng. 52 (1), 247–263. doi:10.1007/s00603-018-1464-7
Tulu, I. B., Esterhuizen, G. S., Klemetti, T., Murphy, M. M., Sumner, J., and Sloan, M. (2016). A case study of multi-seam coal mine entry stability analysis with strength reduction method. Int. J. Min. Sci. Technol. 26 (2), 193–198. doi:10.1016/j.ijmst.2015.12.003
Wagner, H. (1974). Determination of the complete load-deformation characteristics of coal pillars. Proc. 3rd ISRM Congr. 2, 1076–1081.
Wang, T. L., Chen, C. X., Xia, K. Z., Zhang, C. Q., Qang, Y., and Liu, X. T. (2022). Ground surface deformation in the hanging wall of the jinshandian underground iron mine in China. Front. Earth Sci. (Lausanne). 10. doi:10.3389/feart.2022.909466
Wang, X., Kulatilake, P. H. S. W., and Song, W. D. (2012). Stability investigations around a mine tunnel through three-dimensional discontinuum and continuum stress analyses. Tunn. Undergr. Space Technol. 32, 98–112. doi:10.1016/j.tust.2012.06.003
Xia, K. Z., Chen, C. X., Fu, H., Pan, Y. C., and Deng, Y. Y. (2016). Mining-induced ground deformation in tectonic stress metal mines: A case study. Eng. Geol. 210, 212–230. doi:10.1016/j.enggeo.2016.06.018
Xia, K. Z., Chen, C. X., Lu, Z. D., Yang, K. Y., Sun, C. Y., Pang, H., et al. (2019b). Investigation of the ground movement due to underground mining at the jinshandian iron mine in China. Environ. Earth Sci. 78 (24), 715. doi:10.1007/s12665-019-8753-7
Xia, K. Z., Chen, C. X., Wang, T. L., Zheng, Y., and Wang, Y. (2022). Estimating the geological strength index and disturbance factor in the Hoek–Brown criterion using the acoustic wave velocity in the rock mass. Eng. Geol. 306, 106745. doi:10.1016/j.enggeo.2022.106745
Xia, K. Z., Chen, C. X., Zheng, Y., Zhang, H. N., Liu, X. M., Deng, Y. Y., et al. (2019a). Engineering geology and ground collapse mechanism in the Chengchao iron-ore mine in China. Eng. Geol. 249, 129–147. doi:10.1016/j.enggeo.2018.12.028
Xu, H. C., Lai, X. P., Shan, P. F., Yang, Y. B., Zhang, S., Yan, B. X., et al. (2022). Energy dissimilation characteristics and shock mechanism of coal-rock mass induced in steeply-inclined mining: Comparison based on physical simulation and numerical calculation. Acta Geotech. doi:10.1007/s11440-022-01617-2
Yao, Q. L., Li, X. H., Pan, F., Wang, T., and Wang, G. (2016). Deformation and failure mechanism of roadway sensitive to stress disturbance and its zonal support technology. Shock Vib. 2016, 1–14. doi:10.1155/2016/1812768
Yi, H. B., Liu, W. Z., Zhang, X. L., Yang, H. T., Yu, H. H., and Li, L. F. “Study on deformation mechanism of high stress and broken roadway and its controlling measures,” in Proceedings of the 3rd International Conference on Civil Engineering and Transportation, Kunming, China, January 2014, 1798–1803.
Keywords: mining-induced deformation, roadway deformation, sublevel caving, mining effect, deformation mechanism, laser convergence meter
Citation: Yang K, Chen C, Sun Y, Xia K and Wang T (2023) Mining-induced deformation for a haulage drift of the hanging wall at Jinshandian iron mine in China. Front. Earth Sci. 10:998759. doi: 10.3389/feart.2022.998759
Received: 20 July 2022; Accepted: 27 September 2022;
Published: 11 January 2023.
Edited by:
Fanyu Zhang, Lanzhou University, ChinaReviewed by:
Xingping Lai, Xi’an University of Science and Technology, ChinaYong Fan, China Three Gorges University, China
Copyright © 2023 Yang, Chen, Sun, Xia and Wang. This is an open-access article distributed under the terms of the Creative Commons Attribution License (CC BY). The use, distribution or reproduction in other forums is permitted, provided the original author(s) and the copyright owner(s) are credited and that the original publication in this journal is cited, in accordance with accepted academic practice. No use, distribution or reproduction is permitted which does not comply with these terms.
*Correspondence: Kuoyu Yang, a3l5YW5nQGhlbnUuZWR1LmNu