 Yifan Yang
 Tingfeng Dou
 Gaojie Xu1
 Cunde Xiao
- 1College of Resources and Environment, University of Chinese Academy of Sciences, Beijing, China
- 2State Key Laboratory of Earth Surface Processes and Resource Ecology, Beijing Normal University, Beijing, China
Changes in snow, ice, and ecological system over the Tibetan Plateau (TP) are extremely sensitive to local precipitation and radiation budget, which are largely modulated by the atmospheric ice. However, how much ice is there in the atmosphere over the TP and how it is distributed are still unclear. The total mass, spatial distributions, and long-term trends of atmospheric ice over the TP were evaluated by using four sets of satellite retrieval data (Aqua, Terra, the Suomi National Polar-orbiting Partnership (Suomi NPP), and NOAA-20) and ERA5 reanalysis data from 2003 to 2020. Based on the estimations using multiple satellite datasets, we concluded that the total mass of atmospheric ice could be up to 0.26
1 Introduction
As a sensitive area of climate change, the air temperature of the TP had increased much faster than that of the other areas at the same latitude (Liu and Chen, 2000), and the mass and energy balance of ice and snow in this area are greatly influenced by radiation and precipitation associated with the aerial cryosphere. The aerial cryosphere is composed of all ice bodies in the atmosphere, including those in clouds (ice clouds and ice crystals) and those under clouds (snowflake and hail) (Qin et al., 2018). It is an element with the largest coverage in the cryosphere, which has an important impact on the radiation budget and water cycle in the climate system (Dou et al., 2020). Previous studies have indicated that the atmospheric ice dominated the distribution and lifetime of ice clouds and mixed-phase clouds over the TP (Long, 2016; Li et al., 2018; Zhao et al., 2021), thus profoundly affecting the surface radiation budget. Therefore, it is of great significance to investigate the spatial–temporal variability of the atmospheric ice over the TP.
With the rapid progress of satellite remote sensing technology and the improvement of data assimilation, the remote sensing data and reanalysis data were increasingly used to explore the pattern of different phases of water in the atmosphere in the past few decades (Liljegren et al., 2001; Horváth and Davies, 2007; O’Dell et al., 2008; Lebsock and Su, 2014; Khanal et al., 2020; Qi et al., 2022). Some studies suggested that the cloud water path (CWP) increased in most regions of the TP from the 1980s to the beginning of this century (Li et al., 2008; Yue et al., 2016). The annual average of the ice water path (IWP) had been relatively stable from 2000 to 2015 without any obvious trend (Li et al., 2018). In contrast, on the seasonal scale, the IWP in the premonsoon season (March to May) and winter showed a significant upward trend in the western TP, while in monsoon season (June to September), a significant downward trend in the western TP was observed (Zhao et al., 2021).
Earlier studies estimated the total mass (Dou et al., 2020; Xu et al., 2022) and investigated the spatial–temporal distribution of atmospheric ice on a global scale using multiple sets of satellite remote sensing data and high-quality reanalysis data (Duncan and Eriksson, 2018; Dou et al., 2020; Xu et al., 2022). However, the total mass and spatial–temporal distribution of atmospheric ice over the TP are poorly understood, and there is also a lack of uncertainty analysis based on the multi-source data. Here, we used four sets of satellite retrieval products, namely, Aqua, Terra, the Suomi NPP, and NOAA-20 in CERES_SSF_1deg-Month L3 data and ERA5 reanalysis to carry out a quantitative study of atmospheric ice over the TP and reveal the main controlling factors of its spatial pattern. Note that acronyms and abbreviations used in this study are given in Table 1.
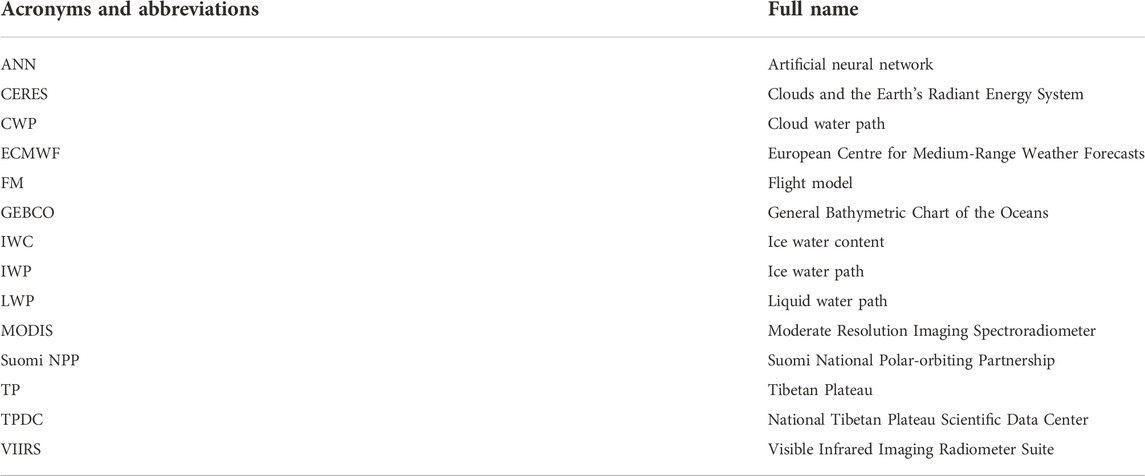
TABLE 1. Acronyms and abbreviations used in this study.
2 Data and methods
2.1 Data
2.1.1 Boundary data
The boundary data on the TP in this study were downloaded from the National Tibetan Plateau Scientific Data Center (TPDC). The TP is about 3,360 km from east to west and 1,560 km from south to north, ranging from 25°59′30″N to 40°1′0″N and 67°40′37″E to 104°40′57″E, with a total area of 3.08 million km2 (Zhang et al., 2002; Zhang et al., 2021a; Zhang et al., 2021b).
2.1.2 Topography data
The topography data we used were produced by The General Bathymetric Chart of the Oceans (GEBCO), which showed a global terrain model for the ocean and land, providing elevation data in meters, on a 15 arc-second interval grid (Group, 2019).
2.1.3 Remote sensing retrieval data
The remote sensing products were retrieved by the Terra, Aqua, Suomi NPP, and NOAA-20 satellites from the CERES_SSF_1deg-Month L3 data. Clouds and the Earth’s Radiant Energy System (CERES) was a NASA project that looked into the role of cloud and radiation feedback in the climate system (Wielicki et al., 1996). When coupled with the global climate model, these data contributed to a better understanding of how clouds and radiation interacted with atmospheric thermodynamics. There were currently five satellites carrying CERES instruments, and four satellites being employed in this study were sun-synchronous. The Terra satellite crosses the equator from south to north, and because it does so, at about 10:30 a.m., it is also known as the “Morning Satellite.” It has two CERES instruments, Flight Model 1 (FM1) and Flight Model 2 (FM2), as well as a Moderate Resolution Imaging Spectroradiometer (MODIS). A MODIS has 36 bands with a wavelength range of 0.412–14.45 μm and a spatial resolution of 250–1,000 m, allowing it to cover the entire globe in 2 days (Barnes et al., 2003). The Aqua satellite crosses the equator from north to south at about 1:30 p.m., and so it is known as the “Afternoon Satellite.” It has two CERES instruments, FM3 and FM4, and a MODIS. The “Afternoon Satellite” Suomi NPP is also equipped with the CERES instrument FM5 and the Visible Infrared Imaging Radiometer Suite (VIIRS). The VIIRS contains 22 imaging and radiation bands with a wavelength range from 0.41 to 12.5 μm and a spatial resolution of 370–750 m (Cao et al., 2014). NOAA-20, the successor of the Suomi NPP, which is also an “Afternoon Satellite,” is equipped with the FM6 CERES instrument and VIIRS (Cao et al., 2018). The four satellites mentioned previously were equipped with advanced spectral imagers so as to provide 24-h day-time and night-time IWP monthly average data CERES_SSF_1deg-Month L3 data, with a spatial resolution of 1°
2.1.4 Reanalysis data
The reanalysis data used here were ERA5, which was the fifth-generation reanalysis data product made by the European Centre for Medium-Range Weather Forecasts (ECMWF). A new data assimilation system, known as the ECMWF Integrated Forecasting System “Cy47r3” 4D-var, was applied for ERA5 by ECMWF. It was based on numerical calculation of the model and assimilation of a large amount of observation data. Due to these advantages, ERA5 contain detailed records of the global atmosphere, surface, and ocean waves since 1950. It had a significant improvement in the spatial resolution and numerical accuracy of variables when compared to the previous reanalysis data product ERA-Interim (Hersbach et al., 2020). We selected the monthly averaged ERA5 on single levels from 1979 to the present as the research data and employed the combination of two variables, total column cloud ice water and total column snow water, as the IWP to characterize the total ice content.
2.2 Methodology
IWP (g/m2) is a primary indicator for calculating the atmospheric ice concentration. It was defined as the vertical integral of the ice water content (IWC) (g/m3) in the atmospheric column (Holl et al., 2014).
The CERES_SSF_1deg-Month L3 data assumed that the atmosphere was plane parallel, and the whole cloud column was composed entirely of ice. Hence, the IWP value was the product of the effective size and optical thickness of ice crystals. The specific algorithm was as follows:
where
3 Results
3.1 Total mass
The three satellite retrieval products (Aqua, Terra, and the Suomi NPP-NOAA-20) during 2013 and 2020 were used to estimate the total mass of atmospheric ice over the TP by considering the area weight because the Suomi NPP and NOAA-20 products were only produced since 2013 (Table 2). The total mass of atmospheric ice calculated based on Aqua and Suomi NPP-NOAA-20 was very close (∼0.28 Gt) during this period, which is larger than that from Terra (0.23 Gt). The reason for this condition might be the difference in their orbits. The Aqua and Suomi-NPP were both A-train satellites. Combined with the estimation results of all satellite datasets, we concluded that the multi-year average total mass of atmospheric ice was 0.26 ± 0.03 Gt (∼2.6 ×10⁸ tons) over the TP, which accounted for approximately 5‰ of the global aerial cryosphere. The total mass of atmospheric ice had a significant seasonal variation, with a maximum of 0.32 ± 0.05 Gt in summer and a minimum of 0.22 ± 0.01 Gt in winter. In general, the result of ERA5 (total mass 0.24 Gt) was comparable with that of Terra and smaller than those of Aqua and Suomi NPP-NOAA-20. This is also applied on a global scale, and the mass of atmospheric ice given by the reanalysis data was also on the low side. The main reason was that the current atmospheric models did not perform well enough in describing the ice formation mechanism, ignoring the secondary ice formation mechanism and underestimating the number concentration of ice condensation nuclei (ECMWF, 2021).
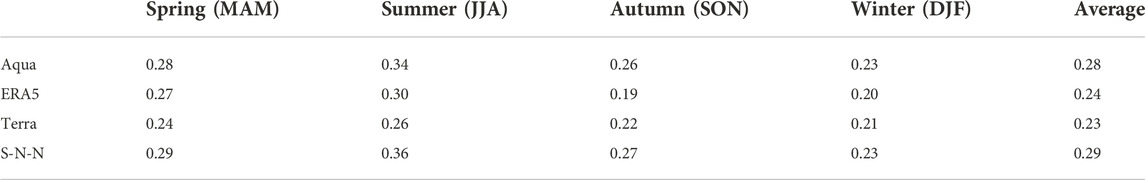
TABLE 2. The multi-year mean mass of aerial cryosphere over the TP derived from three satellite products and ERA reanalysis from 2013 to 2020 (Unit: Gt).
3.2 Spatial distribution and seasonal variability
The ice concentration ranged from 0.05 to 0.15 kg/m2 over the TP, with an average of 0.08 kg/m2. As shown in Figure 1, the spatial variability of atmospheric ice over the TP was obvious. Three sets of satellite retrieval products consistently revealed the spatial pattern of high ice concentration in the eastern TP and low ice concentration in the western TP (Figures 1A,C,D). ERA5 generally underestimated the spatial heterogeneity of atmospheric ice content, and there are only a few high-value areas in the southeast edge of the TP (Figure 1B). All the four datasets observed the high-value center of the ice concentration around Linzhi City in southeast Tibet, where the value was up to 0.15 kg/m2. Additionally, the IWP over the southern slope of the TP was relatively higher than those of other areas. Overall, the spatial distributions derived from various satellite datasets were consistent, particularly between Aqua (Figure 1A) and Suomi NPP-NOAA-20 (Figure 1D).
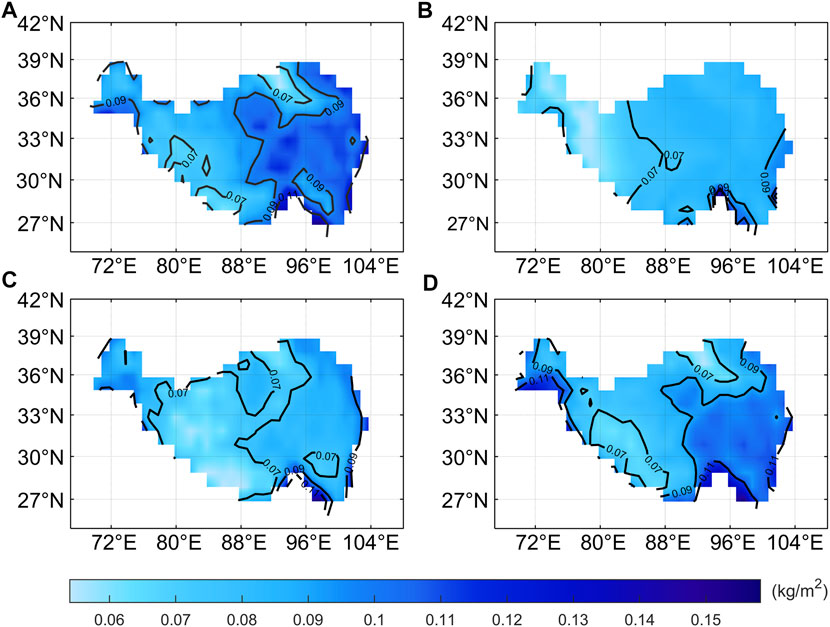
FIGURE 1. Spatial distributions of atmospheric ice over the TP retrieved by (A) Aqua, (B) ERA5, (C) Terra and (D) Suomi NPP NOAA-20 from 2013 to 2020.
In order to clarify the reasons for the spatial difference of atmospheric ice over the TP, the vertical profile of wind field, relative humidity at 95°E, 30°N, and the IWP of corresponding grids were analyzed from 2003 to 2020 combined with the topography (Figure 2). A large amount of water vapor was transported to the southeast of the TP (around 27°N) through the Bay of Bengal channel, with the relative humidity exceeding to 65% at 850 hPa in this area, which provided a sufficient water vapor condition for the formation of atmospheric ice. In addition, strong updraft carried abundant water vapor to high altitudes, producing lots of atmospheric ice through condensing. The previous two factors are the main reasons for the high-value center of atmospheric ice in southeast Tibet. The terrain blocking prevented water vapor from northward penetration, resulting in the low ice concentration in northern TP.
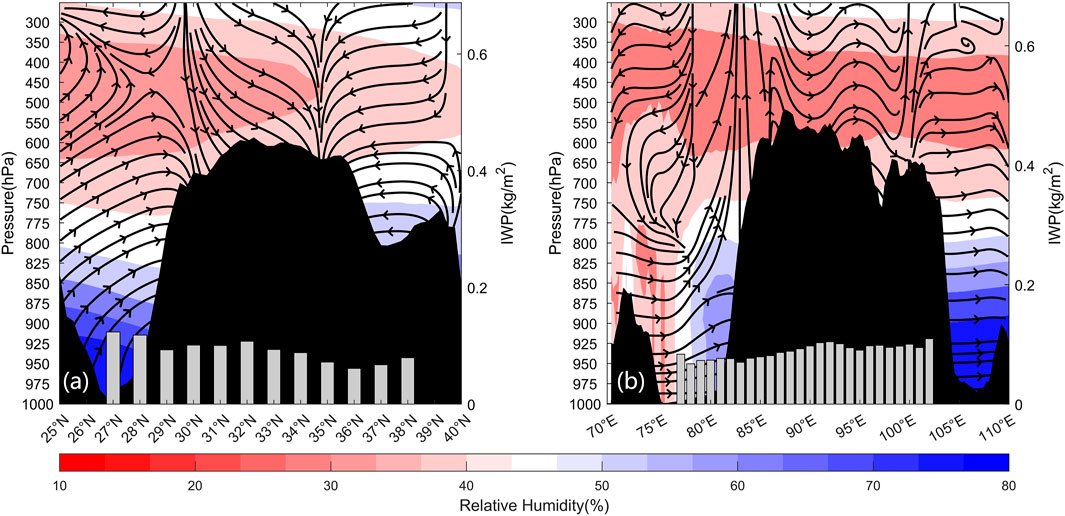
FIGURE 2. Vertical profile of wind field (stream lines), relative humidity (shaded areas), and topography (black waves) at the domain of 25°N–40°N and 70°E–110°E from 2003 to 2020. (A) Cross section of 95°E; (B) cross section of 30°N. The vertical velocity
Affected by southwest monsoon, the content of atmospheric ice in summer and autumn was generally higher than that in the other two seasons, especially for the eastern TP (Figure 3). This led to higher annual mean ice concentrations in the eastern TP. The seasonal distributions of the ice content derived from various satellite retrieval products were also consistent, only with slight differences in the central and western TP inland areas (Figure 3, Supplementary Figure S1, S2). For example, the IWP of the Aqua satellite in winter was slightly higher than those of Terra and Suomi NPP-NOAA-20 in this region during the same period (Figure 3D; Supplementary Figures S1D, S2D).
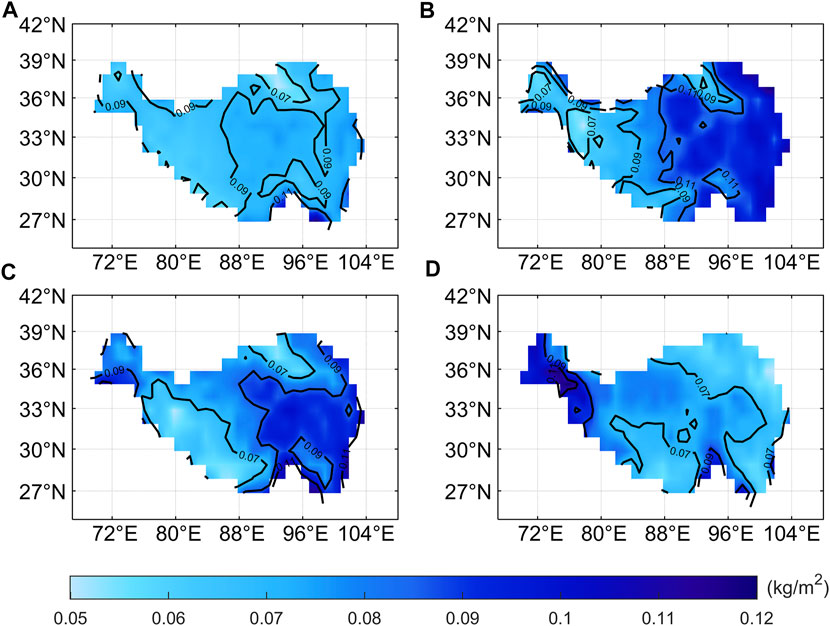
FIGURE 3. Spatial distributions of atmospheric ice over the TP in different seasons retrieved by the Aqua satellite from 2003 to 2020. (A) Spring (MAM), (B) summer (JJA), (C) autumn (SON), and (D) winter (DJF).
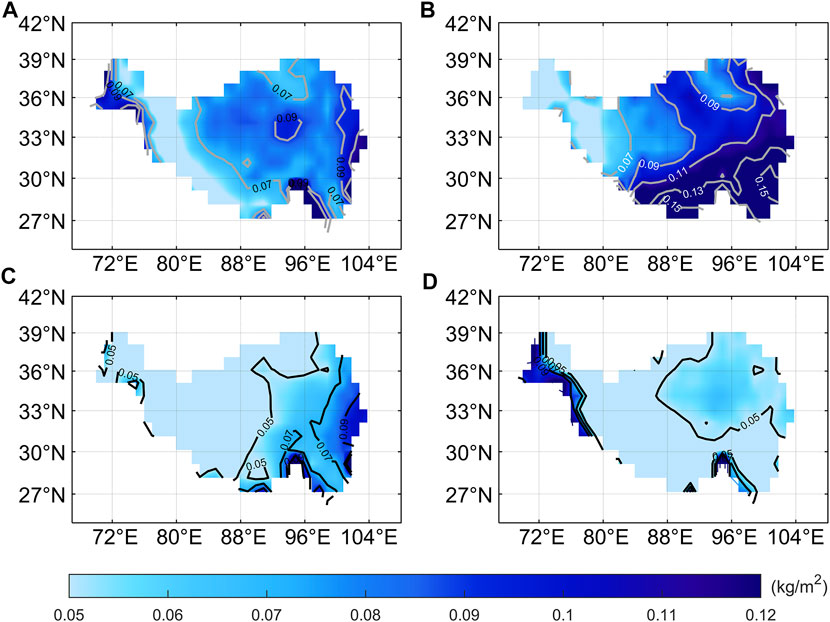
FIGURE 4. Spatial distributions of atmospheric ice over the TP in the different seasons given by ERA5 from 2003 to 2020. (A) Spring (MAM), (B) summer (JJA), (C) autumn (SON), and (D) winter (DJF).
ERA5 reanalysis could basically capture the seasonal variations of the atmospheric ice content derived from satellite retrieval products, although there were still some discrepancies in the amount of ice. In summer, the ice content tended to decrease from the east to west but that from the ERA5 reanalysis tended to decrease from southeast to northwest, and the IWP was overestimated by −0.02 kg/m2 in the southeast Tibet (Figure 2B, Figure 3B, Supplementary Figures S1B, S2B). However, in winter, ERA5 underestimated the IWP value in most areas of the TP, except for the northwest TP (Figure 2D, Figure 3D, Supplementary Figures S1D, S2D).
3.3 Annual variability and long-term trend
As shown in Figure 5, the variability of the atmospheric ice content over the TP within a year presented a distinct single peak structure, with an upward tendency in the first half of the year, peaked in summer, and then began to decline. Among them, the growth of atmospheric ice was more “twists and turns” than its reduction process (a tiny maximum would arise around March–May), and this pattern was noticeable across all satellite products. For the annual maximum value of the ice content, Aqua was close to Suomi NPP-NOAA-20 and ERA5, and higher than Terra. As for the minimum value, the three sets of satellite data were relatively close and significantly higher than ERA5 (Figure 5), indicating that the underestimation of the atmospheric ice content over the TP by ERA5 was mainly caused by the simulation deviation of ice growth in winter due to the underestimation of water vapor over the TP during this season.
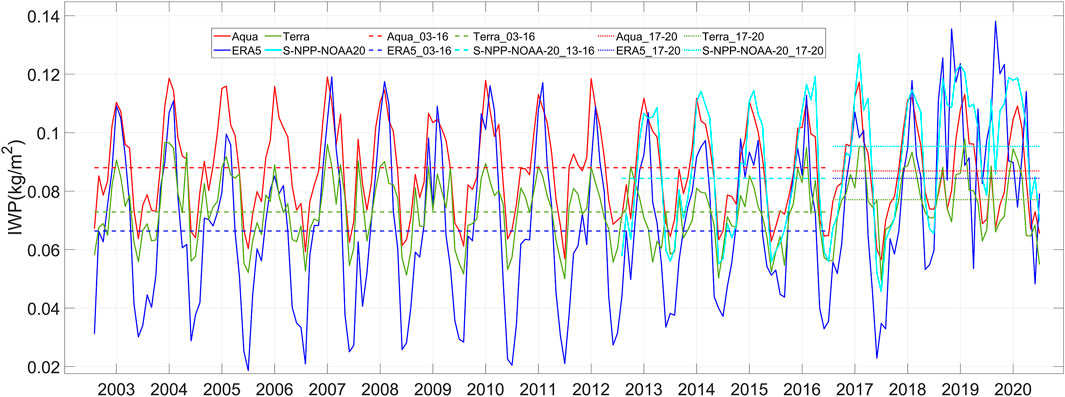
FIGURE 5. Time series of the atmospheric ice mass over the TP from 2003 to 2020. (dash line is the average value line).
The atmospheric ice content showed no obvious trend over the TP before 2017 whether for satellite products or reanalysis data, while the annual minimum ice content has increased in recent years (Figure 5). Similarly, the annual average ice content also increased from 2017, except for the result of Aqua (Figure 5). Dou et al. (2020)pointed out that the total mass of the global atmospheric ice showed an increasing trend with climate warming in the past decades. However, this study indicated that the mass of atmospheric ice in the TP had not completely followed this law but showed certain regional characteristics, although it seemed to have increased over the last few years.
From the time series of the atmospheric ice content in different seasons, there were great differences between various datasets, which were not only reflected in the IWP value but were also reflected in the change trend. In general, Aqua was close to Suomi NPP-NOAA-20 and higher than the other two datasets. Terra was close to ERA5 in spring and summer, while it is significantly higher than ERA5 in autumn and winter (Figure 6). The interannual variability of various datasets was relatively consistent in autumn and winter, but there were obvious discrepancies in the other seasons. Additionally, all sets of data showed a consistent increasing trend in winter in recent years, although there were some differences in the ice mass. In spring and autumn, Suomi NPP-NOAA-20 and ERA5 showed a consistent increasing trend, while the other two datasets showed a weak decreasing trend (Figure 6).
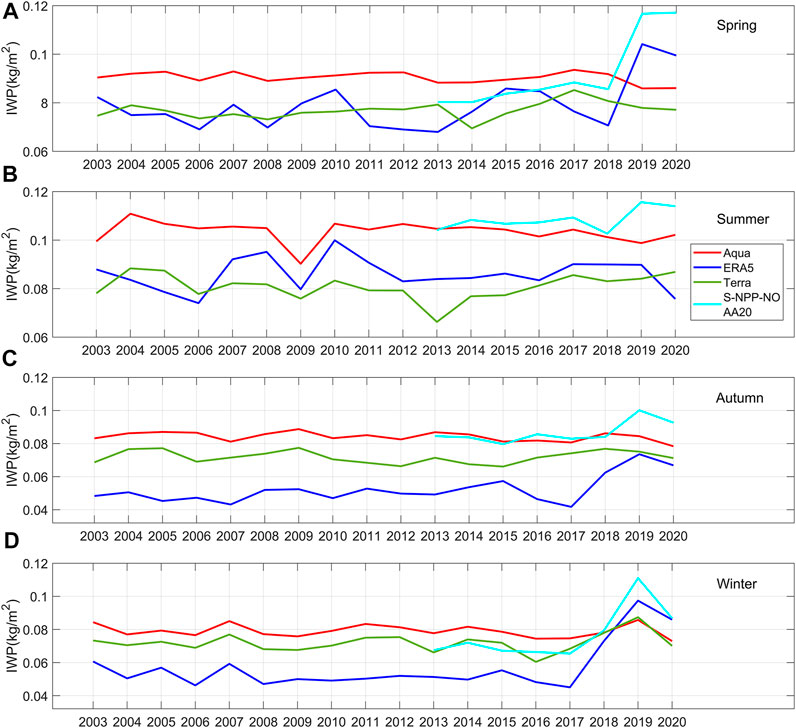
FIGURE 6. Interannual variations of the seasonal variations over the TP from 2003 to 2020. (A) Spring (MAM), (B) summer (JJA), (C) autumn (SON), and (D) winter (DJF).
In view of the increasing trend of the atmospheric ice content in winter in the past few years, we further analyzed the spatial manifestation and the possible causes of this trend. By comparing the spatial distribution of the atmospheric ice content in 2017 (low-value year) and 2019 (high-value year), it can be seen that the increase of atmospheric ice was reflected in most areas except the northeast TP (Figure 7). Specifically, the increase in the ice content based on Suomi NPP-NOAA-20 is the most significant, with an increase of 0.08 kg/m2 in the central and southwest regions of the TP. It can be seen from the moisture flux in winter that the water vapor convergence was clearly intensified over the TP since 2017 (Supplementary Figure. S3), which provided sufficient water vapor for the growth of ice crystals, resulting in the overall increase of the atmospheric ice content in winter during recent years.
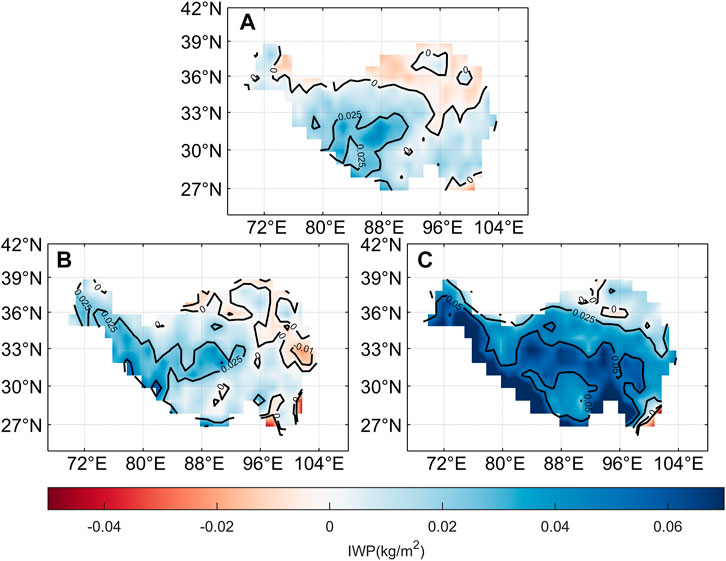
FIGURE 7. Spatial difference of atmospheric ice in winter between 2017 and 2019 retrieved by the three products. (A) Aqua, (B) Terra, and (C) Suomi NPP-NOAA-20.
4 Discussion and conclusion
This study applied four sets (Suomi NPP was merged with NOAA-20, and there are actually three datasets) of satellite retrieval products and ERA5 reanalysis to estimate the total mass, spatial-temporal distribution, and long-term trend of atmospheric ice over the TP, analyzed the causes of spatial differences, and discussed the uncertainties of the results. This study indicates for the first time that the total mass of atmospheric ice over the TP was to be 0.26 ± 0.03 Gt, with the maximum in summer (0.32 ± 0.05 Gt) and the lowest in winter (0.22 ± 0.01 Gt). This result was obtained from three sets of satellite data, and there were some differences among them. For two datasets using the MODIS instruments, according to the quality summary, the Aqua satellite did not have calibration anomalies, but Terra’s band 1 (central wavelength of 0.65 μm) had two calibration anomalies in 2003 and 2009 and one in band 5 (central wavelength of 1.2 μm) in 2002 (CERES, 2021). Coupled with the difference of their orbits, these factors will result in the difference of retrieval values of the IWP. In comparison with ground-based, ship-based, and airborne observations and other high-quality satellite data (e.g., CALIPSO data), Aqua-MODIS satellite data showed the highest performance, and Suomi NPP-VIIRS data were overall comparable to Aqua-MODIS and would gradually replace Aqua and Terra MODIS retrieval data completely in the future (Minnis et al., 2016; CERES, 2021). In conclusion, although there are some differences among various datasets, the total mass of atmospheric ice over the TP estimated based on them is close and thus, has high reliability.
Under the influence of monsoon, the water vapor on the TP is more abundant in summer and autumn, especially in southeast Tibet, resulting in a higher atmospheric ice content in these two seasons and a spatial pattern of low concentration in the west and high concentration in the east. The high-value center (0.15 ± 0.035 kg/m2) was located in Linzhi City and its surrounding area, which could be well captured by ERA5 reanalysis. In terms of spatial distribution, the results of different satellite data and ERA5 reanalysis are consistent, although the latter slightly underestimates the spatial heterogeneity. For the ice content, the value given by Aqua is comparable with that of Suomi NPP-NOAA-20 and is larger than those of the other two datasets in the eastern TP. ERA5 is close to Terra in the description of the atmospheric ice content.
From the time series of atmospheric ice over the TP, it can be seen that the annual variation is unimodal. Since 2017, the annual minimum increased, and the annual amplitude declined. This might affect the frequency and distribution of ice clouds over the TP, which needed further study. There was no evident long-term trend before 2017, while after that, apart from Aqua, the other datasets showed that the mass of atmospheric ice has increased over the TP in recent years. It is to be noted that, in winter, all four datasets show a consistent increasing trend since 2017, and this trend is reflected in most areas except the small area of the northeast TP. Since 2017, there is a significant increase in the moisture convergence over the TP, which promotes the growth of atmospheric ice, leading to an increasing trend of the ice content during this period. The largest uncertainty of this study comes from the discrepancies among different satellite products. Next, it is necessary to verify the reliability of the present satellite products by using the in situ measurement, ground radar observations, or other high-quality satellite data. It is also necessary to use the new generation of weather radar, terahertz sensors, and lidar to retrieve more advanced atmospheric ice products.
Data availability statement
The original contributions presented in the study are included in the article/Supplementary Material. Further inquiries can be directed to the corresponding author. The boundary data of the TP was downloaded from the National Tibetan Plateau Scientific Data Center (TPDC) (http://data.tpdc.ac.cn/zh-hans/), and the topographic data was downloaded from the website of GEBCO Project (https://download.gebco.net/). Remote sensing data was downloaded from the NASA Langley Research Center CERES ordering tool at (https://ceres.larc.nasa.gov/data/). ERA5 reanalysis data was downloaded from Copernicus Climate Change Service (C3S) Climate Date Store (https://cds.climate.copernicus.eu/cdsapp#!/search).
Author contributions
TD and CX jointly conceived the study; YY, GX, and TD performed the analyses; all of the authors discussed the results, contributed to interpretations, and wrote the manuscript.
Funding
This study was funded by the National Key Research and Development Program of China (2018YFC1406104) and the National Nature Science Foundation of China (NSFC 41401079).
Acknowledgments
The authors thank the National Tibetan Plateau Scientific Data Center, GEBCO Project, NASA CERES project, and European Centre for Medium-Range Weather Forecasts for providing access to the boundary and topography data on the TP, CERES_SSF_1deg-Month L3 data and ERA5 reanalysis used in this study. The authors also thank the reviewers for valuable comments that led to improvements in the analysis and clarifications in the text.
Conflict of interest
The authors declare that the research was conducted in the absence of any commercial or financial relationships that could be construed as a potential conflict of interest.
Publisher’s note
All claims expressed in this article are solely those of the authors and do not necessarily represent those of their affiliated organizations, or those of the publisher, the editors, and the reviewers. Any product that may be evaluated in this article, or claim that may be made by its manufacturer, is not guaranteed or endorsed by the publisher.
Supplementary material
The Supplementary Material for this article can be found online at: https://www.frontiersin.org/articles/10.3389/feart.2022.998603/full#supplementary-material
References
Barnes, W. L., Xiong, X., and Salomonson, V. V. (2003). Status of terra MODIS and aqua MODIS. Adv. Space Res. 32, 2099–2106. doi:10.1016/s0273-1177(03)90529-1
Cao, C., Blonski, S., Wang, W., Uprety, S., Shao, X., Choi, J., et al. (2018). “NOAA-20 VIIRS on-orbit performance, data quality, and operational Cal/Val support,” in Earth observing missions and sensors: Development, implementation, and characterization V (Honolulu, Hawaii, United States: International Society for Optics and Photonics). doi:10.1117/12.2324329
Cao, C., De Luccia, F. J., Xiong, X., Wolfe, R., and Weng, F. (2014). Early on-orbit performance of the visible infrared imaging radiometer suite onboard the Suomi national polar-orbiting partnership (S-NPP) satellite. IEEE Trans. Geosci. Remote Sens. 52, 1142–1156. doi:10.1109/tgrs.2013.2247768
CERES (2021). CERES_SSF1deg-Hour/Day/Month_Ed4A data quality summary. Available at: https://ceres.larc.nasa.gov/documents/DQ_summaries/CERES_SSF1deg_Ed4A_DQS.pdf.
Dou, T., Xiao, C., Huang, Y., Yue, H., and Han, W. (2020). Estimation of the atmospheric ice content mass, spatial distribution, and long-term changes based on the ERA5 reanalysis. Geophys. Res. Lett. 47. doi:10.1029/2020gl088186
Duncan, D. I., and Eriksson, P. (2018). An update on global atmospheric ice estimates from satellite observations and reanalyses. Atmos. Chem. Phys. 18, 11205–11219. doi:10.5194/acp-18-11205-2018
ECMWF (2021). “IFS documentation CY47R3 - Part IV physical processes,” in IFS documentation CY47R3 (Reading: ECMWF). doi:10.21957/cpmkqvhja
Group, G. C. (2019). The GEBCO_2019 grid: A continuous terrain model of the global oceans and land. NERC Liverpool: British Oceanographic Data Centre, National Oceanography Centre.
Hersbach, H., Bell, B., Berrisford, P., Hirahara, S., HORáNYI, A., MUñOZ-Sabater, J., et al. (2020). The ERA5 global reanalysis. Q. J. R. Meteorol. Soc. 146, 1999–2049. doi:10.1002/qj.3803
Holl, G., Eliasson, S., Mendrok, J., and Buehler, S. (2014). SPARE-ICE: Synergistic ice water path from passive operational sensors. J. Geophys. Res. Atmos. 119, 1504–1523. doi:10.1002/2013jd020759
Horváth, Á., and Davies, R. (2007). Comparison of microwave and optical cloud water path estimates from TMI, MODIS, and MISR. J. Geophys. Res. 112, D01202. doi:10.1029/2006jd007101
Khanal, S., Wang, Z., and French, J. R. (2020). Improving middle and high latitude cloud liquid water path measurements from MODIS. Atmos. Res. 243, 105033. doi:10.1016/j.atmosres.2020.105033
Lebsock, M., and Su, H. (2014). Application of active spaceborne remote sensing for understanding biases between passive cloud water path retrievals. J. Geophys. Res. Atmos. 119, 8962–8979. doi:10.1002/2014jd021568
Li, W., Li, X., Zhang, L., and Cheng, D. (2018). Climatic characteristic analysis of cloud water over the Tibetan Plateau. Clim. Environ. Res. 23, 574–586.
Li, X., Guo, X., and Zhu, J. (2008). Climatic distribution features and trends of cloud water resources over China. Chin. J. Atmos. Sci. 32, 1.
Liljegren, J. C., Clothiaux, E. E., Mace, G. G., Kato, S., and Dong, X. (2001). A new retrieval for cloud liquid water path using a ground-based microwave radiometer and measurements of cloud temperature. J. Geophys. Res. 106, 14485–14500. doi:10.1029/2000jd900817
Liu, X., and Chen, B. (2000). Climatic warming in the Tibetan Plateau during recent decades. Int. J. Climatol. 20, 1729–1742. doi:10.1002/1097-0088(20001130)20:14<1729::aid-joc556>3.0.co;2-y
Long, L. (2016). Analysis of variation characteristics of cloud and influence factors over the Tibetan plateau from 2007 to 2014. Yunnan: Yunnan University.
Minnis, P., Sun-Mack, S., Bedka, K., Yost, C., Trepte, Q., Smith, W., et al. (2016). Validation of Cloud Parameters Derived from Geostationary Satellites, AVHRR, MODIS, and VIIRS Using SatCORPS Algorithms. Lille: Workshop of the International Cloud Working Group (ICWG) 2016.
O’Dell, C. W., Wentz, F. J., and Bennartz, R. (2008). Cloud liquid water path from satellite-based passive microwave observations: A new climatology over the global oceans. J. Clim. 21, 1721–1739. doi:10.1175/2007jcli1958.1
Qi, P., Guo, X., Chang, Y., Tang, J., and Li, S. (2022). Cloud water path, precipitation amount, and precipitation efficiency derived from multiple datasets on the Qilian Mountains, Northeastern Tibetan Plateau. Atmos. Res. 274, 106204. doi:10.1016/j.atmosres.2022.106204
Qin, D., Ding, Y., Xiao, C., Kang, S., Ren, J., Yang, J., et al. (2018). Cryospheric science: Research framework and disciplinary system. Natl. Sci. Rev. 5, 255–268. doi:10.1093/nsr/nwx108
Tian, J., Dong, X., XI, B., Minnis, P., Smith, W. L., Sun-Mack, S., et al. (2018). Comparisons of ice water path in deep convective systems among ground-based, GOES, and CERES-MODIS retrievals. JGR. Atmos. 123, 1708–1723. doi:10.1002/2017jd027498
Wielicki, B. A., Barkstrom, B. R. H., Edwin, F., Lee, R. B., Louis, G. S., and Cooper, J. E. (1996). Clouds and the Earth's radiant energy system (CERES): An Earth observing system experiment. Bull. Am. Meteorol. Soc. 77, 853–868. doi:10.1175/1520-0477(1996)077<0853:catere>2.0.co;2
Xu, G., Dou, T., Yang, Y., Yue, H., Husi, L., Ma, L., et al. (2022). The total mass and spatio-temporal structure of the aerial cryosphere. Chin. Sci. Bull. 47, e2020GL088186. doi:10.1029/2020GL088186
Yue, B., Yi, W., Jiamin, L., and Chenghai, W. (2016). Temporal and spatial variation features of cloud water and its relation to precipitation over the Tibetan Plateau. J. Glaciol. Geocryol. 38, 1.
Zhang, Y., Li, B., Liu, L., and Zheng, D. (2021a). Redetermine the region and boundaries of Tibetan Plateau. Geogr. Res. 40, 1.
Zhang, Y., Li, B., and Zheng, D. (2002). A discussion on the boundary and area of the Tibetan Plateau in China. Geogr. Res. 21, 1.
Zhang, Y., Liu, L., Li, B., and Zheng, D. (2021b). Comparison of boundary datasets covering Tibetan plateau between 2021 and 2014 versions. J. Glob. Change Data Discov. 5, 1.
Keywords: aerial cryosphere, spatial–temporal variability, ice water path, multi-source data, Tibetan Plateau
Citation: Yang Y, Dou T, Xu G and Xiao C (2023) The total mass and spatial–temporal variability of aerial cryosphere over the Tibetan Plateau from 2003 to 2020. Front. Earth Sci. 10:998603. doi: 10.3389/feart.2022.998603
Received: 20 July 2022; Accepted: 29 August 2022;
Published: 05 January 2023.
Edited by:
Lei Wang, Institute of Tibetan Plateau Research, Chinese Academy of Sciences (CAS), ChinaReviewed by:
Changyong Cao, National Oceanic and Atmospheric Administration (NOAA), United StatesBaojin Qiao, Zhengzhou University, China
Zhihua He, University of Saskatchewan, Canada
Copyright © 2023 Yang, Dou, Xu and Xiao. This is an open-access article distributed under the terms of the Creative Commons Attribution License (CC BY). The use, distribution or reproduction in other forums is permitted, provided the original author(s) and the copyright owner(s) are credited and that the original publication in this journal is cited, in accordance with accepted academic practice. No use, distribution or reproduction is permitted which does not comply with these terms.
*Correspondence: Tingfeng Dou, ZG91dGZAdWNhcy5hYy5jbg==