 Tao Yang1
 Zhaofei Chu
94% of researchers rate our articles as excellent or good
Learn more about the work of our research integrity team to safeguard the quality of each article we publish.
Find out more
ORIGINAL RESEARCH article
Front. Earth Sci., 30 September 2022
Sec. Geohazards and Georisks
Volume 10 - 2022 | https://doi.org/10.3389/feart.2022.998521
This article is part of the Research TopicA Multi-Disciplinary Study of Dynamic Triggering: Field Observations, Numerical Simulations, and Laboratory ExperimentsView all 6 articles
The impact-induced fragmentation of rock blocks is frequently encountered when the natural hazards (e.g., rockfalls, rockslides, and rock avalanches) occur in mountainous areas. To address the progressive damage and cracking characteristics of rock upon impacting, this paper presents a three-dimensional finite-discrete method (3D-FDEM) study on the complex impact-induced fragmentation process of rock. The influences of the impact velocity on the dynamic fragmentation process, damage evolution, fragment characteristics, fragment flying velocity, and angle were systematically investigated. The parameters as input for simulation were first calibrated by the 3D uniaxial compression tests and rock-impact tests. Then, the complex fragmentation process of rock samples subjected to different impact velocities (i.e., 20–80 m/s) was simulated. The numerical results show that the number of cohesive elements following shear-dominated failures gradually increases with increasing the impact velocity. The fractal method can well describe the distribution of the equivalent fragment length, and the variations of the fractal dimension are consistent with that of the damage ratio, increasing with impact velocity. Both the average and maximum flying velocities of the fragments increase linearly with increasing impact velocity. However, the average flying angle of the fragments shows a sharp increase and then slight increase with increasing the impact velocity.
The impact-induced fragmentation of rock is a common phenomenon in natural hazards, especially in northwest China where rockslides, rockfalls, and rock avalanches frequently occur (Giani et al., 2004; Yao et al., 2015; Bao et al., 2020; Zhou et al., 2020). The motion trajectory of rock blocks can also be greatly affected by the impact-induced fragmentation process (De Blasio and Crosta, 2015; Zhao, 2018). Due to high kinetic energy and undefined motion trajectory of fragmented rock blocks by high-speed impact, which in turn can pose great threats to human life and property, infrastructure, and lifeline facilities (Whitehouse and Griffiths, 1983; Stoopes and Sheridan, 1992; Bunce et al., 1997; Chau et al., 2003a). Nevertheless, high-speed impact-induced fragmentation of rock is a complicated breakage procedure, including fracture mechanics, impact dynamics, and rock mechanics (Chau et al., 2003b; Wang and Tonon, 2011). Consequently, to mitigate the risk of damage induced by high-speed impact-induced flying fragments, it is crucial to study the dynamic fracturing process and fragmentation characteristics.
The dynamic fragmentation mechanism of rock under impact has received numerous attention up to this point (Ruiz-Carulla et al., 2016; Shen et al., 2017; Weng et al., 2019). Laboratory experiments, field tests, numerical simulations, and theoretical studies are the primary research methodologies. Laboratory experiments, as the most direct and reliable method among those research methods, have been widely utilized to reveal the fracturing and fragmentation mechanism. Through laboratory tests on brittle materials (Chau et al., 2000; Wu et al., 2004; Khanal et al., 2008), it was found that the number of fragment grows with increasing the impact energy, whereas the size of fragments progressively reduces. By performing in situ free fall tests, Giacomini et al. (Giacomini et al., 2009) indicated that the impact angle makes a significant contribution to the fragmentation of the foliated rock, and the effect on the impact energy tends to be secondary. Hou et al. (Hou et al., 2015) performed a laboratory study on the breakage features of brittle rocks. It was observed that as the impact energy grows and the size of the hammer reduces, the cumulative frequency distribution curve gradually moves to the left and the frequency distribution curve becomes narrower. To better understand the dynamic fragmentation behaviors of rock under impact, some scholars have further studied the characteristics of impact-induced rock fragment distribution. Li et al. (Li et al., 2018) investigated the dynamic fracture process of granite at the strain rates of 40–150/s and developed a new energy-based fragmentation model to characterize the compaction of the cylindrical rock samples. Additionally, Hogan et al. (Hogan et al., 2012) proposed a three-parameters generalized extreme value distribution to characterize fragment size. By fitting to 448 sets of screened fragment size datum from blast fragmented rock (Sanchidrián et al., 2012), the results indicated that the bi-components distributions exhibit a better fit and Swebrec was by far the best single-component function in all regions, and its errors were comparable to the best bi-components function for the coarse and medium regions.
In recent years, with the rapid growth of computing technology, numerical simulation has been an efficient alternative for investigating the impact-induced fragmentation of rock. The numerical methods can be generally divided into three types, i.e., discontinuous methods, continuous methods, and hybrid methods. In these methodologies, the discrete element method (DEM) is most widely adopted to study rock mechanics problems (Thornton et al., 1999; Mishra and Thornton, 2001; Moreno et al., 2003; Wang, 2009; Du et al., 2020). According to the DEM simulation results, the fragmentation merely occurs locally at the impact zone, and no radial cracks generate (Wang and Tonon, 2011; Zheng et al., 2015). Existing DEM simulation results (Thornton et al., 1999; Moreno et al., 2003; Samimi et al., 2004) have revealed that the normal component of impact velocity is the main component that determines the fragmentation intensity and fragmentation distribution of agglomerates. Based on the 3D DEM simulation results of impact-induced fragmentation of rock spheres, Shen et al. (Shen et al., 2017) found that the damage ratio and fragmentation intensity progressively increased with the increase of the impact loading rate, and the fragment number increased as a power law function with increasing the impact loading rate. In addition, the fracture behavior of the rock can also be influenced by the structural characteristics of the rock (Lin et al., 2019; Zhao et al., 2019; Zhao et al., 2020). Through numerical studies of the dynamic impact fragmentation characteristics of jointed rock blocks, Zhao et al. (Zhao et al., 2018) concluded that the distribution and orientation of the rock block joints are the main factors influencing the size and shape of the large fragment, and the cumulative size distribution of rock fragments agrees well with the Weibull’s distribution function. Nevertheless, although DEM is popular among many scholars in rock mechanics study due to its ability to good fracturing simulation, it is time consuming and needs extensive error-prone calibrations of material parameters from microscopic to macroscopic properties. Among the continuum methods, the numerical erosion technique is extensively applied to model the dynamic damage process of materials (Wang et al., 2013; Zhao and Chen, 2013; Kong et al., 2016). However, it should be noted that the erosion technique lacks a solid physical meaning, and substantial element deletion violates the principle of mass conservation (Hao et al., 2016). Hence, for simulating the dynamic fracture process more realistically, more advanced finite element-based methods have been developed in the framework of the partition of unity (PU) to remove the disadvantages of FEM, which can be extended to dynamic crack propagation problems by employing the suitable level set algorithms and enrichment functions (Wu and Wong, 2012). However, for extreme breaking failure under high-speed load, the selection of the enrichment function and the description of the level set remain certain challenging (Ma et al., 2009; Rabczuk et al., 2009). In addition, the meshless method, which can avoid distortion or coincidence of elements with the crack geometries, has also been used to study dynamic crack propagation (Wu et al., 2014; Aghahosseini et al., 2019). Rabczuk et al. (Rabczuk and Eibl, 2003) used the smooth particle hydrodynamics method (SPH) to model concrete fragmentation under explosive loading. However, this method inevitably encounters difficulties of tensile inability, zero energy modes, and essential boundary conditions (Kala and Husek, 2016). It should be noted that the continuum-based method is difficult to characterize the sticking, slipping, and separation among elements under the continuum-based assumption. For recent years, the combined finite discrete element method (FDEM) has become prevalent and is extensively utilized to model the dynamic fracture and fragmentation process in rock mass (Mahabadi et al., 2010; Zhou et al., 2016). In the FDEM simulations (An et al., 2017; Wu et al., 2019a), treating the material as multiple interactive discrete elements with general shapes and sizes, the main characteristic of the dynamic failure process simulation is the ease of transition from continuum to discontinuum through deformation, fracture, and fragmentation. Next, the cohesive crack model can be precisely represented utilizing the contact algorithm.
In the present work, a coupled 3D-FDEM method was incorporated into the commercial finite element software Abaqus to simulate the complex fragmentation process under different impact velocities. The numerical model and input parameters are first calibrated by 3D uniaxial compression tests and rock-impact tests. The mesh size analysis is conducted to eliminate the mesh size influence on the fragmentation results. Then, the complex fragmentation process of rock samples subjected to different impact velocities (i.e., 20–80 m/s) is simulated. The progressive fracture process, failure pattern, damage evolution, fragmentation, size distribution, and distribution of the fragment flying velocity and angle are investigated. The results of this study can contribute to a deeper insight into the impact-induced fragmentation characteristics of the rock.
In the FDEM numerical model, the rock is composed of numerous irregular tetrahedral elements and six-node zero-thickness cohesive elements embedded on the solid element boundaries. By deleting the failed cohesive elements, the fracture process of rock material is achieved by separating the solid elements. The mechanical behaviors of the cohesive element are featured by the shear behaviors in the tangential direction and the tensile/compression behaviors in the normal direction. In this regard, a mixed-mode bilinear traction-separation constitutive model is used. The basic numerical algorithms and constitutive models of the cohesive element have been elaborated in previous studies (Wu et al., 2019a; Liu et al., 2022). In this study, the mixed-mode bilinear traction-separation constitutive model was used to the response to the cohesive element, and the damage initiation criterion of the cohesive element is defined by the quadratic nominal stress law. Additionally, general contact (ABAQUS EXPLICIT) was utilized to determine the contact behaviors of elements. The labels of the solid elements and the labels of their adjacent cohesive elements are recorded as the input information for the subsequent fragment search program. The irregular tetrahedral solid elements are generally adjoined to four cohesive elements (two or three adjacent cohesive elements for the solid elements located at the numerical model boundary).
To characterize the rock fragmentation, the fragment information of the rock pieces after impacting should be accurately obtained. In a previous study, a fragment search algorithm for a 2D numerical model was developed. However, in the present study, the number of elements used in the 3D numerical model significantly increases, leading to a huge increase in the search time. Therefore, an improved fragment search algorithm is developed to identify the 3D fragments (see Figure 1). Before failure (Figure 1A), all the irregular tetrahedral solid elements (denoted by Si) and the six-node zero-thickness cohesive elements (denoted by Cj) are connected. At first, all the solid elements will be selected to generate a solid element pool (see Figure 1B). Once the cohesive element fails, it will be deleted from the model, and the labels of the cohesive element will also be deleted from the input information. Consequently, the remaining input information only contains the solid element labels and the unfailed cohesive element labels. In this example, C2, C6, and C8 have been removed from the model (see Figure 1C). Then, the search procedure begins with a random element in the solid element pool, such as S4. Subsequently, the cohesive elements adjacent to S4 will be obtained. It can be seen that only three cohesive elements (C3, C4, C5) are still adjoined to S4, and the solid elements S3, S5, and S7 are adjoined to C3, C4, and C5, respectively. Hence, solid elements S1, S3, S5, and S7 will be placed into the temporal fragment pool. The search for cohesive elements adjoined to S3, S5, and S7 will keep on. Since only C7 is still adjoined to S7, solid element S6 adjoined to C7 will be placed in this temporal fragment pool. Since no additional cohesive elements can be detected around S6, this round of fragment search is completed, and fragment two is formed (which includes S1, S3, S5, S7, and S6, see Figure 1D). Finally, the temporal fragment pool will be cleared and corresponding solid elements will also be deleted from the initial solid element pool. The above steps are repeatedly executed until all the solid elements have been searched so that the fragment search procedure is finished and all the corresponding fragments will be generated. Compared to the previous fragment search algorithm (Wu et al., 2019b), the present fragment search algorithm can simultaneously place several solid elements into the temporal fragment pool in one search procedure, which improves the search efficiency. The search times of the two fragment search algorithms for different element quantities are presented in Table 1. It can be found that the present fragment search algorithm can significantly reduce the search time (less than half of the previous) and improve the search efficiency.
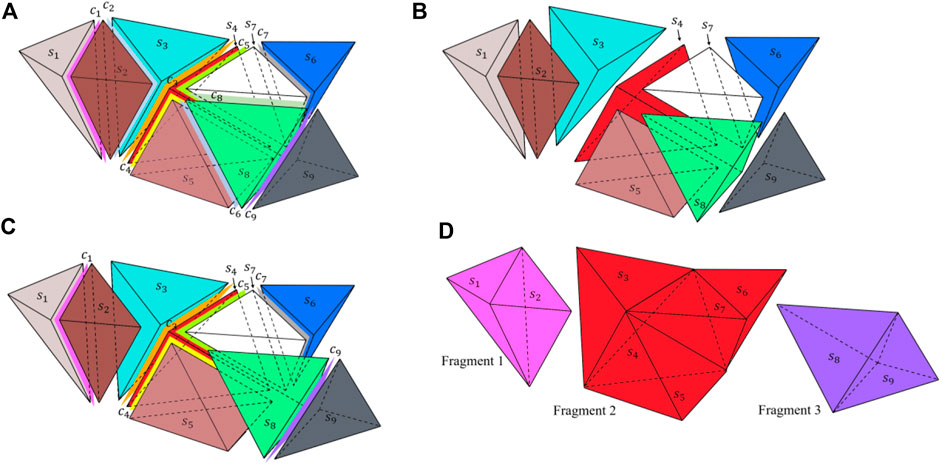
FIGURE 1. Schematic diagram of the fragment search algorithm: (A) the original connection state of elements; (B) generation of solid element pool; (C) search of the solid element by the unremoved cohesive elements; (D) recognition and generation of the fragment.
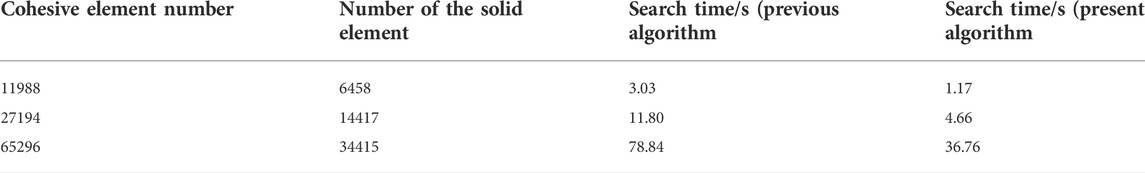
TABLE 1. Search times of the two fragment search algorithms for different element numbers.
Since the micro-mechanical parameters of the numerical model cannot be directly obtained from the laboratory tests, a series of numerical uniaxial compression tests were conducted to acquire similar macro-mechanical properties (i.e., uniaxial compressive strength, Young’s modulus, and Poisson’s ratio). By comparing the numerical results with the experimental results, the appropriate micro-mechanical parameters can finally be determined. For the laboratory uniaxial compression tests, the cylindrical granite sample was mined from Changsha City in Hunan Province, China. The cylindrical granite sample with the size of 50 mm in diameter and 100 mm in height was produced according to International Social for Rock Mechanics (ISRM) suggested methods (Ulusay, 2014). To reduce the discretization of test results caused by the inhomogeneity of the samples, all samples were drilled from the same rock block and samples with similar wave velocity were selected for the tests in this study. The basic mechanical properties of the specimens were first measured before laboratory testing. The density (ρ) is about 2.63 g/cm3 and the P-wave velocity is 4957 m/s. The uniaxial compression tests were performed using the RMT-301 hydraulic servo testing machine. A cylindrical granite sample with the size of 50 mm
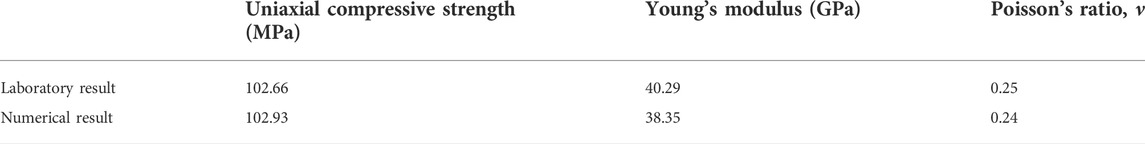
TABLE 2. Comparisons of the basic mechanical properties of the granite samples.
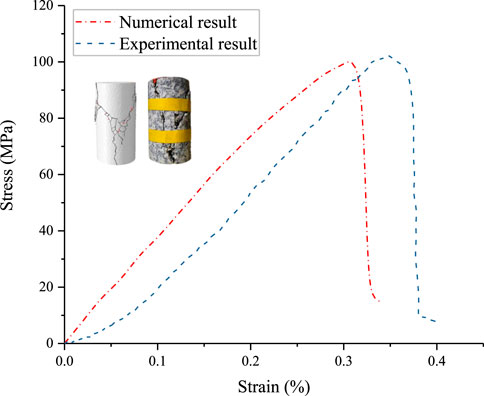
FIGURE 2. Comparison of numerical result with experimental result for the axial stress-strain curves of the granite sample.
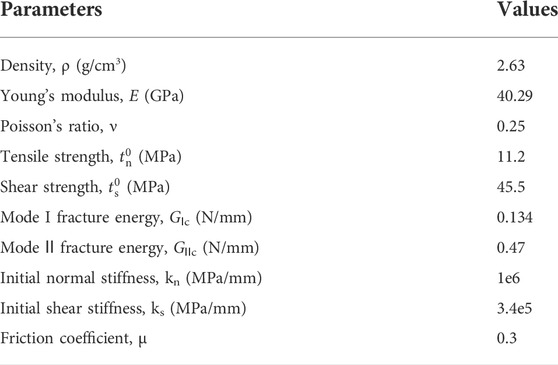
TABLE 3. Input parameters of the calibrated FDEM model.
It is known that the mechanical behaviors of the rock material upon static or quasi-static loading are largely different from those at high strain rates (Gong and Zhao, 2013; Su et al., 2019; Weng et al., 2020). Therefore, to further validate the effectiveness of this method in simulating micro-/macro-mechanical properties of rock material at high strain rates, numerical simulations of rock impact are carried out, and the results are compared with the laboratory data. For comparison, the same impact velocities of 20.0, 25.0 and 30.0 m/s applied in the laboratory tests were adopted in the numerical tests of rock impact. Figure 3 presents the experimental apparatus and the comparisons of fragmentation results of the granite sample under different impact velocities. When the impact velocity is 20.0 m/s and 25.0 m/s, the fragmentation occurs in the location near the impact face, and only several fragments generate. When the impact velocity increases to 30.0 m/s, in addition to several fragments generated in the location near the impact face, the remaining part is directly split into two large fragments parallel to the impact direction. It can be observed that the numerical test results can agree well with the results obtained from laboratory tests (as shown in Figure 3B). These results show that the model can accurately mimic the macro-mechanical behaviors and fragmentation characteristics of rock material using the above calibrated micro-mechanical parameters. In this regard, more rock impact simulations at higher impact velocities were conducted for further analyses.
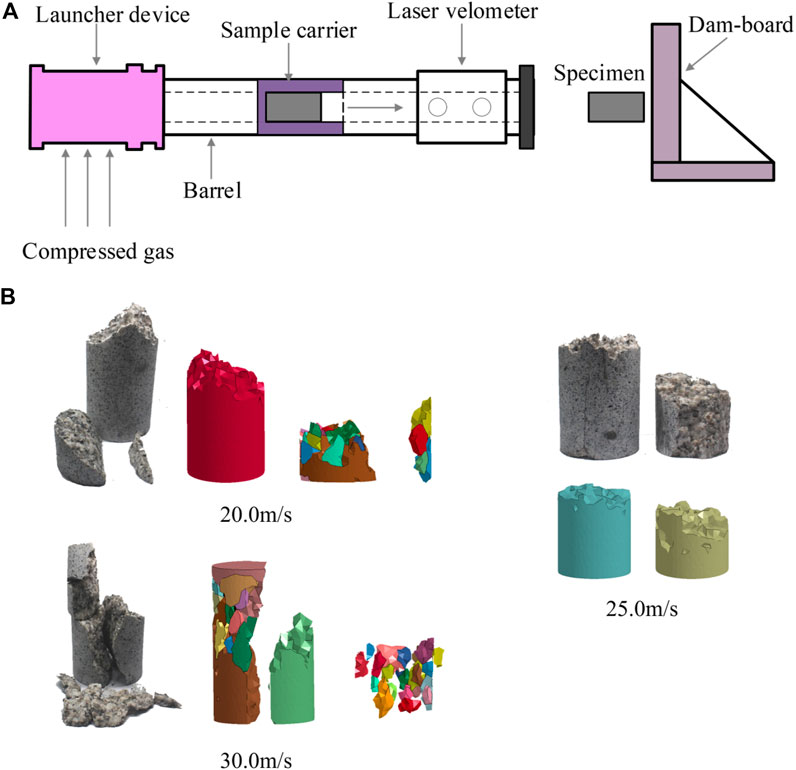
FIGURE 3. (A) Laboratory rock impact apparatus; (B) Comparisons of rock (granite) fragmentation results under different impact velocities (the upper face is the impact face).
Generally, the mesh size can significantly influence the fracture behavior of the numerical model. Previous numerical and analytical results (Munjiza and John, 2002; Turon et al., 2007) have suggested that the element size should be much smaller than the length of the fracture process zone (FPZ) to acquire reliable results for the fracture simulations using the FDEM method. Otherwise, the stress gradient in front of the fracture tip cannot be precisely captured since the quantity of the elements is not sufficiently high to generate accurate calculations in the PFZ. As determined in the previous literature (Guo et al., 2016a), the FPZ length (lFPZ) can be obtained from Westergaard’s and Muskhelishvili’s solutions, namely:
where Gc is the fracture energy, E is Young’s modulus,
Substituting the material parameters in Table 2 to Eq. 1–2, the theoretical estimations of the lower and upper values of the FPZ length can be given as llower ≈ 12.7 mm and lupper ≈ 32.3 mm, respectively. Then, the minimal number of cohesive elements used in the discretization of FPZ (Ncohe)can be calculated (Gang et al., 2018):
where lele is the mean element size in mesh generation.
Based on the above analysis, to study the influence of the element size on the rock dynamic fragmentation characteristics, nine models with the same loading condition (with a velocity of 20.0 m/s) and geometry but different mesh sizes are established and then calculated. Figure 4A presents the nine models meshed with different element sizes. Figure 4B exhibits the changes in the maximum impact force and normalized kinetic energy with the number of cohesive elements used in the discretization of PFZ. Table 4 lists the results of the mesh size analysis. It can be seen from Figure 4B that both the maximum impact force and normalized kinetic energy remain constant when the mesh size lele is smaller than 4.5 mm. Also, Guo et al. (Guo et al., 2016b) suggested that at least one-third of the theoretical FPZ length should be selected as the average mesh size (approximately 4.24 mm in this model). Therefore, the mesh size of 4 mm was selected for the subsequent simulations considering the simulation accuracy and computational cost.
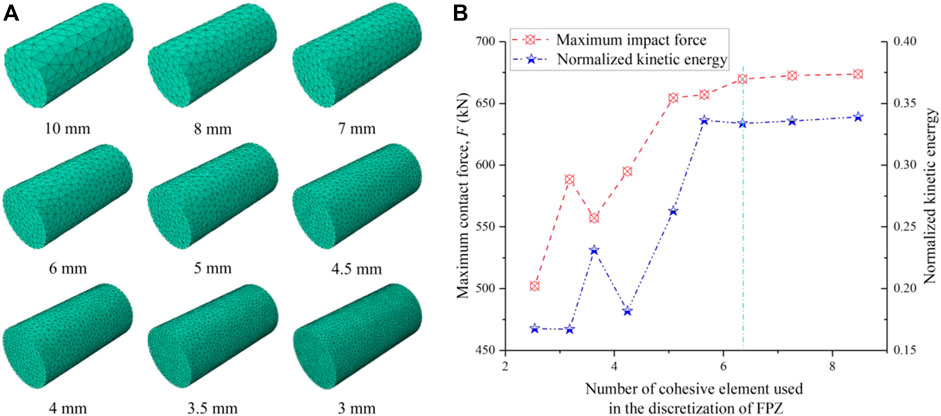
FIGURE 4. (A) Nine models meshed with different element sizes; (B) Variations in the maximum impact force and normalized kinetic energy against the number of cohesive elements (the mesh size of the right of the green vertical dashed line can achieve the simulation accuracy and computational cost).
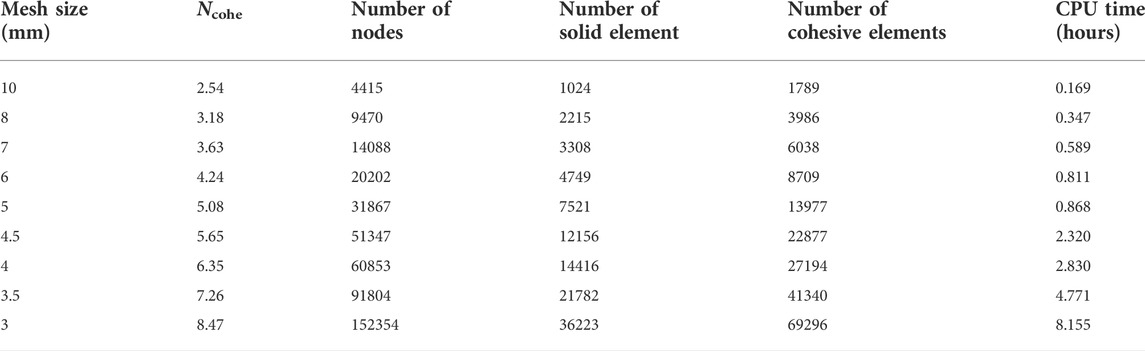
TABLE 4. Mesh size analysis of a cylinder model impact onto the rigid wall.
Based on the proposed method, as illustrated in Section 2, the progressive fracture process of the rock sample can be intuitively captured. Figure 5 illustrates the progressive fracture process under the impact velocities of 20 m/s, 25 m/s, and 30 m/s. It can be seen that the failure pattern changes significantly as the impact velocity increases. When the impact velocity is 20 m/s, the breakage of the sample mainly occurs near the impact face. As the impact velocity increases to 25 m/s, the failure location of the sample moves away from the impact face, and the fracture surface is almost perpendicular to the impact direction. However, when the impact velocity increases to 30 m/s, the breakage areas of the sample near the impact face are significantly expanded with the generation of a large number of fragments, while the part on the other side is split into two large fragments. The fragmentation comparison between the simulated and experimental results is shown in Section 3.1. The damage ratio is generally applied to evaluate the rock fragmentation intensity (Shen et al., 2017; Ye et al., 2019). The damage ratio is defined as the ratio of the quantity of deleted cohesive elements to the total quantity of the cohesive elements. Figure 6A presents the evolutions of the damage ratio (
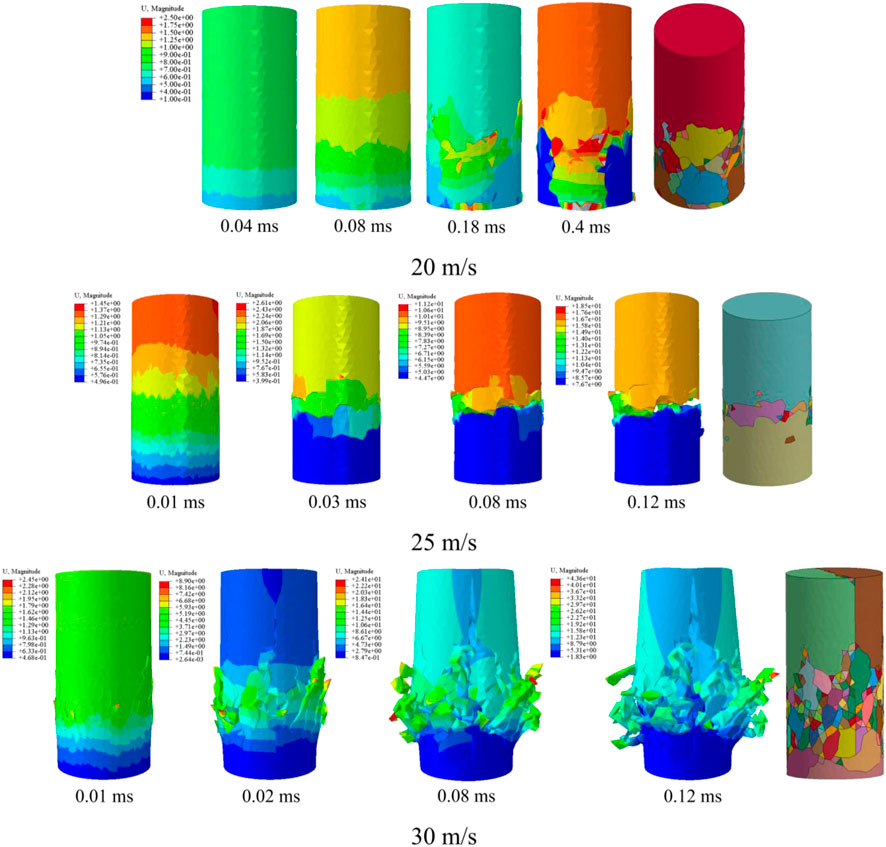
FIGURE 5. The progressive fracture process under different impact velocities (the last picture is the final failure pattern, and the lower face is the impact face).
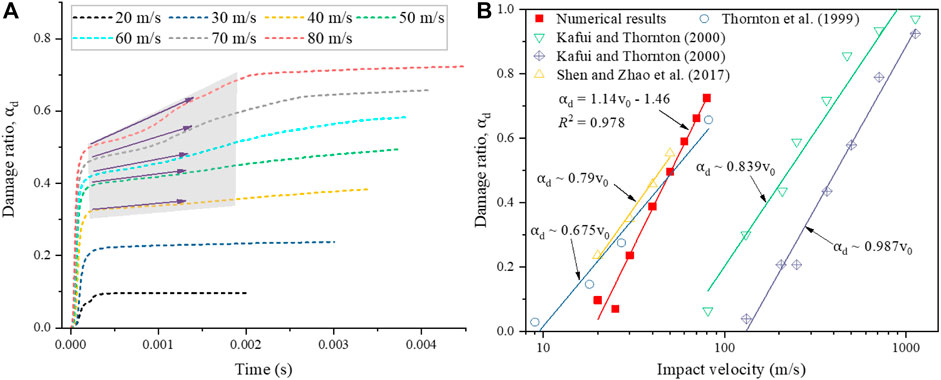
FIGURE 6. (A) Evolution of damage ratio (
Since the rock material at different impact velocities exhibits different fracture mechanisms (Gang et al., 2018). The mode mix ratio ψ was defined to quantify the relative proportion of tensile and shear deformation. The value of the mode mix ratio ψ ranges between 0 and 1, where ψ=0–0.5 indicates the failure is dominated by tensile fashion (ψ=0 is pure tensile failure), and ψ=0.5–1 denotes the failure is dominated by shear fashion (ψ=1 is pure shear failure). Figures 7A,B illustrate the probability distribution of the mode mix ratio under different impact velocities. It can be found from Figure 7A that when the impact velocity is 20 m/s, the fragments are mainly induced by the shear-dominated failure. In addition, an obvious shear plane can be found from the laboratory test results (as shown in Figure 3B). As the impact velocity increases to 30 m/s, the number of tensile-dominated failures significantly increases. The numerical results can well demonstrate the fracture mechanism of the rock sample in the laboratory tests (as illustrated in Section 3.1). As the impact velocity continues to increase, the shear-dominated failure gradually plays an increasing role in the dynamic fragmentation process, which will produce more substantial shear cracks and further generate a large number of small fragments. The results can agree well with the previous studies (Ma et al., 2018). Figure 7C shows the ratio of the mode mix ratio of shear-dominated failure to tensile-dominated failure (which can be expressed by Pshear/Ptensile). It can be found that when the impact velocity is greater than 25 m/s, the Pshear/Ptensile gradually increases with increasing the impact velocity. The correlation between the Pshear/Ptensile and the impact velocity (v0) can be expressed as:
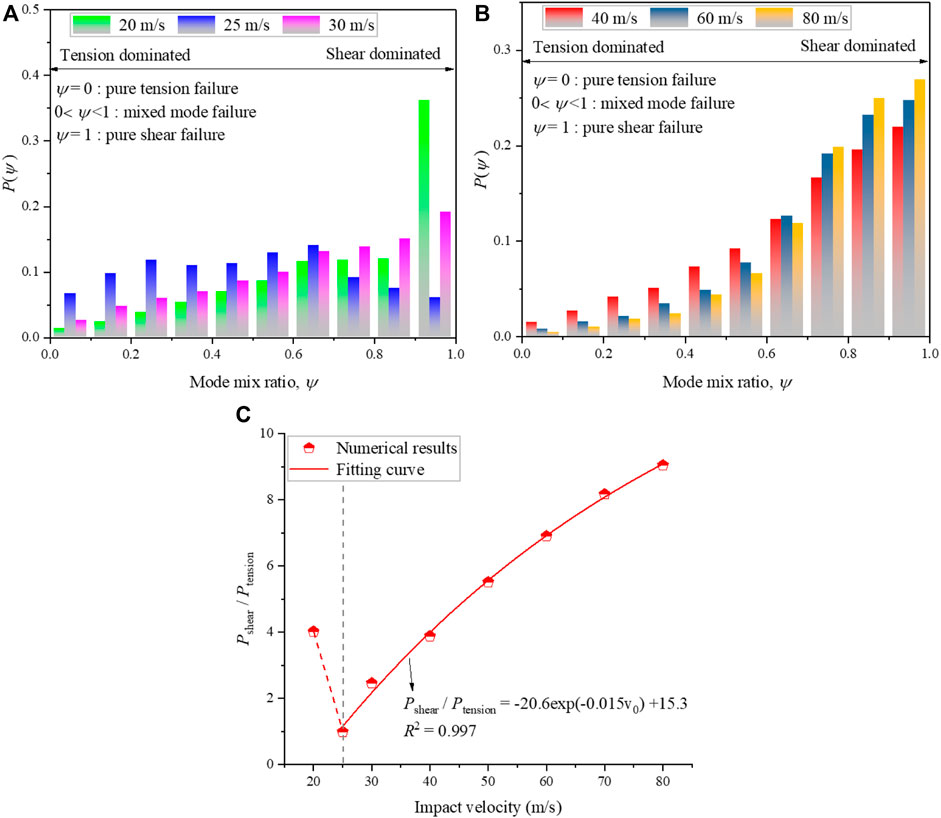
FIGURE 7. (A), (B) The probability distributions of the mode mix ratio under different impact velocities; (C) The ratio of the mode mix ratio of shear-dominated failure to tensile-dominated failure.
It should be noted that when the impact velocity is 25 m/s, the Pshear/Ptensile is approximately one; one possible explanation is that the shear-dominated failure occurs during the compression while the tensile-dominated failure happens during rebound. For the impact velocity=20 m/s, the Pshear/Ptensile is approximately 4. This is because when the impact velocity is 20 m/s, the shear failure occurs close to the impacting face of the cylindrical rock model, while no fragments were generated in the mid-rear part of the rock. This phenomenon can be seen from the experimental (Figure 3B) and numerical (Figure 5) results. During the dynamic fragmentation process, the failure pattern will differ in different regions of the rock sample (Khanal et al., 2004). Hence, the failure patterns of different regions were investigated herein. Figure 8 exhibits the schematic diagram of different regions of the sample. The probability distributions of the mode mix ratio of different regions of the sample under different impact velocities are shown in Figure 9. In the lower region near the impact face, for cases where the impact velocity is larger than 25 m/s, the fraction of shear-dominated failure rises with the increase in the impact velocity, whereas the fraction of tensile-dominated failure is minor and can be negligible. In the middle region, the proportion of shear-dominated failure gradually increases when the impact velocity is higher than 25 m/s. However, the proportion of tensile-dominated failure shows a clear increase. In the upper region on the other side of the sample, the proportion of tensile-dominated failure shows a significant increase compared to the other two regions. Figure 10 presents variations in the ratio of the number of shear failure cohesive element (Nshear) to the number of tensile failure cohesive element (Ntensile) in different regions of rock sample under different impact velocities. It can be observed from Figure 10 that when the impact velocity is smaller than 60 m/s, the fragments in the upper region are mostly generated by the tensile-dominated failure, and the opposite phenomenon will take place when the impact velocity is greater than 60 m/s. Additionally, the increasing trend of the Nshear/Ntensile is stronger the closer to the impact face.
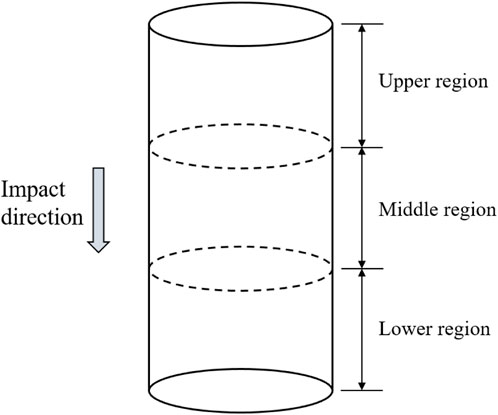
FIGURE 8. Schematic diagram of different regions of the sample.
FIGURE 9. Probability distributions of the mode mix ratio of different regions of the sample under different impact velocities. (A) and (B) are the lower region, (C) and (D) are the middle region, and (E) and (F) are the upper region.
FIGURE 10. Variations in the ratio of the number of shear failure cohesive element (Nshear) to the number of tensile failure cohesive element (Ntensile) in different regions of rock sample under different impact velocities.
The fragmentation and size distribution under different impact velocities are analyzed in this section. To analyze the distribution of fragment size, the characteristic fragment size can be defined as (Shen et al., 2017)
where the
Figures 11A, B show the number of fragments under different impact velocities. It can be observed from Figure 11A that the number of small fragments (i.e., d<0.06) increases linearly when the impact velocity is higher than 25 m/s, while it slightly decreases when the impact velocity increases from 20 m/s to 25 m/s. When the impact velocity changes from 20 m/s to 25 m/s, the quantity of the large fragments (i.e., d≥0.06) decreases, which is identical to the change in the number of the small fragments. As the impact velocity increases from 25 m/s to 60 m/s, the number of large fragments gradually increases. However, when the impact velocity is higher than 60 m/s, the number of large fragments reaches the maximum value (approximately 749) at 70 m/s and then slightly decreases. Generally, the large fragments have a higher danger coefficient due to destructive power and large impact force, which can pose a great threat to the infrastructure and the safety of human life and property in mountainous areas. And the fragmentation intensity can be characterized by the sizes of the two largest fragments. Therefore, the sizes of the two largest fragments under different impact velocities were analyzed. Figure 11C presents the variation in the sizes of the two largest fragments (V1st and V2nd) and their sum (V12) versus the impact velocity. It can be seen that for the impact velocity smaller than 25 m/s, both V2nd and V12 increase with the impact velocity. As the impact velocity continues to increase from 25 m/s to 80 m/s, both V2nd and V12 show a decreasing trend. However, the first largest fragment keeps decreasing. Additionally, the decrease trends of V1st, V2nd and V12 can be divided into three stages (as shown by the arrows in Figure 11C), and the decrease trends become slower with the increase of impact velocity. It is worth noting that the damage-fragmentation transition process (Kun and Herrmann, 1999; Timar et al., 2010) can be observed in this study, i.e. the volume of the second largest fragment shows a maximum when the impact velocity reaches the critical value, and fragmentation occurs when the volume of the first largest and second largest fragments become comparable.
FIGURE 11. Fragmentation characteristics of the sample under different impact velocities; (A) the number of the small fragment; (B) the number of the large fragment; (C) variation in the sizes of the two largest fragments and their sum versus the impact velocity (the oval shaded area shows the mutation point, the green vertical dashed lines and gray arrow show three different variation rate intervals).
The fragment size distribution can reflect the characteristics of the rock fracture mechanism and energy consumption during the fragmentation process. Many scholars have proposed various methods to characterize the fragment size distribution, such as the fractal dimension, Weibull distribution, and three-parameter generalized extreme value distribution. In the present study, the fractal dimension proposed by He et al. (Manchao, 2009) was utilized to characterize the distribution of fragment size. The fractal dimension can reflect the distributions of the apparently chaotic block and measure the irregularity of the apparently chaotic block. Db is defined as the fragment fractal dimension. The number of fragments with equivalent length equal to or greater than Leq can be described as follows:
where N0 is the number of the fragment with the maximum equivalent length Lmax, and Vf is the volume of the fragments. Equation 7 can be converted to a more concise form:
Figure 12 presents the lg (Lmax/Leq)-lgN curves and fractal dimensions of fragmented rock blocks. All curves have high correlations of the fitted straight lines (R2>0.948), which demonstrates that the fractal distribution can describe the fragment size distribution very well. It can be seen from Figure 12B that the fractal dimension (Db) gradually increases with the increase of the impact velocity. Additionally, it can be found from the fitted equation that as the impact velocity gradually increases, the fractal dimension would converge to a certain value (Carmona et al., 2008; Timar et al., 2012), this is because if the impact velocity is large enough, the size of generated fragments will be the mesh size of the solid elements. That is, each solid element is a single small fragment. Since a higher fractal dimension denotes a higher degree of fragmentation, it is again indicated that a higher impact velocity leads to more fragmented rock pieces. This phenomenon is also verified in Figure 11.
FIGURE 12. lg (Lmax/Leq)-lgN curves (A) and fractal dimensions (B) of fragmented rock block for the impact velocity from 20 to 80 m/s.
The flying velocity (

FIGURE 13. Schematic diagram of fragment flying velocity and angle.
FIGURE 14. (A) The distribution of fragment flying velocity at different impact velocities; (B) The average flying velocity of the fragment; (C) The maximum flying velocity of the fragment under different impact velocities.
Similarly, Figure 15A presents the distribution of fragment flying angles under different impact velocities. The flying angle is calculated from the angle between the direction of the fragment flying and the direction opposite to the initial impact direction of the sample (as shown in Figure 13). It can be seen that most of the fragments (>75.4%) were launched at small angles (<30°) for the lower impact velocities (20, 30 m/s), which means that the most of fragments generated by impact-induced fragmentation were rebounded. In contrast, with the continuous increase in the impact velocity, the proportion of fragment number flying at angles larger than 60° gradually increased and all exceeded 81.1%, suggesting that few fragments were rebounded. Figure 15B shows the average flying angle of fragments under different impact velocities. It can be seen that as the impact velocity increases from 30 to 40 m/s, the average flying angle has a sharp increase and then only slightly increases (76°–85°) for the impact velocity larger than 40 m/s.
FIGURE 15. (A) The distribution of fragment flying angle at different impact velocities (different color areas represent different variation intervals, and the black arrows show the decreasing or increasing trends); (B) the average flying angle of fragments under different impact velocities.
In this study, a coupled 3D-FDEM method was employed to simulate the dynamic impact-induced fragmentation process of rock. An improved fragment search algorithm was developed to analyze the fragmentation characteristics of rock sample. The progressive fracture process, damage evolution, the fragment characteristics as well as the fragment flying characteristics upon different impact velocities were deeply investigated. The main conclusions can be drawn:
1) As the impact velocity gradually increases, the failure location gradually moves away from the impact face, and the curves of damage ratio, which changes with time, become sharper and sharper during the impact process, and when the impact velocity is greater than 30 m/s, the damage ratio still increases slowly after the sharp increase, and more obvious with increasing impact velocity. Additionally, the damage ratio gradually increases with impact velocity.
2) For the impact velocity greater than 25 m/s, the shear-dominated failure gradually plays an increasing role in the fragmentation process. And the failure pattern will differ in different regions of the rock sample. The closer to the impact face, the greater the proportion of shear-dominated failure and the greater the increasing trend of the Pshear/Ptensile.
3) The number of small fragments gradually increases with the impact velocity as the impact velocity is larger than 25 m/s. While the number of large fragments only increases at impact velocities of 25–60 m/s, and reaches the maximum number at 70 m/s and then decreases. Both the size of the second largest fragment and the sum size of the two largest fragments have a maximum value at the impact velocity of 25 m/s and then gradually decrease with increasing impact velocity. At the same time, the size of the largest fragment keeps decreasing. Additionally, the variation in the fragment fractal dimension agrees well with that of the fragment number and fragmentation intensity, indicating that the fragment fractal dimension can reflect the impact-induced fragment size distribution well.
4) The proportion of the fragment number progressively decreases with increasing flying velocity, and the decreasing trend becomes gradually slower with the increase of impact velocity. Both the average and maximum flying velocities of fragments increase linearly with increasing impact velocity, and the former is obviously lower than the initial impact velocity, while the latter is significantly higher than the initial impact velocity. Similarly, the average flying angle gradually increases with the impact velocity, and the increasing trend becomes sharper for the impact velocity from 30 to 40 m/s, while the average flying angle only slightly increases (76°–85°) for the impact velocity higher than 40 m/s.
The original contributions presented in the study are included in the article/supplementary material, further inquiries can be directed to the corresponding author.
TY: Conceptualization, Formal analysis, Data curation, Visualization, Writing—original draft. HM: Supervision, Conceptualization, Software, Writing. LW: Supervision, Conceptualization. ZC: Supervision, Conceptualization, Software, Writing—review and editing. PZ: Supervision, Conceptualization. Gang Jin: Supervision, Conceptualization. WC: Supervision.
This work was financially supported by the National Natural Science Foundation of China (52004182 and 51908431).
Authors TY , GJ and WC are employed by Gansu Province Highway Traffic Construction Group Corporation; Author HM is employed by Zhejiang Jiaotong Road & Bridge Construction Corporation; Author PZ is employed by Chengdu Engineering Corporation Limited.
The remaining authors declare that the research was conducted in the absence of any commercial or financial relationships that could be construed as a potential conflict of interest.
All claims expressed in this article are solely those of the authors and do not necessarily represent those of their affiliated organizations, or those of the publisher, the editors and the reviewers. Any product that may be evaluated in this article, or claim that may be made by its manufacturer, is not guaranteed or endorsed by the publisher.
Aghahosseini, A., Khosravifard, A., and Tinh Quoc, B. (2019). Efficient analysis of dynamic fracture mechanics in various media by a novel meshfree approach. Theor. Appl. Fract. Mech. 99, 161–176. doi:10.1016/j.tafmec.2018.12.002
An, H. M., Liu, H., Han, H., Zheng, X., and Wang, X. (2017). Hybrid finite-discrete element modelling of dynamic fracture and resultant fragment casting and muck-piling by rock blast. Comput. Geotech. 81, 322–345. doi:10.1016/j.compgeo.2016.09.007
Bao, Y., Zhai, S., Chen, J., Xu, P., Sun, X., Zhan, J., et al. (2020). The evolution of the Samaoding paleolandslide river blocking event at the upstream reaches of the Jinsha River, Tibetan Plateau. Geomorphology, 106970. doi:10.1016/j.geomorph.2019.106970
Bunce, C. M., Cruden, D. M., and Morgenstern, N. R. (1997). Assessment of the hazard from rock fall on a highway. Can. Geotech. J. 34 (3), 344–356. doi:10.1139/t97-009
Carmona, H. A., Wittel, F. K., Kun, F., and Herrmann, H. J. (2008). Fragmentation processes in impact of spheres. Phys. Rev. E 77, 051302. doi:10.1103/physreve.77.051302
Chau, K. T., Wu, S. Z., Zhu, W. C., Tang, C. A., and Yu, T. X. (2003). “Dynamic fracture and fragmentation of spheres,” in 16th ASCE engineering mechanics conference (Seattle, USA: University of Washington), 2299–2307.
Chau, K. T., Wei, X., Wong, R., and Yu, T. (2000). Fragmentation of brittle spheres under static and dynamic compressions: Experiments and analyses. Mech. Mater. 32 (9), 543–554. doi:10.1016/s0167-6636(00)00026-0
Chau, K. T., Wong, R. H. C., Liu, J., and Lee, C. F. (2003). Rockfall hazard analysis for Hong Kong based on rockfall inventory. Rock Mech. Rock Eng. 36 (5), 383–408. doi:10.1007/s00603-002-0035-z
De Blasio, F. V., and Crosta, G. B. (2015). Fragmentation and boosting of rock falls and rock avalanches. Geophys. Res. Lett. 42 (20), 8463–8470. doi:10.1002/2015gl064723
Du, H.-b., Dai, F., Xu, Y., Yan, Z., and Wei, M. d. (2020). Mechanical responses and failure mechanism of hydrostatically pressurized rocks under combined compression-shear impacting. Int. J. Mech. Sci. 165, 105219. doi:10.1016/j.ijmecsci.2019.105219
Gang, , , Zhou, W., Zhang, Y., Wang, Q., and Chang, X. (2018). Fractal behavior and shape characteristics of fragments produced by the impact of quasi-brittle spheres. Powder Technol. 325, 498–509. doi:10.1016/j.powtec.2017.11.030
Giacomini, A., Buzzi, O., Renard, B., and Giani, G. (2009). Experimental studies on fragmentation of rock falls on impact with rock surfaces. Int. J. Rock Mech. Min. Sci. 46 (4), 708–715. doi:10.1016/j.ijrmms.2008.09.007
Giani, G. P., Giacomini, A., Migliazza, M., and Segalini, A. (2004). Experimental and theoretical studies to improve rock fall analysis and protection work design. Rock Mech. Rock Eng. 37 (5), 369–389. doi:10.1007/s00603-004-0027-2
Gong, F.-Q., and Zhao, G.-F. (2013). Dynamic indirect tensile strength of sandstone under different loading rates. Rock Mech. Rock Eng. 47 (6), 2271–2278. doi:10.1007/s00603-013-0503-7
Guo, L., Xiang, J., Latham, J. P., and Izzuddin, B. (2016). A numerical investigation of mesh sensitivity for a new three-dimensional fracture model within the combined finite-discrete element method. Eng. Fract. Mech. 151, 70–91. doi:10.1016/j.engfracmech.2015.11.006
Guo, L., Xiang, J., Latham, J. P., and Izzuddin, B. (2016). A numerical investigation of mesh sensitivity for a new three-dimensional fracture model within the combined finite-discrete element method. Eng. Fract. Mech. 151, 70–91. doi:10.1016/j.engfracmech.2015.11.006
Hao, H., Hao, Y., Li, J., and Chen, W. (2016). Review of the current practices in blast-resistant analysis and design of concrete structures. Adv. Struct. Eng. 19 (8), 1193–1223. doi:10.1177/1369433216656430
Hogan, J. D., Rogers, R. J., Spray, J. G., and Boonsue, S. (2012). Dynamic fragmentation of granite for impact energies of 6–28J. Eng. Fract. Mech. 79, 103–125. doi:10.1016/j.engfracmech.2011.10.006
Hou, T. X., Xu, Q., Yang, X. g., Lu, P. y., and Zhou, J. w. (2015). Experimental study of the fragmentation characteristics of brittle rocks by the effect of a freefall round hammer. Int. J. Fract. 194 (2), 169–185. doi:10.1007/s10704-015-0046-x
Kafui, K. D., and Thornton, C. (2000). Numerical simulations of impact breakage of a spherical crystalline agglomerate. Powder Technol. 109 (1-3), 113–132. doi:10.1016/s0032-5910(99)00231-4
Kala, J., and Husek, M. (2016). Improved element erosion function for concrete-like materials with the SPH method. Shock Vib., 1–13. doi:10.1155/2016/4593749
Khanal, M., Schubert, W., and Tomas, J. (2004). Ball impact and crack propagation - simulations of particle compound material. Granul. Matter 5 (4), 177–184. doi:10.1007/s10035-003-0149-3
Khanal, M., Schubert, W., and Tomas, J. (2008). Compression and impact loading experiments of high strength spherical composites. Int. J. Mineral Process. 86 (1-4), 104–113. doi:10.1016/j.minpro.2007.12.001
Kong, X., Fang, Q., Wu, H., and Peng, Y. (2016). Numerical predictions of cratering and scabbing in concrete slabs subjected to projectile impact using a modified version of HJC material model. Int. J. Impact Eng. 95, 61–71. doi:10.1016/j.ijimpeng.2016.04.014
Kun, F., and Herrmann, H. J. (1999). Transition from damage to fragmentation in collision of solids. Phys. Rev. E 59 (3), 2623–2632. doi:10.1103/physreve.59.2623
Li, X. F., Li, H., Zhang, Q., Jiang, J., and Zhao, J. (2018). Dynamic fragmentation of rock material: Characteristic size, fragment distribution and pulverization law. Eng. Fract. Mech. 199, 739–759. doi:10.1016/j.engfracmech.2018.06.024
Lin, H., Yang, H. T., Wang, Y. X., Zhao, Y. L., and Cao, R. H. (2019). Determination of the stress field and crack initiation angle of an open flaw tip under uniaxial compression. Theor. Appl. Fract. Mec. 104, 102358.
Liu, Y., Weng, L., and Chu, Z.-f. (2022). Numerical investigation of rock dynamic fragmentation during rockslides using a coupled 3D FEM-DEM method. J. Mt. Sci. 19 (4), 1051–1069. doi:10.1007/s11629-021-6930-0
Ma, G. W., An, X. M., Zhang, H. H., and Li, L. X. Modeling complex crack problems using the numerical manifold method. Int. J. Fract., 2009. 156(1): p. p.21–35, doi:10.1007/s10704-009-9342-7
Ma, G., Zhou, W., Zhang, Y., Wang, Q., and Chang, X. (2018). Fractal behavior and shape characteristics of fragments produced by the impact of quasi-brittle spheres. Powder Technol. 325, 498–509. doi:10.1016/j.powtec.2017.11.030
Mahabadi, O. K., Cottrell, B. E., and Grasselli, G., An example of realistic modelling of rock dynamics problems: FEM/DEM simulation of dynamic Brazilian test on barre granite. Rock Mech. Rock Eng., 2010. 43(6): p. p.707–716, doi:10.1007/s00603-010-0092-7
Manchao, H. E. (2009). Classification and research methods of rockburst experimental fragments. Chin. J. Rock Mech. Eng. 28 (8), 1521–1529. doi:10.1007/978-3-540-85168-4_52
Mishra, B. K., and Thornton, C. (2001). Impact breakage of particle agglomerates. Int. J. Mineral Process. 61 (4), 225–239. doi:10.1016/s0301-7516(00)00065-x
Moreno, R., Ghadiri, M., and Antony, S. J. (2003). Effect of the impact angle on the breakage of agglomerates: A numerical study using DEM. Powder Technol. 130 (1-3), 132–137. doi:10.1016/s0032-5910(02)00256-5
Munjiza, A., and John, N. W. M. (2002). Mesh size sensitivity of the combined FEM/DEM fracture and fragmentation algorithms. Eng. Fract. Mech. 69 (2), 281–295. doi:10.1016/s0013-7944(01)00090-x
Rabczuk, T., and Eibl, J. (2003). Simulation of high velocity concrete fragmentation using SPH/MLSPH. Int. J. Numer. Methods Eng. 56 (10), 1421–1444. doi:10.1002/nme.617
Rabczuk, T., Song, J. H., and Belytschko, T. (2009). Simulations of instability in dynamic fracture by the cracking particles method. Eng. Fract. Mech. 76 (6), 730–741. doi:10.1016/j.engfracmech.2008.06.002
Ruiz-Carulla, R., Corominas, J., and Mavrouli, O. (2016). A fractal fragmentation model for rockfalls. Landslides 14 (3), 875–889. doi:10.1007/s10346-016-0773-8
Samimi, A., Moreno, R., and Ghadiri, M. (2004). Analysis of impact damage of agglomerates: Effect of impact angle. Powder Technol. 143-144, 97–109. (none). doi:10.1016/j.powtec.2004.04.027
Sanchidrián, J. A., Ouchterlony, F., Moser, P., Segarra, P., and Lopez, L. M. (2012). Performance of some distributions to describe rock fragmentation data. Int. J. Rock Mech. Min. Sci. (1997). 53, 18–31. doi:10.1016/j.ijrmms.2012.04.001
Shen, W.-G., Zhao, T., Crosta, G. B., and Dai, F. (2017). Analysis of impact-induced rock fragmentation using a discrete element approach. Int. J. Rock Mech. Min. Sci. 98, 33–38. doi:10.1016/j.ijrmms.2017.07.014
Stoopes, G. R., and Sheridan, M. F. (1992). Giant debris avalanches from the Colima Volcanic Complex, Mexico: Implications for long-runout landslides (>100 km) and hazard assessment. Geol. 20 (4), 299–302. doi:10.1130/0091-7613(1992)020<0299:gdaftc>2.3.co;2
Su, C. D., Wu, Q., Weng, L., and Chang, X. (2019). Experimental investigation of mode I fracture features of steel fiber-reinforced reactive powder concrete using semi-circular bend test. Eng. Fract. Mech. 209, 187–199. doi:10.1016/j.engfracmech.2019.01.029
Thornton, C., Ciomocosa, M. T., and Adamsb, M. J. (1999). Numerical simulations of agglomerate impact breakage. Powder Technol. 105 (1–3), 74–82.
Timar, G., Blomer, J., Kun, F., and Herrmann, H. J. (2010). New universality class for the fragmentation of plastic materials. Phys. Rev. Lett. 104 (9), 095502. doi:10.1103/physrevlett.104.095502
Timar, G., Kun, F., Carmona, H. A., and Herrmann, H. J. (2012). Scaling laws for impact fragmentation of spherical solids. Phys. Rev. E 86, 016113. doi:10.1103/physreve.86.016113
Turon, A., Davila, C., Camanho, P., and Costa, J. (2007). An engineering solution for mesh size effects in the simulation of delamination using cohesive zone models. Eng. Fract. Mech. 74 (10), 1665–1682. doi:10.1016/j.engfracmech.2006.08.025
Ulusay, R. J. S. I. P. (2014). ISRM Suggest. Methods Rock Charact. Test. Monit. 15 (1), 47–48. doi:10.1007/978-3-319-07713-0
Wang, W., Zhang, D., Lu, F., Wang, S. c., and Tang, F. (2013). Experimental study and numerical simulation of the damage mode of a square reinforced concrete slab under close-in explosion. Eng. Fail. Anal. 27, 41–51. doi:10.1016/j.engfailanal.2012.07.010
Wang, Y. N., and Tonon, F. (2011). Discrete element modeling of rock fragmentation upon impact in rock fall analysis. Rock Mech. Rock Eng. 44 (1), 23–35. doi:10.1007/s00603-010-0110-9
Wang, Y. (2009). Three-dimensional rock-fall analysis with impact fragmentation and fly-rock modeling. Dissertations & Theses Gradworks. Austin: The University of Texas.
Weng, L., Wu, Z., Liu, Q., and Wang, Z. (2019). Energy dissipation and dynamic fragmentation of dry and water-saturated siltstones under sub-zero temperatures. Eng. Fract. Mech. 220, 106659. doi:10.1016/j.engfracmech.2019.106659
Weng, L., Wu, Z., Taheri, A., Liu, Q., and Lu, H. (2020). Deterioration of dynamic mechanical properties of granite due to freeze-thaw weathering: Considering the effects of moisture conditions. Cold Regions Sci. Technol., 103092. doi:10.1016/j.coldregions.2020.103092
Whitehouse, I. E., and Griffiths, G. A. (1983). Frequency and hazard of large rock avalanches in the central southern alps, new-zealand. Geol. 11 (6), 331–334. doi:10.1130/0091-7613(1983)11<331:faholr>2.0.co;2
Wu, S. Z., Chau, K. T., and Yu, T. X. (2004). Crushing and fragmentation of brittle spheres under double impact test. Powder Technol. 143-144, 41–55. doi:10.1016/j.powtec.2004.04.028
Wu, Y., Wang, D., and Wu, C.-T. (2014). Three dimensional fragmentation simulation of concrete structures with a nodally regularized meshfree method. Theor. Appl. Fract. Mech. 72, 89–99. doi:10.1016/j.tafmec.2014.04.006
Wu, Z., Cui, W., Fan, L., and Liu, Q. (2019a). Mesomechanism of the dynamic tensile fracture and fragmentation behaviour of concrete with heterogeneous mesostructure. Constr. Build. Mater. 217, 573–591. doi:10.1016/j.conbuildmat.2019.05.094
Wu, Z., and Wong, L. N. Y., (2012). Frictional crack initiation and propagation analysis using the numerical manifold method. Comput. Geotech., 2012. 39: p. p.38–53, doi:10.1016/j.compgeo.2011.08.011
Wu, Z., Zhang, P., Fan, L., and Liu, Q. (2019b). Numerical study of the effect of confining pressure on the rock breakage efficiency and fragment size distribution of a TBM cutter using a coupled FEM-DEM method. Tunn. Undergr. Space Technol. 88, 260–275. doi:10.1016/j.tust.2019.03.012
Yao, D., Peng, Z., and Meng, X. J. G. J. I. (2015). Remotely triggered earthquakes in south-central tibet following the 2004 Mw 9.1 sumatra and 2005 Mw 8.6 nias earthquakes. Geophys. J. Int. 2 (2), 543. doi:10.1093/gji/ggv037
Ye, Y., Thoeni, K., Zeng, Y., Buzzi, O., and Giacomini, A. (2019). Numerical investigation of the fragmentation process in marble spheres upon dynamic impact. Rock Mech. Rock Eng. 53 (3), 1287–1304. doi:10.1007/s00603-019-01972-9
Zheng, K., Du, C., Li, J. P., Qiu, B., and Fu, L. (2015). Numerical simulation of the impact-breakage behavior of non-spherical agglomerates. Powder Technology An International Journal on the Science & Technology of Wet & Dry Particulate Systems.
Zhao, C. F., and Chen, J. Y. (2013). Damage mechanism and mode of square reinforced concrete slab subjected to blast loading. Theor. Appl. Fract. Mech. 63-64, 54–62. doi:10.1016/j.tafmec.2013.03.006
Zhao, T. (2018). Investigation of rock fragmentation during rockfalls and rock avalanches via 3-D discrete element analyses. JGR Earth Surf. 122, 678. doi:10.1002/2016JF004060
Zhao, T., Crosta, G. B., Dattola, G., and Utili, S. (2018). Dynamic fragmentation of jointed rock blocks during rockslide‐avalanches: Insights from discrete element analyses. J. Geophys. Res. Solid Earth 123 (4), 3250–3269. doi:10.1002/2017jb015210
Zhao, Y. L., Wang, Y., Wang, W., Tang, L., Liu, Q., and Cheng, G. (2019). Modeling of rheological fracture behavior of rock cracks subjected to hydraulic pressure and far field stresses. Theor. Appl. Fract. Mech. 101, 59–66. doi:10.1016/j.tafmec.2019.01.026
Zhao, Y. L., Zhang, L., Liao, J., Wang, W., Liu, Q., and Tang, L. (2020). Experimental study of fracture toughness and subcritical crack growth of three rocks under different environments. Int. J. Geomech. 20 (8). doi:10.1061/(asce)gm.1943-5622.0001779
Zhou, S., Ouyang, C., An, H., Jiang, T., and Xu, Q. (2020). Comprehensive study of the Beijing Daanshan rockslide based on real-time videos, field investigations, and numerical modeling. Landslides 17 (5), 1217–1231. doi:10.1007/s10346-020-01345-2
Keywords: impact, rock fragmentation, 3D FDEM, fragment characteristics, high-velocity (H-V) impact
Citation: Yang T, Ma H, Weng L, Liu Y, Chu Z, Zhang P, Jin G and Chang W (2022) Fragmentation analyses of rocks under high-velocity impacts using the combined finite-discrete element simulation. Front. Earth Sci. 10:998521. doi: 10.3389/feart.2022.998521
Received: 20 July 2022; Accepted: 13 September 2022;
Published: 30 September 2022.
Edited by:
Dongdong Yao, China University of Geosciences Wuhan, ChinaReviewed by:
Ferenc Kun, University of Debrecen, HungaryCopyright © 2022 Yang, Ma, Weng, Liu, Chu, Zhang, Jin and Chang. This is an open-access article distributed under the terms of the Creative Commons Attribution License (CC BY). The use, distribution or reproduction in other forums is permitted, provided the original author(s) and the copyright owner(s) are credited and that the original publication in this journal is cited, in accordance with accepted academic practice. No use, distribution or reproduction is permitted which does not comply with these terms.
*Correspondence: Yang Liu, UmljaGFyZGxpdXlAd2h1LmVkdS5jbg==; Zhaofei Chu, emhhb2ZlaWNodUB3aHUuZWR1LmNu
Disclaimer: All claims expressed in this article are solely those of the authors and do not necessarily represent those of their affiliated organizations, or those of the publisher, the editors and the reviewers. Any product that may be evaluated in this article or claim that may be made by its manufacturer is not guaranteed or endorsed by the publisher.
Research integrity at Frontiers
Learn more about the work of our research integrity team to safeguard the quality of each article we publish.