 Pin Jia
 Xianzhe Ke
 Yang Li1,2
95% of researchers rate our articles as excellent or good
Learn more about the work of our research integrity team to safeguard the quality of each article we publish.
Find out more
ORIGINAL RESEARCH article
Front. Earth Sci. , 12 September 2022
Sec. Economic Geology
Volume 10 - 2022 | https://doi.org/10.3389/feart.2022.996087
This article is part of the Research Topic Advances in Multi-Physics Multi-Component Fluid Transport and Multi-Scale Geophysical Modeling in Unconventional Oil and Gas Reservoir - Volume II View all 4 articles
Compared with conventional reservoirs, shale reservoirs are more difficult to develop due to their characteristics of self-generation and self-storage and tightness. Based on the experience accumulated in production practice, the technical method of improving shale oil development through shut-in is put forward. The literature research on shale reservoirs shows that there is a lack of microscopic study on imbibition, the essence of oil–water exchange is not clear enough, and there is a lack of the systematic summary and induction of theoretical knowledge. This article starts from the background of shut-in stimulation of Gulong shale oil, conducts literature research on the related knowledge of shut-in of shale oil from three aspects: characterization of fracture network, shut-in mechanism, and oil and water distribution state, and summarizes the law of shut-in of shale oil in a microscopic aspect. On this basis, a dual-porosity numerical simulation model is established according to the geological and fluid characteristics of the Gulong shale oil reservoir. Through the simulation of a numerical simulation model, the water saturation and pressure maps of the matrix and lamellation-fracture system in the process of shut-in were obtained. It was found that the matrix system basically did not participate in the oil–water exchange in the process of shut-in, so in the subsequent characteristic curve analysis, only the lamellation-fracture system was mapped and analyzed. The water saturation and pressure curves of different distances of the main fracture at different times were made, and it was found that the water saturation and pressure in the main fracture and near fracture areas were higher, and the change was more obvious than that in the far. Thus, the pressure drop curves of the near fracture were used to analyze the flow stage of the fluid. The single variable method is used to analyze the influencing factors from two aspects: the fracture density and permeability of the stimulated zone. The results will give a better understanding of the oil and water distribution during shut-in and guide the duration of shut-in in shale oil reservoirs.
The success of the shale gas revolution in the United States has aroused the attention of various countries to unconventional oil and gas. With the progress of technology, unconventional oil and gas can also be produced on a large scale (Zhou and Yang, 2012; Zhang, 2015; Li et al., 2021). Compared with conventional oil resources, shale oil is characterized by self-generation, self-storage, tight reservoir, and poor liquidity, and is generally exploited by horizontal drilling technology and segmented and multistage fracturing technology (Li and Zhang, 2011; Zou et al., 2015; Yuan et al., 2019). With China’s existing technological level, shale reservoir development costs are high, production cannot be guaranteed, and the development effect is not good due to low economic benefit. Therefore, it is urgent to study the new development mode of shale reservoirs (Jing et al., 2012; Zhang, 2012; Hu et al., 2020). In the process of field practice, continuous attempts have been made to find and propose the measure of well closure to improve the development effect of shale oil, that is, after fracturing, the well is shut-in for a period of time to improve the productivity (Zou et al., 2013; Wang et al., 2014; Zhang et al., 2021). The high capillary force of micro–nano pores in the shale reservoir is utilized to imbibe the fracturing fluid, effectively supplement the formation energy, increase the stable production time, and improve the oil production efficiency (Yang, 2020), (Shang, 2017)
The following results were obtained after the investigation of shale oil pressure fracture network. Wang (Wang et al. 2021) used SEM to observe the natural section of layered shale, as shown in Figure 1. Liu (Liu, 2015) et al. believed that, self-imbibition and hydration of a fracturing fluid in shales could effectively increase the complexity of the fracture network, thus improving the contact area between the reservoir and wellbore. Huang (Huang, 2016) proposed that self-imbibition of shale reservoirs is the cause of the fracture network formation, which causes the fracturing fluid to remain in the reservoir. Zhou et al. (Tong et al., 2016) believed that the higher the difference between the vertical stress and the minimum horizontal principal stress, the more conducive it is to the generation of vertical cracks. Tian et al. (Tian et al., 2017) found that in fracture networks, the pressure required for fracture closure is related to the fracture formed by the flow direction. Xue (Xue et al., 2019) found that when the shale brittleness index was small, fractures mainly expanded in the shale matrix along the direction of the maximum principal stress, making it difficult to form complex fracture networks. Huang (Huang, 2019) found that, the more complex the fracture network, the lower the flowback rate of the fracturing fluid and the better the fracture treatment effect. The following results were obtained after the investigation on the mechanism of well smother. Le (Le et al., 2009) concluded that it takes time for permeability to recover in the process of the well smother, indicating that imbibition caused by capillary force can promote permeability recovery in the process of flowback. Cheng (Cheng, 2010) found that shut-in has an impact on fracturing fluid flowback and production. Prolonged shut-in can significantly reduce water production and greatly increase gas production after shut-in, with no adverse impact on long-term production. Zhang et al. (Zhang et al., 2017) found that with the increase of well-boring time, the initial gas production of well opening decreased first and then increased, but for long-term gas production, it first increased and then decreased, and the fracturing fluid flowback rate decreased exponentially. Ma et al. (Ma et al., 2018) found that the development degree of reservoir bedding, microfractures, and reservoir reconstruction have a significant impact on the effect of well closure. Liu et al. (Liu et al., 2020) believed that the relative recovery degree was the highest during the period from imbibition flooding to diffusion self-imbibition, and they believed that this period was the best time for well closure. Li et al. (Li et al., 2007) found that surfactants could reduce the interfacial tension between oil and water, resulting in a decrease in the capillary force, and the imbibition oil displacement process mainly depended on the capillary force. Wang et al. (Wang et al., 2009) proposed that both water saturation and oil–water viscosity ratio have certain influence on the imbibition effect. The higher the water saturation, the lower the oil–water viscosity ratio, and the better the imbibition effect is. Liu (Liu, 2017) proposed that oil and gas in small- and medium-sized pores would be displaced into large-sized pores in the process of well smother, thus completing the displacement in the imbibition process. Zhang (Zhang et al., 2018), small and medium-sized pores play a large role in imbibition, while large-sized pores play a small role in imbibition, and there is no obvious correlation between porosity and the recovery degree of imbibition. Yao (Yao, 2021) found that the imbibition efficiency of the cores with fractures was higher than that of the shale oil cores without fractures, and the influence of fractures on imbibition efficiency can be improved under pressure. Cai (Cai, 2021) proposed the microscopic imbibition displacement mechanism, as shown in Figure 2. Thus, based on the results obtained from the aforementioned studies, it can be seen that at present, there is a general understanding of the shut-in in shale reservoirs, but there are still the following problems: there is no detailed and comprehensive numerical simulation study on shut-in, and there is a lack of systematic understanding of theoretical knowledge. There is a lack of research on the distribution of oil and water in the shut-in of shale oil, the flow mechanism of oil and water is not clear, and the distribution of oil and water needs to be summarized. Therefore, the lack of research on the influencing factors of the shut-in makes it impossible to clarify the applicable conditions.
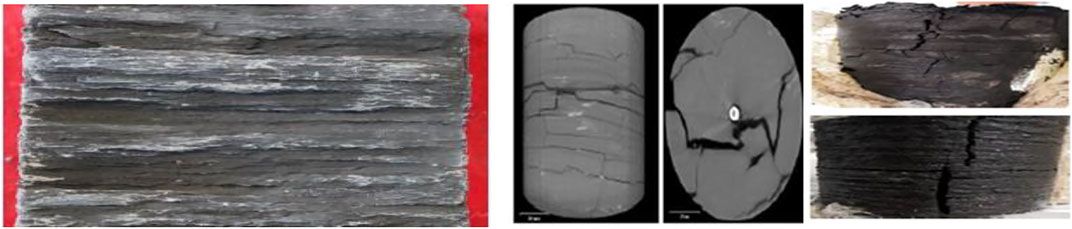
FIGURE 1. Natural section of layered shale (Wang et al., 2021)

FIGURE 2. Microscopic imbibition displacement mechanism. (A)Water fills the small pores (B)Oil is displaced into the macro-pores (C) Oil is expelled (Cai, 2021)
At present, most of the research on bored wells in shale reservoirs is theoretical, and few people have conducted research through numerical simulation methods. In order to fill the gap in this field, in view of the existing problems, this article intends to establish the Gulong shale oil shut-in model by using the method of numerical simulation, summarize the law of oil and water imbibition, analyze the distribution of oil and water flow in shut-in after pressure, and deepen the comprehensive understanding of the Gulong shale reservoir. Firstly, the characteristics of fracture network and the borehole-boring mechanism of shale reservoirs are investigated. After that, a numerical simulation model is established on the basis of the investigation of the shut-in mechanism to simulate the process of shut-in after fracturing. The results of the running model were obtained, and the dynamic response characteristics of the oil and water distribution were analyzed to clarify the oil and water distribution states and determine the effect of oil and water distribution. Then, the single variable method was used to study the influence of permeability and fracture density on the oil and water response during shut-in periods.
Due to the tight well process, the reservoir can enhance the displacement of crude oil in the pores, and thus the crude oil can be displaced from small pores to large pores, thus increasing production. It can be seen that imbibition and the pressure–fracture network play important roles in shut-in technology, and the analysis of the imbibition law of oil and water is the basis for understanding the influence of imbibition on reservoirs.
There are a large number of micro–nano pores, dense bedding fractures, and structural fractures in Gulong shale, which constitute a complex pore network and provide necessary conditions for shale oil storage and accumulation, thus forming an independent or local oil and gas permeable pathway (Jin et al., 2020; Liang et al., 2020; Wang et al., 2020; Wang et al., 2021; Zhao et al., 2021).
According to the study of R.G. James et al. (James, 1982), the density of lamellation-fracture in shale reservoirs can be expressed by shape factor
where, hf is the thickness of the single lamellation-fracture, m; ρf is the density of lamellation-fracture, m−1; ϕf,bulk is the bulk porosity of the lamellation-fracture system, dimensionless; ϕf,enk is the intrinsic porosity of the lamellation-fracture system, dimensionless; kf,bulk is the bulk permeability of lamellation-fracture system, mD; and kf,enk is the intrinsic permeability of the lamellation-fracture system, mD.
The size and classification of the pore throat are the main factors affecting reservoir structure, and the capillary pressure and relative permeability curve are the most intuitive and effective methods (Li et al., 2013; Li et al., 2019). The relative permeability of oil and water in Gulong shale oil is shown in Figure 3. Guerra’s work in the Eagle Ford shale in the US showed that oil flows in fracture systems benefit from the presence of surfactants in the water contained in the fractures. Due to the interaction between phase and flow interference, oil–water relative permeability in fractures is non-linear, and surface chemical effects, especially wettability, play a decisive role in relative permeability (Bustin et al., 2022; Basbug et al., 2022; Schubarth et al., 2022; Mulhim et al., 2022; Guerra et al., 2022). In the process of imbibition, the degree of imbibition of the fluid inside the pores is affected by the pores inside the core. The simpler the pore structure is, the larger the pore radius is, and the lower the imbibition speed is. Under the condition of pressure, the velocity of the fluid in the core with a larger pore radius is faster than that with a smaller pore radius. Micro–nano pores are extremely developed in shale reservoirs, providing sufficient dynamic support for fluid imbibition (Yang et al., 2016; Wu et al., 2018; Cai, 2021). Under the condition of sufficient capillary force, the fluid in the large pore can flow to the small pore under the action of capillary force, thus reducing the water saturation in the large pore, providing sufficient channels for the transportation of oil and gas in the large pore, reducing the water saturation to a certain extent and improving the productivity of the oilfield (Cai, 2021).
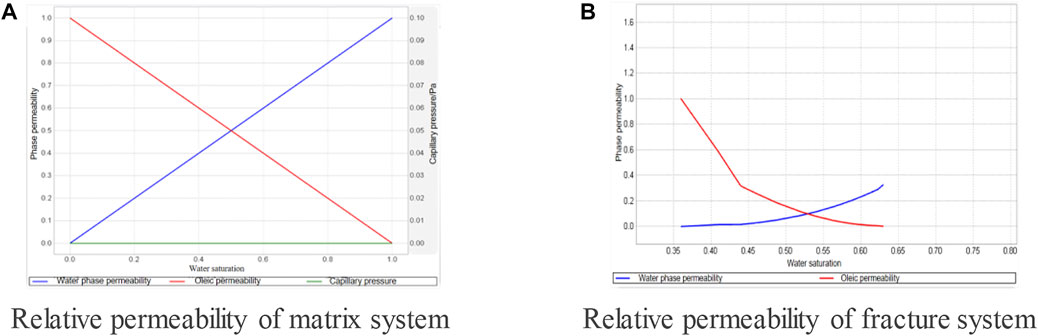
FIGURE 3. Relative permeability of oil and water. (A) Relative permeability of the matrix system. (B) Relative permeability of the fracture system.
Taking the Gulong shale reservoir as an example, the formation and fluid characteristics of the Gulong shale reservoir are investigated, and it is found that the Gulong shale reservoir is a pure shale reservoir with extremely well-developed lamellation-fractures. The matrix and lamellation-fractures are divided into two systems, and the establishment of an oil–water two-phase dual-porosity model is more consistent with the characteristics of the Gulong shale reservoir. We will build a more horizontal well section with the main fractures, induced cracks, and an unstimulated zone through the numerical simulation, poured through a short time to simulate the shut-in fracturing fluid of the initial point, so as to establish a Gulong shale reservoir numerical simulation model of its characteristics.
The Gulong shale reservoir system is mainly composed of matrix pores–foliation fractures. The nanoscale pore fracture system controlled by horizontal foliation greatly improves the reservoir’s physical properties and forms a high horizontal porosity and permeability zone. Through the core analysis, the number of lamellation-fractures is found to be 1000–3000 m, the ratio of face rate is 22–79%, the horizontal permeability of the core is 0.58, the vertical permeability is <0.0001, the completion drilling depth of W1 is 4,300 m, the vertical depth is 2,559 m, and the horizontal section length is 1,562 m. The lithology is stratified with lamellar shale with particle size less than 0.0039 mm. There are 10 frac-stages with an average cluster spacing of 10 m.
According to the literature research and the aforementioned results, the basic parameters of the post-compression shut-in numerical simulation model of Gulong shale are shown in Table 1.

TABLE 1. Basic parameters of the Gulong shale closed-well numerical simulation.
Under normal circumstances, the cracks of the reservoir space of shale is much higher than that of the matrix, and the fracture porosity is greater than the base of the shale porosity, and the fracture flow capacity is much higher than that of the shale oil flow ability of the matrix. Thus, the fracture permeability is higher than that of shale permeability of the matrix, the flow of oil and the oil displacement phenomenon are the basic characteristics of the fracture–pore medium. According to this, the property of the media with dual storage and flow of oil in the cracks and pores is called dual-porosity. According to the aforementioned investigation on Gulong shale, it develops a large number of micro–nano pores, foliation and its development, and its matrix system develops medium and high-organic matter shale, thus establishing an oil–water two-phase dual-porosity model that is consistent with the reservoir characteristics of Gulong shale.
In order to better represent the fracturing main fracture in the model, the model grid is encrypted. Figure 4 is the result after the grid is encrypted. After grid encryption, the total number of grids obtained is 281 × 81 × 2, that is, there are 281 grids in the X direction, 81 grids in the Y direction, and 2 grids in the Z direction (shale matrix system and cleavage system).
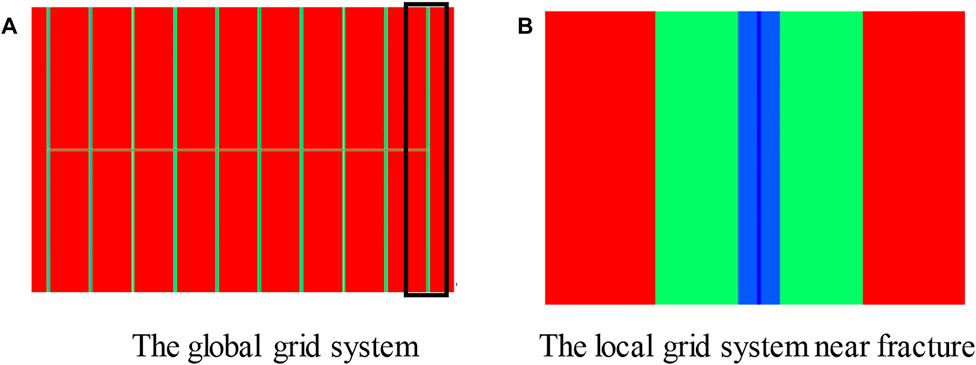
FIGURE 4. The grid system of the numerical model. (A) The global grid system. (B) The local grid system near a fracture.
The parameters required for the model obtained from the investigation, such as permeability, porosity, compressibility, etc., are written into the model, and the production system is formulated according to the requirements of shut-in. Finally, a set of numerical models for shut-in in the Gulong shale reservoir after fracturing was obtained.
Based on the investigation on the mechanism of shut-in after hydraulic fracturing in the Gulong shale reservoir, a dual-porosity model for the Gulong shale reservoir is established, as shown in Figure 5 and Figure 6. The area where the lamellation-fractures are opened after fracturing is set as the stimulated area, and the area where the lamellation-fractures are not opened after fracturing is set as the unstimulated area.
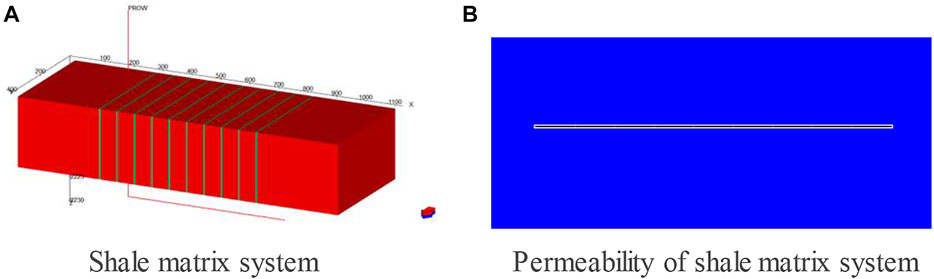
FIGURE 5. (A) Shale matrix system (B) Permeability of shale matrix system.
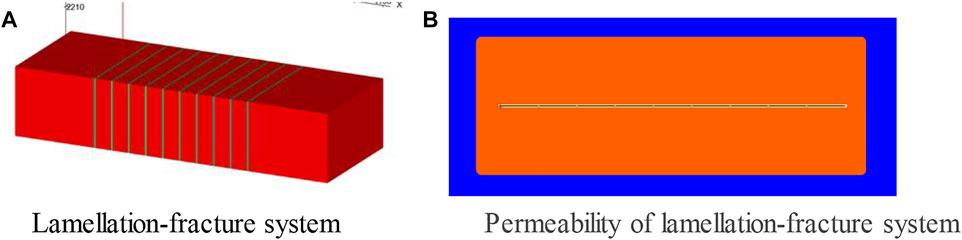
FIGURE 6. Lamellation-fracture system in the numerical model. (A) Lamellation-fracture system. (B)Permeability of the lamellation-fracture system.
The distribution characteristics of oil and water in shut-in period in shale reservoirs can be described by water-saturation distribution and pressure distribution in main fractures and the stimulated zone, and the distribution status and characteristics of oil and water in shut-in periods in shale reservoirs can be analyzed by water saturation and pressure distribution.
In the numerical simulation model, the shale–matrix system is regarded as a continuum, and the lamellation-fracture system is regarded as a continuum, and the lamellation-fracture system and shale matrix system are studied and discussed separately. Taking the first injection of the fracturing fluid as the zero point of time, the variation of water saturation of the main fracture and its surrounding stimulated zone at a different time was selected, respectively. Firstly, the color code in the numerical simulation software is modified uniformly. The variation of water saturation in the main fracture and stimulated zone of the shale matrix system at different times is captured as shown in the Figures 7, 8.
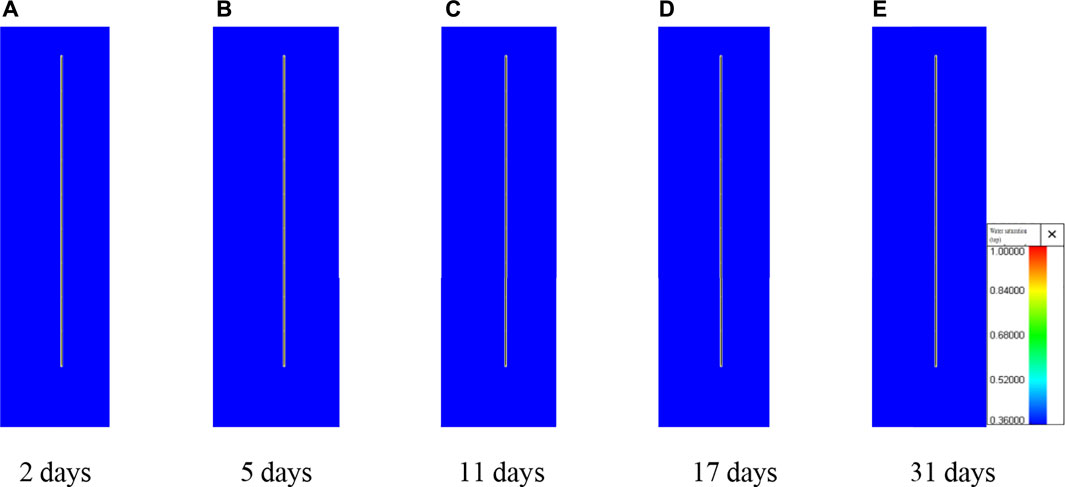
FIGURE 7. Water saturation field of the shale matrix system during the shut-in period. (A)2 days, (B)5 days, (C)11 days, (D)17 days, and (E)31 days.
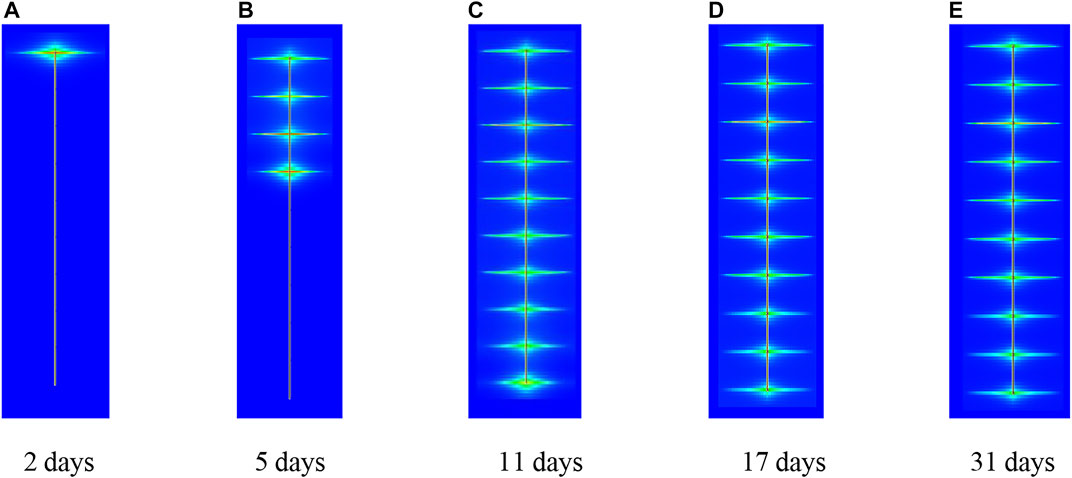
FIGURE 8. Water saturation of the lamellation-fracture system during the shut-in period. (A)2 days, (B)5 days, (C)11 days, (D)17 days, and (E)31 days.
Changes in water saturation by the shale matrix system are small and mainly concentrated in the main fractures. The shale matrix system of water saturation has not changed, which can be concluded that in the process of shut-in, the shale matrix system is not involved in the process of oil and water exchange, imbibition, and seepage of liquid will not almost occur. The schematic diagram of water saturation of the lamellation-fracture system at the same time as the shale matrix is captured as follows.
After water injection, it was found that the water saturation of the first main fracture increased significantly. Through the water saturation of the lamellation-fracture system on the second day, the water saturation of the adjacent stimulated area also increased accordingly. As the fracture extends, water saturation in the zone increases less because the fracture consumes the energy carried by the fracturing fluid injected into the formation. The remaining main fractures are the same as the change of the first one. Water saturation increases with fracturing fluid injection until the well is bored on the 10th day after water injection is completed. Shut-in increases with time, the main seam water saturation gradually reduces, the transformation zone near decreases in the water saturation and water saturation change area is more and more focused on the main seam, which may be due to the process of shut-in-produced oil and water exchange, the oil and gas in the lamellation seam is injected fracturing fluid displacement to the main crack, and entering a lamellation seam fracturing fluid. The water saturation of the main fracture is lower than at the beginning of the borehole.
During the fracturing of the formation, the pressure changes of the lamellation-fracture system and the shale matrix system are different. The pressure distribution at different times is extracted to analyze and summarize the law. Changes in pressure distribution of the shale matrix system at different times are captured as shown in Figure 9.

FIGURE 9. Pressure distribution of the shale matrix system during the shut-in period. (A)2 days, (B)5 days, (C)11 days, (D)17 days, and (E)31 days.
The overall pressure change in the shale matrix system is small and always concentrated around the main fracture as water is injected into each main fracture. The pressure of the main fracture increases the most, and the pressure of the main fracture also rises slowly with the increase of the shut-in time. The pressure in the stimulated zone gradually decreases from the main fracture to the surroundings, and it also rises slowly with the increase of shut-in time. There is no injection of external energy when the well is shut, and only the energy existing in fractures can slowly supplement the energy of the shale matrix system. Therefore, the pressure increase is not obvious when the well is shut, and the pressure-increase range gradually covers the whole stimulated zone compared with the fracturing water injection. The pressure field changes of the lamellation-fracture system at the same time as the shale matrix system are captured as shown in Figure 10.
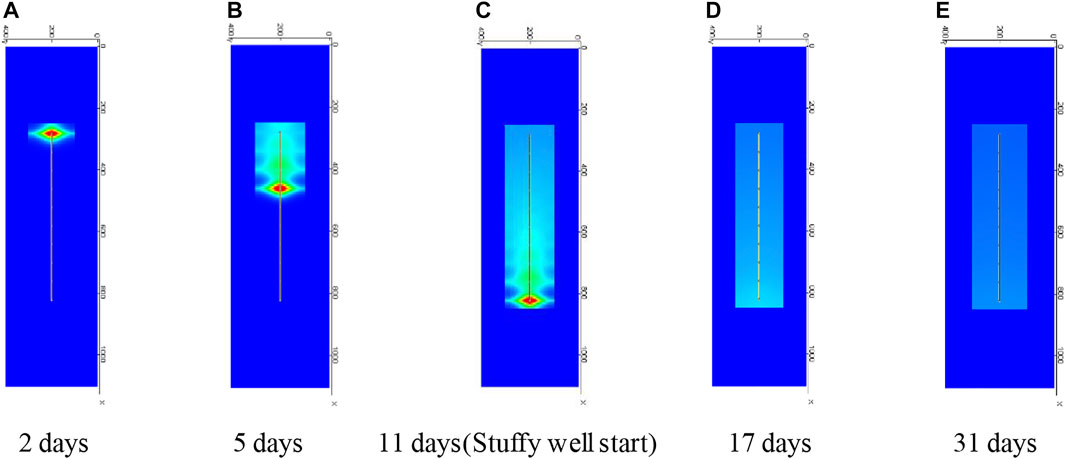
FIGURE 10. Pressure distribution of the lamellation-fracture system during the shut-in period. (A)2 days, (B)5 days, (C)11 days, (Stuffy well start) (D)17 days, and (E)31 days.
The pressure variation of the lamellation-fracture system is a well reflection of water injection in fracturing. The pressure increases rapidly when water injection is carried out in fracturing, and the pressure of the main fracture is the highest. The pressure decreases gradually in the process of spreading to the periphery. The pressure wave advances forward with the increase of the water injection time, and the pressure changes of the ten main fractures have the same law, successively. On the 11 days, the pressure wave began to spread to the whole area with the increase of the borehole time, and the pressure gradually decreased with the increase of time, and finally tended to a balanced and uniform distribution. The reason may be that the high energy ground in the fissure is continuously exported to the low energy, and finally an energy balance state is reached. It can be seen that the pressure in the stimulated zone tends to a balanced and uniform state on the thirty-first day, that is, it reaches this state after 20 days of shut-in.
In the previous section, the water saturation and pressure diagrams of the shale matrix system and lamellation-fracture system were analyzed. It was found that the water saturation and pressure of the shale matrix system basically did not change, which could be ignored compared with the changes of the lamellation-fracture system. Therefore, only the water saturation and pressure changes of the lamellation-fracture system were discussed in this section.
In order to have a more accurate understanding of water saturation changes in the main fracture and its adjacent stimulated zone, we take the last main fracture as an example and make the water saturation changes of the fracture systems at different transverse distances of the main fracture at different times, as shown in Figure 11. It can be observed that at the beginning, the water saturation in the main fracture and near fracture area is much higher than that in the far area and is close to 100%. The water saturation of the main fracture does not change significantly with time, and the main fracture always maintains higher water saturation. Water saturation in areas more than 10 m away from the main fracture is close to the initial water saturation, indicating that water is difficult to transfer to areas more than 10 m away from the main fracture. The variation of water saturation in the near-fracture area is obvious, and there is an obvious difference in the water saturation at different distances in the near-fracture area, indicating that the water transfer at the near-fracture area is obvious.
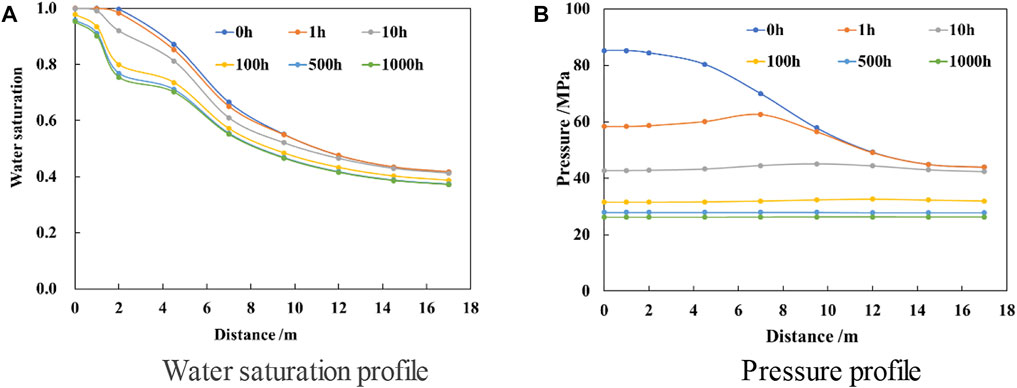
FIGURE 11. Change of water saturation and pressure of the fracture system at different times. (A) Water saturation profile; (B) Pressure profile.
In the same way, the diagram of the fracture system pressure changes at different positions of the main fracture at different time distances is made. It can be observed that at the beginning, the pressure in the main fracture and near fracture area is much higher than that at the far area of the main fracture. In the early stage of shut-in, the pressure wave only propagates in the near fracture area, and the pressure drops rapidly and changes obviously in the near fracture area, while the pressure in the far distance hardly changes. After the shut-in time reaches 10 h, the pressure in the stimulated zone gradually tends to balance and is closer to the initial formation pressure.
Since the time of water injection of the last main fracture was taken as the time of the beginning of the shut-in, the curve corresponding to the pressure difference and the derivative of the pressure difference was made, so as to analyze the fluid movement state of the fracture system in the shut-in period. The derivative of pressure difference amplifies the pressure change and makes the pressure change more characteristic. Therefore, the derivative of pressure difference is used to judge the flow stage of the fluid. When water injection is completed, the pressure of the main fracture is the highest, so it is defined as the shut-in pressure pws. Therefore, the differential pressure can be calculated as follows:
where pw is the wellbore pressure during shut-in periods, MPa; pws is the pressure at the beginning of shut-in, MPa. The calculation formula of the differential pressure derivative is:
where tws is the time at the beginning of shut-in, h; Δt is the difference between the time at the shut-in time and tws, h.
The log–log curve of the pressure difference and the derivative with respect to time is made as shown in Figure 12. Combined with the analysis method of the well test curve, it can be known that the flow stage corresponding to the line with slope m = 1/2 is the linear flow, and the flow stage corresponding to the line with slope m = 1 is the boundary control flow, so as to analyze the figure below.
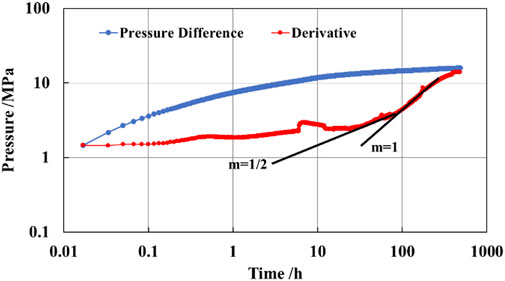
FIGURE 12. Log–log curves of pressure difference and the derivative.
It can be concluded that due to the wellbore storage effect and fracture storage effect, the pressure in the fracture changes greatly, but the water saturation does not change significantly at the beginning of the shut-in. Linear flow starts from 10 h. Water in the fracturing main fracture flows into the stimulated zone through the linear flow, which conforms to the characteristics of the pressure curve for 10 h. At about 100 h, the pressure wave propagates to the boundary of the stimulated zone, and the initial flow state is the boundary control flow.
According to the previous analysis, it can be seen that in the process of shut-in, the impact of lamellation-fractures during shut-in is significantly greater than that of the matrix system, and the change of the matrix system in the process of the shut-in period is small and can be ignored. A single variable method is used to analyze the oil–water displacement and pressure change of the shale oil reservoir by changing the density and permeability of the lamellation-fracture system during the oil–water exchange.
The permeability of the stimulated zone in the lamellatioas shown in the figure. By comparing the characteristicsn-fracture system was set as 1mD, 0.1mD, and 0.01 mD, respectively, and the change of water saturation was observed after 10 days of shut-in. Water saturation of the lamellation-fracture system after 10 days of shut-in in different permeability zones is shown in Figure 13. After 10 days of shut-in, the water saturation of the main fracture with a permeability of 0.01 mD in the stimulated zone remained high, and the water saturation of the surrounding stimulated zone did not change. The water saturation of the main fracture with a permeability of 1 in the stimulated zone is close to the initial water saturation of 0.36, and the surrounding stimulated zone also decreases deeply.
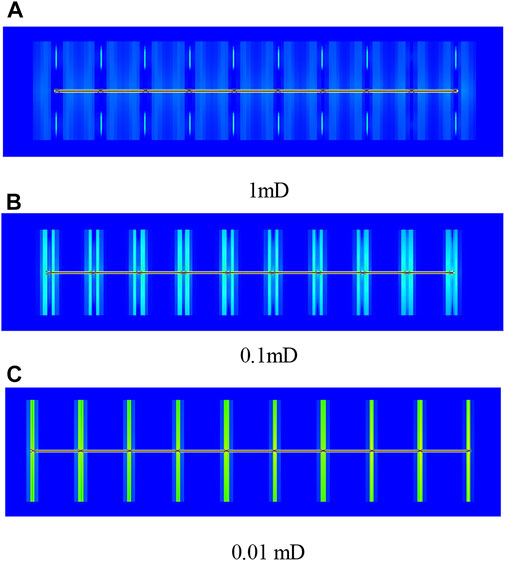
FIGURE 13. Water saturation of the lamellation-fracture system after 10 days of shut-in in different permeability zones. (A) 1mD (B) 0.1mD (C) 0.01mD.
The position at different distances from the last main fracture was selected to make curves of water saturation at different times, as shown in Figure 14. By comparing the characteristics of permeability curves and water saturation field in different stimulated zones, it can be found that the smaller the permeability in the stimulated zone is, the smaller the difference of the water saturation in the area far from the main fracture. Taking the permeability of 0.01 mD in the stimulated zone as an example, the water saturation in the area beyond the transverse distance of 10 m from the main fracture hardly changes, indicating that there is no oil–water exchange in these areas from the beginning to the end in the process of shut-in. The fracturing fluid cannot be spread beyond the 10 m transverse distance of the main fracture. The greater the permeability in the stimulated zone, the greater the change of water saturation in the near-fracture area, which will occur in a short time, indicating that there is a lot of oil–water exchanges in the near-fracture area, and a large amount of the fracturing fluid enters the near-fracture area from the main fracture.
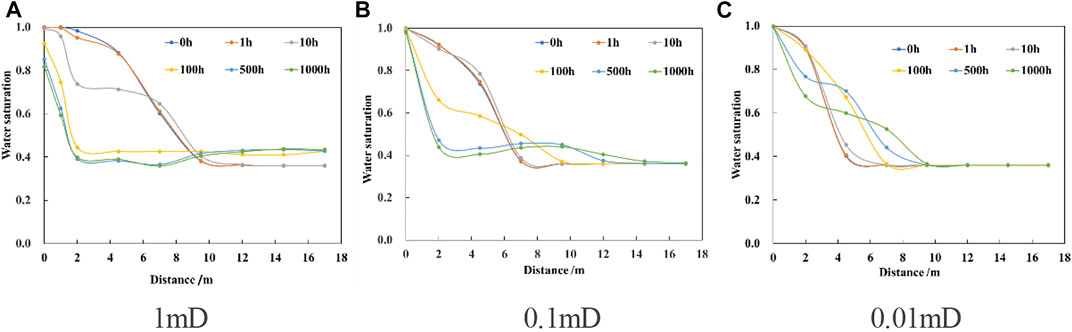
FIGURE 14. Water saturation of the main fracture at different transverse distances in different permeability zones. After 10 days of drilling, the pressure of the splicing system is shown below. (A) 1 mD (B) 0.1 mD (C) 0.01 mD.
Pressure of the lamellation-fracture system after 10 days of shut-in in different permeability zones is shown in Figure 15. With the increase of shut-in time, the pressure in the stimulated zone gradually tends to be balanced and evenly distributed in the laminated fracture system with a permeability of 1 mD in the stimulated zone, while the main fracture system with a permeability of 0.01 mD in the stimulated zone still maintains great pressure, and the pressure in the surrounding stimulated zone remains unchanged. Select positions at different distances from the last main seam to make curves of pressure at different times, as shown in Figure 16.
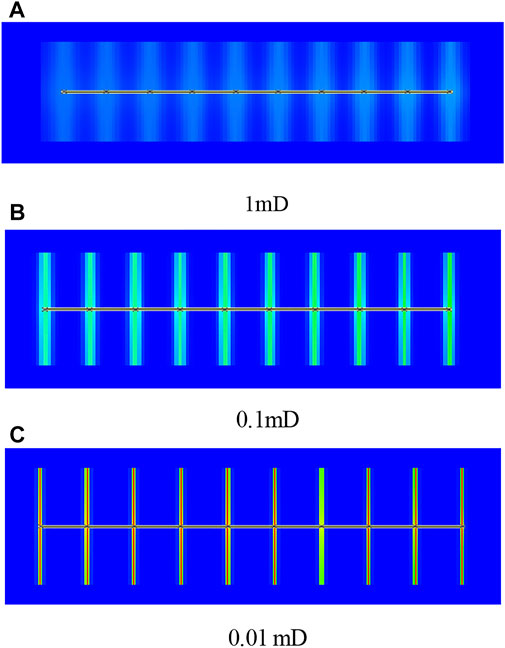
FIGURE 15. Pressure of the lamellation-fracture system after 10 days of shut-in in different permeability zones. (A) 1mD (B) 0.1mD (C) 0.01mD.
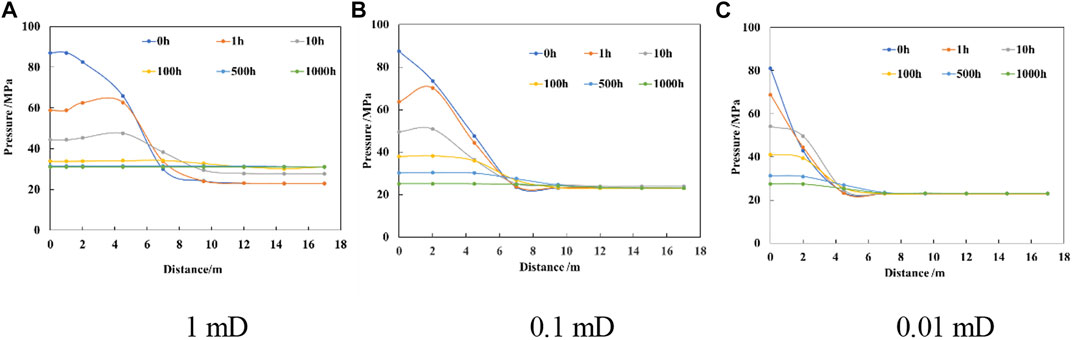
FIGURE 16. Pressure of the main fracture at different transverse distances in different permeability zones. (A) 1 mD, (B) 0.1 mD, and (C) 0.01 mD.
The log–log curve of pressure difference and the derivative in different permeability zones is shown in Figure 17. By comparing the characteristics of the permeability curves and pressure field diagrams of different stimulated zones, it can be found that the smaller the stimulated zone permeability is, the greater the initial pressure in the near-fracture area is, and the greater the change of the near-fracture pressure in a short period of time is. The smaller the permeability in the stimulated zone is, the smaller the pressure change area is, and the further away from the main fracture, the less obvious the pressure change area. Taking the permeability in the stimulated zone of 0.01 mD as an example, when the transverse distance of the main fracture is greater than 7 m, the pressure will not change in the process of shut-in, that is, the pressure wave cannot be transmitted to the area beyond 7 m. The pressure difference of the last main fracture in different permeability zones and the logarithmic curve of the pressure difference derivative and time are made as shown in the figure below.
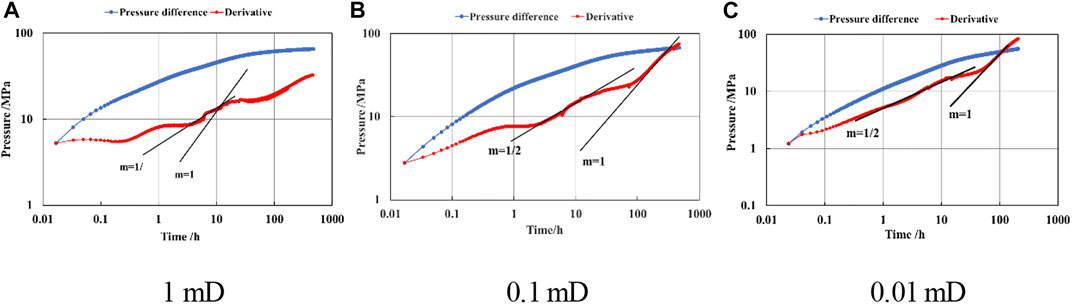
FIGURE 17. Log–log curve of pressure difference and the derivative in different permeability zones. (A) 1 mD, (B) 0.1 mD, and (C) 0.01 mD.
By comparing the characteristics of the permeability curves and pressure field maps of different stimulated zones, it can be found that the time of linear flow is shorter and later with the increase of permeability in the stimulated zone (the time of current flow is 10 h when the permeability is 1mD, 70 h when the permeability is 0.1mD, and 100 h when the permeability is 0.01mD). The greater the permeability, the earlier the pressure wave propagates to the boundary and the earlier the boundary control flow occurs.
The densities of the lamellation-fracture were set at 500 m, 1,500 m, and 3,000 m, respectively, and the water saturation changes were observed after 10 days of shut-in at this permeability. In different cases of lamellation-fracture density, water saturation changes in the lamellation-fracture system during shut-in after 10 days is shown in Figure 18. At this time, the lamellation-fracture density for 500 m is much higher than the other two groups, and the stimulated zone around the change of water saturation is smaller than that of the other two groups. It suggests that greater the lamellation-fracture density, the more easily for the water change from the main stitched into the area.
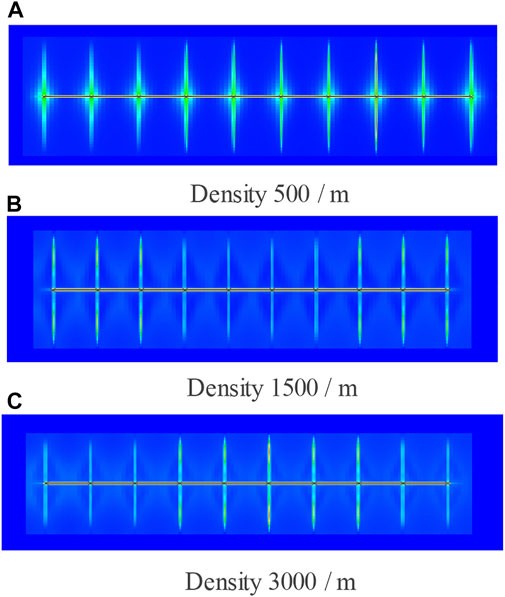
FIGURE 18. Water saturation of the lamellation-fracture system after 10 days of shut-in in different fracture densities. (A) Density 500/m (B) Density 1500/m (C) Density 3000/m.
The position at different distances from the last main fracture was selected to make the curves of water saturation at different times, as shown in Figure 19. By comparing the characteristics of the curves and water saturation diagrams of different lamellation-fracture densities, it can be found that: the larger the lamellation-fracture density is, the faster and more obvious the water saturation of the main fracture decreases, and the water saturation of the stimulated area farther away from the main fracture increases more obviously. The larger the density of the lamellation-fracture is, the faster the water flows out of the main fractures into the stimulated zone, and the wider the sweep speed and the sweep range of water are. However, when the cleavage density is large enough, the difference of water saturation under different lamellation-fracture densities is small.
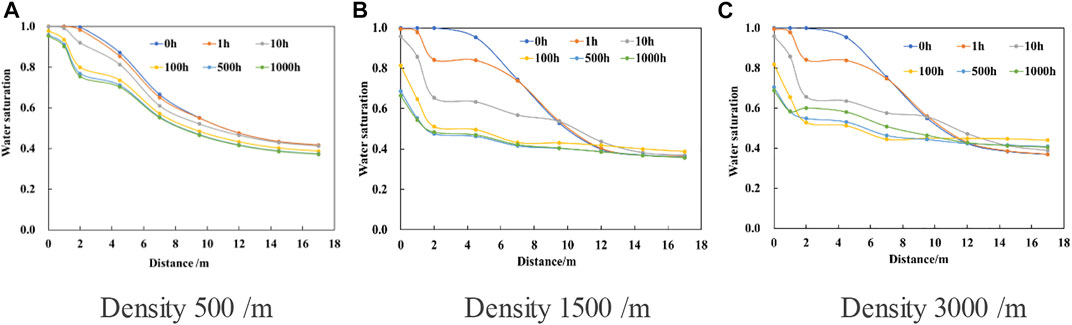
FIGURE 19. Water saturation of the main fracture at different transverse distances in different lamellation-fracture densities. The pressure changes of fracture systems with different splicing densities after 10 days of shut-in are shown as follows: (A) Density 500 m; (B) Density 1,500 m; and (C) Density 3,000 m.
The pressure of the lamellation-fracture system after 10 days of shut-in in different lamellation-fracture densities is shown in Figure 20. On the 10 days, the pressure fields of different lamellation-fracture densities almost reached equilibrium state, but when the lamellation-fracture density was 500 m, the pressure fields of the 10 days were significantly higher than the other two groups. The pressure variation curves of the lamellation-fracture system at different positions and densities from the main fracture at different times is shown in Figure 21.
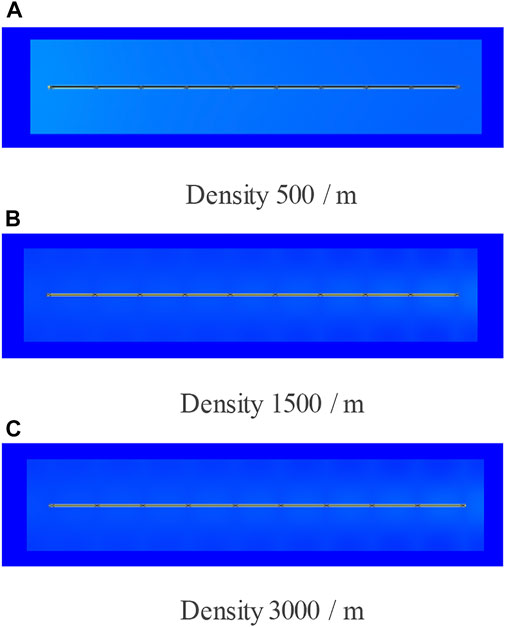
FIGURE 20. Pressure of the lamellation-fracture system after 10 days of shut-in in different lamellation-fracture densities. (A) Density 500/m (B) Density 1500/m (C) Density 3000/m.
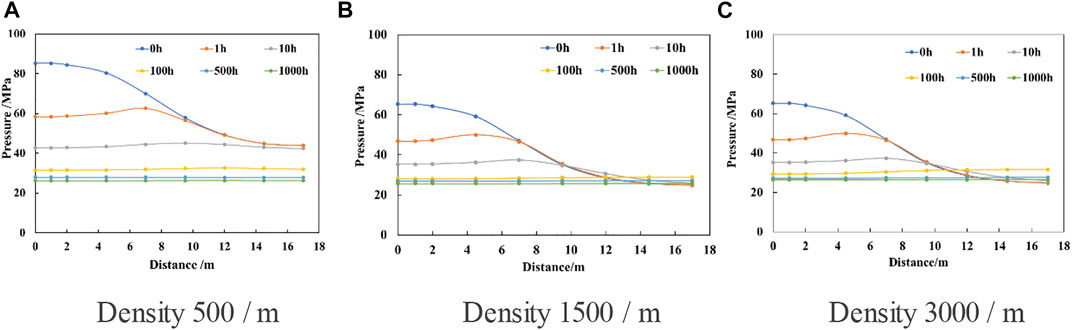
FIGURE 21. Pressure of the main fracture at different transverse distances in different lamellation-fracture densities. (A) Density 500 m; (B) Density 1,500 m; and (C) Density 3,000 m.
From the aforementioned, we can see clearly that the lamellation-fracture density for 500 m, the pressure wave is difficult to spread to far from the main fracture zone, the distance from the main fracture that further transforms the early pressure change is very small, until the pressure drop to the transformation area close to the state of the transformation of pressure to have the obvious drop. However, when the densities of the lamellation-fractures were 1,500 m and 3,000 m, the pressure in the stimulated zone further away from the main fracture was higher at 100 h than at the beginning of shut-in. It was obvious that the pressure wave propagated to the area far away from the main fracture and increased the pressure in these areas. Similar to the analysis of water saturation, when the lamellation-fracture density reaches a large value, the difference of down pressure of different lamellation-fracture densities is small.
The characterization of the fracture network and the mechanism of shut-in in shale oil reservoirs were studied in a shale oil reservoir. Based on the numerical simulation of the Gulong shale reservoir, a dual-porosity numerical simulation model was established with the characteristics of the Gulong shale reservoir. The main conclusions of this article are as follows:
(1) The pressure and water saturations of the matrix system are basically unchanged in the process of shut-in, and their changes are negligible when compared with those of the lamellation-fracture system, indicating that the shale matrix system does not participate in the oil–water exchange in the process of shut-in.
(2) In the early stage of shut-in, the pressure wave only propagates in the near main fracture area, and the pressure drops rapidly and changes obviously. With the increase of time, the pressure drops fast in the stimulated zone. Eventually, the pressure in the stimulated zone tends to be evenly distributed. The water saturation of the region far from the main fracture is close to the initial water saturation, indicating that water is difficult to transfer to the region far from the main fracture.
(3) Due to the wellbore storage effect and fracture storage effect, the pressure in the fracture changes greatly, but the water saturation does not change significantly at the beginning of the shut-in period. The well test analysis of pressure difference and the derivative curve shows that the linear flow occurs after the reservoir effect ends, and when the pressure wave propagates to the boundary of the stimulated zone, the flow state is boundary-controlled flow.
(4) The smaller the permeability of the lamellation-fracture system is, that is, the smaller the permeability of the stimulated zone is, the greater the pressure change in the near-fracture area is in a short period of time, and the smaller the pressure change area is. The smaller the permeability is, the earlier the linear flow occurs, and the later the pressure wave propagates to the boundary.
(5) The larger the lamellation-fracture density is, the faster and more obvious the water saturation of the main fracture decreases, and the water saturation of the stimulated zone farther away from the main fracture increases more obviously, and the faster the water flows out of the main fracture into the stimulated zone. The smaller the lamellation-fracture density is, the more difficult the pressure wave is to transmit to the region farther from the main fracture. When the lamellation-fracture density reaches a large value, the difference of pressure and water saturation under different lamellation-fracture densities is small.
The original contributions presented in the study are included in the article/supplementary material; further inquiries can be directed to the corresponding author.
The contribution of PJ is the idea of the whole manuscript, that of XK is the numerical simulation, that of YL is the characteristics of the fracture network and mechanism of imbibition in shale, that of CP is the results analysis, and that of LC is written.
We acknowledge that this study was partially supported by the National Natural Science Foundation of China (No. 52004307) and Science Foundation of China University of Petroleum, Beijing (No. 2462018YJRC015). We would further like to thank financial support of the Science and technology project of CNPC- major project (No. ZLZX 2020-02-04).
The authors declare that the research was conducted in the absence of any commercial or financial relationships that could be construed as a potential conflict of interest.
All claims expressed in this article are solely those of the authors and do not necessarily represent those of their affiliated organizations, or those of the publisher, the editors, and the reviewers. Any product that may be evaluated in this article, or claim that may be made by its manufacturer, is not guaranteed or endorsed by the publisher.
Basbug, B., Sarak, H., Firincio, T., Ozgen, C, Machado, C. P, Yuan, C, et al. (2022). “Gas injection pilot design simulation model in EaGulonge Ford”. in Paper SPE-209406-MS presented at the SPE Improved Oil Recovery Conference, April 25–April 29, 2022. doi:10.2118/209406-MS
Bustin, A. M., Bustin, R. M., Downey, R., and Venepalli, k (2022). “Laboratory analyses and compositional simulation of the EaGulonge Ford and wolfcamp shales: A novel shale oil eor process”. in Paper SPE-209348-MS presented at the SPE Improved Oil Recovery Conference, April 25–April 29, 2022. doi:10.2118/209348-MS
Cai, J. (2021). Key Problems and Thoughts on spontaneous imbibition of porous media [J]. Comput. Phys. 38 (05), 505. doi:10.19596/j.cnki.1001-246x.8440
Cheng, Y. (2010). Impact of water dynamics in fractures on the performance of hydraulically fractured wells in gas-shale reservoirs[J]. J. Canadian Petroleum Tech. 51 (02), 143–151. doi:10.2118/127863-PA
Guerra, D., Arceneaux, D., Zhu, D., and Hill, A. D (2022). “Relative Permeability Behavior of Oil-Water Systems in Wolfcamp and Eagle Ford Fractures”. in Paper SPE-205295-MS presented at the SPE International Hydraulic Fracturing Technology Conference and Exhibition, January 11–13, 2022. doi:10.2118/205295-MS
Hu, S., Zhao, W., Hou, L., Yang, Z., Zhu, R., Wu, S., et al. (2020). Development potential and technical countermeasures of continental shale oil in China. Petroleum Explor. Dev. 47 (04), 819. doi:10.11698/PED.2020.04.19
Huang, H. (2016). Influence of fracture network structure on fracturing fluid flowback in shale reservoir. China University of Petroleum. (Beijing)
Huang, Z. (2019). Research on retention and Flowback law of fracturing fluid in artificial fracture Network. Beijing: China University of Petroleum.
James, R. G. (1982). Improvements simulation of naturally fractured reservoirs. Soc. Petroleum Eng. J. 23 (4), 695
Jin, C., Dong, W., and Bai, Y. (2020). Petrographic characteristics and genesis of Gulong shale in songliao basin. Petroleum Geol. Dev. Daqing 39 (03), 35. doi:10.19597/J.ISSN.1000-3754.202005016
Jing, D., Ding, F., and Yuan, J. (2012). Status quo, experience and enlightenment of tight oil exploration and development in the United States. Land Resour. Inf. 2012 (01), 18. doi:10.3969/j.issn.1674-3709.2012.01.005
Le, D. H., Hoang, H. N., and Mahadevan, J. (2009). “Impact of capillary suction on fracture face skin evolution in waterblocked wells,” in Paper SPE-119585-MS presented at the SPE Hydraulic Fracturing Technology Conference, The Woodlands, Texas, January 2009. doi:10.2118/119585-MS
Li, J., Liu, R., and Peng, X. (2013). Study on fractal dimension of Shale phase permeability curve based on Mercury Injection curve. Sci. Technol. Eng. 13 (08), 2193. doi:10.3969/j.issn.1671-1815.2013.08.036
Li, S., Weidong, ., and Zhang, H. (2007). Experimental study on spontaneous imbibition flooding in low permeability reservoir. Acta Pet. Sin. (02), 109
Li, Y., He, T., and Hu, Z. (2021). Enhanced oil recovery technology and prospects for shale reservoirs. J. Southwest Petroleum Univ. Nat. Sci. Ed. 43 (03), 101. doi:10.11885/j.issn.1674-5086.2020.04.07.01
Li, Y., and Zhang, J. (2011). Types and potential of Unconventional hydrocarbon resources in China. Int. Pet. Econ. 19 (03), 61. doi:10.3969/j.issn.1004-7298.2011.03.011
Li, Z., Ou, Y., and Liu, J. (2019). Application of Capillary Pressure and phase permeability curve in prediction of oil and water distributio. Complex Reserv. 12 (01), 33
Liang, J., Zhang, L., and Han, B. (2020). Lithology identification and fluid evaluation technology of Gulong shale oil reservoir in Songliao Basin. Petroleum Geol. Dev. Daqing 39 (03), 163. doi:10.19597/J.ISSN.1000-3754.202004052
Liu, D. (2017). Micro imbibition of fracturing fluid and stimulation mechanism of "dull well. Beijing: China University of Petroleum
Liu, G., Dong, Y., and Mei, X. (2020). Control and drainage method of muffled well after large-scale fracturing in Gulong shale oil, Songliao Basin. Petroleum Geol. Dev. Daqing 39 (03), 147. doi:10.19597/J.ISSN.1000-3754.202004062
Liu, N. (2015). Flowback law of shale gas well after pressure. Nat. Gas. Ind. 15 (07), 18. doi:10.3787/j.issn.1000-0976.2015.03.007
Ma, L., Zhang, C., and Liu, D. (2018). Study on the adaptability of borehole drilling after fracturing in Fuling shale gas field. Spec. Reserv. 26 (01), 147. doi:10.3969/j.issn.1006-6535.2019.01.026
Mulhim, A. K. A., Miskimins, J. L., and Tura, A. (2022). Hydraulic fracture treatment and landing zone interval optimization: An Eagle Ford case study. January 12, 2022. doi:10.2118/205257-MS
Schubarth, S., Gates, B., and Spies, B. (2022). “Reservoir and completion characterization leads to improved well and field economics in south Texas eagle ford field,” in Paper SPE-209182-MS presented at the SPE Hydraulic Fracturing Technology Conference and Exhibition, The Woodlands, Texas, February 2022. doi:10.2118/209182-MS
Shang, S. (2017). Research on shut-in and blowout system after energy storage fracturing in tight oil. Beijing: China University of Petroleum
Tian, W., Deng, R., and Zhu, W. (2017). Reservoir stress sensitivity and its influence on productivity of shale pressure fracture network. Reservoir Evaluation and development, 71
Tong, Z., Zhang, S., and Zou, Y. (2016). Hydraulic fracturing fracture morphology of shale reservoir with strong stress and large dip Angle in northeast margin of Sichuan Basin [J]. Xinjiang Pet. Geol. 37 (03), 336. doi:10.7657/XJPG20160318
Wang, F., Fu, Z., and Wang, J. (2021). Characteristics and classification evaluation of Gulong shale oil reservoir in Songliao Basin. Petroleum Geol. Dev. Daqing 40 (05), 144. doi:10.19597/J.ISSN.1000
Wang, J., Yuzhang, C., and Maoqian, Y (2009). Experimental study on dynamic imbibition mechanism of fractures in low permeability reservoirs. Petroleum Explor. Dev. 36 (01), 86. doi:10.3321/j.issn:1000-0747.2009.01.011
Wang, M., Shi, L., and Wang, W. (2014). Comparison of geochemical characteristics of shale oil and tight oil development in China and America. Lithol. Reserv. 26 (03), 67
Wang, Y., Liang, J., and Zhang, J. (2020). Oil resource potential and exploration direction of Gulong shale in Songliao Basin. Petroleum Geol. Dev. Daqing 39 (03), 20. doi:10.19597/J.ISSN.1000-3754.202005032
Wu, K., Xiong, W., Hu, Z., and Gao, S. (2018). Experimental study on the effect of different water saturation on shale seepage capacity. Laboratory Res. Explor. 37 (07), 32. doi:10.3969/j.issn.1006-7167.2018.07.008
Xue, R., Guo, J., and Zhao, Z. (2019). Numerical simulation of fracture propagation in horizontal Wells of Shale reservoirs in Jiyang depression. J. Southwest Petroleum Univ. Sci. Technol. Ed. 41 (02), 84. doi:10.11885/j.issn.1674-5086.2018.05.21.01
Yang, F., Luo, Z., and Hu, Z. (2016). Experimental study on imbibition characteristics of shale reservoir [J]. Sci. Technol. Eng. 16 (25), 63. doi:10.3969/j.issn.1671-1815.2016.25.010
Yang, L. (2020). Research on soaking technology of horizontal well after fracturing. Liaoning Chem. Ind. 49 (07), 794. doi:10.14029/j.cnki.issn1004-0935.2020.07.014
Yao, L. (2021). Study on characteristic evaluation of microscopic pore structure and seepage mechanism of shale oil reservoir. University of Chinese Academy of Sciences (Institute of Seepage Fluid Mechanics, Chinese Academy of Sciences.
Yuan, .F, Zhang, W., and Ma, F. (2019). Distribution and development status of global shale oil resources. Mineral Prot. Util. 39 (05), 126. doi:10.13779/j.cnki.issn1001-0076.2019.05.013
Zhang, K. (2012). The profound implications of American energy independence and the shale gas revolution. Chin. Foreign Energy 17 (12), 1.
Zhang, S., Li, S., Zou, Y., Li, J., Ma, X., Zhang, X., et al. (2021). Experiment on height propagation of multi-stage fracture in shale oil horizontal well. J. China Univ. Petroleum Nat. Sci. Ed. 45 (01), 77. doi:10.3969/j.issn.1673-5005.2021.01.009
Zhang, T., Li, X., and Yang, L. (2017). Influence of shut-in timing on flowback rate and productivity of shale gas Wells. Nat. Gas. Ind. 37 (08), 48. doi:10.3787/j.issn.1000-0976.2017.08.006
Zhang, X., Guo, H., and Li, H. (2018). Experimental study on imbibition flooding of tight oil reservoir based on NMR. Rep. Sci. Technol. 34 (08), 35
Zhang, Y. (2015). The impact of global oil and gas Pattern changes on China's energy security. Brand (03), 18. doi:10.16083/j.cnki.1671-1580.2015.06.062
Zhao, G., Wang, Q., and Liu, Y. (2021). Dynamic simulation and prediction of Gulong shale oil artificial reservoir in Songliao Basin. Petroleum Geol. Dev. Daqing 40 (05), 170. doi:10.19597/J.ISSN.1000
Zhou, Q., and Yang, G. (2012). Concept and application of tight oil and shale oil. Oil Gas Geol. 33 (04), 75
Zou, C., Yang, Z., Cui, J., Zhu, R., Hou, L., Tao, S., et al. (2013). Formation mechanism, geological characteristics and development strategy of shale oil. Petroleum Explor. Dev. 40 (01), 14
Keywords: shale oil reservoir, numerical simulation, shut-in, oil-water mass transfer, dynamic response
Citation: Jia P, Ke X, Li Y, Peng C and Cheng L (2022) Dynamic response characteristics of oil and water distribution during the shut-in period after hydraulic fracturing in shale oil reservoirs. Front. Earth Sci. 10:996087. doi: 10.3389/feart.2022.996087
Received: 17 July 2022; Accepted: 08 August 2022;
Published: 12 September 2022.
Edited by:
Zheng Sun, China University of Mining and Technology, ChinaReviewed by:
Qingbang Meng, China University of Geosciences Wuhan, ChinaCopyright © 2022 Jia, Ke, Li, Peng and Cheng. This is an open-access article distributed under the terms of the Creative Commons Attribution License (CC BY). The use, distribution or reproduction in other forums is permitted, provided the original author(s) and the copyright owner(s) are credited and that the original publication in this journal is cited, in accordance with accepted academic practice. No use, distribution or reproduction is permitted which does not comply with these terms.
*Correspondence: Pin Jia, amlhcGluMTk5MEAxNjMuY29t
Disclaimer: All claims expressed in this article are solely those of the authors and do not necessarily represent those of their affiliated organizations, or those of the publisher, the editors and the reviewers. Any product that may be evaluated in this article or claim that may be made by its manufacturer is not guaranteed or endorsed by the publisher.
Research integrity at Frontiers
Learn more about the work of our research integrity team to safeguard the quality of each article we publish.