- National Center for Atmospheric Research, Boulder, CO, United States
The installation of the Alamosa gap-filling radar in 2019 not only greatly improved surveillance of current precipitation in the mountain-ringed San Luis valley, but also improved estimates of rain and snow accumulation. This is particularly important for hydrological prediction in this headwaters region, as it provides vital information for potential downstream floods and reservoir storage. This study performs three experiments using the community WRF-Hydro modeling system (the core model of the National Water Model) during 2021 to estimate the effect of the new Alamosa gap-filling radar, as integrated into the National Severe Storms Laboratory Multi-radar Multi-sensor quantitative precipitation estimate product on model-predicted streamflow. The first model experiment utilizes the Multi-Radar Multi-Sensor data, including from the new Alamosa radar; the second utilizes a spatially-downscaled version of the NLDAS-2 precipitation field, mapped to a high resolution WRF-Hydro model grid; while the third experiment uses a combination of the two, with MRMS used in areas observed by the Alamosa radar. Emphasis is placed on analyzing the impact of the radar quantitative precipitation estimate on total seasonal runoff in the Conejos River basin and overall runoff throughout the Upper Rio Grande River basin in southern Colorado.
1 Introduction
Accurate precipitation is the most important factor in predicting streamflow (Wagner et al., 2012; Strauch et al., 2012; Monteiro et al., 2016; Tuo et al., 2016; Laiti, et al., 2018; Duan et al., 2019). There are various sources of precipitation, each with their own strengths and weaknesses. Precipitation gauges provide the most accurate estimates at specific locations, but lack the ability to provide the spatial detail necessary for most hydrological applications (e.g., Kidd et al., 2017; He et al., 2018). Satellites are less accurate than other sources, but are still useful in areas without any other observational sources (e.g., Joyce et al., 2004; Hou et al., 2010). Operational radars provide great spatial (∼1 km) and temporal (∼5 min) resolution (Zhang et al., 2016), but are unable to provide precise rates due to various factors, including radar beam height above ground level (Junyent and Chandrasekar 2009), weather regime, and their widely varying Z-R relationships (Ignaccolo and De Michele 2020), even with the recent inclusion of polarimetric capabilities (Bringi and Chandrasekar 2001.) Radar estimates of precipitation rate are also highly limited by terrain blockage, especially of the lowest scan angles. This has long been the case for the mountain-ringed San Luis Valley of Colorado, bordered by the Sangre de Cristo Mountains toward the north to southeast, the San Luis Hills to the south, the San Juans toward the southwest to northwest, and the Sawatch to the north-northwest (Figure 1.) From 2013–2018, the Conejos Water Conservancy District rented a Doppler radar that operated intermittently to observe precipitation across the San Luis Valley and the surrounding mountains (Reppenhagen 2020). These radar data provided much needed and more accurate estimates of precipitation, and subsequently streamflow, so that they were able to eventually obtain a permanent radar of their own, which became operational in September 2019.
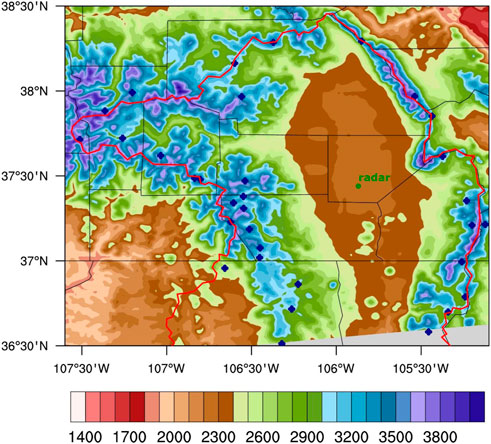
FIGURE 1. Topography within the water model domain, centered over the San Luis valley covered by the Alamosa radar, along with locations of radar and streamflow stations. (The unshaded gray area in the lower right-hand corner of this and other plots are outside of the water model domain.).
In this study, we applied the community Weather Research and Forecasting Hydrological (WRF-Hydro)-based National Water Model (NWM; Gochis et al., 2020) over the seasonal Colorado Ensemble Streamflow Prediction (ESP) domain to investigate the impact of the Alamosa radar data on streamflow simulations in the NWM during calendar year 2021. We ran a series of three NWM simulations using precipitation data coming from 1) the North American Land Data Assimilation System (NLDAS-2, hereafter referred to as NLDAS; Xia et al., 2012a; Xia et al., 2012b), which provides particularly valuable precipitation coverage in regions unobserved by radar; 2) the primarily-radar-derived Multi-Radar Multi-Sensor (MRMS) system from the National Severe Storms Lab (NSSL; Gerard et al., 2021; Martinaitis et al., 2021; Zhang et al., 2020), which includes data from the Alamosa gap-filling radar; and 3) a combination of the NLDAS and MRMS, based on the observational coverage of the Alamosa radar.
Section 2 describes the precipitation forcing data sets in more detail. Next, section 3 describes the experimental setup, streamflow simulations, and impact studies of the Alamosa radar data. Finally, section 4 summarizes the conclusions of this study.
2 Precipitation forcing data sets
2.1 SNOTEL
The Snow Telemetry (SNOTEL) network of stations has been providing meteorological measurements at high elevation sites across the western United States since 1977 (Serreze et al., 1999). The network has since been greatly expanded to over 900 stations, with measurements including snow water equivalent (SWE), precipitation accumulation, and temperature at hourly and daily intervals. These stations are typically sited in montane forest environments below treeline, usually within a small clearing, so that precipitation measurements are as representative as possible of the wider area, to minimize typical snowfall errors such as undercatchment and wind-blown accumulation. They’re also generally located in watersheds where access is difficult. For this study, SNOTEL data are used as the reference data set for comparison against the other forcing data sets. SNOTEL data have their own biases and errors (e.g., Meyer et al., 2012; Oyler et al., 2015), but for the sake of this study, it is assumed to be smaller than from the forcing precipitation data sets.
2.2 NLDAS
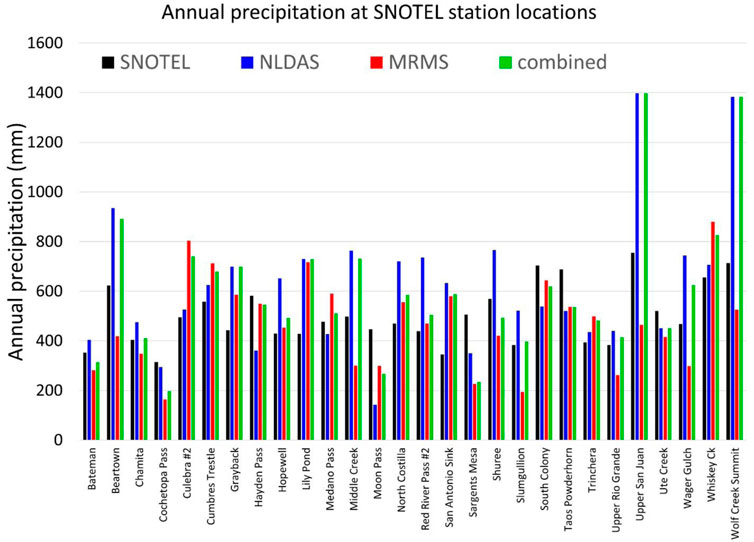
The NLDAS provides a suite of products for use in hydrological simulations. It covers the contiguous United States (CONUS) from 1979 to the present. We used the .125° x .125° hourly phase 2 NLDAS, down-scaled to the 1 km grid of the Colorado ESP domain. Terrain adjustment of temperature based on the spatially varying lapse rate that was constructed from the operational Rapid Refresh (RAP) assimilation and modelling system output was applied. Also, terrain adjustment of precipitation based on the Mountain Mapper technique (Daly et al., 1994; Zhang et al., 2011) was applied. Additionally, the down-scaled temperature field was bias corrected using the bias distributions with terrain height constructed from SNOTEL temperature observations. Figure 2 shows the 2021 annual precipitation from both NLDAS and SNOTEL over the upper Rio Grande basin in southern Colorado and far northern New Mexico. NLDAS had higher precipitation totals for 20 of the 28 SNOTEL station locations (Figure 3.) The disparity was particularly large over the San Juan (west side of domain) and Sangre de Cristo (southeast side of domain) Mountains (Figure 2.) Previous studies (e.g., Bardsley and Julander, 2005; Rasmussen et al., 2012) have found that SNOTEL generally undercatches precipitation, particularly snowfall, which may at least partially account for the higher NLDAS totals.
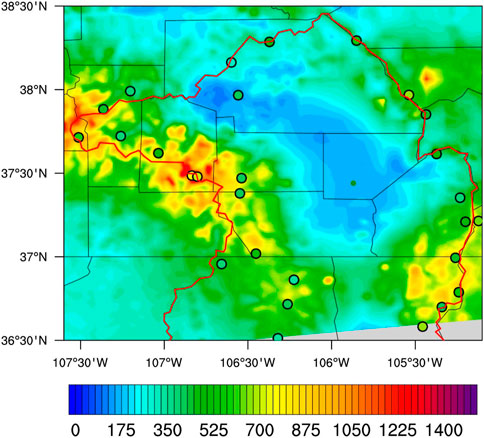
FIGURE 2. NLDAS 2021 precipitation totals (mm), overlaid with SNOTEL 2021 precipitation totals (filled circles). The boundary of the upper Rio Grande basin is outlined in red.
2.3 MRMS
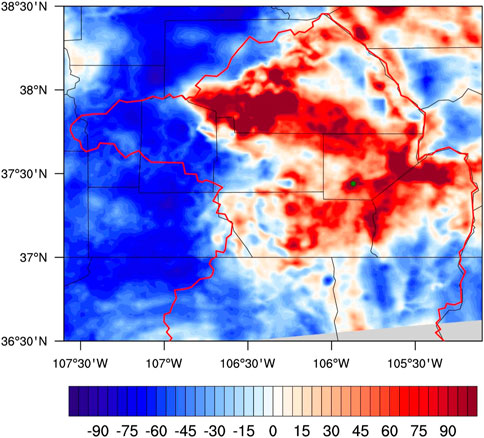
The MRMS system integrates precipitation observed by ∼180 operational weather radars over CONUS and southern Canada into a seamless national three-dimensional mosaic with 1 km horizontal grid spacing and 2-min temporal resolution (Zhang et al., 2016; Smith et al., 2016.) The radar data are integrated with other atmospheric data, including those from satellite, lightning, and rain gauge observations to generate a suite of precipitation products, including the precipitation accumulation used in this study. This integration of data from multiple sources provides more accurate diagnoses of physical processes in the atmosphere than using radar data alone. Of particular interest to this study is the fact that MRMS incorporates precipitation data from the Alamosa gap-filling radar, which became operational in September 2019, providing critical precipitation surveillance to the mountain-encircled San Luis valley. It operates in the C band (5.35 cm wavelength), has a range of 230 km, a base sweep angle of .5, a beam width of 1.65, is located at 37.443°N, 105.867°W at an elevation of 2,219 m, 75 m above ground level (Michael Carson, personal communication.) Figure 4 provides the 2021 MRMS annual total precipitation, compared with the same SNOTEL totals shown in Figure 2. MRMS has higher precipitation totals than NLDAS primarily at locations closer to the radar (Figure 5), while it generally has lesser values further away at the distances of the SNOTEL stations. Compared to SNOTEL stations, a slight majority (17/28) of precipitation totals were lower (Figure 3.)
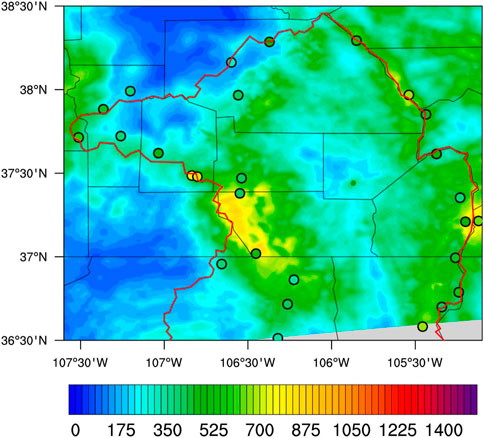
FIGURE 4. Same as Figure 2, except MRMS 2021 precipitation totals are shaded.
2.4 Combined product
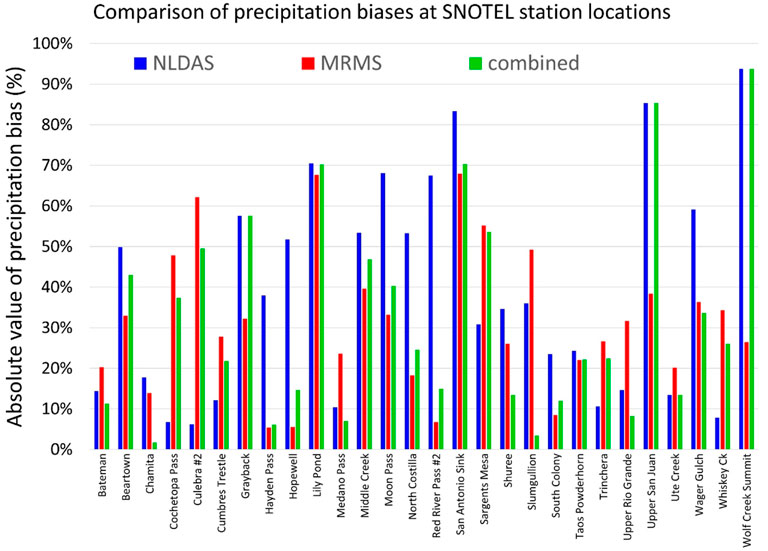
To create a combined product that benefits from the strengths of both data sets, we first calculated the bias of the NLDAS product vs SNOTEL, and the MRMS product vs SNOTEL. Then, we took the difference between the absolute value of their biases to determine which product was more accurate (Figure 6.) This revealed that MRMS was generally more accurate at locations closer to the radar (blue hued dots on Figure 6), while NLDAS was more accurate further away (red hued dots.) Next, we calculated the radar beam propagation relative to ground level within the base scan beam width (-0.325- 1.325) The distances at which these various radar angles intersected the ground are drawn in assorted colors on Figure 6 out to the 230 km radar maximum range. Since the beam width is defined as “the angle within which the intensity is not less than one-half the intensity on the beam axis” (American Meteorological Society 2012), the majority of the received power is within a narrower range of angles; therefore, we chose to use a narrower range of angles of .0° and 1.0° as the limits to an algorithm for interpolating between the NLDAS product (beyond the radar visibility at 1.0°, dark blue on Figure 6) and the MRMS product (within the radar visibility at 0°, dark green on Figure 6), and used a bi-linear interpolation in between; this weighting array is shown in Figure 7, ranging from -1 (all MRMS) to +1 (all NLDAS.) The 2021 annual precipitation totals for this combined product are shown in Figure 8, producing overall more accurate precipitation estimates compared to SNOTEL vs NLDAS (22 of 28), and an equal number (14 of 28) vs MRMS (Figure 9).
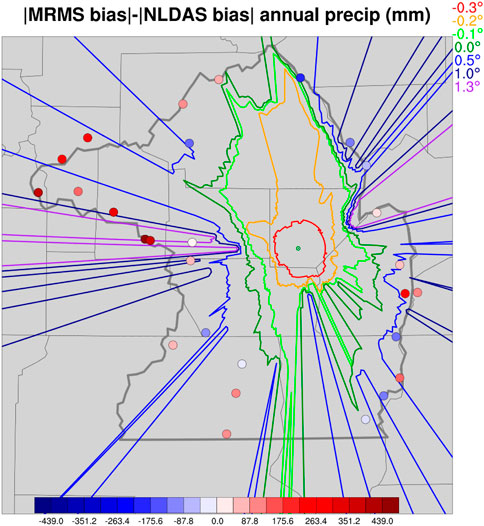
FIGURE 6. Depiction of where a radar beam intersects topography out to 230 km for various scan angles, overlaid with the difference in bias between MRMS and NLDAS. The edge of the upper Rio Grande basin is indicated with a thick gray line.
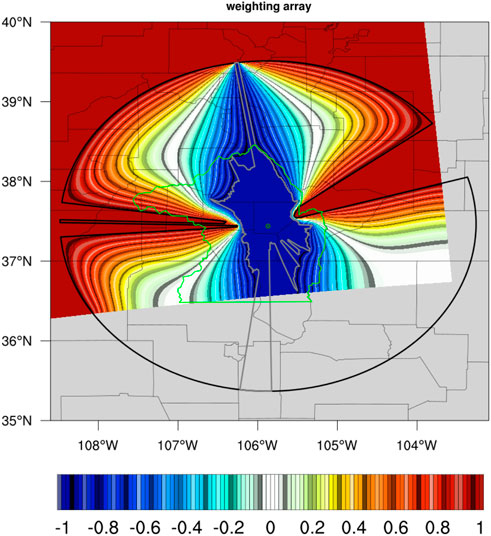
FIGURE 7. Weighting array developed for interpolating between the MRMS precipitation (interior thick gray line for .0° radar angle) to the NLDAS precipitation (exterior thick black line for 1.0° radar angle.) The upper Rio Grande basin is outlined in green, while the Alamosa radar location is indicated by a small green circle.
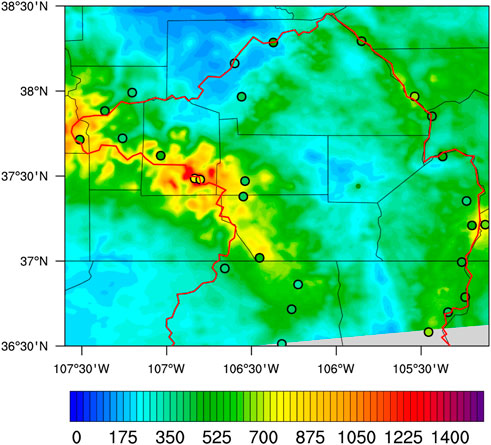
FIGURE 8. Same as Figure 2, except the combined precipitation product is shaded.
3 Streamflow simulations
3.1 Colorado ESP project and domain
The Colorado ESP project started around 2017 to provide seasonal streamflow predictions for selected forecast points that are of significance to the local and state water resources management. The forecast points are primarily from the United State Geological Survey (USGS) and Colorado Division of Water Resources (CDWR) gauge locations and their contributing basins. Initially there were four gauge locations, which were expanded to 102 by water year 2021 and to 116 for water year 2022. Starting from water year 2021, lake inflow seasonal forecasts are also provided for 104 lakes in Colorado.
The Colorado ESP domain is shown in Figure 10. This domain encompasses nearly the entire state of Colorado and also includes the northern part of New Mexico, the southern part of Wyoming and the eastern part of Utah. The 102 forecast points are indicated in Figure 10 as red dots. To improve the snow conditions in the NWM, we also assimilated the snow data collected by the Airborne Snow Observatory (ASO) surveys (https://gis.airbornesnowobservatories.com/) that normally start in February and we launched the ESP runs as soon as the ASO data became available.
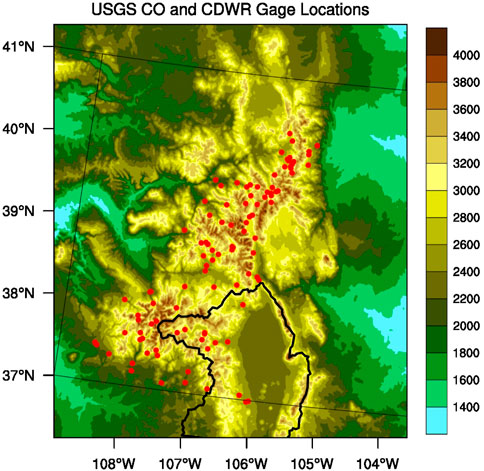
FIGURE 10. Colorado ESP domain terrain height (shading, m), Rio Grande basin boundary (thick black line), and USGS and Colorado Division of Water Resources gauges used as seasonal streamflow forecast points (red dots).
The ensemble ESP runs were constructed as follows. First, the NWM was calibrated for the Colorado ESP domain. Second, the NLDAS-based forcing files for 2000–2021 were prepared. Third, we conducted long-term retrospective runs (the analysis) for 2000–2021 using the calibrated NWM and created the restart files for the subsequent ESP runs. Fourth, we assimilated the ASO data in the restart files if there were ASO data available, whereas if there were no ASO data available, we continued the analysis run with the prior ASO data for the year assimilated to the time of the ESP runs. Fifth, we launched the 21-member (i.e., every year during 2000–2020 as a member) ESP runs warm-started by the restart files. Lastly, the ensemble seasonal streamflow and lake inflow forecast values including mean, median, 10%, 25%, 75%, and 90% quantiles were computed from the run output. For each of the 21 members, everything was the same except for the forcings, which were from each respective water year in the 2000–2020 period. For example, for the first (i.e., year 2000) member, the hourly forcing files for April 1—October 1 were the hourly forcing files for the same time period for 2000.
3.2 Simulations
We ran three sets of hydrological simulations for calendar year 2021, each one differing only by their input precipitation data set: NLDAS, MRMS, and the combined product. (The time period of our simulation and analysis was Jan. 1—Dec. 31, 2021, instead of the 2021 water year (Oct. 2020—Sept. 2021) due to some radar artifacts from the Alamosa radar that were not yet resolved until December 2020.) The simulations were then compared with streamflow from gauge stations operated by the USGS (6 stations) and CDWR (9 stations). Figure 11 shows the annual streamflow for an example CDWR gauge station on the Conejos River near Mogote, Colorado. The modelled streamflow is much lower than observed until late May, but then reaches comparable peak streamflows during the snow melt season in early June, before tapering too quickly during the end of snow melt season; they also remained slightly too high during the rest of the year. Although the timing of the start of the early spring snow melt season is off by ∼20 days, the net annual streamflow remains nearly the same. In addition, the timing of rainfall runoff events during the non-winter season occurs at nearly the same time, indicating that the models respond accurately to upstream rainfall, even if there is a delay in the start of the melt season in this basin. The NLDAS precipitation-forced streamflows, with generally greater upstream annual precipitation than MRMS (Figure 5), has slightly higher streamflows, while the combined precipitation-forced product was in between, as expected.
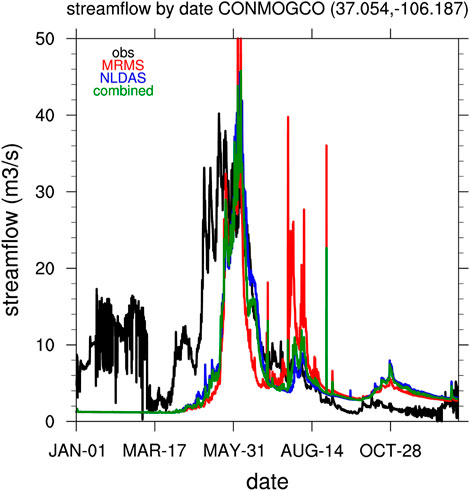
FIGURE 11. Observed and simulated streamflow on the Conejos River near Mogote, Colorado for 2021. Its location is marked on Figure 12.
The NLDAS precipitation-forced streamflow simulations produced high-biased annual streamflows at eleven of the fifteen stations, including biases greater than 50% at seven of those stations (Figure 12.) On the other hand, the MRMS precipitation-forced streamflow simulations produced low-biased annual streamflows at nine of the stations, all but one of which were biased more than 50%. The combined precipitation-forced streamflows were biased high at nine stations, but most of these biases were more modest than NLDAS, with only four exceeding 50%. Therefore, it can be concluded that the combined precipitation product produced modestly-improved overall streamflows at most stations.
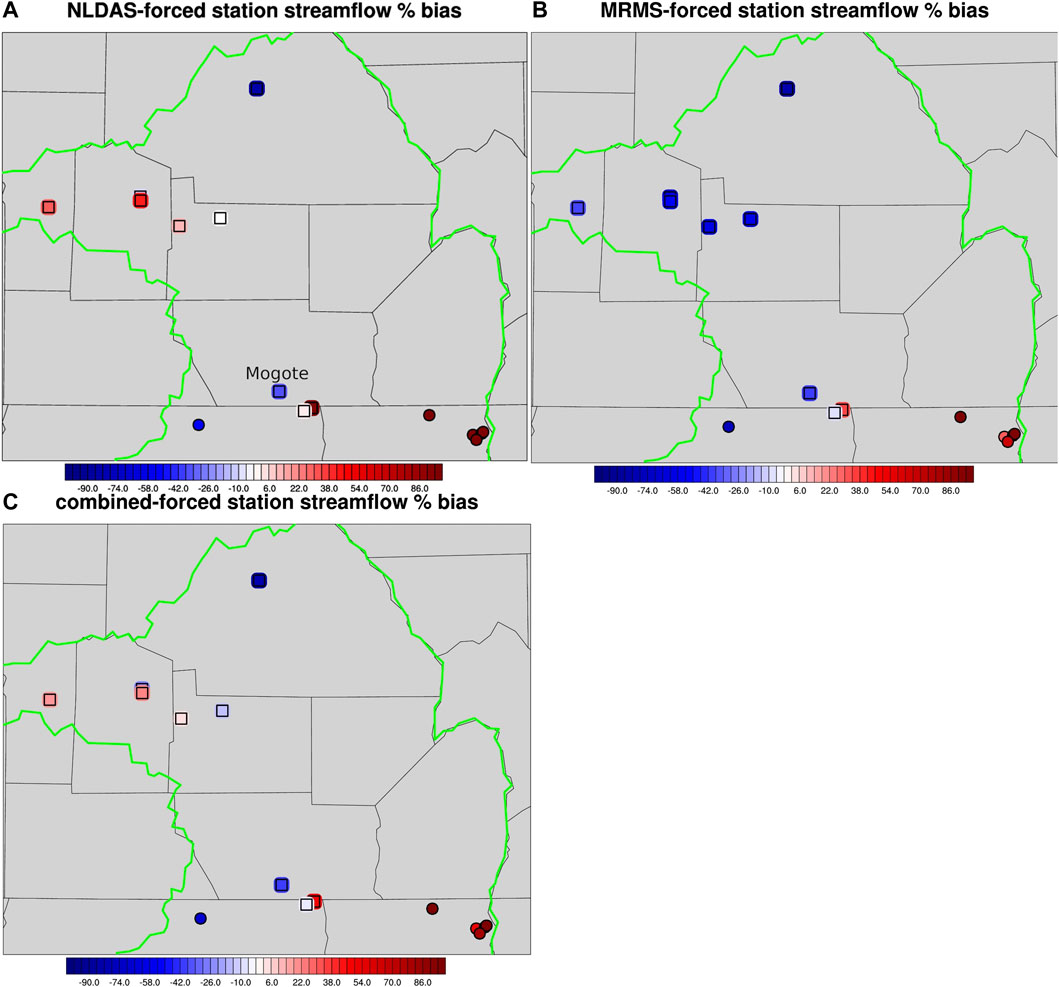
FIGURE 12. Streamflow bias for (A) NLDAS, (B) MRMS, and (C) combined versus the observed streamflow stations (USGS stations using circles, and CDNR using squares) within the vicinity of the upper Rio Grande basin. The location of the Conejos River near Mogote station depicted in Figure 11 is labelled “Mogote” in the first panel.
Streamflow differences between NLDAS- and MRMS-forced simulations are the result of how each precipitation data set is created. During the cold season, when snowpack is increasing, NLDAS generally produces a greater volume of snow accumulation, especially within radar blind spots, such as the higher San Juan Mountains west of the San Luis valley, since the NLDAS product is more strongly influenced by in situ gauges. In the spring and early summer, this snowpack melts in both NLDAS- and MRMS-forced simulations, producing similar shaped seasonal flows, albeit with different magnitudes. On the other hand, the MRMS precipitation product better captures the finer-scale summertime precipitation structures within radar-observed portion of the upper Rio Grande basin, while the NLDAS product does not. Therefore, although the total volume of precipitation within the upper Rio Grande basin is similar between the two products, the differences in streamflow at various specific locations is influenced by the individual precipitation products. The combined NLDAS-MRMS product endeavors to capture the best of both products by focusing on locations where each one is most accurate.
4 Conclusion
This study investigated the effect on streamflow by combining precipitation from the NLDAS and MRMS products, the latter which includes precipitation from the new Alamosa gap-filling radar that provides coverage over the mountain-ringed San Luis Valley. Precipitation from the NLDAS and MRMS data sets were compared with SNOTEL observations, which indicated that NLDAS precipitation were generally too high, while a slight majority of MRMS stations were too low. MRMS precipitation was generally higher closer to the Alamosa radar, while NLDAS precipitation was generally higher further away. Therefore, a combined product was created that used MRMS precipitation in areas best observed by the radar, and NLDAS further away. This was done through an algorithm that weighted the precipitation based on where the upper and lower portions of the base scan radar beam intersected the terrain, with a weighting between the products in between.
Each of these precipitation products: NLDAS, MRMS, and combined were then used as precipitation forcing for three separate hydrological simulations during the entire year 2021. The NLDAS precipitation-forced streamflow simulations produced high-biased annual streamflows at most stations, including biases greater than 50% at nearly half of the stations. On the other hand, the MRMS precipitation-forced streamflow simulations produced low-biased annual streamflows at a slight majority of stations, all but one of which were biased more than 50%. The combined precipitation-forced streamflows showed modest overall improvement, being biased high at nine stations, although most of these biases were more modest than NLDAS, with only four exceeding 50% producing modestly-improved overall streamflows at most stations.
Data availability statement
The raw data supporting the conclusions of this article will be made available by the authors, without undue reservation.
Author contributions
JG performed most of the analysis, and wrote most of the article. YZ perfomed some of the analysis and wrote some of the article. DG provided guidance for the direction of the research, as well as sought the funding for this work.
Acknowledgments
We thank the Upper Gunnison River Water Conservancy District and the Colorado Department of Natural Resources for the financial support. We also thank the Airborne Snow Observatories, Inc., for providing the snow survey data. The National Center for Atmospheric Research is sponsored by the National Science Foundation.
Conflict of interest
The authors declare that the research was conducted in the absence of any commercial or financial relationships that could be construed as a potential conflict of interest.
Publisher’s note
All claims expressed in this article are solely those of the authors and do not necessarily represent those of their affiliated organizations, or those of the publisher, the editors and the reviewers. Any product that may be evaluated in this article, or claim that may be made by its manufacturer, is not guaranteed or endorsed by the publisher.
References
American Meteorological Society (2012). Beamwidth. Glossary of meteorology. American Meteorological Society. Available at: http://glossary.ametsoc.org/wiki/Beamwidth (Accessed July 14, 2022).
Bardsley, T., and Julander, R. (2005). “The documentation of extreme events: Two case studies in Utah, water year 2005,” in Proceedings of the 73rd annual western snow conference, Great Falls, Montana, April 2005 (Brush Prairie, WA: Western Snow Conference), 33–42.
Bringi, V. N., and Chandrasekar, V. (2001). Polarimetric Doppler weather radar: Principles and applications. Cambridge University Press, 636.
Daly, C., Neilson, R. P., and Phillips, D. L. (1994). A statistical-topographic model for mapping climatological precipitation over mountainous terrain. J. Appl. Meteor. 33, 140–158. doi:10.1175/1520-0450(1994)033<0140:astmfm>2.0.co;2
Duan, Z., Tuo, Y., Liu, J., Gao, H., Song, X., Zhang, Z., et al. (2019). Hydrological evaluation of open-access precipitation and air temperature datasets using SWAT in a poorly gauged basin. In Ethiopia. J. Hydrol. 569, 612–626. doi:10.1016/j.jhydrol.2018.12.026
Gerard, A., Martinaitis, S. M., Gourley, J. J., Howard, K. W., and Zhang, J. (2021). An overview of the performance and operational applications of the MRMS and FLASH systems in recent significant urban flash flood events. Bull. Amer. Meteor. Soc. 102, E2165–E2176. doi:10.1175/bams-d-19-0273.1
Gochis, D. J., Barlage, M., Cabell, R., Casali, M., Dugger, A., FitzGerald, K., et al. (2020). The WRF-Hydro modeling system technical description (Version 5.1.1). Boulder, CO: NCAR Technical Note, 107. Available online at: https://ral.ucar.edu/sites/default/files/public/WRFHydroV511TechnicalDes (Source Code).
He, X., Koch, J., Zheng, C., Bøvit, T., and Jensen, K. H. (2018). Comparison of simulated spatial patterns using rain gauge and polarimetric radar based precipitation data in catchment hydrological modeling. J. Hydrometeorol. 19, 1273–1288. doi:10.1175/JHM-D-17-0235.1
Hou, A. Y., Kakar, R. K., Neeck, S., Azarbarzin, A. A., Kummerow, C. D., Kojima, M., et al. (2010). The global precipitation measurement mission. Bull. Amer. Meteor. Soc. 95, 701–722. doi:10.1175/BAMS-D-13-00164.1
Ignaccolo, M., and De Michele, C. (2020). One, no one, and one hundred thousand: The paradigm of the Z–R relationship. J. Hydrometeorol. 21, 1161–1169. doi:10.1175/jhm-d-19-0177.1
Joyce, R. J., Janowiak, J. E., Arkin, P. A., and Xie, P. (2004). Cmorph: A method that produces global precipitation estimates from passive microwave and infrared data at high spatial and temporal resolution. J. Hydrometeor. 5, 487–503. doi:10.1175/1525-7541(2004)005<0487:camtpg>2.0.co;2
Junyent, F., and Chandrasekar, V. (2009). Theory and characterization of weather radar networks. J. Atmos. Ocean. Technol. 26, 474–491. doi:10.1175/2008jtecha1099.1
Kidd, C., Becker, A., Hufffman, G. J., Muller, C. L., Joe, P., Skofronick-Jackson, G., et al. (2017). So, how much of the earth's surface is covered by rain gauges? Bull. Amer. Meteor. Soc. 98, 69–78. doi:10.1175/BAMS-D-14-00283.1
Laiti, L., Mallucci, S., Piccolroaz, S., Bellin, A., Zardi, D., Fiori, A., et al. (2018). Testing the hydrological coherence of high-resolution gridded precipitation and temperature data sets. Water Resour. Res. 54, 1999–2016. doi:10.1002/2017wr021633
Martinaitis, S, M., Cocks, S. B., Simpson, M. J., Osborne, A. P., Harkema, S. S., Grams, H. M., et al. (2021). Advancements and characteristics of gauge ingest and quality control within the Multi-Radar Multi-Sensor system. J. Hydrometeor. 22, 2455–2474. doi:10.1175/JHM-D-20-0234.1
Meyer, J. D. D., Jin, J.-M., and Wang, S.-Y. (2012). Systematic patterns of the inconsistency between snow water equivalent and accumulated precipitation as reported by the snowpack telemetry network. J. Hydrometeorol. 13, 1970–1976. doi:10.1175/jhm-d-12-066.1
Monteiro, J., Strauch, M., Srinivasan, R., Abbaspour, K., and Gücker, B. (2016). Accuracy of grid precipitation data for Brazil: Application in river discharge modelling of the tocantins catchment. Hydro. Process. 30, 1419–1430. doi:10.1002/hyp.10708
Oyler, J. W., Dobrowski, S. Z., Ballantyne, A. P., Klene, A. E., and Running, S. W. (2015). Artificial amplification of warming trends across the mountains of the Western United States. Geophys. Res. Lett. 42, 153–161. doi:10.1002/2014GL062803
Rasmussen, R., Baker, B., Kochendorfer, J., Meyers, T., Landolt, S., Fischer, A. P., et al. (2012). How well are we measuring snow: The NOAA/FAA/NCAR Winter Precipitation Test Bed. Bull. Amer. Meteor. Soc. 93, 811–829. doi:10.1175/bams-d-11-00052.1
Reppenhagen, C. (2020). Colorado community in a 'weather hole' finally gets its own radar. Denver, CO: Denver 9 News. 13 March 2020. Available at: https://www.9news.com/article/weather/part-of-colorado-no-longer-under-the-radar/73-0691e43b-1af3-4dfe-8a8b-4d29b341acb4.
Serreze, M., Clark, M. P., Armstrong, R. L., McGinnis, D. A., and Pulwarty, R. S. (1999). Characteristics of the Western United States snowpack from snowpack telemetry (SNOTEL) data. Water Resour. Res. 35, 2145–2160. doi:10.1029/1999wr900090
Smith, T. M., Lakshmanan, V., Stumpf, G. J., Ortega, K. L., Hondl, K., Cooper, K., et al. (2016). Multi-Radar Multi-Sensor (MRMS) severe weather and aviation products: Initial operating capabilities. Bull. Amer. Meteor. Soc. 97, 1617–1630. doi:10.1175/BAMS-D-14-00173.1
Strauch, M., Bernhofer, C., Koide, S., Volk, M., Lorz, C., and Makeschin, F. (2012). Using precipitation ensemble for uncertainty analysis in SWAT streamflow simulation. J. Hydrol. 414, 4113–4424. doi:10.1016/j.jhydrol.2011.11.014
Tuo, Y., Duan, Z., Disse, M., and Chiogna, G. (2016). Evaluation of precipitation input for swat modeling in alpine catchment: A case study in the adige River basin (Italy). Sci. Total Environ. 573, 66–82. doi:10.1016/j.scitotenv.2016.08.034
Wagner, P. D., Fiener, P., Wilken, F., Kumar, S., and Schneider, K. (2012). Comparison and evaluation of spatial interpolation schemes for daily rainfall in data scarce regions. J. Hydrol. 464-465, 388–400. doi:10.1016/j.jhydrol.2012.07.026
Xia, Y. L., Mitchell, K., Ek, M., Sheffield, J., Cosgrove, B., Wood, E., et al. (2012a). Continental-scale water and energy flux analysis and validation for the North American Land data assimilation system project phase 2 (NLDAS-2): 1. Intercomparison and application of model products. J. Geophys. Res. 117. doi:10.1029/2011JD016048
Xia, Y. L., Mitchell, K., Ek, M., Sheffield, J., Cosgrove, B., Wood, E., et al. (2012b). Continental-scale water and energy flux analysis and validation for north American Land data assimilation system project phase 2 (NLDAS-2): 2. Validation of model-simulated streamflow. J. Geophys. Res. 117. doi:10.1029/2011JD016051
Zhang, J., Howard, K., Langston, C., Vasiloff, S., Kaney, B., Arthur, A., et al. (2011). National mosaic and multi-sensor QPE (NMQ) system: Description, results, and future plans. Bull. Amer. Meteor. Soc. 92, 1321–1338. doi:10.1175/2011bams-d-11-00047.1
Zhang, J., Howard, K., Langston, C., Kaney, B., Qi, Y., Tang, L., et al. (2016). Multi-Radar Multi-Sensor (MRMS) quantitative precipitation estimation: Initial operating capabilities. Bull. Amer. Meteor. Soc. 97, 621–638. doi:10.1175/bams-d-14-00174.1
Keywords: WRF-Hydro, National Water Model, gap-filling radar, streamflow, San Luis valley
Citation: Grim JA, Zhang Y and Gochis DJ (2023) Impact of the Alamosa gap-filling radar on streamflow in the National Water Model. Front. Earth Sci. 10:995424. doi: 10.3389/feart.2022.995424
Received: 15 July 2022; Accepted: 22 December 2022;
Published: 09 January 2023.
Edited by:
Yuqing Wang, University of Hawaii at Manoa, United StatesReviewed by:
Md Nazmul Azim Beg, Tulane University, United StatesWei Zhang, Utah State University, United States
Copyright © 2023 Grim, Zhang and Gochis. This is an open-access article distributed under the terms of the Creative Commons Attribution License (CC BY). The use, distribution or reproduction in other forums is permitted, provided the original author(s) and the copyright owner(s) are credited and that the original publication in this journal is cited, in accordance with accepted academic practice. No use, distribution or reproduction is permitted which does not comply with these terms.
*Correspondence: Joseph A. Grim, Z3JpbUB1Y2FyLmVkdQ==
 Joseph A. Grim
 Yongxin Zhang
 David J. Gochis