 Shuo Lv1
 Yuan Sun
 Zhong Zhong
 Yixuan Shen
95% of researchers rate our articles as excellent or good
Learn more about the work of our research integrity team to safeguard the quality of each article we publish.
Find out more
ORIGINAL RESEARCH article
Front. Earth Sci. , 01 September 2022
Sec. Atmospheric Science
Volume 10 - 2022 | https://doi.org/10.3389/feart.2022.994876
This article is part of the Research Topic Extreme Climate Events: Variability, Mechanisms, and Numerical Simulations View all 17 articles
Recent studies have proposed a relatively reliable metric, i.e., the annual-mean latitude of tropical cyclone (TC) lifetime maximum intensity, to evaluate the observed trend of poleward migration of TC. The documented trend in the existing records of the metric suggests that anthropogenic factors might make considerable contributions to the poleward migration of TC. However, here we show that there is no significant TC migration trend in the western North Pacific (WNP). Instead, large interdecadal variation is found in the WNP TC track over the past 35 years. Rather than the anthropogenic factors, it is the natural variability, especially the Interdecadal Pacific Oscillation (IPO), that plays a key role in modulating the migration of WNP TC track. The IPO-related TC migration is assumed to cause systematic changes (i.e., increases and decreases) in regional hazard exposure and risk. The impact of IPO on the WNP TC migration is attributed to its influences on the large-scale circulation, TC genesis potential index, and the potential intensity in the TC prevailing region of the WNP.
In the context of global warming and considering the economic damages and catastrophes resulting from tropical cyclones (TCs) in various ocean basins, it is of great interest and societal importance to understand whether some changes of the TC activity may occur outside of natural variability and thus can be attributed to anthropogenic forcing (Knutson et al., 2010; Wang et al., 2011; Lee et al., 2012; Kossin et al., 2014; Kossin et al., 2016; Lee et al., 2020). While great progress has been made in evaluating the impact of global warming on TC intensity and TC-induced rainfall (Knutson et al., 2010), by far relatively little is known about the anthropogenically forced changes in the current climate (Wang et al., 2011; Kossin et al., 2014).
Over the past 30 years, the annual-mean latitude where tropical cyclones (TCs) reach their lifetime maximum intensity (LMI) has significantly migrated poleward in the northern and southern hemispheres, which potentially would have profound impacts on life and property safety (Kossin et al., 2014). Increasing mortality risks and hazard exposures from TCs (Peduzzi et al., 2012) may be compounded in coastal cities at higher latitudes, while they might possibly be offset at lower latitudes (Cardon et al., 2012; Kossin et al., 2016). TCs from the western North Pacific (WNP), which is also the most active basin hosting the largest TC genesis numbers on earth, make the largest contribution to the trend of TC poleward migration in the northern hemisphere (Kossin et al., 2014; Kossin et al., 2016).
Recent studies suggested that the observed trend of WNP TC poleward migration can be attributed to a conflation of anthropogenic and natural factors (Shen et al., 2018). With a substantial portion occurring outside the dominant known modes of variability in the region [i.e., El Niño–Southern Oscillation (ENSO) and Pacific Decadal Oscillation (PDO)] (Ho et al., 2004; Camargo et al., 2007a; Liu & Chan, 2008; Kossin et al., 2010; Zhang et al., 2012; Liu & Chan, 2013; Wang & Wang, 2013; Mei et al., 2015), it is argued that the TC migration may be related to other forms of slow decadal forcing (possibly anthropogenic forcing) (Kossin et al., 2014; Kossin et al., 2016). ENSO and PDO are known to affect the large-scale environment and thus the genesis and trajectories of the WNP TCs, which eventually contribute to the WNP TC migration (Kossin et al., 2016; Camargo et al., 2007a). However, other variabilities (except for ENSO and PDO) may also contribute to the WNP TC migration, which, if anything, will raise the uncertainty in the contribution of anthropogenic forcing. The Interdecadal Pacific Oscillation (IPO), which is similar to the PDO but occurs over a wider area of the Pacific (Power et al., 1999; Folland et al., 2002; Henley et al., 2015), is expected to considerably contribute to the WNP TC migration. Nevertheless, no studies on the contribution of IPO to the WNP TC migration have been conducted yet. Moreover, despite some studies on recent changes of TC track and exposure under global warming conditions (Knutson et al., 2010; Wang et al., 2011; Lee et al., 2012; Kossin et al., 2014; Kossin et al., 2016), how the natural variability and anthropogenic forcing affect the WNP TC migration still remain unclear.
Here we try to address these issues by analyzing the observations during the 41-year period of 1980–2020, when the best-track data are considered to be most complete and with the highest quality in terms of both TC position and TC intensity due to the monitoring of geostationary satellites (Kalnay et al., 1996; Knapp & Kruk, 2010; Dee et al., 2011; Kossin et al., 2014). We focus on the contribution of IPO to the observed TC migration in the WNP, which has been proved to be an important issue but is underestimated and even ignored in the previous studies.
The index “Niño 3.4” (5°N–5°S, 140°E–145°W) defined over this region is widely used to represent the ENSO index, which is available at http://www.esrl.noaa.gov/psd/gcos_wgsp/Timeseries/Nino34/. The “Pacific Decadal Oscillation” (PDO) is a long-lived El Niño-like pattern of Pacific climate variability (Mantua et al., 1997; Christensen, 2013). The PDO index is defined as the projections of monthly mean SST anomalies onto their first EOF vectors in the North Pacific (north of 20ºN) (Mantua et al., 1997). The EOF vectors are derived for the period from 1900 to 1993, and climatological value is defined as monthly mean for the same period. Globally averaged monthly mean SST anomaly is subtracted from monthly mean SST anomaly of the Pacific Ocean north of 20°N before calculation of the first EOF vector for the purpose to remove the effect of global warming. The PDO index is available at https://www.esrl.noaa.gov/psd/gcos_wgsp/Timeseries/PDO/. The Interdecadal Pacific Oscillation (IPO) and the PDO are closely related modes of decadal to interdecadal climate variability in the Pacific Ocean (Mantua et al., 1997; Power et al., 1999; Folland et al., 2002; Christensen, 2013; Henley et al., 2015). The PDO can be considered as the North Pacific node of the Pacific-wide IPO (Power et al., 1999; Folland et al., 2002). The IPO is associated with a distinct “tripole” pattern of SST anomalies, and the IPO Tripole Index (TPI) is calculated as follows based on monthly global SST data (Henley et al., 2015): Firstly, subtract the monthly climatological value from SST in each grid cell to eliminate the seasonal cycle and calculate monthly mean SST anomalies (SSTAi) in the three TPI regions using a chosen base period (1971–2000 used here). TPI regions are defined as follows: region 1 (25°N–45°N, 140°E–145°W); region 2 (10°S–10°N, 170°E–90°W); region 3 (50°S–15°S, 150°E–160°W). Secondly, the TPI is calculated as follows:
The TPI is also available at https://www.esrl.noaa.gov/psd/data/timeseries/IPOTPI/.
SST data are taken from the US National Oceanic and Atmospheric Administration Extended Reconstruction of SST (NOAA-ERSST; Smith & Reynolds, 2003), which is a global gridded dataset reconstructed based on historical observations of SST data using statistical methods. This dataset has spatial resolution of 2°×2° and temporal resolution of monthly, and the scope of this paper is global (0°–360°, 90°N-90°S).
GPI has important indicative significance for the generation of TCs and has been widely used in the study of TCs. Its definition is as follows:
Where
where
Note that the GPI, PI and large-scale environmental flow are all calculated from the National Centers for Environmental Prediction–National Center for Atmospheric Research Global Reanalysis (NCEP–NCAR) (Kalnay et al., 1996) data. This reanalysis dataset is using a state-of-the-art system to perform data assimilation with spatial resolution of 2.5×2.5 and temporal resolution of monthly. In this paper, these data are selected from 1980 to 2015, and the spatial range is the Western North Pacific region (100°E-180°, 0°-60°N).
Best-track data are obtained from the International Best Track Archive for Climate Stewardship (IBTrACS) v04r00 (Knapp et al., 2010; Knapp et al., 2018), which is available at http://www.ncdc.noaa.gov/ibtracs/. There are four best-track data provided by four different agencies in the WNP: the Joint Typhoon Warming Center (JTWC), Japan Meteorological Agency (JMA), China Meteorological Administration (CMA), and Hong Kong Observatory (HKO). Note that only TCs with LMI ≥35 kt and ≤1,000 hPa are used in our analysis.
To further examine the impact of anthropogenic forcing on meridional migration of WNP TCs in future, we use an ensemble of TCs generated by 14 CMIP5 models, which includes the twenty-first-century RCP4.5 and RCP8.5 projection simulations (Camargo, 2013). RCP4.5 (RCP8.5) is a scenario that stabilizes radiative forcing at 4.5 (8.5) W m−2 at the end of the century. CMIP5 models used in this paper include CanESM2, CCSM4, CSIRO Mk3.6.0, Fgoals-G2, GFDL CM3, GFDL-ESM2M, HADGEM2-ES, and INM-CM4.0. Ipsl-cm5a-lr, MIROC-ESM, MIROC5, MPI-ESM-LR, MRI-CGCM3, and NORESM1-M. RCP4.5 is a stabilization scenario and assumes that climate policies are invoked to achieve the goal of limiting emissions, while RCP8.5 corresponds to the pathway with the highest greenhouse gas emissions and is based on a presumption of no to little change from the present trajectories of greenhouse gas concentrations. RCP4.5 and RCP8.5 scenarios have better model coverage compared to the other scenarios, which is available at https://esgf-node.llnl.gov/search/cmip5/.
The significance of residual analysis is to check whether the trend of TC poleward movement is still significant after removing the trend of natural variability from the trend of TC poleward migration. ENSO (PDO, IPO) variability is excluded from the annual-mean TC latitude at the time of LMI (
The measurement of
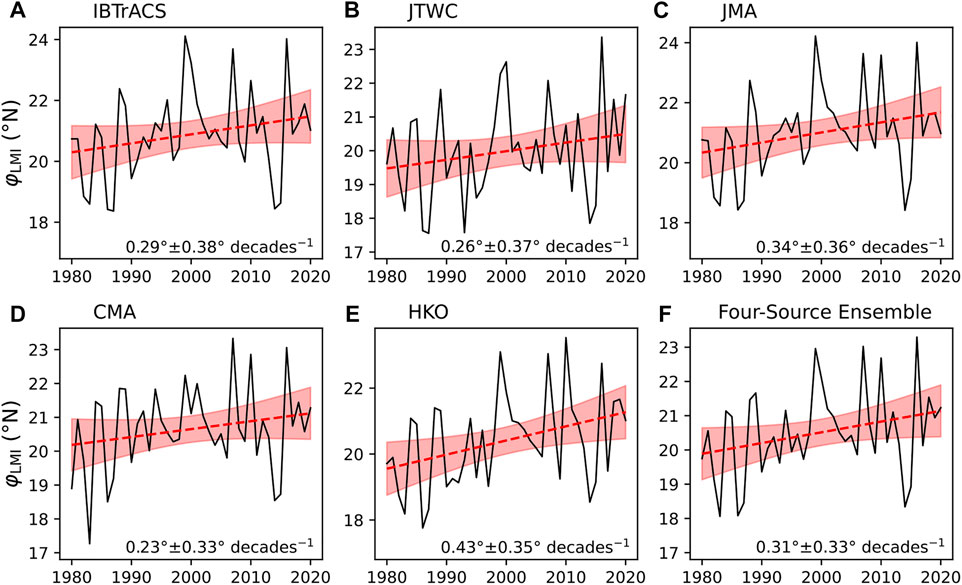
FIGURE 1. Migration of the location of LMI. Time series of annual-mean
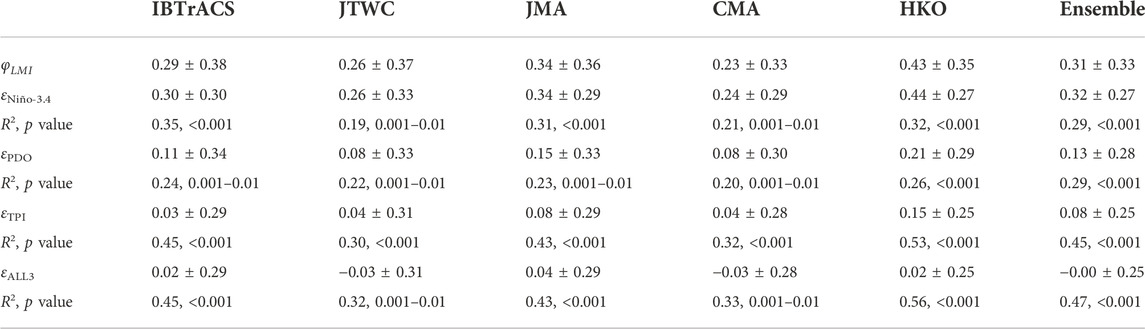
TABLE 1. Linear trends of annual-mean latitude of LMI and its regression residuals for best-track data from various sources. The WNP TC track migration rates and 95% confidence intervals (latitude decade−1) of annual-mean
The variability of the WNP TC activity has received a large amount of attention during the past 2 decades, and many studies have linked TC track variability to ENSO (Camargo et al., 2007a; Liu & Chan, 2008) on interannual timescale. In recent years, the PDO has been found to have important influences on large-scale flow patterns and thus the TC track variability over the WNP (Liu & Chan, 2008; Mei et al., 2015). Here, averages of the ENSO (Niño-3.4), PDO, IPO (IPO tripole index, TPI) (Henley et al., 2015) indices are taken over July-November (JASON), which is considered as the peak TC season (about 80% of annual WNP TCs occur in these months) (Kossin et al., 2016). As expected, there is an inverse relationship between
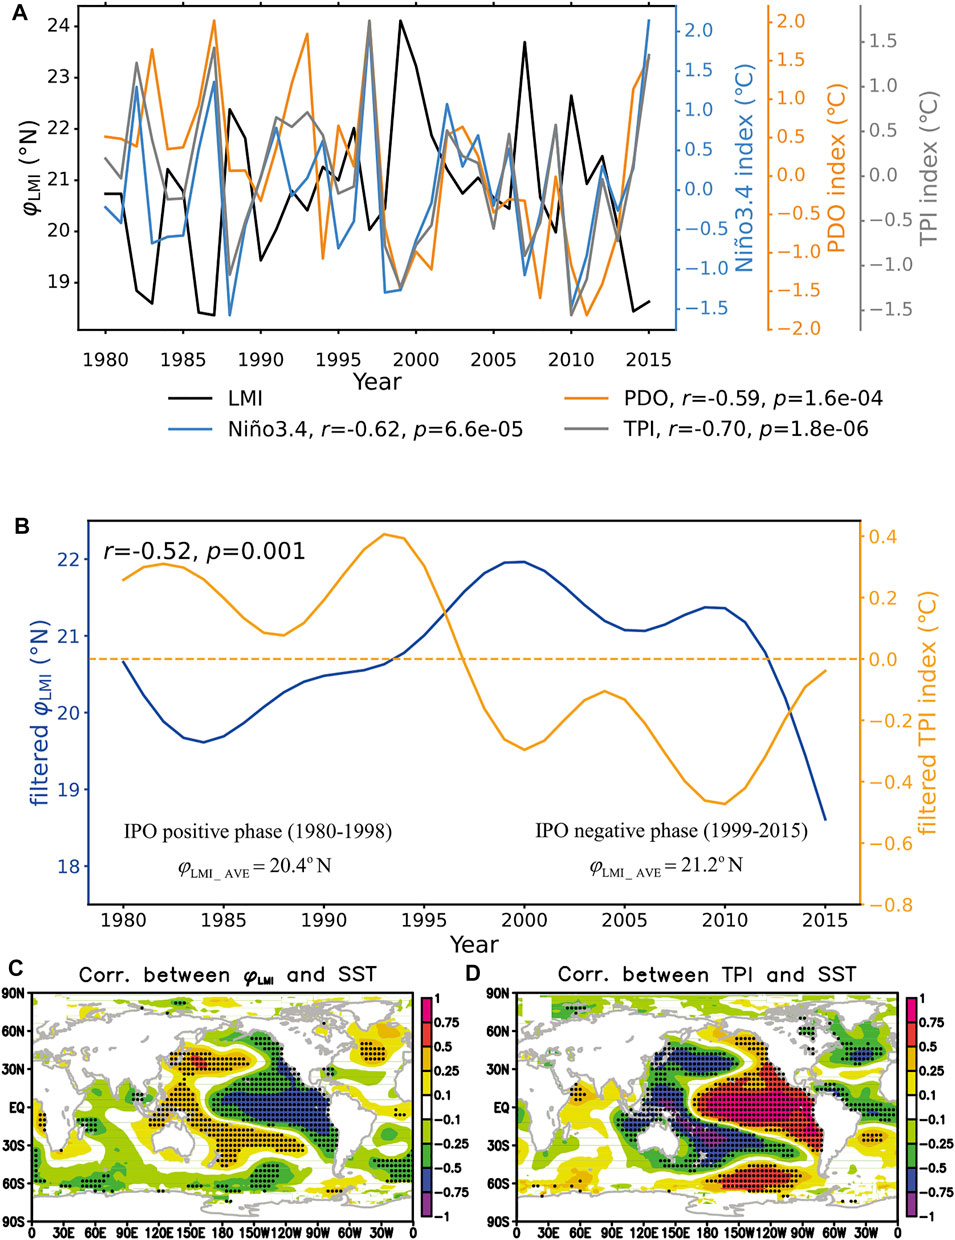
FIGURE 2. Relationship between the location of LMI over the WNP and the IPO. (A) Time series of annual-mean
To further compare the contributions of various natural variabilities to the WNP TC migration, we calculate the residuals of annual-mean
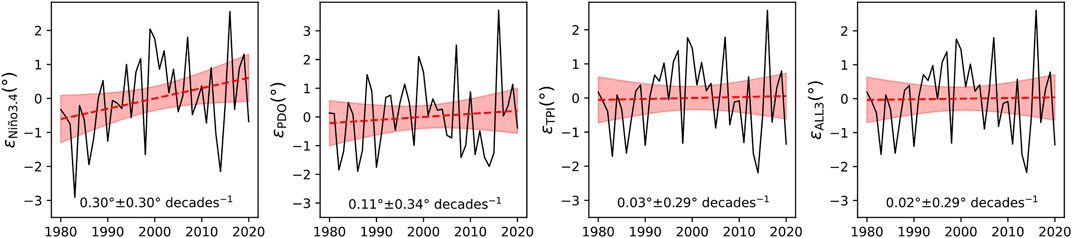
FIGURE 3. Possible effects of the three modes of variability on the migration of the latitude of LMI. Time series of (A) residuals of the single-variate of annual-mean
Despite the strong agreement between the two indices of PDO and IPO (r = 0.75), the IPO index (i.e., TPI) is based on the difference between SST averaged over the central equatorial Pacific and that over the northwestern and southwestern Pacific, and thus is substantially different from the PDO index which is mainly determined by SST in the North Pacific (north of 20ºN) (Mantua et al., 1997). Thus, compared with the PDO index, the IPO index is more related to meridional and zonal gradients of SST over the WNP. The interdecadal changes of the SST gradients and related spatial SST distribution pattern make large contributions to the WNP TC migration, which will be discussed in detail in the next section.
As mentioned above, our observational results imply that the anthropogenic forcing does not contribute significantly to the observed WNP TC migration as expected. This also does not necessarily mean that the anthropogenic factors (e.g., global warming induced by greenhouse gases) will not significantly contribute to the poleward shift of the WNP TC in the future, since it is difficult to distinguish the contributions of anthropogenic forcing and natural variability based on the short time-period records (Allen et al., 2014; Lucas et al., 2014; Boo et al., 2015).
Thanks to the relatively long period (2006–2100) of RCP4.5 and RCP8.5 scenarios which is much longer than the period during which the known modes of natural variability are derived, it is relatively robust and reliable to draw the conclusions on the influence of anthropogenic forcing by using the results of these 14 CMIP5 models under the RCP4.5 and RCP8.5 scenarios. In the RCP4.5 projection simulations, the projected rate of migration of
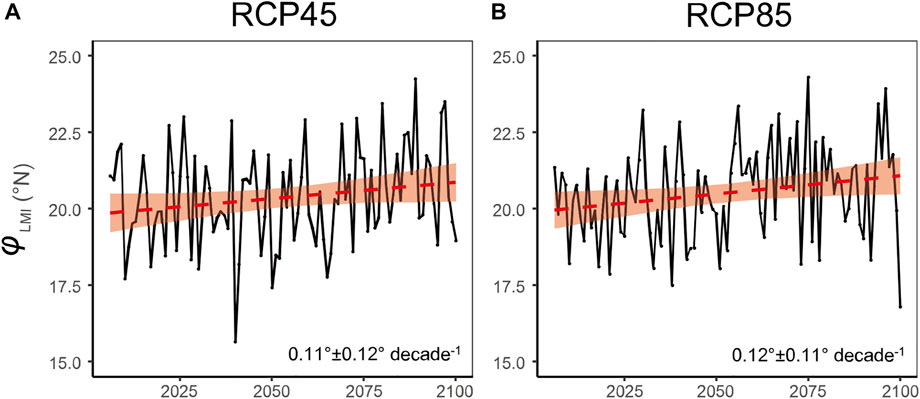
FIGURE 4. Projected migrations of the WNP TC in future under the two representative emission scenarios. Time series of annual-mean
The
Consistent with the previous studies (Burgman et al., 2008; Chen et al., 2008; Lee & McPhaden, 2008; Meehl & Arblaster, 2012; Henley et al., 2015), the IPO transferred from positive to negative phase in the late 1990s after the 1997–98 El Niño event. Thus, the period of 1980–1998 (1999–2015) can be considered as the positive (negative) IPO phase on interdecadal timescale (Figure 2B). Moreover, the time-averaged
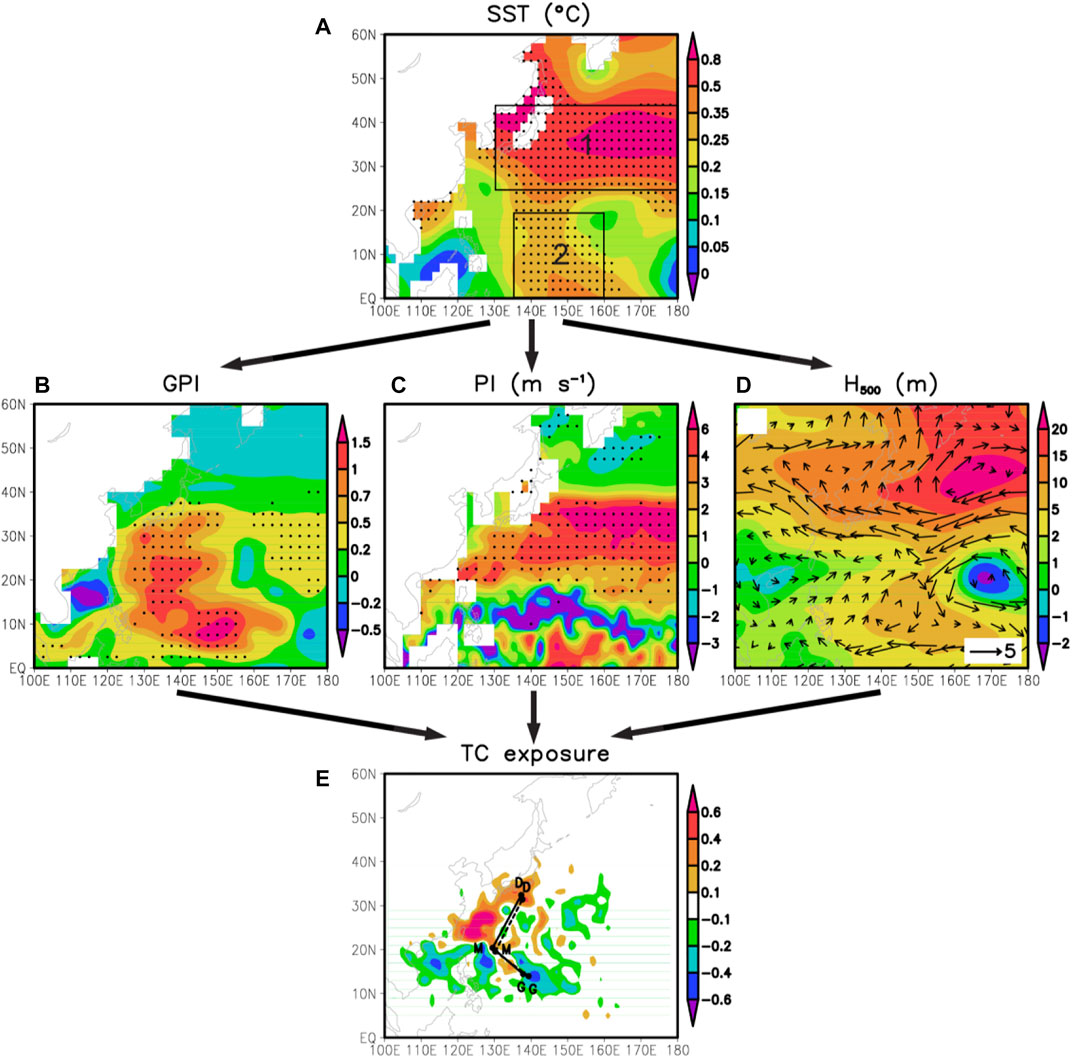
FIGURE 5. Differences in annual-mean JASON SST, GPI, PI, large-scale circulation, and TC exposure between negative IPO phase and positive IPO phase. (A) SST (°C), (B) GPI, (C) PI (m s−1), (D) 500-hPa geopotential height (shaded; m) and 850–300 hPa vertical-mean wind (vectors; m s−1), and (E) TC exposure (number of days of exposure per year per 2°×2° latitude–longitude grid box) and the positions of TC genesis (G), lifetime maximum intensity (M), and disappearance (D), which are depicted in dotted line in the positive IPO phase and in solid line in the negative IPO phase. The IPO negative phase refers to the period of 1980-1998, and the IPO positive phase refers to the period of 1999–2015. Dotted areas denote that the differences are significant at/above the 99% confidence level by the Student’s t test. Black boxes indicate the two main regions where SST differences are significant at/above the 99% confidence (Region 1: 25°N-45°N, 130°E-180°E; Region 2: 0°N-20°N, 135°E-160°E).
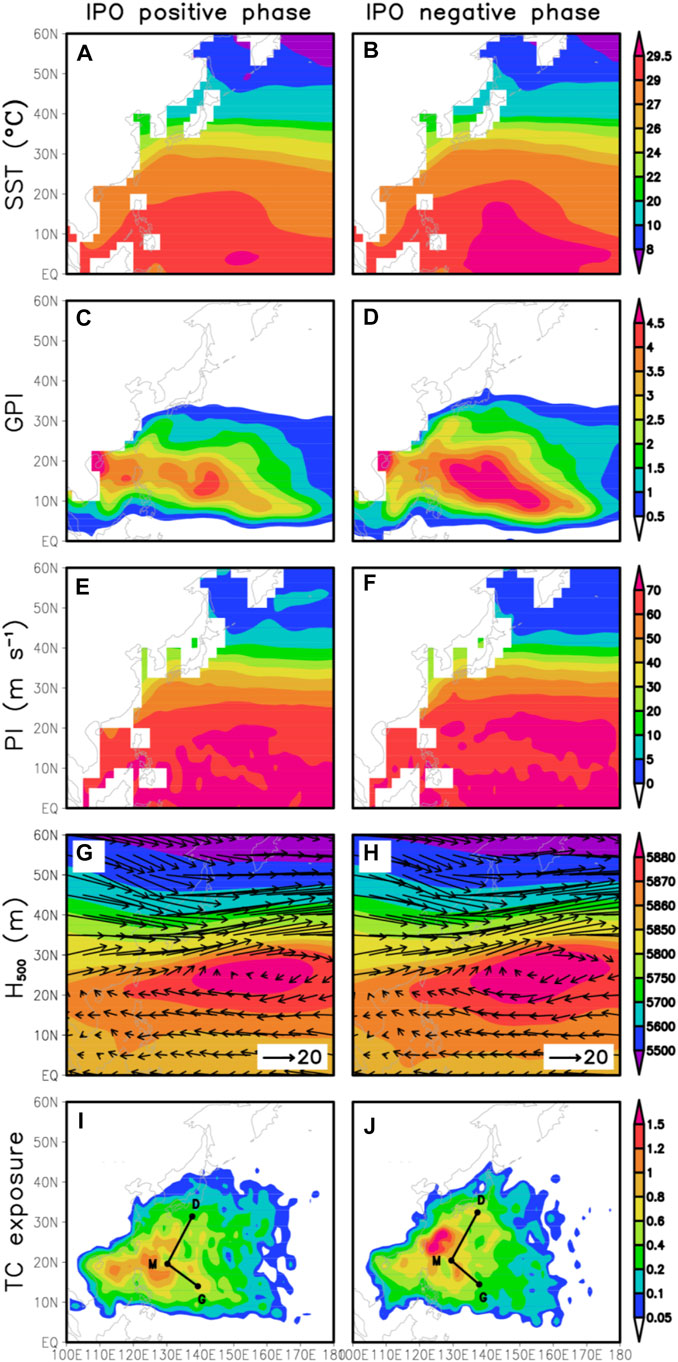
FIGURE 6. Annual-mean JASON SST, GPI, PI, large-scale circulation, and TC exposure during the positive IPO phase (A,C,E and G) and negative IPO phase (B,D,F and H). (A,B) SST (°C); (C,D) GPI; (E,F) PI (m s−1); (G,H) 500-hPa geopotential height (shaded; m) and 850–300 hPa vertically averaged wind (vectors; m s−1); and (I,J) TC exposure (number of days of exposure per year per 2°×2° latitude–longitude grid box) and the positions of TC genesis (G), lifetime maximum intensity (M), and disappearance (D).
During the transitional period from the positive IPO phase to negative IPO phase over the WNP, there are two main regions (Region 1 25°N-45°N, 130°E-180°E; Region 2 0°N-20°N, 135°E-155°E) where positive SST anomalies are significant at/above the 99% confidence level (Figure 5A). At first, the higher SST in Region 1 and Region 2 contribute to the significant increase of GPI in the three ocean areas (i.e., an ocean area to the south of Japan, an ocean area near the equator, and an ocean area near the central North Pacific). Compared with the first area that is to the north of the main WNP TC genesis area (see Figures 6C,D), the latter two areas are relatively farther from the main genesis region of WNP TC and thus contribute relatively smaller to the migration of TC genesis position (Figure 5B). Under the joint effects of GPI changes in the three areas, the time-averaged TC genesis position shifts poleward by 0.47 latitude (Figure 5E). Moreover, the higher SST in Region 1 leads to a relatively higher PI that favors further development of TCs at the high latitudes over the region (Figure 5C and Figures 6E,F), and eventually leads to the poleward shift of
This paper investigates that IPO impact on Migration of Tropical Cyclone Track over the Western North Pacific. We found that the location where TCs reach their lifetime maximum intensity (LMI) moved northward with a trend of 0.29 ± 0.38 latitude decade-1 from 1980 to 2020. But the trend was not significant, which is consistent across different datasets. The correlation analysis shows that the correlation coefficient between TC latitude at the time of LMI (
In the following work, we will continue to study the contribution of various natural variability, including IPO, to the poleward movement of TC in future scenarios. We will also continue to use the latest numerical weather patterns on the impact of human activities on the TC for further explanation. We believe that human activity to a certain extent, also affect the change of the TC. However, further research is needed to determine whether this effect will affect TC as human activities affect natural variability, or directly affect TC itself.
The original contributions presented in the study are included in the article/Supplementary Material, further inquiries can be directed to the corresponding author.
YS conceived the project. SL analyzed the results, produced the figures, and wrote the manuscript with contributions from ZZ, YUS and YIS wrote the codes on produced the TC data in CMIP5 models. ZZ advised on physical interpretation of IPO Modulation on TC track Migration.
This work is supported by the National Natural Science Foundation of China (No. 42075035 and 42075011).
The authors declare that the research was conducted in the absence of any commercial or financial relationships that could be construed as a potential conflict of interest.
All claims expressed in this article are solely those of the authors and do not necessarily represent those of their affiliated organizations, or those of the publisher, the editors and the reviewers. Any product that may be evaluated in this article, or claim that may be made by its manufacturer, is not guaranteed or endorsed by the publisher.
Allen, R. J., Norris, J. R., and Kovilakam, M. (2014). Influence of anthropogenic aerosols and the Pacific decadal oscillation on tropical belt width. Nat. Geosci. 7, 270–274. doi:10.1038/ngeo2091
Boo, K.-O., Booth, B. B., Byun, Y.-H., Lee, J., Cho, C., Shim, S., et al. (2015). Influence of aerosols in multidecadal SST variability simulations over the North Pacific. J. Geophys. Res. Atmos. 120, 517–531. doi:10.1002/2014jd021933
Burgman, R. J., Clement, A. C., Mitas, C. M., Chen, J., and Esslinger, K. (2008). Evidence for atmospheric variability over the Pacific on decadal timescales. Geophys. Res. Lett. 35, L01704. doi:10.1029/2007GL031830
Camargo, S. J. (2013). Global and regional aspects of tropical cyclone activity in the CMIP5 models. J. Clim. 26, 9880–9902. doi:10.1175/jcli-d-12-00549.1
Camargo, S. J., Kmanuel, K. A., and Sobel, A. H. (2007b). Use of a genesis index to diagnose ENSO effects on tropical cyclone genesis. J. Clim. 20, 4819–4834. doi:10.1175/JCLI4282.1
Camargo, S. J., Robertson, A. W., Gaffney, S. J., Smyth, P., and Ghil, M. (2007a). Cluster analysis of typhoon tracks. Part II: Large-scale circulation and ENSO. J. Clim. 20, 3654–3676. doi:10.1175/jcli4203.1
Cardon, O. D., Maarten, V. A., Joern, B., Maureen, F., Glenn, M., and Mechler, R. (2012). “Determinants of risk: Exposure and vulnerability.” in Managing the risks of extreme events and disasters to advance climate change adaptation. Cambridge, United Kingdom: Cambridge University Press.
Chan, J. C. L., and Gray, W. M. (1982). Tropical cyclone movement and surrounding flow relationships. Mon. Wea. Rev. 110, 1354–1374. doi:10.1175/1520-0493(1982)110<1354:tcmasf>2.0.co;2
Chen, J., Del Genio, A. D., Carlson, B. E., and Bosilovich, M. G. (2008). The spatiotemporal structure of twentieth-century climate variations in observations and reanalyses. Part II: Pacific pan-decadal variability. J. Clim. 21, 2634–2650. doi:10.1175/2007jcli2012.1
Christensen, J. H. (2013). “Climate phenomena and their relevance for future regional climate change.” in Climate change 2013: The physical science basis. Contribution of working group I to the fifth assessment report of the intergovernmental panel on climate change. Cambridge: Cambridge University Press.
Dee, D. P., Uppala, S. M., Simmons, A. J., Berrisford, P., Poli, P., Kobayashi, S., et al. (2011). The ERA-interim reanalysis: Configuration and performance of the data assimilation system. Q. J. R. Meteorol. Soc. 137, 553–597. doi:10.1002/qj.828
Emanuel, K. A. (1999). Thermodynamic control of hurricane intensity. Nature 401, 665–669. doi:10.1038/44326
Folland, C. K., Renwick, J. A., Salinger, M. J., and Mullan, A. B. (2002). Relative influences of the interdecadal pacific oscillation and ENSO on the south pacific convergence zone. Geophys. Res. Lett. 29, 21-1–21-4. doi:10.1029/2001gl014201
Gill, A. E. (2010). Some simple solutions for heat-induced tropical circulation. Q. J. R. Meteorol. Soc. 106, 447–462. doi:10.1002/qj.49710644905
Henley, B. J., Gergis, J., Karoly, D. J., Power, S., Kennedy, J., and Folland, C. K. (2015). A tripole index for the interdecadal pacific oscillation. Clim. Dyn. 45, 3077–3090. doi:10.1007/s00382-015-2525-1
Ho, C.-H., Baik, J.-J., Kim, J.-H., Gong, D.-Y., and Sui, C. H. (2004). Interdecadal changes in summertime typhoon tracks. J. Clim. 17, 1767–1776. doi:10.1175/1520-0442(2004)017<1767:icistt>2.0.co;2
Kalnay, E., Kanamitsu, M., Kistler, R., Collins, W., Deaven, D., Gandin, L., et al. (1996). The NCEP/NCAR 40-year reanalysis project. Bull. Am. Meteorol. Soc. 77, 437–471. doi:10.1175/1520-0477(1996)077<0437:tnyrp>2.0.co;2
Knapp, K. P., Kruk, M. C., Levinson, D. H., Diamond, H. J., and Neumann, C. J. (2010). The international best track archive for climate stewardship (IBTrACS): Unifying tropical cyclone data. Bull. Am. Meteorol. Soc. 91, 363–376. doi:10.1175/2009bams2755.1
Knapp, K. R., Diamond, H. J., Kossin, J. P., Kruk, M. C., and Schreck, C. J. (2018). International best track archive for climate stewardship (IBTrACS) project, version 4. NOAA Natl. Centers Environ. Inf. doi:10.25921/82ty-9e16
Knapp, K. R., and Kruk, M. C. (2010). Quantifying interagency differences in tropical cyclone best track wind speed estimates. Mon. Weather Rev. 138, 1459–1473. doi:10.1175/2009mwr3123.1
Knutson, T. R., McBride, J. L., Chan, J., Emanuel, K., Holland, G., Landsea, C., et al. (2010). Tropical cyclones and climate change. Nat. Geosci. 3, 157–163. doi:10.1038/ngeo779
Kossin, J. P., Camargo, S. J., and Sitkowski, M. (2010). Climate modulation of North Atlantic hurricane tracks. J. Clim. 23, 3057–3076. doi:10.1175/2010jcli3497.1
Kossin, J. P., Emanuel, K. A., and Camargo, S. J. (2016). Past and projected changes in western North Pacific tropical cyclone exposure. J. Clim. 29, 5725–5739. doi:10.1175/jcli-d-16-0076.1
Kossin, J. P., Emanuel, K. A., and Vecchi, G. A. (2014). The poleward migration of the location of tropical cyclone maximum intensity. Nature 509, 349–352. doi:10.1038/nature13278
Lee, T.-C., Knutson, T. R., Kamahori, H., and Ying, M. (2012). Impact of climate change on tropical cyclones in the Western North pacific basin. Part I: Past observations. Trop. Cyclone Res. Rev. 1, 213–230. doi:10.6057/2012TCRR02.09
Lee, T.-C., Knutson, T. R., Nakaegawa, T., Ying, M., and Cha, E. J. (2020). Third assessment on impacts of climate change on tropical cyclones in the Typhoon Committee Region – Part I: Observed changes, detection and attribution. Trop. Cyclone Res. Rev. 9, 1–22. doi:10.1016/j.tcrr.2020.03.001
Lee, T., and McPhaden, M. J. (2008). Decadal phase change in largescale sea level and winds in the Indo-Pacific region at the end of the 20th century. Geophys. Res. Lett. 35, L01605. doi:10.1029/2007GL032419
Liu, K. S., and Chan, J. C. L. (2013). Inactive period of western North Pacific tropical cyclone activity in 1998–2011. J. Clim. 26, 2614–2630. doi:10.1175/jcli-d-12-00053.1
Liu, K. S., and Chan, J. C. L. (2008). Interdecadal variability of western North Pacific tropical cyclone tracks. J. Clim. 21, 4464–4476. doi:10.1175/2008jcli2207.1
Lucas, C., Timbal, B., and Nguyen, H. (2014). The expanding tropics: A critical assessment of the observational and modeling studies. WIREs Clim. Change 5, 89–112. doi:10.1002/wcc.251
Mantua, N. J., Hare, S. R., Zhang, Y., Wallace, J. M., and Francis, R. C. (1997). A Pacific interdecadal climate oscillation with impacts on salmon production. Bull. Amer. Meteor. Soc. 78, 1069–1079. doi:10.1175/1520-0477(1997)078<1069:apicow>2.0.co;2
Meehl, G. A., and Arblaster, J. M. (2012). Relating the strength of the tropospheric biennial oscillation (TBO) to the phase of the Interdecadal Pacific Oscillation (IPO). Geophys. Res. Lett. 39, L20716. doi:10.1029/2012GL053386
Meehl, G. A., Hu, A., Arblaster, M. J., Fasullo, J., and Trenberth, K. E. (2013). Externally forced and internally generated decadal climate variability associated with the interdecadal pacific oscillation. J. Clim. 26, 7298–7310. doi:10.1175/jcli-d-12-00548.1
Mei, W., Xie, S.-P., Zhao, M., and Wang, Y. (2015). Forced and internal variability of tropical cyclone track density in the western North Pacific. J. Clim. 28, 143–167. doi:10.1175/JCLI-D-14-00164.1
Peduzzi, P., Chatenoux, B., Dao, H., De Bono, A., Herold, C., Kossin, J., et al. (2012). Tropical cyclones: Global trends in human exposure, vulnerability and risk. Nat. Clim. Change 2, 289–294. doi:10.1038/nclimate1410
Power, S., Casey, T., Folland, C., Colman, A., and Mehta, V. (1999). Inter-decadal modulation of the impact of ENSO on Australia. Clim. Dyn. 15, 319–324. doi:10.1007/s003820050284
Shen, Y., Sun, Y., Zhong, Z., Liu, K., and Shi, J. (2018). Sensitivity experiments on the poleward shift of tropical cyclones over the western North pacific under warming ocean conditions. J. Meteorol. Res. 32, 560–570. doi:10.1007/s13351-018-8047-0
Smith, T. M., and Reynolds, R. W. (2003). Extended reconstruction of global sea surface temperatures based on COADS data (1854–1997). J. Clim. 16, 1495–1510. doi:10.1175/1520-0442-16.10.1495
Sun, Y., Zhong, Z., Li, T., Yi, L., Shi, J., Shen, Y., et al. (2020). Superiority of mega ENSO index in the seasonal prediction of tropical cyclone activity over the western North pacific. Earth Space Sci. 7, e2019EA001009. doi:10.1029/2019ea001009
Sun, Y., Zhong, Z., Yi, L., Li, T., Chen, M., Wan, H., et al. (2015). Dependence of the relationship between the tropical cyclone track and western pacific subtropical high intensity on initial storm size: A numerical investigation. J. Geophys. Res. Atmos. 120, 11451–11467. doi:10.1002/2015jd023716
Wang, B., Liu, J., Kim, H. J., Webster, P. J., Yim, S. Y., and Xiang, B. (2013). Northern Hemisphere summer monsoon intensified by mega-El Niño/southern oscillation and Atlantic multidecadal oscillation. Proc. Natl. Acad. Sci. U. S. A. 110, 5347–5352. doi:10.1073/pnas.1219405110
Wang, C., and Wang, X. (2013). Classifying El Niño Modoki I and II by different impacts on rainfall in southern China and typhoon tracks. J. Clim. 26, 1322–1338. doi:10.1175/jcli-d-12-00107.1
Wang, R., Wu, L., and Wang, C. (2011). Typhoon track changes associated with global warming. J. Clim. 24, 3748–3752. doi:10.1175/jcli-d-11-00074.1
Keywords: tropical cyclones, poleward migration, anthropogenic, natural variability, IPO
Citation: Lv S, Sun Y, Zhong Z and Shen Y (2022) Possible reasons for the migration of tropical cyclone track over the western north pacific: Interdecadal pacific oscillation modulation. Front. Earth Sci. 10:994876. doi: 10.3389/feart.2022.994876
Received: 15 July 2022; Accepted: 08 August 2022;
Published: 01 September 2022.
Edited by:
Shangfeng Chen, Institute of Atmospheric Physics (CAS), ChinaReviewed by:
Chujie Gao, Hohai University, ChinaCopyright © 2022 Lv, Sun, Zhong and Shen. This is an open-access article distributed under the terms of the Creative Commons Attribution License (CC BY). The use, distribution or reproduction in other forums is permitted, provided the original author(s) and the copyright owner(s) are credited and that the original publication in this journal is cited, in accordance with accepted academic practice. No use, distribution or reproduction is permitted which does not comply with these terms.
*Correspondence: Yuan Sun, c3VueXVhbjEyMTRAMTI2LmNvbQ==
Disclaimer: All claims expressed in this article are solely those of the authors and do not necessarily represent those of their affiliated organizations, or those of the publisher, the editors and the reviewers. Any product that may be evaluated in this article or claim that may be made by its manufacturer is not guaranteed or endorsed by the publisher.
Research integrity at Frontiers
Learn more about the work of our research integrity team to safeguard the quality of each article we publish.