 Jun Wang
 Lei Wang
 Qingyang Chen
 Liang Shi3
- 1School of Urban Railway Transportation, Shanghai University of Engineering Science, Shanghai, China
- 2Department of Civil and Environmental Engineering, The Hong Kong Polytechnic University, Kowloon, Hong Kong SAR, China
- 3Shanghai SMI Raw Water Co., Ltd., Shanghai, China
To investigate the effect of excessive stacking loadings on the deformation of raw-water pipelines, a model test was designed based on the analogous theory in this paper. The design of the model box, selection of pipeline material, and preparation of remolded soil were conducted, respectively. A theoretical formula was derived to convert the results of the model test into actual ones. Then, the field test data and three-dimensional numerical values were employed to verify the correctness of the model test results. Finally, the stresses of pipelines were discussed under different loading conditions, pipe diameters, buried depths, and compactness of underlying soils, and the guidelines for pipeline protection were proposed based on the results of the model tests. It can lay a solid theoretical and practical foundation for the protection of buried pipelines.
Introduction
Due to the advantages of convenient, safe, and effective transmission, urban buried pipelines play an important role in the field of natural resources transmission and electronic information dissemination. During the operation of the raw-water pipeline, the nearby overloads of construction, vehicles, or excessive stacking soils induce additional deformation and stress in buried pipelines, which will result in the stress concentration, deformation, and displacement of the local pipelines, and lead to frequent pipe explosion accidents. According to the records of leakage reporting and emergency repair of the raw water company over the years, the leakage of the raw water transmission pipeline is not optimistic. Some buried pipelines are often damaged and leaked in use, and a lot of manpower and material resources are spent on maintenance. Obviously, this situation is not compatible with the development prospect of the underground pipeline. However, how the overload influences the safe operation of the buried pipelines is not clear, and the protection of the buried pipelines is always according to the engineers’ experiences. Therefore, there is a high demand for engineers and researchers to give detailed and reliable experimental data and propose a guideline for the protection of the buried pipelines based on the model test.
For the mechanical property of buried pipelines, many studies were performed focusing on the stress and deformation of pipelines (Marston, 1930; Spangler, 1948; White, 1961; Newmark, 1975; Parmelee and Cai, 1975; Hindy and Novak, 1979). In the early 20th century, Marston (Marston, 1930) initially studied the calculation method of vertical earth pressure acting on slotted buried pipes, then Spangler (Spangler, 1948) proposed Marston-Spangler’s theory. Newmark (Newmark, 1975) studied the underground pipe-soil interaction by ignoring the effect of inertia force as the pipelines and soils were in motion together.
To verify the effectiveness of the above theorized and conclusions, some scholars began to study the stress characteristics of buried pipelines utilizing theoretical and experimental methods (Matyas and Davis, 1983b; Matyas and Davis, 1983a; Shmulevich et al., 1986; Dasgupta and Sengupta, 1991; Terzi et al., 2010). Matyas and Davis (Matyas and Davis, 1983b; Matyas and Davis, 1983a) calculated the overburden pressure on the buried pipeline and compared the on-site measured pipeline data with overburden pressure through theoretic analysis. The analysis showed that the theoretically calculated vertical overburden pressure was underestimated. Itzhak et al. (Shmulevich et al., 1986) studied the normal and tangential forces of rigid and flexible pipes by indoor model tests and concluded that the tangential force of soils around the buried pipe cannot be ignored. Dasgupta and Sengupta (Dasgupta and Sengupta, 1991) conducted large-scale model tests to analyze the changes in mechanical properties of pipelines. It can be found that the model test results were similar to the numerical calculation, and the stress acting on the pipeline was lower than the calculated value of traditional theory due to the soil-pipe interaction. Terzi (Terzi et al., 2010) investigated the mechanical properties of pipelines under the action of surcharge by indoor model tests. The results revealed that the density of backfill soil around the buried pipes and the installation process have significant effects on the mechanical properties and deformation characteristics of the pipelines. In recent years, with the development of the numerical simulation technique, more and more factors were considered to study the stress characteristics of buried pipelines (Meesawasd et al., 2016; Zhang et al., 2016; Abbas, 2017; Pires and Palmeira, 2017; Zhang and Xie, 2019; Pan et al., 2021; Bai et al., 2021; Wang et al., 2022; Fan et al., 2022; Dong et al., 2022).
Therefore, great achievements have been made in the research on the stress characteristics of buried pipelines under loads. The main research methods are theoretical calculation and numerical simulation. However, the results obtained by these methods are different from the actual stress situation of the buried pipelines. In the field of the raw-water pipeline, the cases studied by test methods are very limited; therefore, after comprehensively considering the factors, such as cost and time, the stress characteristics of raw water pipelines under loading conditions are decided to be studied by performing an indoor physical model test. A variety of working conditions are designed to simulate the influence of different factors, such as loading position, un-uniform foundation, buried depth, and diameter of the pipe. At the same time, the model test data are compared with the numerical simulation results and the data of the field test to verify the effectiveness of the results. Through the test results and corresponding analysis, suggestions for the protection of underground pipelines are put forward.
Model experiment
Theoretical analysis of model test similarity ratio
Through the on-site investigation and related experimental data concerning the raw-water pipeline, the following basic physical parameters involved in the model test were determined.
1) Physical properties of soils: water content
2) Physical parameters of the pipeline: pipe diameter D, wall thickness d, stiffness EI.
3) Dependent variable: circumferential deformation of pipeline P.
According to Buckingham’s theorem, there are a total of 10 physical parameters, they are,
The similarity theory is a prerequisite for determining the design of the model test. To calculate the data results of the prototype through the data measured in the model test, the corresponding mathematical formula is given as follows:
According to the differential equation of thin plate bending in elastoplastic mechanics, it has,
The transverse uniformly distributed force of the thin plate structure is q, the deflection is w, and the bending rigidity is Q. The expansion of Eq. 1 in the rectangular coordinate system is,
Setting the geometric similarity constant
As the material selected in this model test is different from the prototype material, that is
According to the stress expression of thin plate bending in elastoplastic mechanics, we have,
where z is the coordinate in the thickness direction of the thin plate, the surface force and volume force acting in the z direction are equivalently shifted to the plate surface (z =− h/2), the following expression can be obtained, substituting Eq. 4 into (5) yields,
Formula (6) can be regarded as the conversion formula between the stress of the model pipeline and the prototype one. The formula will be used to calculate the model test data with the field test data.
Design of the model box and preparation of the test materials
Referring to the relevant literature (Lee and Rowe, 1990; Lee and Rowe, 1991; Mroueh and Shahrour, 2008), it is known that the disturbance range of a large-diameter buried pipeline is within the range of 4 times the diameter in the horizontal direction and 3 times the diameter in the vertical direction, respectively. The outer diameter of the raw-water pipeline in the practical engineer adopted here is 2.4 m. According to the geometric similarity ratio determined in section 2.1, the outer diameter of the pipeline in the model test is 80 mm. Therefore, the area of 0.32 m on the left and right sides (4 times the diameter) and 0.24 m below the pipeline (3 times the diameter) is the disturbance range, and the size of the designed model box should be greater than the disturbance range. To meet this requirement, the size of the model box used in this test had a dimension of
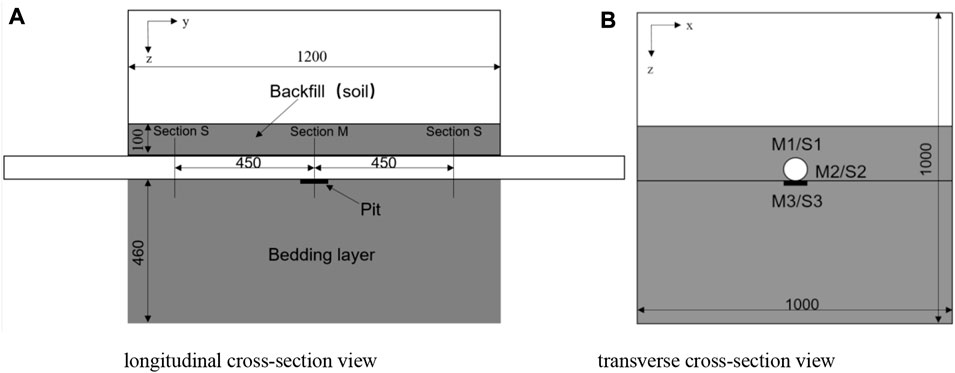
FIGURE 1. A schematic diagram of the model box. (A) longitudinal cross-section view (B) transverse cross-section view.
The natural soil samples were obtained from the buried pipe site, then a series of works such as drying, crushing, and screening was carried out (Xue et al., 2021). The filling was compacted in layers with a thickness of 50 mm to make the physical properties of the remolded soils consistent with the prototype soils. To ensure that the physical parameters of remodeled soil meet the requirements of the test design, the density test, the direct shear test, and the consolidation compression test was performed on the remolded soil samples. Through indoor soil mechanics tests, we know that the measured remodeled soils have w = 30%, γ = 20 kN/m3, c = 12 kPa, φ =20°, ES = 3.4 MPa, the specific test equipment are shown in Figure 2. Referring to the pipelines selected in the buried pipe model test in reference (Lee et al., 2010; Alotaibi et al., 2021), and the given similarity ratio in section 2.1, the PVC pipe (Figure 3) is used in this study.
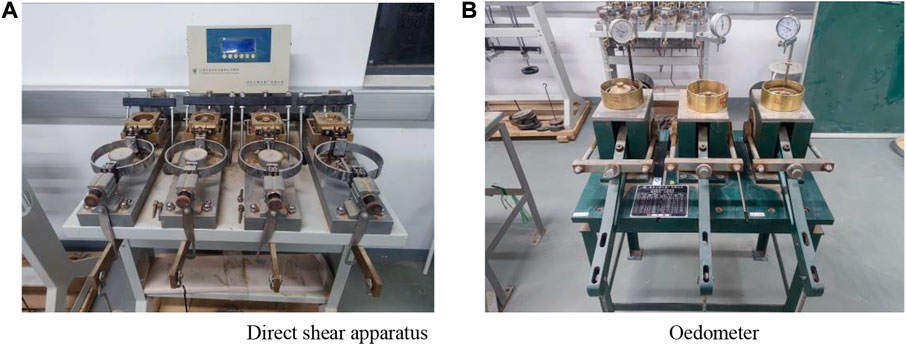
FIGURE 2. Indoor experimental equipment. (A) Direct shear apparatus (B) Oedometer.
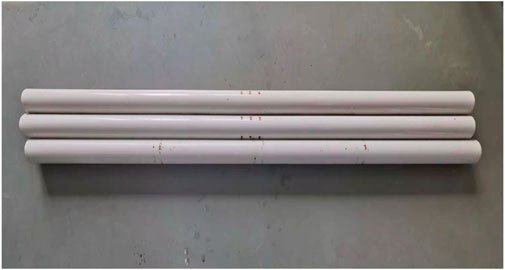
FIGURE 3. PVC pipelines.
The layout of the model pipeline stress measurement points
The strain gauges are pasted on the central section and the section 450 mm from the center, respectively. Section M on the pipeline represents the center section, and section S represents the edge section of the pipe. In addition, the top, middle, and bottom of each section are marked as 1, 2, and 3. Taking section M as an example, the axial and circumferential points of the pipe top are marked as M1, and M1’, and the labels of strain gauge at other positions are shown in Figure 4.
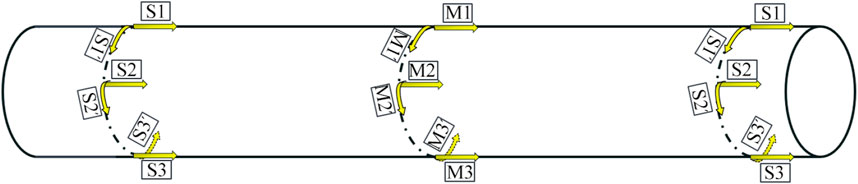
FIGURE 4. A schematic diagram for the arrangement of strain gauges at a pipe.
Model test process
1) Soil fill: The sampled prototype soils are dried, ground, and sieved. The maximum particle size is controlled under 3 mm. Pouring the dried soils into the soils box and adding appropriate water aims to keep the same water content as that of the on-site soils around the pipelines. The density, direct shear, and consolidation tests were conducted to measure the density, cohesion, internal friction angle, and compressive modulus of the remolded soils.
2) Paste strain gauge: Firstly, the measuring point on the outer wall of the pipeline should be leveled and cleaned, and the strain gauge should be pasted on the PVC pipeline at the position marked in advance. Before mounting gauges, a little 502 glue was dropped to the patch position and then applying it evenly to the pipeline. In the process of pasting the strain gauge, the surface of the strain gauge is covered with a layer of transparent plastic paper, excess colloids and bubbles inside the strain gauge should be discharged. The strain gauges are respectively arranged in the axial and circumferential directions. Before and after pasting the strain gauge, its resistance value (The strain gages had a resistance of 350 Ω.) should be tested with a multimeter respectively to ensure the finiteness of the strain gauge. Finally, a layer of 704 silica gel around the strain gauge is applied for sealing.
3) Pipe placing and backfill: It was terminated when the soil was filled to the bottom of the pre-buried PVC pipeline, then the PVC pipe pasted with strain gauges was inserted in advance into the designated position through the opening of the model box. The strain gauges were connected to the data acquisition instrument (TST3822EN static strain test analysis system), then the box was filled to the desired level in layers. Finally, a loading plate was emplaced in the middle of the soil surface.
4) Data acquisition: After placing designed weights on the loading plate, the acquisition instrument was debugged and self-balanced. In this test, each instrumented point on the pipeline had two strain gauges to form a quarter bridge three-wire circuit. Some details about the experimental process are shown in Figure 5.
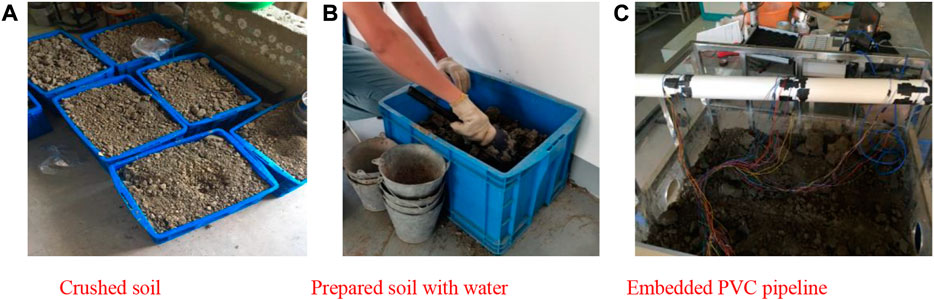
FIGURE 5. Experimental process details. (A) Crushed soil (B) Prepared soil with water (C) Embedded PVC pipeline.
To simulate the effect of excessive loads on the stress and deformation of model pipes with different diameters, the actual load area is obtained by the on-site investigation of the range and height of the existing stacking soils near the pipelines. Based on the designed similarity ratio, the range and value of the applied loads in the model test were obtained, as shown in Table 1. A rectangular loading steel plate with a thickness of 5 mm, length of 0.9 m, and width of 0.55 m is designed to apply the external loading. During the test, the different locations of external loads can be realized by moving the rectangular plate. According to several on-site heights of stacking soils around the buried pipes, the actual heights of stacking soil layers of 3, 6, and 9 m are considered in this model test. The average weight of the actual covering soils is
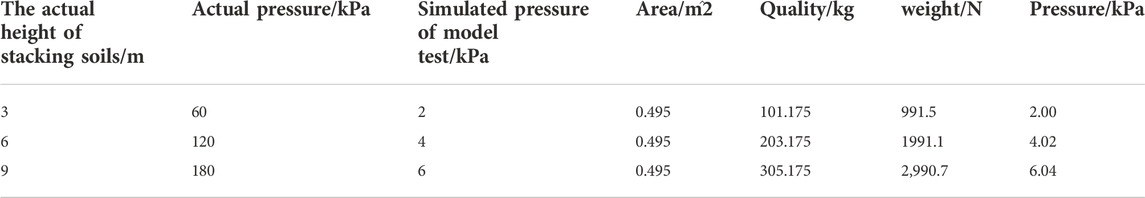
TABLE 1. Conversion of loading values in modeling tests.
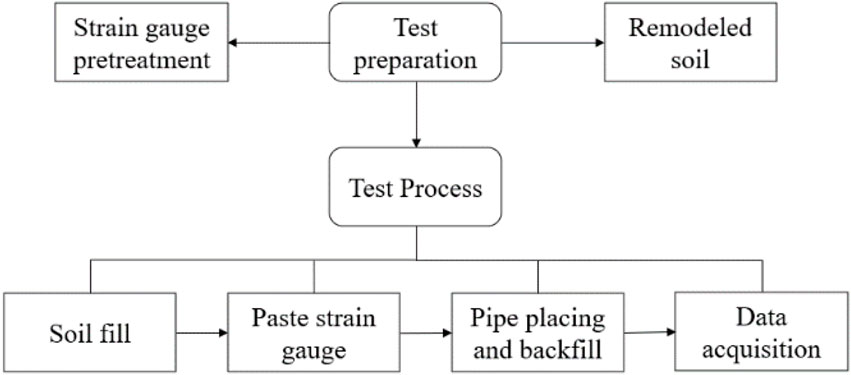
FIGURE 6. Test procedure.
Model test conditions
Many factors can lead to raw-water pipeline damage. Considering the test conditions and feasibility, this paper selects four main factors as the research objects and designs different working conditions (Table 2) for each factor to study the stress characteristics of the buried pipeline. Each group of tests is described in detail below.
1) Stacking position: Two working conditions of central and non-central loadings (working conditions 1 and 2) are performed to study the influence of different loading positions on the stress of the pipe.
2) Pipe diameter: To study the stress variation characteristics of the pipe with different diameters under the stacking loading, it is proposed to analyze the stress characteristics of the pipe with three different diameters of 1.2, 2.4, and 3.6 m. According to the principle of similarity ratio, the pipe diameters in the model test are 40, 75, and 110 mm (working conditions 3, 4, and 5).
3) Depth: Taking the actual buried depth of the raw-water pipeline as the engineering background, the buried depth of the pipe is from 2 to 10 m. According to the similarity ratio of 1/30, the buried depth of the model test pipeline is about 70–340 mm, so the buried depths of the pipeline are adopted as 100, 200, and 300 mm, respectively (working conditions 6, 7, and 8).
4) Non-uniform foundation: According to the investigation of the site construction, the length of the uneven foundation under the pipeline ranges from 0.6 to 5 m, the width is about 3 m, and the maximum depth is 0.4 m. Since the diameter of the raw-water pipeline is 2.4 m, the uneven foundation width in this model test is 1.2D, the depth is 0.2D, and the length is 1D, where D is the outer diameter of the pipeline. To simulate the non-uniform foundation, the pit with dimensions of 1D (length) Ⅹ 1.2D (width) Ⅹ 0.4D (height) is dug out in the center of the model box, as shown in Figure 1. It can be inversely calculated that the pit corresponds to the actual collapse area with 2.4 m (length), 2.8 m (width), and 0.96 m (height). Filling standard sand or air (working conditions 10, and 11) into the pit respectively can simulate the local weak layer or non-uniform foundation under the pipeline.
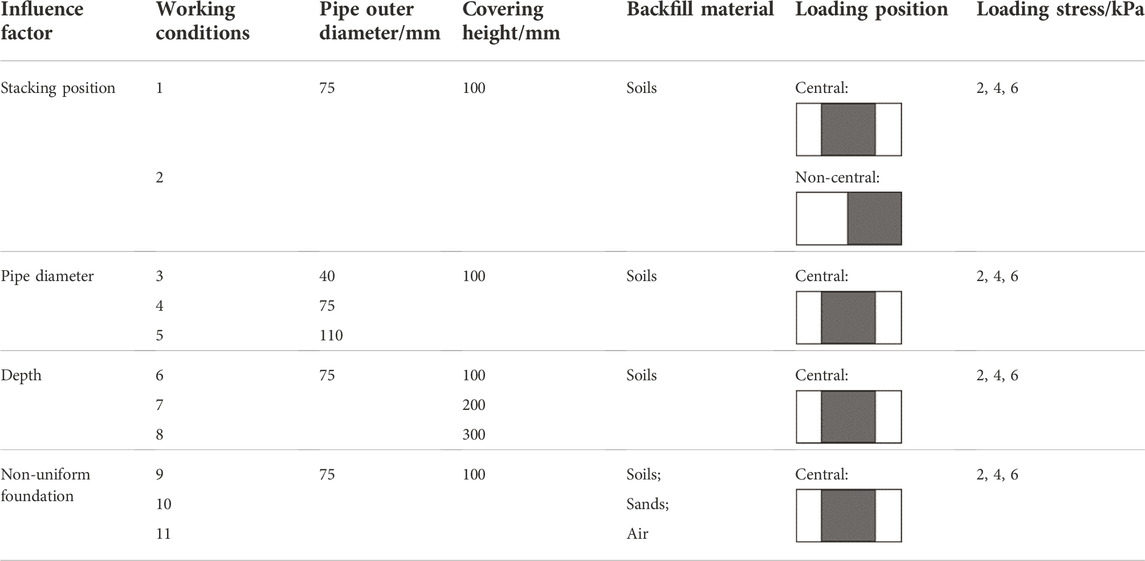
TABLE 2. Testing conditions.
Verification
Finite element model introduction
The accuracy of the test results is firstly verified by the numerical simulation of the buried pipeline under different working conditions, the finite element model, and corresponding results are shown in Figure 7. The model involves the definition of two kinds of material properties, soil, and PVC pipe. For the simulation of soil, the Mohr-Coulomb model is adopted and the material properties of the soil are defined according to the cohesion (12 kPa), internal friction angle (20°), and compression modulus (3.4 Mpa) of the remodeled soil. The elastic modulus and Poisson’s ratio of PVC material are set to 3.2 GPa and 0.3, respectively. Mesh generation has an important impact on accuracy, so the model uses a larger grid to divide a large volume of soil, and a smaller grid size when near the pipeline.
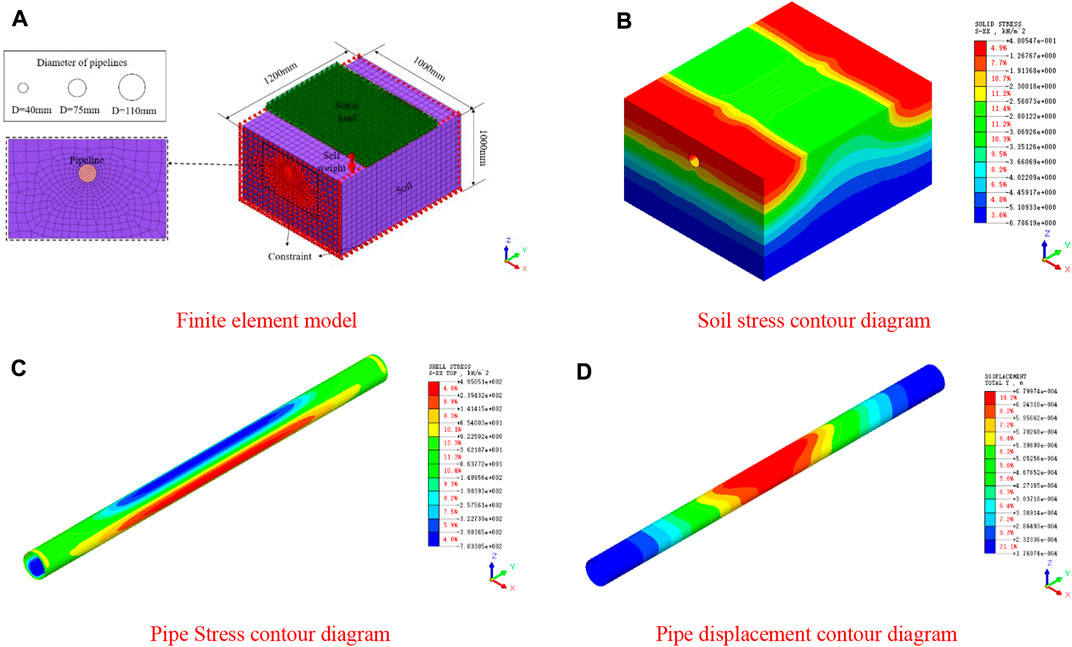
FIGURE 7. Finite element model and contour diagrams.(A) Finite element model (B) Soil stress contour diagram (C) Pipe Stress contour diagram (D) Pipe displacement contour diagram
According to the actual situation of the site, the boundary of the model is set as follows: only displacement constraints perpendicular to the surface are applied to the four sides and bottom surfaces of the soil, for PVC pipelines, the displacement constraint in the circular surface is set on the circumference of the pipeline-soil interface to release the axial displacement of the pipeline.
Comparison of experimental and numerical results
Comparing the calculated stress under different working conditions in the finite element simulation and the measured value of the model test(see Table 3 Figure 8), it can be found that the stress values of the two methods are close, demonstrating the reliability of the model test results.
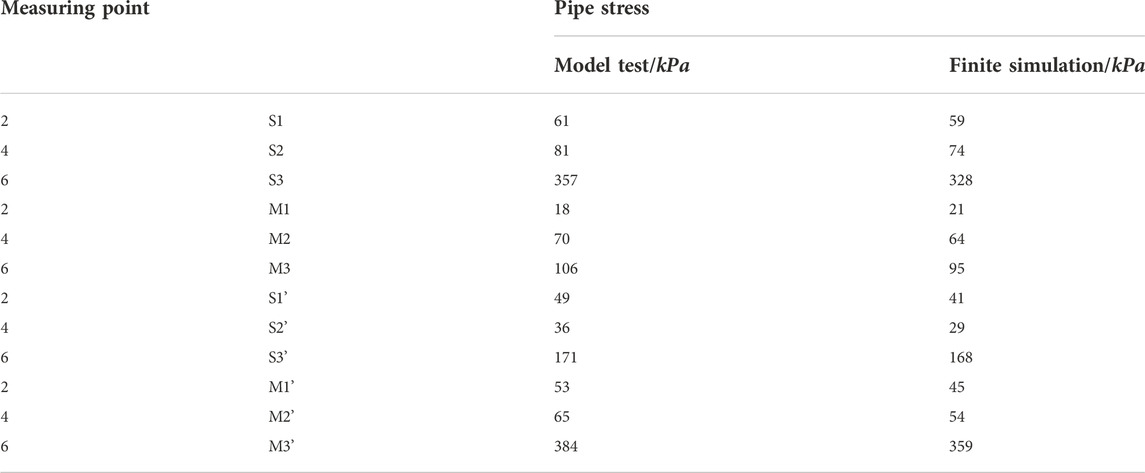
TABLE 3. Finite simulation and measured values.
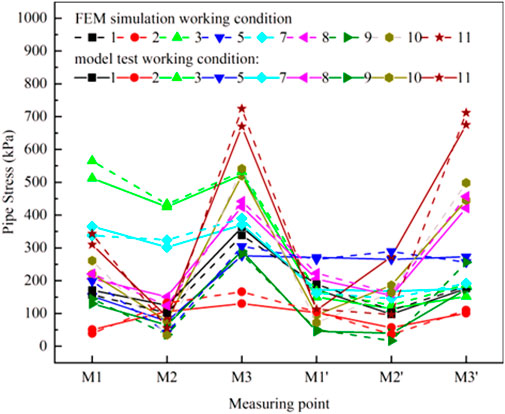
FIGURE 8. Comparison of finite element values and measured stress values.
Comparison between field test data and converted stress of the model test
A Q235 steel pipe with an outer diameter of 2.4 m and wall thickness of 2.4 mm is used for the field test, and its elastic modulus is 209 GPa. A WY100A-SJ excavator is used for ground pressure loading (Figure 9), and its self-weight is 25t. The static weight of the excavator is taken as the ground pressure load, and the situation of the excavator’s empty shovel resting above the pipeline (25t) corresponds to the working condition 2 under 6 kPa loads (see Table 2). The actual pipeline stress value calculated theoretically is compared with the results of the field as shown in Table 4 and Figure 10.
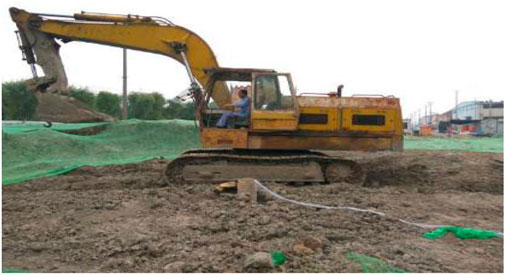
FIGURE 9. On-site field test.
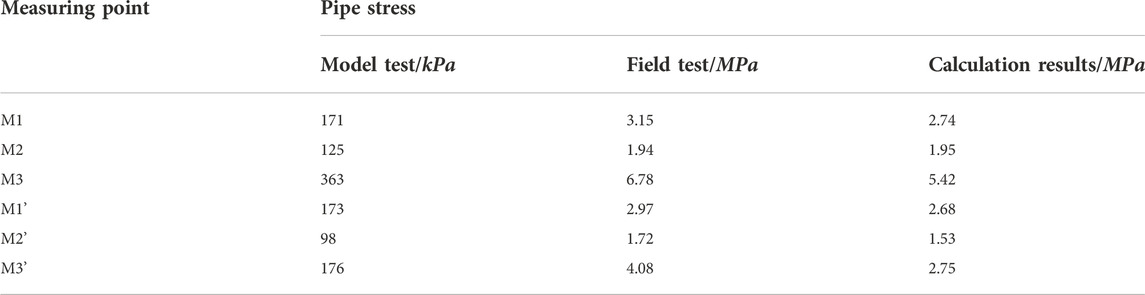
TABLE 4. Comparison between field test stress and theoretical calculation.
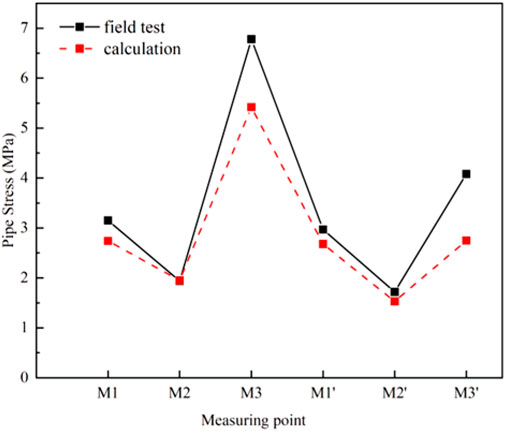
FIGURE 10. Comparison of field test values and theoretical calculation results under 6 kPa load.
It can be seen from Figure 10 that the data of the field test is consistent with that of the model test, and the error column is less than 20%. However, the measured value is generally greater than the converted results of the model test. Therefore, the method of obtaining the actual pipeline stress through the converted formula of Eq. 6 is feasible and also verifies the reliability of the model test.
Analysis of test results
Impact of different stacking positions on the pipeline
Figure 11 presents the influences of the central loading on pipeline stress. The stress of the pipeline went up when the applied load was from 2 to 6kPa, the maximum stress appears at the bottom of the pipeline, followed by the top of the pipeline, and finally the waist. Under the same load, the stress value of the pipeline in both axial and circumferential decreased as the measuring position is farther from the loading area; secondly, the axial stress values at the same measuring point of the pipeline were higher than the circumferential stress values. It can be inferred that when the pipeline is bent and damaged, the axial tensile effect of the pipeline will be the dominant factor.
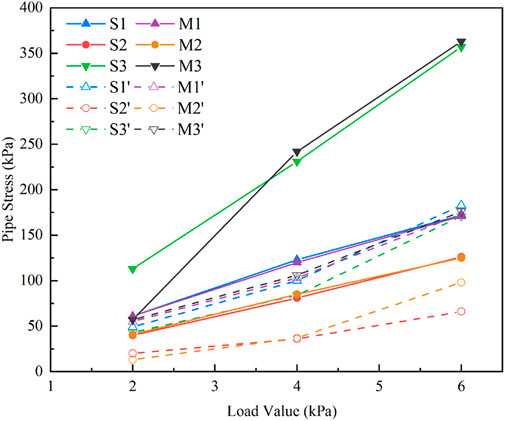
FIGURE 11. Pipeline stress at each point under the central loading.
The above conclusions are also applicable in the case of the non-central load, but when the loading position changes from central load to non-central load, the failure mode dominated by axial stress is no longer prominent (see Figure 12). Under the non-central load, the stress value of the section near the load is greater than that far away from the load. For example, under the 6 kPa load, M2 is 70 kPa, while S2 stress value is only 32 kPa. And the stress values of the pipeline under the central load were generally greater than under the non-central load, when the load was 6 kPa, the M3 stress value in Figure 11 is 363 kPa, and the corresponding one in Figure 12 is 130 kPa.
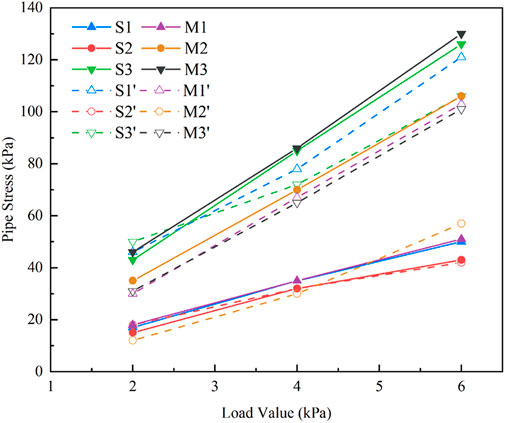
FIGURE 12. Pipeline stress at each point under the non-central loading.
It can be seen from Figure 11 that the stress values at the pipeline edge section(S section) were almost the same as that at the central section(M section) of the pipeline under the central loading, and as the loads continuously increase, the stress values growth rate is approximately the same, too. When the load increases from 4 to 6 kPa, the stress value of M2 elevates by 44% whereas the stress value of M3 raised by 50% (Figure 11). At the beginning of the loading (from 0 to 2 kPa), the soil at the bottom of the pipe edge failed to fully settle, resulting in the value of S3 being significantly higher than that of M3. With the continuous loading, the difference is gradually eliminated after the soil is settled.
Figure 13 compares the pipeline stress at the central section (M) of central loading with the non-central section. For the same measuring point (in the M section), the pipeline stress value under the central load is generally higher than that under the non-central load. However, it should be noted that the effect of changing the load position on the pipeline waist is almost negligible. For the pipeline top and bottom, the pipe stress under the central load is much greater than that of the non-central load. For example, when the load value is 6 kPa, the stress at M1 under central load is 3.35 times the non-central load while at M3 is 2.79 times. The results suggest that in the raw-water pipeline protection, the existence of heavy load directly above the pipeline should be avoided as far as possible.
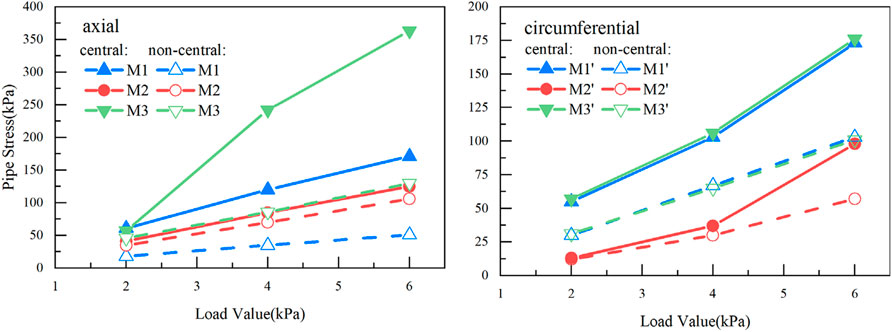
FIGURE 13. Comparison of the pipeline stress at section M under the central and non-central loadings.
Impact of multiple diameters
Axial stress loading of 40, 75, and 110 mm diameter pipeline under central at M section and S section are shown in Figures 14, 15, respectively. Under the same load, the pipeline stress dropped as the diameter of the pipeline increased. When applied 4 kPa load, the stresses of 40, 75, and 110 mm diameter pipeline at M1 were 336, 120, and 106kPa, respectively (see Figure 14). Under the load value of 6 kPa, the S1 stress of the pipe with a 40 mm diameter is 503 kPa, while the S2 stress value reaches 417 kPa (Figure 15).

FIGURE 14. Pipeline axial stress of different pipe diameters of section M.
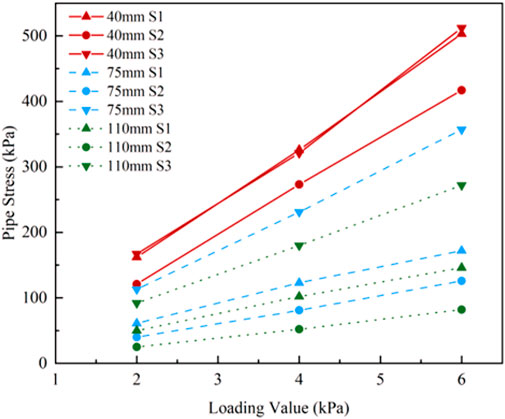
FIGURE 15. Pipeline axial stress of different pipe diameters of section S.
The growth trend of the three measuring points (M1, M2, and M3) under the same diameter is the same (Figure 14), so taking M1 for example, when the load increased from 4 to 6kpa, the stress of the three diameter pipeline increases by 53% (40 mm), 44% (75 mm), 42% (110 mm), respectively. The results suggest that the pipeline stress increases with the pipe slenderness, which is defined as the ratio of the pipe diameter to thickness (Saadoon et al., 2006; Yu et al., 2019). Meanwhile, this result agrees with the existing work Marzouck and Sennah (2002).
The stress of the M section when a 6 kPa load acts on multiple diameter pipelines is depicted in Figure 16. Pipeline axial stress decreased when the diameter size was from 40 to 110 mm while the circumferential stress is on the contrary. With a diameter of 110 mm, the circumferential stress values at the top and waist of the pipeline are greater than those in the axial direction, this finding can be indicated that the main failure mode of the pipeline may gradually change from tensile failure to torsion failure.
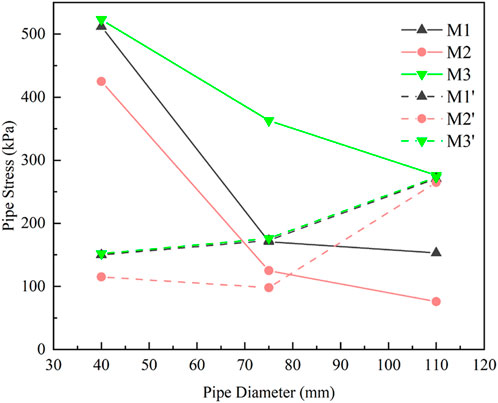
FIGURE 16. Comparison of pipeline stress at M section under different pipe diameters.
Impact of different depths
Axial stress of pipeline under 6 kPa loads at different buried depths (100, 200, and 300 mm) are shown in Figure 17. The pipeline stress at S1 under 100, 200, and 300 mm is 172, 376, and 205kPa, respectively; while the value at M2 is 125, 302, and 151kPa, respectively (see Figure 17). The result indicates that as the buried depth increase, the pipeline stress at top and waist increased initially and then decreased, while the stress at the bottom of the pipe continuous increasing. When the ratio of buried depth thickness to pipe diameter tends to 3 (200 mm depth), the pipeline stress reaches the maximum, and the “soil arching phenomenon” around the pipe top begins to appear.
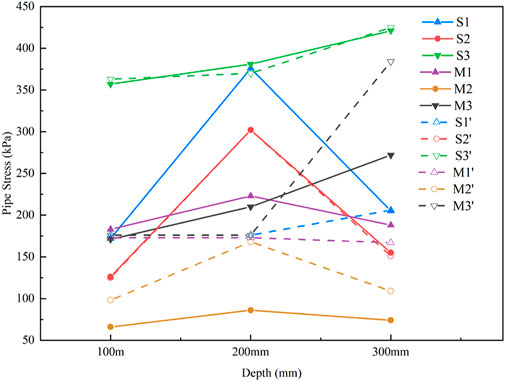
FIGURE 17. Stress of pipeline at different buried depths under 6 kPa loads.
Figure 18 shows the pipeline axial stress of the M section at different depths, it is clear that the variation of the pipeline stress value is consistent with that in Figure 17. When the buried depth is 100 mm, from 2 to 4 kPa, the M3 stress value increases from 57 to 242 kPa, an increase of 325%; while the load was from 4 to 6 kPa, the increase fell to 50%. Similarly, when the burial depth is 300 mm, the stress growth rates are 243 and 42%, respectively. Although the stress growth rate decreases with increasing stacking distance, the influence of burial depth on pipeline stress cannot be ignored.

FIGURE 18. Pipeline axial stress of M section at different buried depths.
Impact of non-uniform foundation
Figure 19 shows the pipeline stress of the M section under different compactness conditions (backfill material). The stress value of the pipeline decreased when the compactness rose, and M3 stress under the condition of virtual laying (sand) is about 2.7 times larger than that under the compaction condition (soil), and the M3 stress value under the suspension (air) is 4.2 times larger than that at the compaction condition (see Figure 19). The pipeline axial stress of the M section under multiple compactness conditions is shown in Figure 20.
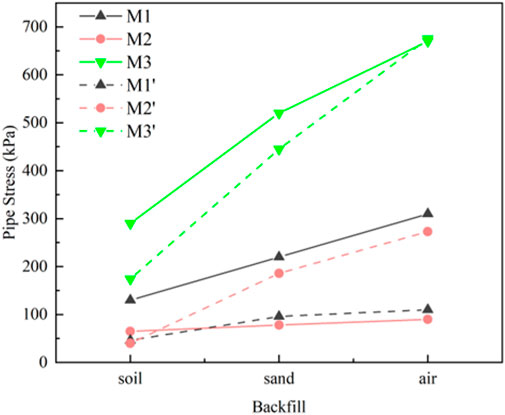
FIGURE 19. Stress at the pipeline M section with different backfill under 6 kPa loads.
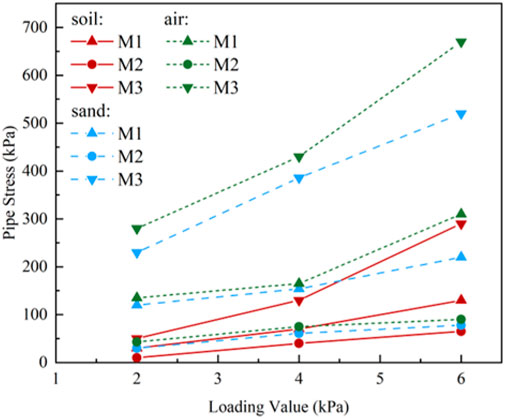
FIGURE 20. Axial stress of pipeline central section with different compactness conditions.
It is found that when the loading value is small (0–2 kPa), the stress value measured in the suspension condition (air) is close to that of the virtual laying condition (sand). With the continuous increase of the loading value, the gap between these two conditions is widening, which is because in the initial stage of loading, the phenomenon of ‘pipe soil separation’ may occur as the pipe bottom is suspended. In the later stage of loading, the compressible space of sand decreases continuously, which leads to the obstruction of pipeline deformation. Therefore, the gap was getting more significant compared with the value under suspended conditions.
Conclusion
In this paper, the mechanical characteristics of the raw water pipeline under excess stacking loading are studied by a set of model tests, and the correctness of the results of the model test is verified by finite element analysis and on-site field data. The main conclusions are as follows:
1) Under the same load, the axial stress values at the same measuring point of the pipeline were higher than the circumferential stress values in both central load and non-central load, and the pipeline bottom (M3) experienced the largest stress. This implies that the pipeline damage and leakage are mainly due to the axial tensile effect of the pipeline.
2) The pipeline stress fell as the size of the pipeline diameter increased, and the pipeline stress rose as the slenderness of pipes increased; With the increase of buried depth, the pipeline stress firstly increased and then decreased due to the ‘soil arching phenomenon’. When the buried depth of the pipeline is greater than 200 mm, the impact of the surcharged load on the pipeline is gradually reduced.
3) The compactness of the foundation has a great influence on the stress value of the pipeline, and the stress value of the pipeline is lower when the compactness is higher. It is necessary to pay more attention to the quality monitoring of the bottom of the pipe during the laying period.
4) To prevent the damage to the pipeline induced by the ground load, it is important to strengthen the safety monitoring, and properly increase (buried depth/pipeline diameter>3) the buried depth of the pipeline. More attention should be paid to the influence of tensile stress at the bottom of the pipe, especially the protection at the weld.
5) There are still some problems needed to be studied in the future: the soil layer used in the model test is uniform, while the soil at the site is layered, and the mechanical properties of different soil layers may differ. In addition, due to the limitation of test equipment and time, the influence of internal water pressure in the actual raw-water pipeline is not considered in the model test, which has a certain impact on the accuracy of the test data.
Data availability statement
The datasets presented in this study can be found in online repositories. The names of the repository/repositories and accession number(s) can be found in the article/supplementary material.
Author contributions
JW: model test, formal analysis, investigation, writing—original draft. LW: conceptualization, methodology, investigation, supervision, writing—review and editing. QC: investigation, review and editing. LS: review and editing. JZ: review and editing.
Funding
The authors would like to express great gratitude to the National Nature Science Foundation of China (Grant No. 12172211).
Conflict of interest
Authors LS and JZ were employed by the company Shanghai SMI Raw Water Co., Ltd.
The remaining authors declare that the research was conducted in the absence of any commercial or financial relationships that could be construed as a potential conflict of interest.
Publisher’s note
All claims expressed in this article are solely those of the authors and do not necessarily represent those of their affiliated organizations, or those of the publisher, the editors and the reviewers. Any product that may be evaluated in this article, or claim that may be made by its manufacturer, is not guaranteed or endorsed by the publisher.
References
Abbas, B. J. (2017). Parametric studies of reducing applied stress on buried PVC pipes using finite element. Muthanna J. Eng. Technol.(MJET) 5 (2), 21–29.
Alotaibi, E., Omar, M., Shanableh, A., Zeiada, W., Fattah, M. Y., Tahmaz, A., et al. (2021). Geogrid bridging over existing shallow flexible PVC buried pipe–Experimental study. Tunn. Undergr. Space Technol. 113, 103945. doi:10.1016/j.tust.2021.103945
Bai, X.-D., Cheng, W.-C., and Li, G. (2021). A comparative study of different machine learning algorithms in predicting EPB shield behaviour: A case study at the xi’an metro, China. Acta Geotech. 16 (12), 4061–4080. doi:10.1007/s11440-021-01383-7
Dasgupta, A., and Sengupta, B. (1991). Large-scale model test on square box culvert backfilled with sand. J. Geotech. Engrg. 117 (1), 156–161. doi:10.1061/(asce)0733-9410(1991)117:1(156)
Dong, Y., Cui, L., and Zhang, X. (2022). Multiple-GPU parallelization of three-dimensional material point method based on single-root complex. Int. J. Numer. Methods Eng. 123 (6), 1481–1504. doi:10.1002/nme.6906
Fan, N., Jiang, J., Dong, Y., Guo, L., and Song, L. (2022). Approach for evaluating instantaneous impact forces during submarine slide-pipeline interaction considering the inertial action. Ocean. Eng. 245, 110466. doi:10.1016/j.oceaneng.2021.110466
Hindy, A., and Novak, M. (1979). Earthquake response of underground pipelines. Earthq. Eng. Struct. Dyn. 7 (5), 451–476. doi:10.1002/eqe.4290070506
Lee, H. D., Kwak, P. J., and Lee, J. Y. (2010). Evaluating durability and burying characteristic of PVC pipe. Mater. Sci. Forum 658, 224–227. doi:10.4028/www.scientific.net/msf.658.224
Lee, K., and Rowe, R. (1991). An analysis of three-dimensional ground movements: The thunder bay tunnel. Can. Geotech. J. 28 (1), 25–41. doi:10.1139/t91-004
Lee, K., and Rowe, R. (1990). Finite element modelling of the three-dimensional ground deformations due to tunnelling in soft cohesive soils: Part I—method of analysis. Comput. Geotech. 10 (2), 87–109. doi:10.1016/0266-352x(90)90001-c
Marston, A. (1930). “The theory of external loads on closed conduits in the light of the latest experiments,” in Highway research board proceedings (Washington, D.C.: Highway Research Board), 9, 138–170.
Marzouck, M., and Sennah, K. (2002). “Concrete-filled PVC tubes as compression members,” in Composite materials in concrete construction: Proceedings of the international seminar. Editors R. K. DHIR, K. A. PAINE, and M. D. NEWLANDS (Scotland, UK: Thomas Telford Publishing, University of Dundee), 31–37.
Matyas, E. L., and Davis, J. B. (1983a). Experimental study of Earth loads on rigid pipes. J. Geotech. Engrg. 109 (2), 202–209. doi:10.1061/(asce)0733-9410(1983)109:2(202)
Matyas, E. L., and Davis, J. B. (1983b). Prediction of vertical Earth loads on rigid pipes. J. Geotech. Engrg. 109 (2), 190–201. doi:10.1061/(asce)0733-9410(1983)109:2(190)
Meesawasd, N., Boonyasiriwat, C., Kongnuan, S., and Chamchod, F. (2016). “Finite element modeling for stress analysis of a buried pipeline under soil and traffic loads,” in Proceedings of the 2016 IEEE International Conference on Industrial Engineering and Engineering Management, Bali, Indonesia, 4–7.
Mroueh, H., and Shahrour, I. (2008). A simplified 3D model for tunnel construction using tunnel boring machines. Tunn. Undergr. Space Technol. 23 (1), 38–45. doi:10.1016/j.tust.2006.11.008
Newmark, N. M. (1975). “Pipeline design to resist large fault displacement,” in Proceedings of US national conference on earthquake engineering, 416–425.
Pan, C., Lin, X., and Shi, T. (2021). Study on safety analysis of raw water pipe under large section bored tunnel of shallow buried excavation. IOP Conf. Ser. Earth Environ. Sci. 861, 072056. doi:10.1088/1755-1315/861/7/072056
Parmelee, R. A., and Cai, L. (1975). “Seismic soil-structure interaction of buried pipelines,” in Proc. U.S. national conf: earthquake eng, 406–415.
Pires, A. C. G., and Palmeira, E. M. (2017). Geosynthetic protection for buried pipes subjected to surface surcharge loads. Int. J. Geosynth. Ground Eng. 3 (4), 30–11. doi:10.1007/s40891-017-0109-3
Saadoon, A. S., Abbas, A. M., and Khalaf, A. A. (2006). A survey of studies on plastic tubes confined plain concrete as compression members. J. Eng. Appl. Sci. 14, 2468–2477.
Shmulevich, I., Galili, N., and Foux, A. (1986). Soil stress distribution around buried pipes. J. Transp. Eng. 112 (5), 481–494. doi:10.1061/(asce)0733-947x(1986)112:5(481)
Spangler, M. (1948). Underground conduits-An appraisal of modern research. Trans. Am. Soc. Civ. Eng. 113 (1), 316–345. doi:10.1061/taceat.0006164
Terzi, N. U., Dusunceli, N., Yilmazturk, F., and Yildirim, S. (2010). “Evaluation of installation quality on polyethelene pipe performance under surcharge loads,” in AIP Conference Proceedings, American Institute of Physics, Ischia, Italy. Editors A. D’AMORE, D. ACIERNO, and L. GRASSIA, 55–57.
Wang, J., Cao, A., Wu, Z., Sun, Z., Lin, X., Sun, L., et al. (2022). Numerical simulation on the response of adjacent underground pipelines to super shallow buried large span double-arch tunnel excavation. Appl. Sci. 12 (2), 621. doi:10.3390/app12020621
Xue, Z.-F., Cheng, W.-C., Wang, L., and Song, G. (2021). Improvement of the shearing behaviour of loess using recycled straw fiber reinforcement. KSCE J. Civ. Eng. 25 (9), 3319–3335. doi:10.1007/s12205-021-2263-3
Yu, F., Zhang, N., Niu, D., Kong, Z., Zhu, D., Wang, S., et al. (2019). Strain analysis of PVC-CFRP confined concrete column with ring beam joint under axial compression. Compos. Struct. 224, 111012. doi:10.1016/j.compstruct.2019.111012
Zhang, J., Liang, Z., and Zhao, G. (2016). Mechanical behaviour analysis of a buried steel pipeline under ground overload. Eng. Fail. Anal. 63, 131–145. doi:10.1016/j.engfailanal.2016.02.008
Zhang, J., and Xie, R. (2019). Numerical analysis of mechanical behavior of buried pipes in subsidence area caused by underground mining. J. Press. Vessel Technol. 141 (2). doi:10.1115/1.4042711
Nomenclature
c cohesion of soil
D pipeline diameter
d pipeline wall thickness
EI pipeline stiffness
P circumferential deformation of pipeline
E elastic modulus of the thin plate
x, y, z three axes of rectangular coordinate system, where z represents the coordinate in the thickness direction of the thin plate
Keywords: excessive stacking load, raw-water pipeline, model test, three-dimensional numerical simulation, stress characteristics
Citation: Wang J, Wang L, Chen Q, Shi L and Zhou J (2023) Model tests of the raw-water pipeline under the excessive stacking load. Front. Earth Sci. 10:994862. doi: 10.3389/feart.2022.994862
Received: 15 July 2022; Accepted: 12 September 2022;
Published: 06 January 2023.
Edited by:
Xiaoping Zhou, Chongqing University, ChinaReviewed by:
Lan Cui, Institute of Rock and Soil Mechanics (CAS), ChinaWen-Chieh Cheng, Xi’an University of Architecture and Technology, China
Danqing Song, Tsinghua University, China
Copyright © 2023 Wang, Wang, Chen, Shi and Zhou. This is an open-access article distributed under the terms of the Creative Commons Attribution License (CC BY). The use, distribution or reproduction in other forums is permitted, provided the original author(s) and the copyright owner(s) are credited and that the original publication in this journal is cited, in accordance with accepted academic practice. No use, distribution or reproduction is permitted which does not comply with these terms.
*Correspondence: Lei Wang, d2FuZ2xlaXdhbmdqaWFuZ0AxNjMuY29t