 Jianpeng Zhao
 Hui Chen3
- 1School of Earth Sciences and Engineering, Xi’an Shiyou University, Xi’an, China
- 2Shaanxi Key Laboratory of Petroleum Accumulation Geology, Xi’an, China
- 3Geological Research Institute, China Petroleum Logging CO., LTD., Xi’an, China
- 4Well Logging Company, Sinopec Shengli Oilfield Service Corporation, Dongying, China
- 5CCTEG XI’AN Research Institute, Xi’an, China
The pore structures of shale in the Shahejie formation of Dongying depression were quantitatively characterized by FIB-SEM three-dimensional imaging technology. FIB-SEM was used to obtain high-resolution SEM images and through image registration, geometric correction and image segmentation, the organic pores and inorganic pores in the shale were distinguished. The pore space was converted into a structured pore network model via maximal ball method. Then, the pore size distributions and volume contributions of shale organic pores and inorganic pores, and the coordination number of the total pore network model were statistically analyzed via the pore network model. The results showed that due to the low thermal maturity of organic matter in the Shahejie formation, fewer organic pores were observed in the shale samples, and the number of pores was dominated by inorganic pores. Statistical analysis of the pore network model indicated that the studied shale samples considerably included mesopore (size of 2–50 nm) which accounted for 61.1%, but their contribution to the total pore volume was small (4.2%). Macropores (>50 nm) accounted for a relatively small proportion (38.9%) in number, but they provided the main storage space (95.8%) for the shale oil and gas. The volume contribution of pores to the total pore space at a certain bin size is controlled by the combination of pore number and the pore size. The coordination numbers of the two samples were mainly 0 and 1, indicating that the pore connectivity was poor and isolated pores accounted for most part. These results are critical for further reliable petrophysical simulations based on shale digital rocks as well as for the accurate understanding of their petrophysical properties.
1 Introduction
The characterization of shale pore structure has always been the core work of shale oil and gas resource evaluation, and it is also a research hotspot and frontier in the field of oil and gas geology (Tang et al., 2016; Cao et al., 2019; Ma X. et al., 2019). The classification of shale rock pore types is of great significance to the qualitative and quantitative characterization of pores in shale. There are various types of pores in shale reservoirs, which can be classified into organic pores and inorganic pores in terms of genesis (Jarvie et al., 2007; Li et al., 2014). The pore type affects the wettability of the rock. Typically, organic pores are strongly oil-wet, and inorganic pores are strongly water-wet, which in turn affects the distribution of fluid in the pore space and the electrical resistivity of the rock (Nie et al., 2016; Yan et al., 2019; Wu et al., 2020). The percolation mechanism and occurrence state of shale oil and gas in organic and inorganic pores are also different (Wu et al., 2019a). Free gas is mainly stored in inorganic pores, while adsorbed gas is mainly adsorbed on the surface of organic matter and into the organic pores (Yao et al., 2018). Considering the differences in the influence of different pore types on petrophysical properties of shale, it is of great significance to quantitatively analyze the microstructure of organic and inorganic pores respectively. The commonly used experimental methods to study pore structure include high pressure mercury injection (MICP), gas (N2 or CO2) adsorption, nuclear magnetic resonance (NMR), scanning electron microscope (SEM) and CT scanning method, etc. (Tian et al., 2012; Tiwari et al., 2013; Liu et al., 2015; Wu et al., 2019b; Cui et al., 2020; Li et al., 2022; Golsanami et al., 2021 and 2022). High pressure mercury injection method and gas adsorption method are indirect means to obtain pore structure and morphology information. They can determine the overall pore size distribution of the sample through experimental results and some theoretical formula, but cannot distinguish between organic and inorganic pores. Scanning electron microscope is a commonly used method to describe the pore types and pore morphology of rocks, but it only reflects the two-dimensional information of the pores and cannot reflect the distribution information of the pores in the three-dimensional space. Nuclear magnetic resonance analysis can determine the T2 spectrum of oil-wet and water-wet pores. The pore size distribution of organic and inorganic pores can be obtained via establishing the quantitative relationship between T2 and pore size. However, this method cannot reflect the connectivity of the pores (Li et al., 2016). Although nano-CT based on the X-ray imaging (Dong et al., 2018; Dong et al., 2019) can obtain the three-dimensional reconstruction of shale pores, it is difficult to distinguish the organic pores and inorganic pores, since the gray values of organic pores and inorganic pores in CT image are very close (Kelly et al., 2016). Different from the methods discussed above, FIB-SEM is one of the most effective means to identify and analyze the organic and inorganic pores of shale. This technology can directly characterize the pore micro structure of shale on two-dimensional and three-dimensional scales both qualitatively and quantitatively. In the already existing studies, the researchers have mainly focused on the quantitative characterization of the total pore space of shale, and did not focus on the segmentation and quantitative characterization of shale’s organic pores and inorganic pores (Chalmers et al., 2012; Curtis et al., 2012; Zhou et al., 2016; Liu et al., 2017; Saif et al., 2017; Zhou et al., 2017). In this paper, two shale samples of the Shahejie formation in Dongying depression, Bohai Bay Basin were taken as an example, and FIB-SEM was used to establish three-dimensional digital rock of shale. Based on the difference in depth of field and pore distribution characteristics of organic pores and inorganic pores, the core image data was segmented twice by a double threshold method, then the fine division of organic and inorganic pores was achieved through image logic operations and algebraic operations. Finally, the maximal ball method was used to obtain the pore space topology model. The pore size distribution, volume contribution distribution of organic pores and inorganic pores and coordination number of the total pore network were respectively counted so as to quantitatively characterize the organic and inorganic pores in the studied shale samples. This method provides an effective method for quantitative characterization of shale microscopic pores which is critical for further reliable petrophysical simulations.
2 Test samples and methods
2.1 Sample characteristics
The samples used in this study were drilled from Well Fanye 1 in Dongying depression, Bohai Bay Basin. This well is a pre-prospecting well for unconventional oil and gas exploration and is the first key well deployed in Fanjia block by the Shengli oil field, which is of great significance for understanding the reservoir characterization and hydrocarbon-bearing conditions of the shale in the lower section of Es3, and upper section of Es4 in the Boxing Sag (Yan et al., 2018). The samples were from the lower section of Es3, which belongs to the semi-deep to deep lake depositional environment (Wu et al., 2016). The mineral composition of the shale samples in the Shahejie formation is rather complex and can be divided into clay minerals (average 24.2%), carbonate minerals (average 45.1%), quartz and feldspar (average 26.9%), and a small amount of pyrite, siderite, etc. The clay minerals are mainly illite followed by the mixed layer of illite/smectite, and a small amount of kaolinite and chlorite. The main type of kerogen belongs to I-type, and the vitrinite reflectance, Ro, is between 0.51% and 0.93%, which indicates the immature to low-mature stage (Sun, 2017). The lithology of the two samples selected for in this study is dark gray laminar lime-bearing mudstone (S1) and dark gray laminar lime-bearing mudstone (S2). The basic information is shown in Table 1.
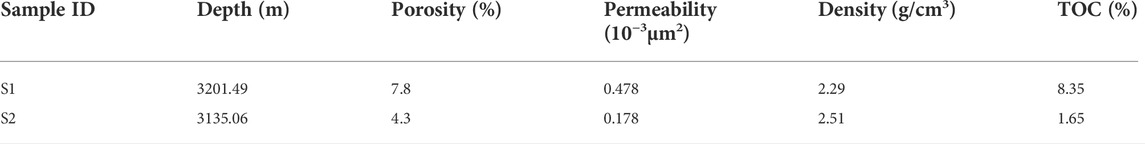
TABLE 1. Characteristics of Shale Samples from the Lower section of Es3 in Dongying Depression, Bohai Bay Basin.
2.2 Focused ion beam-scanning electron microscope cutting and imaging
FIB-SEM is a dual beam system formed by the focused ion beam (FIB) coupled with the scanning electron microscope (SEM). The common double beam equipment is that the electron beam is installed vertically, and the ion beam is installed at a certain angle with the electron beam, as shown in Figure 1A. The point of intersection of the focal planes of the electron beam and the ion beam is usually referred to as the concentric height position. By combining the gas deposition device, nanomanipulator, various detectors, controllable sample stage, and other accessories, FIB-SEM has become an analytical instrument integrating micro area imaging, processing, analysis, and manipulation. The ion source is the key component in the dual beam system and is used to generate the ion beam. Currently, the most commonly used ion source in commercial systems is gallium (Ga). The diameter of the gallium ion beam can be controlled to the nanometer scale by adjusting the lens system and the aperture strip. The cutting function of the ion beam is realized by sputtering out the atoms on the surface of the sample through the collision between the electron beam and the surface atoms, and the interaction of the electron beam with the sample surface can generate a signal for creating a high-resolution image of the sample. The cutting and scanning of the shale sample in this experiment were done with FEI Helios 650 instrument. First, emery paper and argon ion beam are used to polish the surface of the shale sample, and the sample is fixed to the stage with conductive carbon glue. Then turn on the electron beam, use the backscatter (BSE) mode to observe the polished shale surface, select the region of interest (ROI), and plate the surface of the area with platinum to avoid the ion beam from damaging the sample surface during the cutting process. Then rotate the sample table 52° (the ion beam is perpendicular to the sample surface during the cutting process), and use the gallium ion beam to cut off the shale on both sides and in front of the sample target area, exposing a new shale section; cut a “×” mark near the ROI as an alignment reference for continuous ion beam cutting (Figure 1B). Then control the ion beam and electron beam to perform continuous cutting and imaging. Every time the ion beam cuts a 10 nm thick slice of the sample, the electron beam scans the surface of the sample and records the signal used to form a nanoscale image. A sequence of continuous high-resolution SEM images can be obtained via successive and repeated cutting and imaging and the shale microstructure information can be extended from two-dimensional to three-dimensional scale (Lemmens et al., 2011).
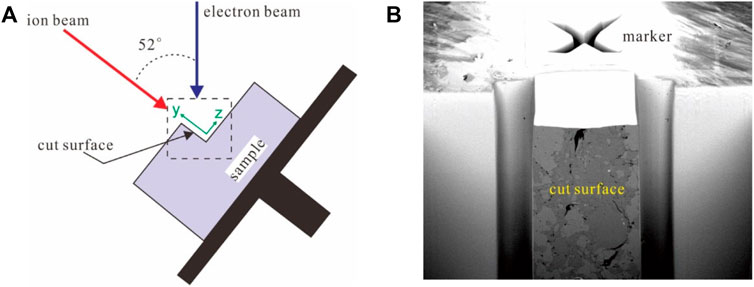
FIGURE 1. Schematic diagram of milling and imaging in the FIB-SEM system. (A) The characteristic of a typical FIB-SEM system. (B) Cross-section of a shale sample cut by an ion beam in BSE mode.
3 Image data processing
3.1 Image registration
In the continuous cutting and scanning process of FIB-SEM, there will inevitably be a slight offset between two adjacent images in the image sequence generated by the SEM (Curtis et al., 2012), which affects the subsequent segmentation, pore structure analysis, and petrophysical numerical simulation. An image registration algorithm can be used to align the images produced by FIB-SEM. Image registration is a method of optimally mapping one or more images to a target image based on a certain evaluation criterion. In image registration, the commonly used geometric transformation models mainly include rigid body transformation, affine transformation, projective transformation, and polynomial transformation (Goshtasby, 2005). Rigid body transformation can be decomposed into translation and rotation. Its characteristic is that after the points in the image are transformed, the Euclidean distance remains unchanged, and the relationship between the two straight lines such as parallel or perpendicular remains unchanged. In two-dimensional space, the process of point (x, y) being transformed to point (x’, y’) through a rigid body transformation can be expressed as:
Where θ, tx and ty are the rotation angle, the translational distance in x direction, the translational distance in y direction, respectively. In general, the first captured SEM image in the image sequence is used as the reference image, and all other images are aligned with it. The results before and after image alignment are shown in Figure 2. Before image registration, the boundaries of each component are uneven and jagged. After image registration, the boundaries of each component become relatively smooth. After the image is registered, the edge part that does not contain any information of the sample needs to be cut out.
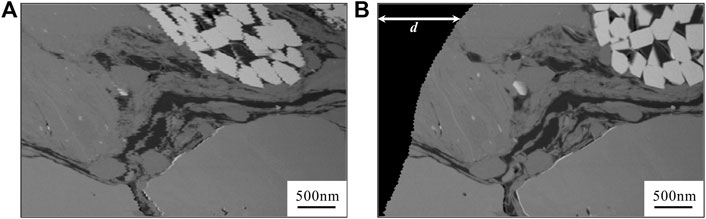
FIGURE 2. FIB-SEM image alignment (result from sample S1). (A) section image before alignment. (B) section image after alignment, where d is the translational distance relative to the reference image.
3.2 Geometric correction
During the continuous cutting and scanning process, the electron beam is not perpendicular to the cross-section of the sample. For the Helios 650 FIB-SEM system, the electron beam usually has an angle of 52° with the ion beam (Figure 1A). Therefore, the actual scan size of the SEM is the projection of the sample section on the horizontal plane, not the actual size of the sample section (Sun et al., 2016). The SEM image size can be converted to the actual size of the sample cross-section by multiplying a correction factor in the y direction. For an angle of 52°, the correction factor is 1/sin (52°).
3.3 Image segmentation
The accurate segmentation of the digital rock skeleton and pore space is the key problem to the quantitative characterization of the shale microstructure. Image binarization is a commonly used approach in digital rock image segmentation (Liu, 2010). This method uses a fixed threshold to separate the three-dimensional digital rock image into two parts: skeleton and pore space. However, due to the high resolution of SEM imaging, the internal details of pores will be displayed in the SEM image influenced by the depth of field (Sun et al., 2016), which leads to different grayscale distributions of organic pores and inorganic pores, that is, the pores have different gray values. The gray value of some inorganic pores is close to or even greater than the gray value of organic matter (Figure 3). Therefore, the traditional binary segmentation method cannot meet the requirements of shale digital rock image segmentation.
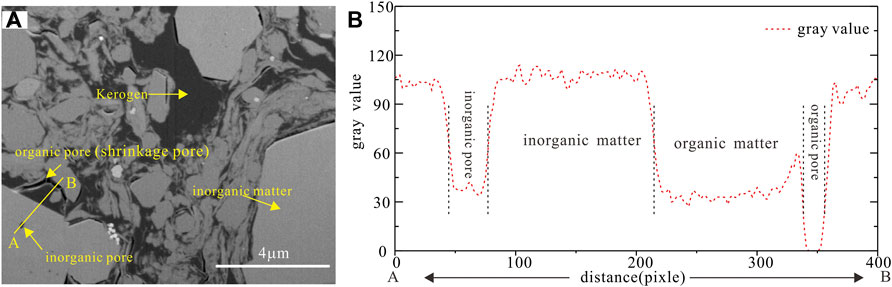
FIGURE 3. FIB-SEM image characteristics of shale samples from Shahejie formation. (A) section image from sample S1 produced by FIB-SEM. (B) the gray distribution on line AB in (A).
Based on the gray value of pores and the distribution characteristics of organic pores and inorganic pores, the image data was segmented twice with two different thresholds, and then the organic pores and inorganic pores were finely divided through image logic operations and algebraic operations. The specific image segmentation and operation process are shown in Figure 4, where “0” and “1” are the values of specific phases after image segmentation or operation. For the first binarization segmentation, using the maximum gray value of organic pores as the segmentation threshold, the image data could be divided into two parts:
• Organic pores and part of inorganic pores (denoted as 1).
• Organic matter, inorganic matter, and part of inorganic pores (denoted as 0).
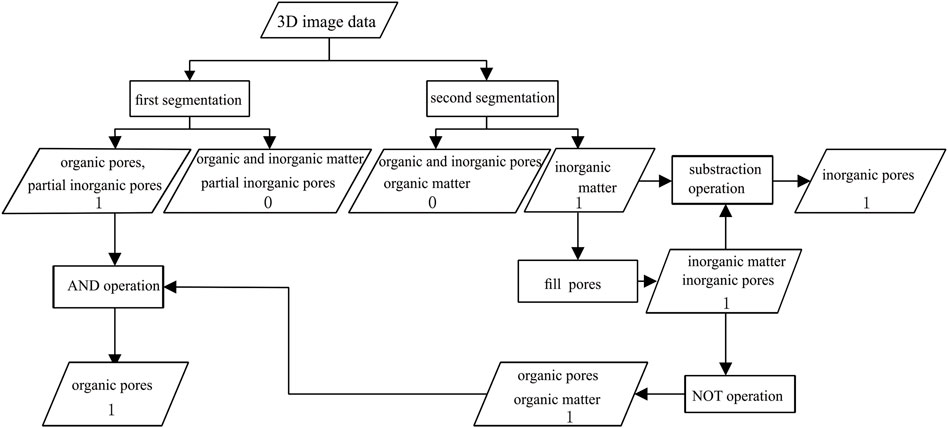
FIGURE 4. Flow chart of separation of organic pores and inorganic pores.
For the second binarization segmentation, using the maximum gray value of inorganic pores as the segmentation threshold, the core could be divided into two parts:
• All organic pores, all organic matter and all inorganic pores (denoted as 0).
• Inorganic matter (denoted as 1).
Image segmentation result of sample S1 is shown in Figure 5, in which Figure 5A is the 3D reconstructed digital rock of sample S1. The digital rock is composed of 781 continuous SEM images, and the size is 11.4μm × 8.9μm × 7.8 μm. Using the image processing procedure described in Figure 4, different components such as pyrite, inorganic pores and organic pores were segmented out. Figures 5B–D show the renderings of the pyrite, inorganic pores, and organic pores, respectively. All the samples in Table 1 were analyzed using the same processing procedure, which laid the foundation for the subsequent quantitative characterization of inorganic and organic pores in shale.
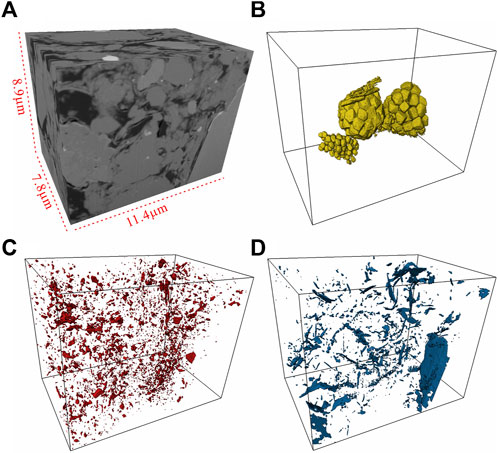
FIGURE 5. Image segmentation results of sample S1. (A) A digital rock reconstructed from S1. With multithreshold segmentation, pyrite (B), inorganic pores (C), and organic pores (D) were segmented out.
4 Results and discussion
4.1 Pore types
Taking into account the wettability of shale pores and the differences in their impact on petrophysical properties (electrical property, percolation property), the shale pores of the Shahejie formation in the Dongying depression are classified into two categories from the perspective of genesis, organic pores, and inorganic pores. Organic pores are oil-wet and are divided into shrinkage pores and internal pores formed in the process of thermal evolution and hydrocarbon generation of organic matter, so they are important storage places for shale oil and gas. The two-dimensional SEM image showed that the organic pores in the shale samples of the study area are less developed. The organic pores in this formation are mainly composed of shrinkage pores between organic matter and inorganic minerals, and the pores within the organic matter are less (Figure 6A). The observation results are consistent with the previous research results (Ma H. et al., 2019). The degree of organic pore development is quite different from the Longmaxi Shale in China (Zhou et al., 2016; Xie et al., 2019) and the Barnett Shale in the United States (Loucks et al., 2012). This is because the degree of organic pore development is related to the thermal maturity of the organic matter in the shale (Klaver et al., 2016; Zhang et al., 2020). The thermal evolution degree of shale samples in the research area is in the stage of immaturity to low-maturity (Liu et al., 2017). Inorganic pores are relatively developed in shale samples of Shahejie Formation, including interparticle (interP) pores and intraparticle (intraP) pores. Interparticle pores reflect the contact relationship between different mineral particles, and are mainly developed between brittle minerals, such as quartz and feldspar. Intraparticle pores reflect the pores inside mineral particles (Figures 6B,C).
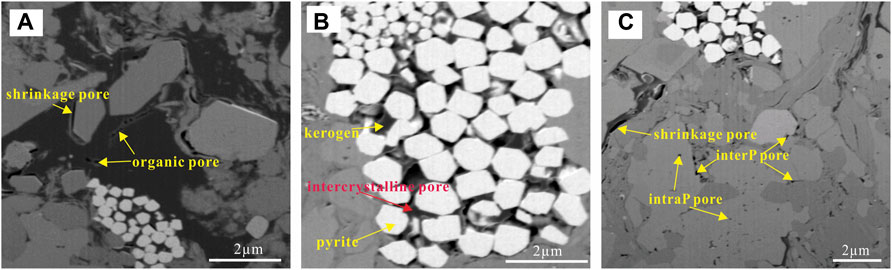
FIGURE 6. Pore types of shale samples from Shahejie formation. (A) a small amount of organic pores distributed in kerogen, and shrinkage pores between kerogen and inorganic minerals (B) Pyrite intercrystalline pore filled with kerogen containing organic pores, (C) InterP pores between brittle minerals and IntraP pores within quartz or feldspar particles.
4.2 Pore network model
The pore network model simplifies the complex and irregular pore space of the shale digital rock. The model not only retains the pore space distribution characteristics of the original digital rock, but also facilitates the use of mathematical statistics to quantify pore structure parameters. The commonly used maximal ball method (Dong and Blunt, 2009) was adopted to extract regularized pore structure models from the organic pores and inorganic pores which were segmented using the procedure discussed in Section 2.3. The maximal ball method is to select a point in the pore pixel and extend it around until it touches the nearest matrix pixel, and the set of all pixels in the formed area is called the maximum sphere. The largest sphere can overlap with the adjacent largest sphere whose radius is smaller than it, thus forming the multiple clusters of the largest spheres. The pore space of 3D digital rock can be represented by the largest spheres with different radius. The “pore” and “throat” in the pore network model are determined by finding the local maximum sphere and the smallest sphere between the two largest spheres in the ball string. Finally, the pore space of the 3D digital rock can be simplified into a network model with “pore” and “throat” as the basic units. Figure 7 is the extraction results of the pore network model of samples S1 and S2, where the ball represents the pore and the tube represents the throat.
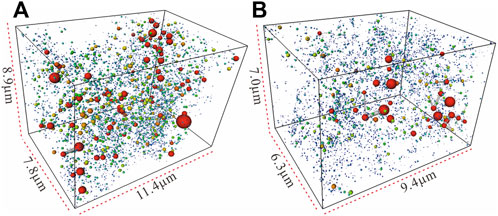
FIGURE 7. Pore network model extraction results of sample s1 (A) and s2 (B).
Based on the pore network model of shale, the quantitative characterization of the microscopic pore structure can be established by analysis the size of organic pores and inorganic pores and the coordination number of the entire network model.
The classification of pore types in shale reservoirs plays a significant role in further analyzing the micropores in shale. Based on the pore size, scholars have proposed different pore classification schemes. Loucks et al. (2009) classified shale pores of the Mississippian Barnett shale into micro-pores (>=0.75 μm) and nano-pores (<0.75 μm). Zhang et al. (2017) divided shale pores of Paleogene Xin’gouzui Formation in the Jianghan basin into I-type micro-pores (<25 nm), II-type micro-pores (25–100 nm), mesopores (100–1000 nm) and macropores (>1000 nm). At present, the most widely used quantitative classification scheme of shale pores is proposed by “International Union of Pure and Applied Chemistry (IUPAC)”. According to the pore classification scheme of the IUPAC (Rouquerol et al., 1994), shale pores can be divided into: micropores (less than 2 nm), mesopores (2–50 nm) and macropores (greater than 50 nm). Figure 8 is the pore size distribution and coordination number distribution obtained by statistical analysis of the pore network model of organic pores and inorganic pores. The size of the inorganic pores of sample S1 is mainly distributed in the range of 10–100 nm, and the peak distribution is between 20 and 30 nm. The size of the organic pores is mainly distributed in the range of 10–60 nm, and with a peak value between 20 and 30 nm (Figure 8A). Organic pores in 2–50 nm account for 12.8% of the total pores, and inorganic pores in 2–50 nm account for 55.9% of the total pores, but the corresponding pore volume contribution are 1.1%, and 4.8%, respectively. The organic pores with the largest volume contribution have a pore size distribution interval of 240–250 nm. The largest volume contribution of inorganic pore size distribution is in the range of 60–70 nm (Figure 8B). Similarly, by statistically analyzing the pore network model of the sample S2, the pore size distribution characteristics and pore volume distribution can be obtained. In sample S2, the inorganic pores are mainly distributed in the range of 10–60 nm, and the peak value is between 20 and 30 nm. The organic pores are mainly distributed in the range of 10–90 nm and the peak value is between 30 and 40 nm. The number of organic pores and inorganic pores in 2–50 nm accounted for 6.5% and 46.9%, respectively. The corresponding volume contributions to the total pore volume are 0.3%, and 2.1%, respectively. The size of the organic pores and inorganic pores with the largest volume contribution both are above 300 nm (Figures 8C,D). The distributions of pore size and volume contribution show that the mesopores in the shale samples in the study area are obviously dominant in number, but they contribute less to the total pore volume. Macropores account for a small proportion in number, but they provide the main storage space for shale oil and gas. The pore volume contribution is controlled by a combination of pore number and pore size.
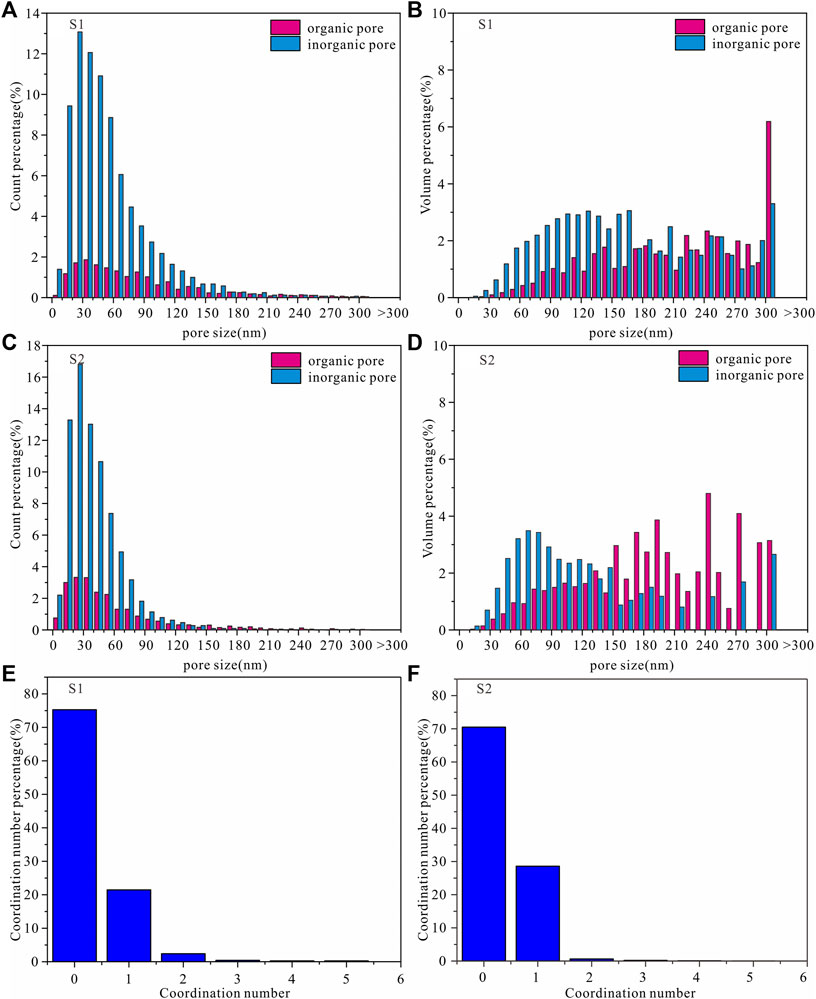
FIGURE 8. Distributions of pore size and coordination number of shale samples from Shahejie Formation in Dongying depression. (A) and (B) are pore count percentage and volume contribution to the total pore space of sample S1 at a given bin size, respectively; (C) and (D) are pore count percentage and volume contribution to the total pore space of sample S2 at a given bin size, respectively; and (E) and (F) are distributions of coordination numbers of sample S1 and S2, respectively.
Pore connectivity is of great significance to the accumulation and migration of shale oil and gas. The connectivity of the pores can be expressed by the coordination number (referring to the number of throats connected to the pores), which reflects the connectivity between the pores. The larger the coordination number, the better the pore connectivity, and the smaller the coordination number, the worse the pore connectivity. Figures 8E,F are the histograms of the coordination number distribution of rock sample S1 and S2, respectively. The coordination numbers of the two samples are mainly 0 and 1, which means that isolated pores dominate in number and the pore connectivity is poor.
5 Conclusion
In this paper, FIB-SEM and digital rock technology were used to quantitatively characterize the organic pores and inorganic pores of continental shale reservoirs in the Shahejie Formation in Dongying depression, and the following conclusions could be drawn:
(1) The shale reservoir of Shahejie Formation in Dongying depression is widely developed with nano-pores. Compared with the shale of the Longmaxi Formation, the thermal evolution degree of the shale in the study area is in the immaturity to low-maturity stage, therefore, organic pores were less developed in the shale sample, and inorganic pores dominate in the number of the Shahejie formation in the Dongying depression.
(2) The mesopores (2–50 nm) of the shale samples in the study area are obviously dominant in number, but they contribute less to the total pore volume. Macropores (>50 nm) account for a small proportion in number, but they provide the main storage space for shale oil and gas. The pore volume contribution is controlled by a combination of pore number and pore size. The pore connectivity analysis showed that isolated pores in the shale samples in the study area are dominant in number, and the pore connectivity is poor.
(3) FIB-SEM can directly and accurately obtain the three-dimensional spatial distribution characteristics of organic pores and inorganic pores in shale rocks, which can not only obtain the distribution characteristics of organic and inorganic pores, but also the connectivity of the entire pore space. The digital rock also provides a medium for the simulation study of petrophysical properties of shale oil reservoirs.
Data availability statement
The original contributions presented in the study are included in the article/supplementary material, further inquiries can be directed to the corresponding author.
Author contributions
JpZ: investigation, methodology, writing—original draft, and data analysis. HC: supervision and writing—review and editing. JyZ: data analysis. WZ: writing—original draft, and processing the data. GC: methodology.
Funding
This work was supported in part by the National Natural Science Foundation of China (42102350), and the General fund of China Coal Science and Industry Group (2022-2-TD-MS005).
Conflict of interest
HC was employed by the China Petroleum Logging CO., LTD. JyZ and WZ were employed by the Sinopec Shengli Oilfield Service Corporation. GC was employed by the CCTEG Xi’an Research Institute.
The remaining authors declare that the research was conducted in the absence of any commercial or financial relationships that could be construed as a potential conflict of interest.
Publisher’s note
All claims expressed in this article are solely those of the authors and do not necessarily represent those of their affiliated organizations, or those of the publisher, the editors and the reviewers. Any product that may be evaluated in this article, or claim that may be made by its manufacturer, is not guaranteed or endorsed by the publisher.
References
Cao, G., Lin, M., Ji, L., Jiang, W., and Yang, M. (2019). Characterization of pore structures and gas transport characteristics of longmaxi shale. Fuel 258, 116146. doi:10.1016/j.fuel.2019.116146
Chalmers, G. R., Bustin, R. M., and Power, I. M. (2012). Characterization of gas shale pore systems by porosimetry, pycnometry, surface area, and field emission scanning electron microscopy/transmission electron microscopy image analyses: Examples from the barnett, woodford, haynesville, marcellus, and doig units. Am. Assoc. Pet. Geol. Bull. 96, 1099–1119. doi:10.1306/10171111052
Cui, L., Sun, J., Yan, W., and Dong, H. (2020). Multi-scale and multi-component digital core construction and elastic property simulation. Appl. Geophys. 17, 26–36. doi:10.1007/s11770-019-0789-7
Curtis, M. E., Sondergeld, C. H., Ambrose, R. J., and Rai, C. S. (2012). Microstructural investigation of gas shales in two and three dimensions using nanometer-scale resolution imaging. Am. Assoc. Pet. Geol. Bull. 96, 665–677. doi:10.1306/08151110188
Dong, H., and Blunt, M. J. (2009). Pore-network extraction from micro-computerized-tomography images. Phys. Rev. E 80, 036307. doi:10.1103/physreve.80.036307
Dong, H., Sun, J., Cui, L., Golsanami, N., Yan, W., Huaimin, D., et al. (2019). Characteristics of the pore structure of natural gas hydrate reservoir in the qilian mountain permafrost, northwest China. J. Appl. Geophys. 164, 153–159. doi:10.1016/j.jappgeo.2019.03.005
Dong, H., Sun, J., Golsanami, N., Cui, L., Jiang, L., Yan, G., et al. (2018). A method to construct high-precision complex pore digital rock. J. Geophys. Eng. 15, 2695–2703. doi:10.1088/1742-2140/aae04e
Golsanami, N., Fernando, S. G., Jayasuriya, M. N., Yan, W., Dong, H., Cui, L., et al. (2021). Fractal properties of various clay minerals obtained from SEM images. Geofluids 1–18. doi:10.1155/2021/5516444
Golsanami, N., Jayasuriya, M. N., Yan, W., Fernando, S. G., Liu, X., Cui, L., et al. (2022). Characterizing clay textures and their impact on the reservoir using deep learning and lattice-Boltzmann simulation applied to SEM images. Energy 240, 122599. doi:10.1016/j.energy.2021.122599
Goshtasby, A. A. (2005). 2-d and 3-d image registration: For medical, remote sensing, and industrial applications. New York: John Wiley & Sons.
Jarvie, D. M., Hill, R. J., Ruble, T. E., and Pollastro, R. M. (2007). Unconventional shale-gas systems: The mississippian barnett shale of north-central Texas as one model for thermogenic shale-gas assessment. Am. Assoc. Pet. Geol. Bull. 91, 475–499. doi:10.1306/12190606068
Kelly, S., El-Sobky, H., Torres-Verdin, C., and Balhoff, M. T. (2016). Assessing the utility of fib-sem images for shale digital rock physics. Adv. Water Resour. 95, 302–316. doi:10.1016/j.advwatres.2015.06.010
Klaver, J., Desbois, G., Littke, R., and Urai, J. L. (2016). Bib-sem pore characterization of mature and post mature posidonia shale samples from the hils area, Germany. Int. J. Coal Geol. 158, 78–89. doi:10.1016/j.coal.2016.03.003
Lemmens, H. J., Butcher, A. R., and Botha, P. (2011). Fib/sem and sem/edx: A new dawn for the sem in the core lab? Petrophysics 52, 452–456.
Li, B., Nie, X., Cai, J., Zhou, X., Wang, C., and Han, D. (2022). U-net model for multi-component digital rock modeling of shales based on ct and qemscan images. J. Petroleum Sci. Eng. 216, 110734. doi:10.1016/j.petrol.2022.110734
Li, J., Jin, W., Liang, W., Wu, Q., Lu, J., and Hao, S. (2016). Quantitative evaluation of organic and inorganic pore size distribution by nmr: A case from the silurian Longmaxi Formation gas shale in fuling area, sichuan basin. Oil Gas Geol. 37, 129–134. doi:10.11743/ogg20160118
Li, J., Lu, J., Li, Z., Wu, Q., and Nan, Z. (2014). 'four-pore'modeling and its quantitative logging description of shale gas reservoir. Oil Gas Geol. 35, 266–271. doi:10.11743/ogg20140214
Liu, X. (2010). Numerical simulation of elastic and electrical properties of rock based on digital cores[D]. China: China University of Petroleum East China.
Liu, X., Xiong, J., and Liang, L. (2015). Investigation of pore structure and fractal characteristics of organic-rich yanchang formation shale in central China by nitrogen adsorption/desorption analysis. J. Nat. Gas Sci. Eng. 22, 62–72. doi:10.1016/j.jngse.2014.11.020
Liu, Y., Lu, Z., Feng, M., Wang, J., Tian, T., et al. (2017). Micro‐pore characteristics of shale oil reservoirs of the shahejie formation in the dongying sag, bohai bay basin. Acta Geol. Sin. 91, 629–644. doi:10.7623/syxb201203011
Loucks, R. G., Reed, R. M., Ruppel, S. C., and Hammes, U. (2012). Spectrum of pore types and networks in mudrocks and a descriptive classification for matrix-related mudrock pores. Am. Assoc. Pet. Geol. Bull. 96, 1071–1098. doi:10.1306/08171111061
Loucks, R. G., Reed, R. M., Ruppel, S. C., and Jarvie, D. M. (2009). Morphology, genesis, and distribution of nanometer-scale pores in siliceous mudstones of the mississippian barnett shale. J. Sediment. Res. 79, 848–861. doi:10.2110/jsr.2009.092
Ma, H., Xia, Z., Wen, Q., and Zhang, P. (2019). Micro-pore characteristics of shale in zhanhua sag, bohai bay basin. Petroleum Geol. Exp. 41, 149–156. doi:10.11781/sysydz201901149
Ma, X., Guo, S., Shi, D., Zhou, Z., and Liu, G. (2019). Investigation of pore structure and fractal characteristics of marine-continental transitional shales from longtan formation using micp, gas adsorption, and nmr (guizhou, China). Mar. Petroleum Geol. 107, 555–571. doi:10.1016/j.marpetgeo.2019.05.018
Nie, X., Zou, C. C., Meng, X. H., Jia, S., and Wan, Y. (2016). 3d digital core modeling of shale gas reservoir rocks: A case study of conductivity model. Nat. Gas. Geosci. 27, 706–715. doi:10.11764/j.issn.l672-1926.2016.04.0706
Rouquerol, J., Avnir, D., Fairbridge, C. W., Everett, D. H., Haynes, J. M., Pernicone, N., et al. (1994). Recommendations for the characterization of porous solids (technical report). Pure Appl. Chem. 66, 1739–1758. doi:10.1351/pac199466081739
Saif, T., Lin, Q., Butcher, A. R., Bijeljic, B., and Blunt, M. J. (2017). Multi-scale multi-dimensional microstructure imaging of oil shale pyrolysis using x-ray micro-tomography, automated ultra-high resolution sem, maps mineralogy and fib-sem. Appl. Energy 202, 628–647. doi:10.1016/j.apenergy.2017.05.039
Sun, C. (2017). The characteristics, formation and evolution of shale oil reservoir space in Dongying Sag[D]. China: Nanjing University.
Sun, L., Wang, X., Jin, X., Li, J., and Wu, S. (2016). Three dimensional characterization and quantitative connectivity analysis of micro/nano pore space. Thailand: Petroleum Exploration and Development.
Tang, X., Jiang, Z., Jiang, S., and Li, Z. (2016). Heterogeneous nanoporosity of the silurian longmaxi formation shale gas reservoir in the sichuan basin using the qemscan, fib-sem, and nano-ct methods. Mar. Petroleum Geol. 78, 99–109. doi:10.1016/j.marpetgeo.2016.09.010
Tian, H., Zhang, S., Liu, S., and Zhang, H. (2012). Determination of organic-rich shale pore features by mercury injection and gas adsorption methods. Acta Pet. Sin. 33, 419–427. doi:10.7623/syxb201203011
Tiwari, P., Deo, M., Lin, C. L., and Miller, J. (2013). Characterization of oil shale pore structure before and after pyrolysis by using x-ray micro ct. Fuel 107, 547–554. doi:10.1016/j.fuel.2013.01.006
Wu, J., Jiang, Z., Tong, J., Yang, L., Li, J., and Nie, H. (2016). Sedimentary environment and control factors of fine-grained sedimentary rocks in the upper fourth member of paleogene shahejie formation, dongying sag. Acta Pet. Sin. 37, 464–473. doi:10.7623/syxb201604005
Wu, Y., Lin, C., Yan, W., Liu, Q., Zhao, P., and Ren, L. (2020). Pore-scale simulations of electrical and elastic properties of shale samples based on multicomponent and multiscale digital rocks. Mar. Petroleum Geol. 117, 104369. doi:10.1016/j.marpetgeo.2020.104369
Wu, Y., Tahmasebi, P., Lin, C., Munawar, M. J., and Cnudde, V. (2019a). Effects of micropores on geometric, topological and transport properties of pore systems for low-permeability porous media. J. Hydrology 575, 327–342. doi:10.1016/j.jhydrol.2019.05.014
Wu, Y., Tahmasebi, P., Lin, C., Zahid, M. A., Dong, C., Golab, A. N., et al. (2019b). A comprehensive study on geometric, topological and fractal characterizations of pore systems in low-permeability reservoirs based on sem, micp, nmr, and x-ray ct experiments. Mar. Petroleum Geol. 103, 12–28. doi:10.1016/j.marpetgeo.2019.02.003
Xie, T., Zhang, C., Yang, Y., Xia, X., Li, Q., Wang, X., et al. (2019). Shale pore characteristics and controls in well qian xy 1, zunyi city, guizhou province. Petroleum Geol. Exp. 41, 68–75. doi:10.11781/sysydz201901068
Yan, J., Fan, J., Wang, M., Li, Z., Hu, Q., and Chao, J. (2018). Rock fabric and pore structure of the shahejie sandy conglomerates from the dongying depression in the bohai bay basin, east China. Mar. Petroleum Geol. 97, 624–638. doi:10.1016/j.marpetgeo.2018.07.009
Yan, W., Sun, J., Golsanami, N., Li, M., Cui, L., Dong, H., et al. (2019). Evaluation of wettabilities and pores in tight oil reservoirs by a new experimental design. Fuel 252, 272–280. doi:10.1016/j.fuel.2019.04.130
Yao, J., Sun, H., Huang, Z., Zhang, L., Zeng, Q., Sui, H., et al. (2018). Key mechanical problems in the development of shale gas reservoirs. Sci, Sin.-Phys. Mech. Astron. 43, 1527–1547. doi:10.1360/132013-97
Zhang, P., Lu, S., Li, J., Xue, H., Li, W., and Zhang, P. (2017). Characterization of shale pore system: A case study of paleogene xin'gouzui Formation in the Jianghan basin, China. Mar. Petroleum Geol. 79, 321–334. doi:10.1016/j.marpetgeo.2016.10.014
Zhang, Y., Yu, B., Pan, Z., Hou, C., Zuo, Q., and Sun, M. (2020). Effect of thermal maturity on shale pore structure: A combined study using extracted organic matter and bulk shale from sichuan basin, China. J. Nat. Gas Sci. Eng. 74, 103089. doi:10.1016/j.jngse.2019.103089
Zhou, S., Liu, D., Cai, Y., Yao, Y., and Li, Z. (2017). 3d characterization and quantitative evaluation of pore-fracture networks of two Chinese coals using fib-sem tomography. Int. J. Coal Geol. 174, 41–54. doi:10.1016/j.coal.2017.03.008
Keywords: FIB-SEM, digital rock, shale, Shahejie formation, Dongying depression
Citation: Zhao J, Chen H, Zhang J, Zhang W and Chen G (2022) Quantitative characterization of organic and inorganic pores in shale based on FIB-SEM. Front. Earth Sci. 10:994312. doi: 10.3389/feart.2022.994312
Received: 14 July 2022; Accepted: 10 August 2022;
Published: 02 September 2022.
Edited by:
Yuqi Wu, China University of Petroleum, ChinaReviewed by:
Weichao Yan, Ocean University of China, ChinaKun Liu, SINOPEC Petroleum Exploration and Production Research Institute, China
Huaimin Dong, Chang’an University, China
Copyright © 2022 Zhao, Chen, Zhang, Zhang and Chen. This is an open-access article distributed under the terms of the Creative Commons Attribution License (CC BY). The use, distribution or reproduction in other forums is permitted, provided the original author(s) and the copyright owner(s) are credited and that the original publication in this journal is cited, in accordance with accepted academic practice. No use, distribution or reproduction is permitted which does not comply with these terms.
*Correspondence: Jianpeng Zhao, empwc25vd0AxMjYuY29t