 Xiaoran Fan
 Guohong Zhang
 Dezheng Zhao1
 Chaodi Xie
 Xinjian Shan
95% of researchers rate our articles as excellent or good
Learn more about the work of our research integrity team to safeguard the quality of each article we publish.
Find out more
ORIGINAL RESEARCH article
Front. Earth Sci. , 19 September 2022
Sec. Structural Geology and Tectonics
Volume 10 - 2022 | https://doi.org/10.3389/feart.2022.993984
This article is part of the Research Topic Measuring and Modeling the Ground Deformation of Geological Disasters Using Modern Geodesy View all 11 articles
The 2021 Mw 7.3 Maduo earthquake revealed the significant seismic hazard of faults developed within the Bayan Har Block of eastern Tibet, China (e.g., the Kunlun Pass–Jiangcuo Fault). Relocated aftershock data are in good agreement with the Interferometric Synthetic Aperture Radar (InSAR) coseismic displacement field and field investigations. In this study, we used aftershock point cloud fitting to model the relocated aftershocks of the Maduo earthquake, and obtained the detailed geometry and characteristics of the seismogenic fault. Based on InSAR coseismic deformation, the geometric model of the seismogenic fault and its slip distribution were retrieved. The results show that this event was shallow (0–10 km) and characterized by sinistral strike-slip motion. We identified four asperities along the fault strike; the maximum slip of 4.84 m occurred on the eastern segment of the fault, in an area where the strike changed. The results suggest that the central segment of the main seismogenic fault is mature and smooth, while western and eastern segments are complex and immature.
On 22 May 2021, a Mw 7.3 earthquake occurred in Maduo County, China; the event was located in the interior of the Bayan Har Block and close to the Kunlun Fault. According to the China Earthquake Networks Center (CENC), the epicenter was located at 98.34°E & 34.58°N with a focal depth of 10 km. The W phase focal mechanism reported by the United States Geological Survey (USGS) indicates dominant left-lateral strike-slip motion. Field investigations conducted immediately after the earthquake, Interferometric Synthetic Aperture Radar (InSAR) coseismic deformation, and regional tectonics all confirm that the seismogenic fault was the Kunlun Pass–Jiangcuo Fault (KPJF), located between the Maduo–Gande Fault (MGF) to the north and the Gande South Rim Fault (GSF) to the south (Figure 1). InSAR and field data indicate a surface rupture zone of ∼160 km in length, featuring complex local surface structures such as tensile step zones, shear fractures, tensile and shear cracks, compression, and swelling (Chen et al., 2021; Zhi-min et al., 2021; Pan et al., 2022; Ren et al., 2022). The obvious segmentation of the surface rupture adds complexity to the interpretation of fault segmentation and subsurface geometry of the seismogenic fault.
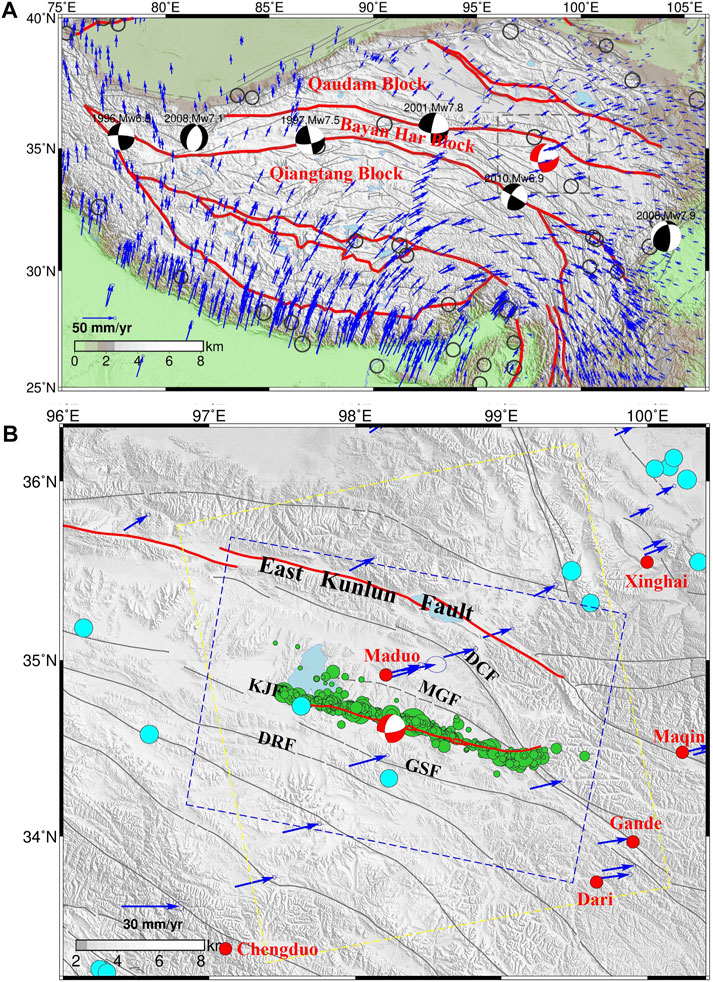
FIGURE 1. Tectonic setting and strong historical earthquakes on the Tibetan Plateau. (A) Tectonic setting of the Tibetan Plateau and Bayan Har Block. The red beach ball represents the United States Geological Survey (USGS; https://earthquake.usgs.gov/earthquakes) focal mechanism of the 2021 Mw 7.3 Maduo earthquake. Gray lines represent active faults, and red lines represents block boundary faults. Blue arrows show Global Positioning System (GPS) interseismic velocities with ellipses indicating uncertainties. Black circles represent historical earthquakes of Mw ≥ 7.0 (1 January 1976–20 May 2021; https://www.globalcmt.org). (B) Source region of the 2021 Maduo earthquake. Blue dots indicate historical Mw > 5 earthquakes. (1 January 1990–20 May 2021; https://www.globalcmt.org). Green circles are aftershocks. Red circles are nearby cities. The red line donates the surface rupture of the 2021 Maduo earthquake. The blue and purple boxes are the spatial coverage of the Synthetic Aperture Radar (SAR) images on ascending and descending orbits, respectively. Blue arrows are the same as in (A).
Strong earthquakes tends to occur along major boundary faults that surround the Bayan Har Block (Zhang et al., 2003; Parsons et al., 2008; Tobita et al., 2011; Xu et al., 2013; Fang et al., 2018); historic examples include the 2008 Mw 7.8 Wenchuan earthquake, 2010 Mw 6.9 Yushu earthquake, 2017 Mw 7.0 Jiuzhaigou earthquake, and 2008 Mw 7.3 Yutian earthquake. Among the block bounding faults, the Kunlun Fault on the northern margin and the Xianshuihe–Yushu–Malgaechaka Fault on the southern margin facilitate the eastward movement of crustal material (Li et al., 2004; Qi-Dong et al., 2010; Qi-Dong et al., 2014) and are considered likely candidates for future large earthquakes (Wen et al., 2011). However, secondary faults near the Kunlun Fault zone, including the MGF, KPJF, GSF and Dari Fault (DRF), are systematically overlooked and their seismic hazards significantly underestimated. This changed with the 2021 Mw 7.3 Maduo earthquake, which was unusual in that it occurred within the Bayan Har Block. This event showed that secondary faults parallel to the main boundary faults have the ability to host strong earthquakes (Mw > 7), albeit with the main boundary faults bearing most of the tectonic loading and release. Thus, the geometry and kinematics of the source fault of the Maduo earthquake is of great importance for better understanding of seismogenesis along secondary faults within the Bayan Har Block.
When complex fault geometry constrained by aftershocks is used as a priori information, the robustness of the fault slip model constrained by InSAR observations is potentially improved, and uncertainties in the slip model caused by simplification of fault geometry is reduced (Dietz and Ellsworth, 1990; Ziv, 2006; Chiarabba et al., 2009; Wan et al., 2016). Compared with geodetic (Global Navigation Satellite System [GNSS], InSAR, etc.) and seismic waveform data, relocated aftershock data can constrain the geometry of the deep fault with higher resolution as each aftershock can be regarded as an observation point (Hauksson, 2010; Powers and Jordan, 2010; Valoroso et al., 2014). Previous studies have shown that spatio-temporal evolution of aftershocks reflects the complex activity of the deep portion of the fault, including surrounding structures and secondary fractures (Perrin et al., 2021). Aftershocks of the Maduo earthquake confirmed the geometric complexity of the deep seismogenic fault (Wang et al., 2021).
As such, the 2021 Maduo earthquake provides a rare opportunity to obtain the fault geometric parameters from both aftershocks and InSAR measurements, and to discuss the physical and mechanical properties of the seismogenic fault. In this study, we used an integrated inversion of both point cloud-fitted relocated aftershock data and InSAR coseismic deformation measurements to evenly more robustly reveal the complexity of the seismogenic source fault and slip distribution of the Maduo earthquake.
In this study, we used 1,240 relocated aftershocks that occurred in the 9 days after the earthquake (Wang et al., 2021). The aftershock distribution shows a very obvious linear trend along a NW–SE direction (Figure 2A) between the GSF to the south and MGF & Dago-Changmahe Fault (DCF) to the north; it interests with the latter two faults at the eastern end and with the southern margin of Eling Lake at the western end. Aftershocks show obvious segmentation characteristics, with dense clusters along the western segment, relatively sparse clusters along the central segment, and a large gap along the eastern segment. In addition, aftershocks along the eastern segment bifurcated when they intersect the MGF; most aftershocks shifted to the north, while a smaller number continued to extend southeast for ∼10 km. The majority of aftershocks were concentrated at 5–15 km depth (Figure 2B). According to previous research on aftershock clusters, the geometry of the fault has varied dip angles from west to east.
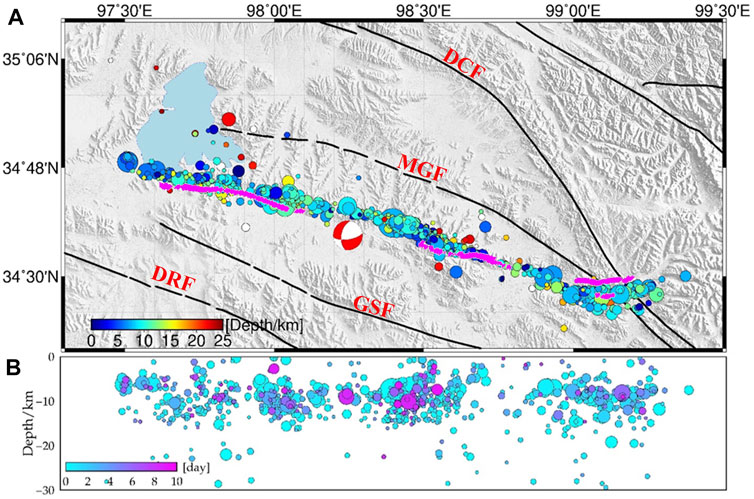
FIGURE 2. Spatiotemporal evolution of aftershocks following the 2021 Mw 7.3 Maduo earthquake. (A) Map of aftershock locations, where colored circles are aftershocks at different depths and the solid black line is the active fault. The pink lines are the surface ruptures. The red beach ball represents the United States Geological Survey (USGS; https://earthquake.usgs.gov/earthquakes) mainshock focal mechanism. MGF: Maduo–Gande Fault, DCF: Dagou–Changmahe Fault, GSF: Gande South Rim Fault, DRF: Dari Fault. (B) Depth distribution of aftershocks along the fault zone, where colors denote days after the mainshock.
Before mathematical fitting, the outlier factor analysis algorithm was used to filter aftershocks, with outliers removed to ensure the accuracy of subsequent fault plane fitting. Outlier factors (LOF) based on the density of clusters, tokening aftershocks with a much lower density than neighboring clusters as an outlier, were used to remove outliers that deviated significantly from the fault plane (Figure 3; Breunig et al., 2000). We also filtered out those outliers with abnormal spatial distributions.
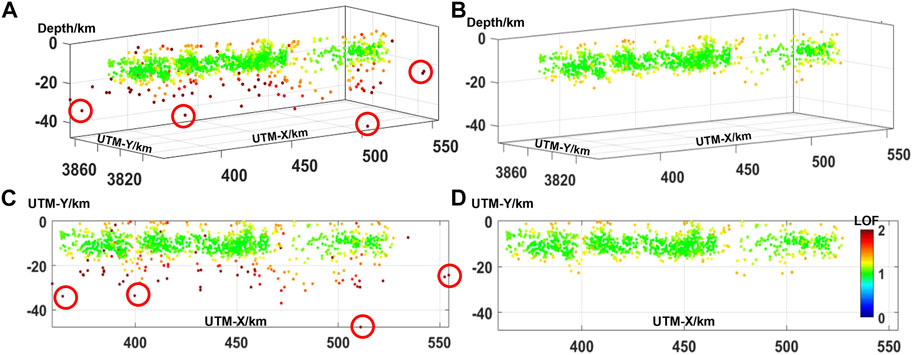
FIGURE 3. Relocated aftershock data (A,C) before and (B,D) after filtering. Aftershocks in red are those identified as outliers based on the outlier factors (LOF).
First, we calculated the distance
where
where,
After obtaining the LOF values of each aftershock, we found that points with LOF >1.5 were obvious outliers; these were removed for subsequent calculations (Figure 3).
Then, we projected the three dimensional (3D) aftershocks onto a two dimensional plane to fit the geometry of the fault (Wang et al., 2019). This method has been used by Wang et al. in the 2016 Central Italy earthquake. They used aftershock data to quickly discover the geometry of four main faults and three secondary faults. We divide the aftershocks into regions according to their distribution trends. Based on the singular value decomposition (SVD) algorithm, 3D aftershock distributions were mathematically matched with the fault planes (Wang et al., 2019).
A more accurate fit was achieved by performing a loop procedure, as shown in Figure 4, to filter out the influence of outliers.
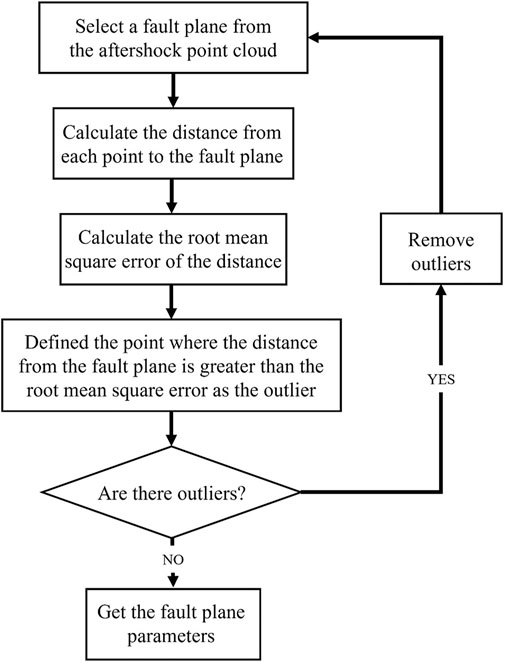
FIGURE 4. Fault plane fitting algorithm.
The location, length, and depth of the fault are a priori parameters that need to be manually identified. We believe that aftershocks basically occur on faults, so the area where aftershocks are obviously concentrated is the location of faults; The length of the fault is determined by the segmentation of the reference surface rupture and the zoning state of aftershocks. According to the nature of the strike-slip earthquake and the depth distribution of aftershocks, the fault depth is set as 0–20 km. In other words, according to the segmentation of aftershocks and faults, different rectangular ranges were selected, and aftershocks within each range were used to fit the fault parameters within that rectangular range. Then, the precise geometric parameters of the fault could be quickly calculated by plane fitting. From the obtained fault orientation (a, b, c), the strike and dip of the fault were calculated by:
where sign(n) indicates that the element in parentheses is equal to one if n is regular and -1 if n is negative.
The advantage of the proposed method is that it reduces the subjectivity and tedious work of artificial identification, and the fault parameters are obtained by mathematical method, have more reliable information about the depth of the fault.
We established a preliminary fault geometry model with five segments (F1, F2, F4–F6; Figure 5 and Table 1) based on the fault plane fitting method described above. F1 is nearly parallel to the main fault and occurs at depths of 0–20 km depth; it did not break the surface. F2, F4, and F5 represent the main seismogenic fault and F6 is the eastern branch fault. The model is in good agreement with surface ruptures observed in the field and with InSAR coseismic deformation along the western (F1 in Figure 5) and eastern (F4–F6 in Figure 5) segments. However, it deviates ∼4 km north of the surface rupture along the central segment (F2 in Figure 5), for which we also identified a wide aftershock zone (Figure 5C). After filtering and mathematically fitting the aftershocks, we identified another segment (F3 in Figure 5), which is consistent with both the surface ruptures observed by field investigation and the InSAR coseismic measurements.
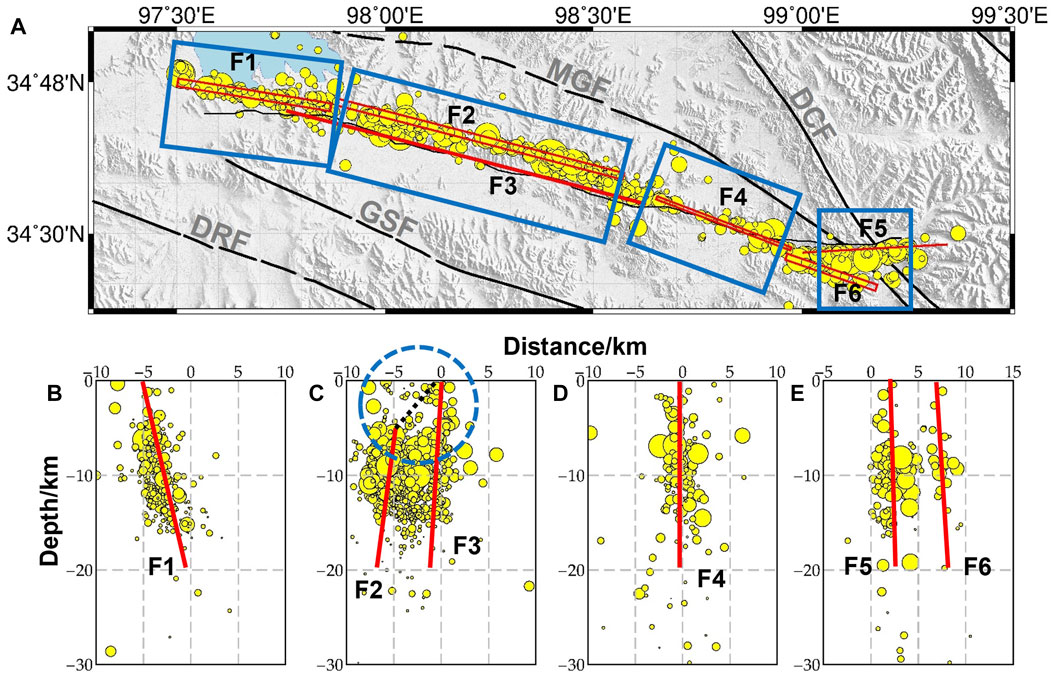
FIGURE 5. Results of fault geometry fitting and profiles. (A) Segmentation of the fitted fault plane. Red boxes are the surface projection of the inferred fault plane from aftershocks, blue boxes denote the swath used to project aftershock data, and the solid red line is fault trace projected up-dip. (B–E) Aftershock profiles within each segment of the fault.
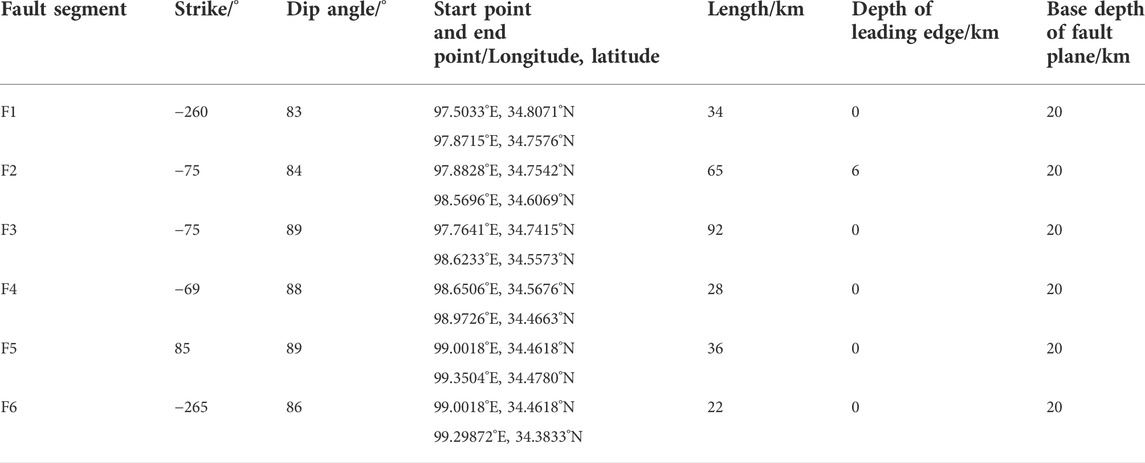
TABLE 1. Best fault parameters of each fault segment.
Within the fault geometric parameters, the location and length of the fault were determined from the manually selected aftershocks, with the selection criteria being the aftershock distribution characteristics. After repeated tests, we found that the impact of manual frame selection error on the geometric parameters was mainly associated with the length and depth, while the error in fault strike and dip angle was ∼1°, which indicates the internal reliability of the parameters. The algorithm we used could only obtain simple and plane fault models (REFS). However, our aftershock fitted fault plane model (AFFP) model is consistent with the fault segmentation of field investigation, unlike the model in Jun et al. (2021) and He et al. (2021). Moreover, we used F2 to explain the mismatch between aftershocks and the surface trace, which was not considered in past studies. Our final AFFP model is stable and can reflect the actual situation of aftershock data; as such, we used this model to explore the fault slip distribution of the Maduo earthquake.
We derived coseismic displacement associated with the Maduo earthquake using Sentinel-1 IW mode SAR images. We selected tracks that completely covered the seismic region. The pre-earthquake (20 May 2021) and post-earthquake (26 May 2021) images were processed using the GAMMA software (Werner et al., 2000). The National Aeronautics and Space Administration (NASA) Shuttle Radar Topography Mission (SRTM) 3-arc-sec digital elevation model (DEM) was used to geocode the images and remove topographic phases. During processing, SAR images were multi-looked in the range (by 10) and azimuth (by 2) directions. After enhanced registration with an accuracy of <0.001 pixels, the interferometric phase was filtered using an adaptive spectral filtering algorithm and then unwrapped using the minimum cost flow algorithm (Werner et al., 2002). Finally, deformation maps were projected to the geographic coordinate system to obtain the coseismic displacement fields of the Maduo earthquake (Figure 6A and Figure 6B).
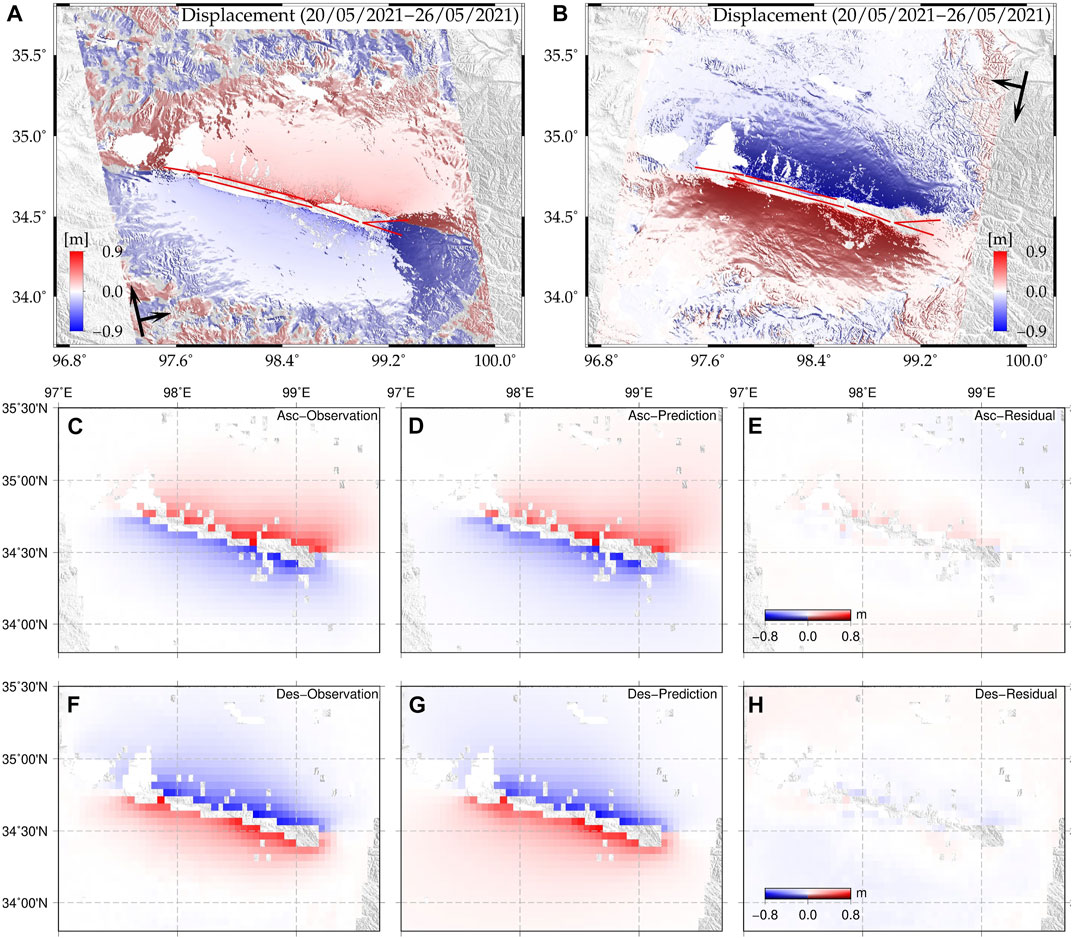
FIGURE 6. Coseismic displacement fields of the Maduo earthquake. Red lines denote the surface rupture traces from field investigations. (A) Ascending obits co-seismic deformation fields; (B) Descending obits co-seismic deformation fields. (C–H) Observation, predicition and residual of fault slip distribution inversion results.
The InSAR coseismic displacement fields show that the seismogenic fault of the Maduo earthquake is almost parallel to the Kunlun Fault and may be connected with the East Kunlun fault zone at its eastern end. The observed coseismic deformation had wide spatial coverage and clear discontinuities across the surface ruptures, indicating that the coseismic rupture broke the surface. Obvious geometrical distortion and bifurcation at the eastern end of the fault indicate complex fault geometry. The maximum uplift and subsidence in line-of-slight (LOS) displacement across the fault was ∼0.9 m (Figure 6). The same numerical magnitudes but different symbols between ascending and descending LOS displacement fields indicate mainly sinistral strike-slip motion. The InSAR deformation is consistent with the trace of observed surface ruptures (Figure 6B and Figure 6D; Zhi-min et al., 2021), with only a small amount of obvious deviation in the easternmost region.
Based on the Okada elastic half-space dislocation model (Okada, 1985), the Green’s functions connecting fault parameters and the observed surface deformation were expressed as:
where d is observed deformation, S(x) is the fault parameters, G is the Green’s functions, and Ɛ is the error associated with the observation and model. Since we established the six-segment fault model based on aftershock fitting, the parameter S(x) only contains one variable (U) to be calculated. The nonlinear function was transformed into a linear function between the coseismic slip and the observations as follows:
where m is the slip on each sub-fault. We imposed a smoothness constraint to ensure that the stress drop had appropriate roughness. Then, we inverted the slip distribution to find the best solution of the objective function. The corresponding mathematical expression is:
where
Deformation field data sampled by uniform down-sampling were used for the inversion. In addition, owing to errors introduced by unwrapping, we removed InSAR deformation data in the near field of the fault (±0.02°). Finally, we obtained 6,562 and 6,339 data points for the descending and ascending tracks, respectively. We then set the maximum iteration to 10,000, which is sufficiently large for convergence. The rake angle ranged from −50° to 50°, which is consistent with the left-lateral strike-slip motion of the 2021 Maduo earthquake. The fault plane was meshed into a series of 2 × 2 km sub-faults for inversion. Notably, there are step-overs among the F3, F4, and F5 segments of the AFFP model (Figure 5).
From the inversion results, the revolved moment magnitude of this earthquake is Mw 7.41. Four asperities were found during the inversion, along with dominant sinistral strike slip motion, which is consistent with the focal mechanism (Figure 7A and Figure 7B). In addition, we also identified some normal slip (with a rake angle of ∼ -50°) at greater depths along the F3 and F5 segments. The peak slip of 4.8 m was located at the junction area of F5. Most of the coseismic slip was concentrated between 0 and 10 km depth and aftershock locations are complementary to the mainshock fault slip (Figure 8). For the residual of the inversion constrained by InSAR data, we found that predicted coseismic deformation on both ascending and descending tracks was consistent with the observations in terms of pattern and magnitude (Figures 7C–H).
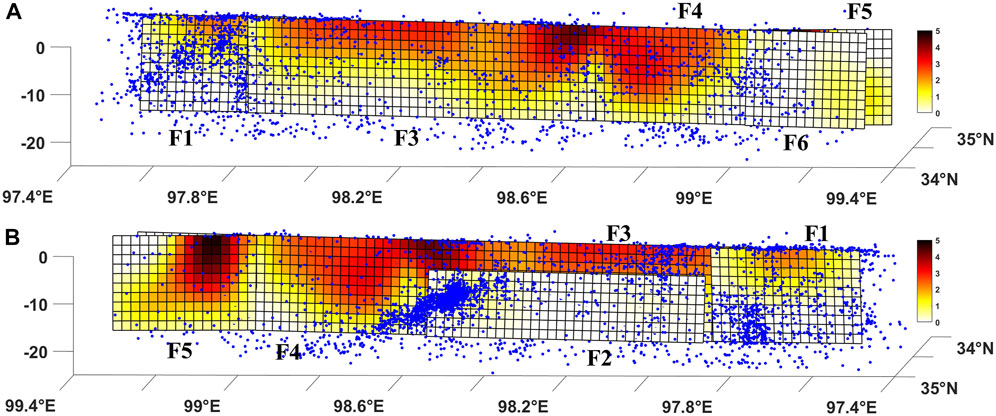
FIGURE 7. Coseismic slip distribution of the aftershock fitted fault plane (AFFP) model in a 3D viewing. (A) Slip distributions on the fault segments F1, F3, F4, and F6 in a 3D viewing; (B) Slip distribution on the secondary fault F2 and the F5 main fault in a 3D viewing. Pink circles are aftershocks within 2–15 days after the mainshock.
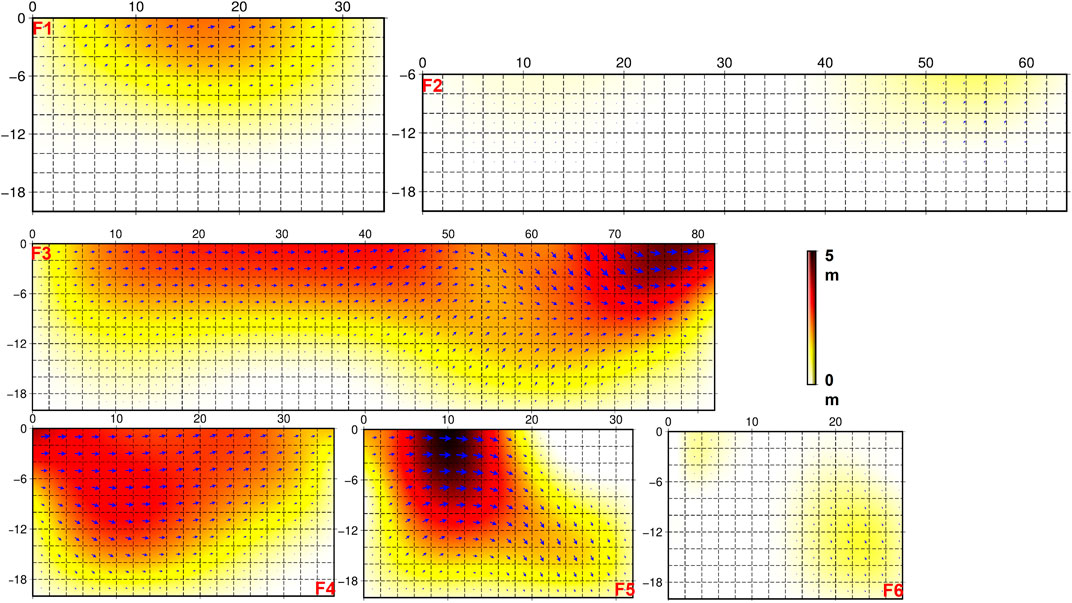
FIGURE 8. Slip distributions of the six fault segments in a 2D viewing.
Our aftershock-fitted, variable-dip, segmented fault model was able to explain the LOS displacement asymmetry on the north and south sides of the fault, and was consistent with the InSAR displacement field. Among the six segments, F2 is a secondary fault and F6 is a bifurcation fault. In the inversion results of coseismic slip distribution, the maximum slip momentum on F2 and F6 was <2 m, further confirming that F1, F3, F4, and F5 represent the main fault. The main rupture occurred in the intersection area of the F3 and F4 segments. The slip amount on the eastern fault was significantly greater than that on the western fault, confirming that the Maduo earthquake had a unilateral rupture trend. F5 had the largest slippage and formed a bifurcation structure with F6. We speculate that there may be a structure between F5 and F6 that hindered fracture extension along the same trend.
We compared our coseismic slip model with the results of four other studies. In terms of fault morphology, Jun et al. (2021) determined a single-section bending fault model with a fixed dip angle. The single-strike single-dip fault models used by Zhi-min et al. (2021) and the USGS (2021) were constrained by Global Positioning System (GPS) data and seismic wave data, respectively. He et al. (2021) used a six-segment fault model with variable strike and dip angles, reflecting the segmented characteristics of faults. Hong et al. (2022) reconstructed a model of one main fault and one secondary fault slip using Interferometric Synthetic Aperture Radar and Global Positioning System data. In terms of slip magnitude, the maximum slip of the Jun et al. (2021) and Zhi-min et al. (2021) models was ∼4–5 m, located on the eastern segment; the maximum slip of the USGS (2021) model was ∼3.2 m, the maximum slip of He et al. (2021) model was ∼5 m, and that of the Hong et al. (2022) model was ∼4.07 m. However, while the slip distributions of the different models differed, each showed multiple slip zones. The main difference between our model and theirs is that our model has more complex geometry (dip angle, segmental type and secondary fault), but the inversion results are consistent with theirs (slip magnitude and location of slip zones). The differences among the models reflect the different data sources and constraints; however, they all contribute to the study of the Maduo earthquake.
The seismogenic structure of the 2021 Maduo mainshock was a 160 km E–W striking fault. Among the segments identified in this study, F2 and F3 run parallel to each other; F2 hosted most of the aftershocks. In past studies of the Maduo earthquake, the western part of the seismogenic fault (97.8°E∼98.5°E) was assumed to have a non-vertical dip angle; for example, 65° (Zhao et al., 2021) or 72° (He et al., 2021). By comparing the aftershock data with surface trace observations, it was assumed that aftershocks located north of the surface trace indicated a north-inclined fault. However, as shown in Figure 5, this does not account for the deep aftershock characteristics. In contrast, we used the aftershock data to fit a near-vertical fault model with a good fitting degree to the surface rupture. Instead of a single inclined fault, our results suggest that aftershocks along F2 actually reveal a secondary fault parallel to the main fault (F3). Despite relatively few aftershocks, we confirmed that F3 was the main fault by removing the F3 from the model. The subsequent fitting results were inconsistent with the InSAR and offset data, confirming that F2 cannot replace F3 as the main coseismic slip surface. Our fault model only matched the observed data when slip on both F2 and F3 was assumed.
Previous studies have shown that, after a large mainshock, aftershocks can occur on secondary faults parallel to the main fault, or may be distributed along both the main fault and its secondary faults (Perrin et al., 2021). Fault zones are formed of three main features: a cataclasite core (Scholz, 1987), dilatant damage zone (Vermilye and Scholz, 1998; Faulkner et al., 2011; Savage and Brodsky, 2011), and shear deformation zone (Powers and Jordan, 2010). In a strike-slip fault, shear deformation zone contains multiple sets of secondary faults, including secondary faults parallel to the main fault. In the case of the 2021 Maduo earthquake, complex topographic and geomorphic features (e.g., near-surface water and soft sediments; Yuan et al., 2022) may have reduced the positioning accuracy of aftershocks and caused a loss of plane features. As a result, we could not judge whether the aftershock in F2 area occurred on the secondary fault parallel to the main fault or on the secondary fault conjugate to it.
Therefore, we also need to admit another case, the F2 fault obtained by the aftershock is actually a discrete rupture zone (It is composed of several secondary faults conjugated to the main fault) in the shear rupture zone of the strike-slip earthquake (Little et al., 1995). This means that most of the aftershocks in this region occur along the discrete rupture zone. Field observations of the surface fracture (Yuan et al., 2022) revealed discrete secondary cracks along the F3 segment, but no obvious continuous fracture, which also verified the existence of conjugate secondary faults. Thus, we suggest that the F2 segment of our AFFP model represents a discrete rupture zone or an immature secondary fault that was activated by the coseismic rupture. However, in this paper, we still prefer to consider F2 as a secondary fault parallel to the main fault.
Along the seismogenic faults of continental strike-slip earthquakes, the structural maturity can vary with strike owing to the lateral propagation of the fault over time (Perrin et al., 2016). Thus, we could use our segmented fault slip parameters to describe local variation in maturity along the fault and the strain distribution characteristics of the seismogenic fault system. Previous studies have shown that, in the absence of data on net fault displacement, the geological slip rate can be also used as a proxy for net displacement in evaluating the overall maturity of the fault (Wesnousky, 1988; Stirling et al., 1996; Choy and Kirby, 2004; Manighetti et al., 2007; Hecker et al., 2010; Niemeijer et al., 2010; Dolan and Haravitch, 2014; Perrin et al., 2016); as net fault displacement increases, the fault grows and becomes more “mature”; that is, faults with large coseismic slip momentum can be considered more mature. According to Perrin et al., the total width of active shear zone around the main fault plane of mature and immature faults is 1.0–2.5km and 6–9km, respectively. In the Maduo earthquake, we believe that the aftershock distribution reveals the total width of the active shear deformation zone, which is about 5km, which proves that the seismogenic fault of the Maduo earthquake is not fully developed and mature.
According to both the slip magnitude (Figure 8) and large number of aftershocks, F2 represents an immature fault. F3 and F4, located on the central–eastern fault, have relatively smooth vertical planes; as a result, they can release a lot of stress quickly resulting in large coseismic slip and few aftershocks. Moreover, the central part of the seismogenic fault (F3 and F4) has the minimum rotation component and only slight extrusion and extensional deformation (Zhao et al., 2021), reflecting obvious linear fracture characteristics and the maturity of the segment. As such, we conclude that the main fault is relatively mature. However, the complex fault segmental structure of the Maduo earthquake shows that the seismogenic faults are generally not mature. This Maduo earthquake reveals the difficulty of assessing the seismic risk of immature strike-slip faults (Li et al., 2022).
We calculate the coseismic Coulomb stress changes (CSC) on the seismogenic fault plane using friction coefficients of 0.4 (Toda et al., 2011). The calculation results show that the maximum stress loading on the whole fault plane is ∼47bar, located in the western half of fault F6, this explains the importance of F6 in tectonic development, and the maximum stress unloading is ∼17bar, located in the area where the end of F4 is about to bifurcation into F5 and F6. We speculate that there may be a hard inelastic triangular structure beneath the F6 segment at the easternmost segment of the fault, and that this structure prevented the rupture from extending along the original strike. Instead, the rupture changed to a northward orientation along the F5 segment, on which there was a significant rupture and a large amount of coseismic deformation. Our results show that most aftershocks occur in the regions with positive CSC and few in the negative CSC regions (Figure 9A and Figure 9B). There are a large number of aftershocks in the stress loading area of F2 fault, which also verifies the reliability of F2 model.
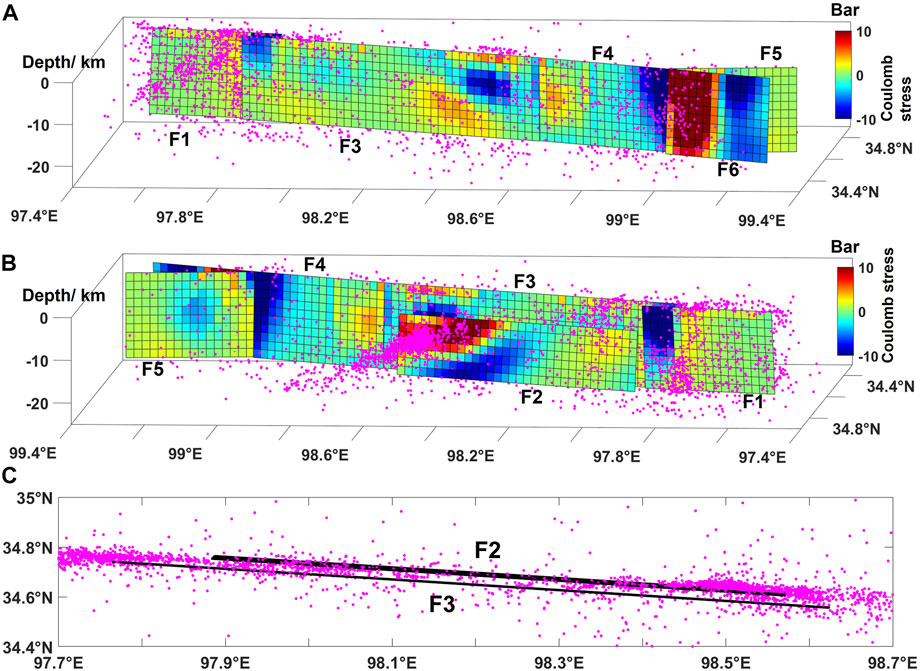
FIGURE 9. (A,B) The coulomb stress changes of the seismogenic fault plane after the Mado earthquake; (C) Projections of the F2, F3 faults and aftershocks on the surface. Pink circles are aftershocks within 0–15 days after the mainshock.
A good fitting relationship between the Maduo earthquake aftershock sequence, InSAR deformation data, and field observations reveal that the seismogenic fault of the KPJF has a complex geometric structure. According to the segmented characteristics of aftershock data, we used a mathematical method to fit the AFFP with six fault segments. A secondary fault on the western end of the fault zone, segment F2, did not reach the surface. However, a continuous main fault (segments F1, F3–F5) experienced large coseismic slip that ruptured to the surface. A branch fault (segment F6) occurred at the easternmost end of the fault zone.
Using the AFFP model and InSAR deformation data to invert the fault slip distribution, we found that the earthquake was a shallow event (0–10 km) with dominant sinistral strike-slip motion. Four asperities were identified and the maximum slip of 4.84 m occurred on the eastern fault zone in an area where the strike changed. We speculate that the central segments of the main seismogenic fault are smooth and mature, with the exception of a parallel secondary fault, while the western and easternmost segments are complex and immature.
The raw data supporting the conclusion of this article will be made available by the authors, without undue reservation.
XF: Conceptualization, Data curation, Formal analysis, Visualization, Writing—original draft. GZ: Conceptualization, Funding acquisition, Methodology, Supervision, Writing—review and editing. DZ: Methodology, Writing—review and editing. CX: Methodology. CH: Data curation. XS: Supervision, Funding acquisition.
This research was funded by the Basic Scientific Funding of Institute of Geology, China Earthquake Administration (grant number IGCEA2005), the National Natural Science Foundation of China (grant number U2139202) and the National Key Research and Development Program of China (grant number 2019YFC1509205).
The figures in this study were generated using the public domain Generic Mapping Tools (GMT) software. Thanks to Guangcai Feng ‘s team for providing InSAR deformation results as a reference comparison.
The remaining authors declare that the research was conducted in the absence of any commercial or financial relationships that could be construed as a potential conflict of interest.
The reviewer SH declared a shared affiliation with the authors XF, GZ, DZ, XS to the handling editor at the time of review.
All claims expressed in this article are solely those of the authors and do not necessarily represent those of their affiliated organizations, or those of the publisher, the editors and the reviewers. Any product that may be evaluated in this article, or claim that may be made by its manufacturer, is not guaranteed or endorsed by the publisher.
Breunig, M. M., Kriegel, H. P., Ng, R. T., and Sander, J. (2000). “LOF: identifying density-based local outliers,” in Proceedings of the 2000 ACM SIGMOD international conference on Management of data, Dallas, Texas, USA, May 16-18, 2000, 93–104.
Chen, H., Qu, C., Zhao, D., Ma, C., and Shan, X. (2021). Rupture kinematics and coseismic slip model of the 2021 Mw 7.3 Maduo (China) earthquake: Implications for the seismic hazard of the Kunlun fault. Remote Sens. 13 (16), 3327. doi:10.3390/rs13163327
Chiarabba, C., Amato, A., Anselmi, M., Baccheschi, P., Bianchi, I., Cattaneo, M., et al. (2009). The 2009 L'Aquila (central Italy) MW6.3 earthquake: Main shock and aftershocks. Geophys. Res. Lett. 36, L18308. doi:10.1029/2009GL039627
Choy, G. L., and Kirby, S. H. (2004). Apparent stress, fault maturity and seismic hazard for normal-fault earthquakes at subduction zones. Geophys. J. Int. 159 (3), 991–1012. doi:10.1111/j.1365-246X.2004.02449.x
Dietz, L. D., and Ellsworth, W. L. (1990). The October 17, 1989, Loma Prieta, California, earthquake and its aftershocks: Geometry of the sequence from high-resolution locations. Geophys. Res. Lett. 17 (9), 1417–1420. doi:10.1029/GL017i009p01417
Dolan, J. F., and Haravitch, B. D. (2014). How well do surface slip measurements track slip at depth in large strike-slip earthquakes? The importance of fault structural maturity in controlling on-fault slip versus off-fault surface deformation. Earth Planet. Sci. Lett. 388, 38–47. doi:10.1016/j.epsl.2013.11.043
Fang, L., Wu, J., Su, J., Wang, M., Jiang, C., Fan, L., et al. (2018). Relocation of mainshock and aftershock sequence of the <italic>M</italic><sub>s</sub>7.0 Sichuan Jiuzhaigou earthquake. Chin. Sci. Bull. 63 (7), 649–662. doi:10.1360/n972017-01184
Faulkner, D. R., Mitchell, T. M., Jensen, E., and Cembrano, J. (2011). Scaling of fault damage zones with displacement and the implications for fault growth processes. J. Geophys. Res. 116 (B5), B05403. doi:10.1029/2010JB007788
Hauksson, E. (2010). “Spatial separation of large earthquakes, aftershocks, and background seismicity: Analysis of interseismic and coseismic seismicity patterns in southern California,” in Seismogenesis and earthquake forecasting: The frank evison volume II (Basel: Springer), 125–143.
He, L., Feng, G., Wu, X., Lu, H., Xu, W., Wang, Y., et al. (2021). Coseismic and early postseismic slip models of the 2021 Mw 7.4 Maduo earthquake (Western China) estimated by space‐based geodetic data. Geophys. Res. Lett. 48 (24), e2021GL095860. doi:10.1029/2021GL095860
Hecker, S., Dawson, T. E., and Schwartz, D. P. (2010). Normal-faulting slip maxima and stress-drop variability: A geological perspective. Bull. Seismol. Soc. Am. 100 (6), 3130–3147. doi:10.1785/0120090356
Hong, S., Liu, M., Liu, T., Dong, Y., Chen, L., Meng, G., et al. (2022). Fault source model and stress changes of the 2021 Mw 7.4 Maduo earthquake, China, constrained by InSAR and GPS measurements. Bull. Seismol. Soc. Am. 112 (3), 1284–1296. doi:10.1785/0120210250
Hong-Wei, T., Rong‐Jiang, W., Fa-Qi, D., Yong, Z., Yong‐Ge, W., and Ming‐Pei, J. (2016). Slip model of the 2001 Kunlun mountain MS8.1 earthquake by SDM: Joint inversion from GPS and InSAR data. Chin. J. Geophys. 59 (4), 404–413. doi:10.1002/cjg2.20245
Jun, H., De-zheng, Z., Xin-jian, S., Chun-yan, Q., Ying-feng, Z., Wen-yu, G., et al. (2021). Coseismic deformation field, slip distribution and Coulomb stress disturbance of the 2021 Mw7. 3 Maduo earthquake using Sentinel-1 InSAR observations. Seismol. Egology 43 (3), 677. doi:10.3969/j.issn.0253-4967.2021.03.013
Li, C., Li, T., Shan, X., and Zhang, G. (2022). Extremely large off-fault deformation during the 2021 Mw 7.4 Maduo earthquake, Tibetan Plateau. Seismol. Res. Lett. XX, 1–13.
Li, H., Qi, X., Zhu, Y., Yang, J., Tapponnier, P., Shi, L., et al. (2004). Asymmetrical Co-seismic surface ruptures in the east Kunlun earthquake (Ms-8.1), northern Tibetan plateau, China. Acta Geol. Sinica-Chinese Ed. 78 (5), 633–640. doi:10.1007/BF02873097
Little, T. A. (1995). Brittle deformation adjacent to the Awatere strike-slip fault in New Zealand: Faulting patterns, scaling relationships, and displacement partitioning. Geol. Soc. Am. Bull. 107 (11), 1255–1271. doi:10.1130/0016-7606(1995)107<1255:BDATTA>2.3.CO;2
Manighetti, I., Campillo, M., Bouley, S., and Cotton, F. (2007). Earthquake scaling, fault segmentation, and structural maturity. Earth Planet. Sci. Lett. 253 (3-4), 429–438. doi:10.1016/j.epsl.2006.11.004
Niemeijer, A., Marone, C., and Elsworth, D. (2010). Fabric induced weakness of tectonic faults. Geophys. Res. Lett. 37 (3). doi:10.1029/2009GL041689
Okada, Y. (1985). Surface deformation due to shear and tensile faults in a half-space. Bull. Seismol. Soc. Am. 75 (4), 1135–1154. doi:10.1785/bssa0750041135
Pan, J., Li, H., Chevalier, M. L., Tapponnier, P., Bai, M., Li, C., et al. (2022). Co-seismic rupture of the 2021, M 7.4 Maduo earthquake (northern Tibet): Short-cutting of the Kunlun fault big bend. Earth Planet. Sci. Lett. 594, 117703. doi:10.1016/j.epsl.2022.117703
Parsons, T., Ji, C., and Kirby, E. (2008). Stress changes from the 2008 Wenchuan earthquake and increased hazard in the Sichuan basin. Nature 454 (7203), 509–510. doi:10.1038/nature07177
Perrin, C., Manighetti, I., Ampuero, J. P., Cappa, F., and Gaudemer, Y. (2016). Location of largest earthquake slip and fast rupture controlled by along‐strike change in fault structural maturity due to fault growth. J. Geophys. Res. Solid Earth 121 (5), 3666–3685. doi:10.1002/2015JB012671
Perrin, C., Waldhauser, F., and Scholz, C. H. (2021). The shear deformation zone and the smoothing of faults with displacement. JGR. Solid Earth 126 (5), e2020JB020447. doi:10.1029/2020JB020447
Powers, P. M., and Jordan, T. H. (2010). Distribution of seismicity across strike‐slip faults in California. J. Geophys. Res. 115 (B5), B05305. doi:10.1029/2008JB006234
Qi-Dong, D., Shao‐Ping, C., Ji, M., and Peng, D. (2014). Seismic activities and earthquake potential in the Tibetan Plateau. Chin. J. Geophys. 57 (5), 678–697. doi:10.1002/cjg2.20133
Qi-Dong, D., Xiang, G., Gui-Hua, C., and Hu, Y. (2010). Recent tectonic activity of Bayankala fault block and the Kunlun Wenchuan earthquake series of the Tibetan Plateau. Earth Sci. Front. 17 (5), 163.
Ren, J., Xu, X., Zhang, G., Wang, Q., Zhang, Z., Gai, H., et al. (2022). Coseismic surface ruptures, slip distribution, and 3D seismogenic fault for the 2021 Mw 7.3 Maduo earthquake, central Tibetan Plateau, and its tectonic implications. Tectonophysics 827, 229275. doi:10.1016/j.tecto.2022.229275
Savage, H. M., and Brodsky, E. E. (2011). Collateral damage: Evolution with displacement of fracture distribution and secondary fault strands in fault damage zones. J. Geophys. Res. 116 (B3), B03405. doi:10.1029/2010JB007665
Scholz, C. H. (1987). Wear and gouge formation in brittle faulting. Geol. 15 (6), 493–495. doi:10.1130/0091-7613(1987)15<493:WAGFIB>2.0.CO;2
Stirling, M. W., Wesnousky, S. G., and Shimazaki, K. (1996). fault trace complexity, cumulative slip, and the shape of the magnitude-frequency distribution for strike-slip faults: A global survey. Geophys. J. Int. 124 (3), 833–868. doi:10.1111/j.1365-246X.1996.tb05641.x
Tobita, M., Nishimura, T., Kobayashi, T., Hao, K. X., and Shindo, Y. (2011). Estimation of coseismic deformation and a fault model of the 2010 Yushu earthquake using PALSAR interferometry data. Earth Planet. Sci. Lett. 307 (3-4), 430–438. doi:10.1016/j.epsl.2011.05.017
Toda, S., Stein, R. S., Sevilgen, V., and Lin, J. (2011). Coulomb 3.3 graphic-rich deformation and stress-change software for earthquake, tectonic, and volcano research and teaching—user guide. U. S. Geol. Surv. open-file Rep. 1060, 63.
Valoroso, L., Chiaraluce, L., and Collettini, C. (2014). Earthquakes and fault zone structure. Geology 42 (4), 343–346. doi:10.1130/G35071.1
Vermilye, J. M., and Scholz, C. H. (1998). The process zone: A microstructural view of fault growth. J. Geophys. Res. 103 (B6), 12223–12237. doi:10.1029/98JB00957
Wan, Y., Shen, Z. K., Bürgmann, R., Sun, J., and Wang, M. (2016). Fault geometry and slip distribution of the 2008 Mw 7.9 Wenchuan, China earthquake, inferred from GPS and InSAR measurements. Geophys. J. Int. 208, 748–766. doi:10.1093/gji/ggw421
Wang, C., Ke, J., Jiang, J., Lu, M., Xiu, W., Liu, P., et al. (2019). Visual analytics of aftershock point cloud data in complex fault systems. Solid earth. 10 (4), 1397–1407. doi:10.5194/se-10-1397-2019
Wang, R., Parolai, S., Ge, M., Jin, M., Walter, T. R., and Zschau, J. (2013). The 2011 M w 9.0 Tohoku earthquake: Comparison of GPS and strong‐motion data. Bull. Seismol. Soc. Am. 103 (2B), 1336–1347. doi:10.1785/0120110264
Wang, W., Fang, L., Wu, J., Tu, H., Chen, L., Lai, G., et al. (2021). Aftershock sequence relocation of the 2021 Ms7. 4 Maduo earthquake, qinghai, China. Sci. China Earth Sci. 64 (8), 1371–1380. doi:10.1007/s11430-021-9803-3
Wen, X. Z., Du, F., Zhang, P. Z., and Long, F. (2011). Correlation of major earthquake sequences on the northern and eastern boundaries of the Bayan Har block, and its relation to the 2008 Wenchuan earthquake. Chin. J. Geophys. 54 (3), 706–716. doi:10.3969/j.issn.0001-5733.2011.03.010
Werner, C., Wegmüller, U., and Strozzi, T., (2002). “Processing strategies for phase unwrapping for INSAR applications,” in proceedings of the European conference on synthetic aperture radar (EUSAR 2002), Bern, Switzerland, May 13, 2002, 353–356.
Werner, C., Wegmueller, U., Strozzi, T., and Wiesmann, A. (2000). “Gamma SAR and interferometric processing software,” in Proceedings of the ers-envisat symposium, Gothenburg, Sweden, 16-20 Oct, 1620.
Wesnousky, S. G. (1988). Seismological and structural evolution of strike-slip faults. Nature 335 (6188), 340–343. doi:10.1038/335340a0
Xu, X., Tan, X., Yu, G., Wu, G., Fang, W., Chen, J., et al. (2013). Normal-and oblique-slip of the 2008 Yutian earthquake: Evidence for eastward block motion, northern Tibetan Plateau. Tectonophysics 584, 152–165. doi:10.1016/j.tecto.2012.08.007
Yuan, Z., Li, T., Su, P., Sun, H., Ha, G., Guo, P., et al. (2022). Large surface‐rupture gaps and low surface fault slip of the 2021 Mw 7.4 Maduo earthquake along a low‐activity strike‐slip fault, Tibetan plateau. Geophys. Res. Lett. 49 (6), e2021GL096874. doi:10.1029/2021GL096874
Zhang, P., Deng, Q., Zhang, G., Ma, J., Gan, W., Min, W., et al. (2003). Active tectonic blocks and strong earthquakes in the continent of China. Sci. China Ser. D Earth Sci. 46 (2), 13–24. doi:10.1360/03dz0002
Zhao, D., Qu, C., Chen, H., Shan, X., Song, X., and Gong, W. (2021). Tectonic and geometric control on fault kinematics of the 2021 Mw7. 3 Maduo (China) earthquake inferred from interseismic, coseismic, and postseismic InSAR observations. Geophys. Res. Lett. 48 (18), e2021GL095417. doi:10.1029/2021GL095417
Zhi-min, L., Wen-qiao, L., Tao, L., Yue-ren, X., Peng, S., Peng, G., et al. (2021). seismogenic fault and coseismic surface deformation of the Maduo Ms7. 4 earthquake in qinghai, China: A quick report. Seismol. Egology 43 (3), 722. doi:10.3969/j.issn.0253-4967.2021.03.016
Keywords: 2021 Mw7.3 Maduo earthquake, aftershock point cloud fitting, InSAR coseismic deformation, fault geometry, slip distribution
Citation: Fan X, Zhang G, Zhao D, Xie C, Huang C and Shan X (2022) Fault geometry and kinematics of the 2021 Mw 7.3 Maduo earthquake from aftershocks and InSAR observations. Front. Earth Sci. 10:993984. doi: 10.3389/feart.2022.993984
Received: 14 July 2022; Accepted: 24 August 2022;
Published: 19 September 2022.
Edited by:
Zhenjie Wang, China University of Petroleum, ChinaReviewed by:
Mahdi Behyari, Urmia University, IranCopyright © 2022 Fan, Zhang, Zhao, Xie, Huang and Shan. This is an open-access article distributed under the terms of the Creative Commons Attribution License (CC BY). The use, distribution or reproduction in other forums is permitted, provided the original author(s) and the copyright owner(s) are credited and that the original publication in this journal is cited, in accordance with accepted academic practice. No use, distribution or reproduction is permitted which does not comply with these terms.
*Correspondence: Guohong Zhang, emhhbmdnaEBpZXMuYWMuY24=
Disclaimer: All claims expressed in this article are solely those of the authors and do not necessarily represent those of their affiliated organizations, or those of the publisher, the editors and the reviewers. Any product that may be evaluated in this article or claim that may be made by its manufacturer is not guaranteed or endorsed by the publisher.
Research integrity at Frontiers
Learn more about the work of our research integrity team to safeguard the quality of each article we publish.