
94% of researchers rate our articles as excellent or good
Learn more about the work of our research integrity team to safeguard the quality of each article we publish.
Find out more
BRIEF RESEARCH REPORT article
Front. Earth Sci. , 09 January 2023
Sec. Solid Earth Geophysics
Volume 10 - 2022 | https://doi.org/10.3389/feart.2022.993465
This article is part of the Research Topic Advances and Applications of Distributed Optical Fiber Sensing (DOFS) in Multi-scales Geoscience Problems View all 13 articles
Distributed acoustic sensing in vertical seismic profile (DAS-VSP) acquisition plays an important role in reservoir monitoring. But the field data can be noisy and associated with missing traces which affects the seismic imaging and geological interpretation. Therefore, the DAS-VSP seismic data reconstruction with a high signal-to-noise ratio (SNR) is worth studying. There are no exact relationships between signals and noise in the t-x domain DAS-VSP seismic data, which means that reconstructing signals and suppressing noise simultaneously by the deep neural network is difficult. We develop a novel algorithm based on U-net in combination with the Hankel matrix as input/output, rather than t-x domain seismic data. The frequency domain Hankel matrix of the seismic data is proposed to facilitate the reconstruction and denoising of DAS-VSP seismic data as a rank reduction problem of the high-rank matrix. The Hankel matrices of incomplete data with noise are high-rank ones while those of complete data without noise are low-rank ones, which is beneficial to the network learning. In our proposed rank reduction U-net (RRU-net), two-channel input/output layers are designed for the real and the imaginary parts of the Hankel matrix in the frequency domain. Thus, reconstructed data with high precision and high SNR could be obtained using a trained RRU-net. Meanwhile, we tested our RRU-net algorithm on two synthetic data and one field data, and the results show the effectiveness and the feasibility of the method. Our algorithm performs better than both the U-net-based method that uses
Recently, DAS has been used in vertical seismic profile (VSP) acquisition for permanent reservoir monitoring due to its advantages of full vertical coverage, low cost, repeatability, adaptability to high-temperature and high-pressure environment, and long-term deployment (Miller et al., 2012). However, the quality of DAS seismic data is poor for the following three reasons: first, the low sensitivity of DAS results in the weakly received upward-reflected signal, worsened by a large amount of environmental noise, optical noise, and “ringing” noise. Second, the obstacles in the acquisition area and the pressure of economic costs for long-term monitoring result in low-density shot arrangement and sparsely acquired data. Third, the perforation operation can easily destroy the fiber in the well, making the signals hardly recordable at this point. Additionally, the storage cost for time-lapse DAS-VSP seismic data is usually measured in TB, which is a challenge for data processing. Briefly, the DAS-VSP seismic data have the characteristics of low SNR, sparseness, and big data. Therefore, it is necessary to research the reconstruction and denoising of the DAS-VSP seismic data in high precision and real time.
Thanks to the rapid development of deep learning technology in the field of image processing in recent years (Krizhevsky et al., 2012; Ronneberger et al., 2015; Liu et al., 2018), intelligent processing has been widely used in the field of massive seismic data reconstruction (Jia and Ma, 2017; Jia et al., 2018; Mandelli et al., 2018). Among those methods, the convolutional neural network (CNN) is the most widely used method. The local perception capability of the CNN could extract more detailed intrinsic features of data. At the same time, the number of CNN parameters could be reduced by weight-sharing, which improves the training speed of the network. This kind of method (deep learning methods, including the aforementioned CNN) extracts the inherent high-dimensional features of the data adaptively through massive datasets and does not rely on prior conditions and artificial experience. Moreover, the trained net takes less than a few milliseconds to predict
Among the traditional simultaneous reconstruction and denoising methods of seismic data, the rank reduction based on the Hankel matrix is one of the effective methods (Gao et al., 2011; Oropeza and Sacchi, 2011; Chen et al., 2016). The principle is that the seismic data will repeatedly record the information of the same or adjacent underground locations, so that the seismic data have a low-rank structure. The absence of data or the noise will increase the rank; therefore, seismic data reconstruction and noise suppression can be regarded as the rank reduction problem of the high-rank matrix. However, the data in some columns are all zero in the incomplete seismic data gather, which will lead to instability in the rank reduction process. Generally, the incomplete seismic data need to be transformed into a Hankel matrix and then the rank of which will be reduced by singular value decomposition (SVD) (Cadzow, 1988; Trickett, 2008; Gao et al., 2011; Popa et al., 2021). The disadvantage of the rank reduction method is that the SVD of large Hankel matrices requires a huge amount of computational cost, which makes it unsuitable for massive DAS-VSP monitoring data. In addition, it is difficult to determine the number of retained eigenvalues in the SVD process, which will lead to insufficient noise suppression or signal leakage.
In this article, we propose a simultaneous reconstruction and denoising method for DAS-VSP seismic data under the framework of deep learning based on rank reduction. When using a U-net instead of the SVD process of the Hankel matrix, the U-net is trained to learn the mapping relationship between the high-rank Hankel matrix (noisy missing data) and the low-rank Hankel matrix (noise-free complete data) adaptively, which neatly avoids the shortcomings of the rank reduction method. First, the
Fully sampled seismic data can be represented by a low-rank matrix. Missing trace or noise will increase the rank of the data. Therefore, the reconstruction and denoising of DAS-VSP seismic data can be regarded as a rank reduction problem of a high-rank matrix (Sacchi, 2009; Oropeza and Sacchi, 2011). When approximated, seismic data are linear within the
where
For regularly sampled seismic data,
where
The equation for constructing the Hankel matrix with seismic data in the frequency domain is
where
From Eq. 6, there is a linear relationship among the columns of the Hankel matrix, that is, the rank of the matrix is 1. Similarly, it can be proved that when the seismic data contain multiple dip events, the rank of the Hankel matrix is equal to the number of dips. Therefore, the Hankel matrix constructed with the seismic data in the frequency domain is a low-rank Hankel matrix. When there are missing traces or noise, Eq. 6 becomes non-linear; thus, the rank of
In Eq. 7,
where
where
Next, the elements along the anti-diagonal of the matrix
The architecture of the RRU-net proposed in this article is shown in Figure 1. The main part of this network is a U-net with 27 layers, which is a symmetric structure based on CNNs (Falk et al., 2019). The input of the RRU-net is the Hankel matrix of seismic data in the frequency domain. Since the elements in the Hankel matrix are complex, the real convolution neural network cannot process the data directly. We design the U-net with two-channel input/output layers, which correspond to the real and imaginary parts of the Hankel matrix, respectively. In this way, the RRU-net can extract signal features from both the real and imaginary parts of the input data. The U-net has three important components. One is the encoder (left side) composed of the repeated operators of two
In Eq. 11,
where
We prepare the training data with the synthetic signals by forward modeling and the noises from the field DAS-VSP seismic data. The synthetic signals are simulated by forward modeling using the finite difference method for a 2D profile of the SEAM model (Figure 2). The model has 70 km width and 5 km depth, and the velocity range is distributed from 1,490 m/s to 4,800 m/s. The well is located at 3 km (the white stripe in Figure 2) and equipped with 401 receivers (the blue triangle in Figure 2) spaced at 10-m intervals and has a depth range from 0 to 4,000 m. There are 176 sources spaced at 40-m intervals (the red circle in Figure 2) at the surface. A 30-Hz Ricker wavelet is used in the simulation. The size of the synthetic data is
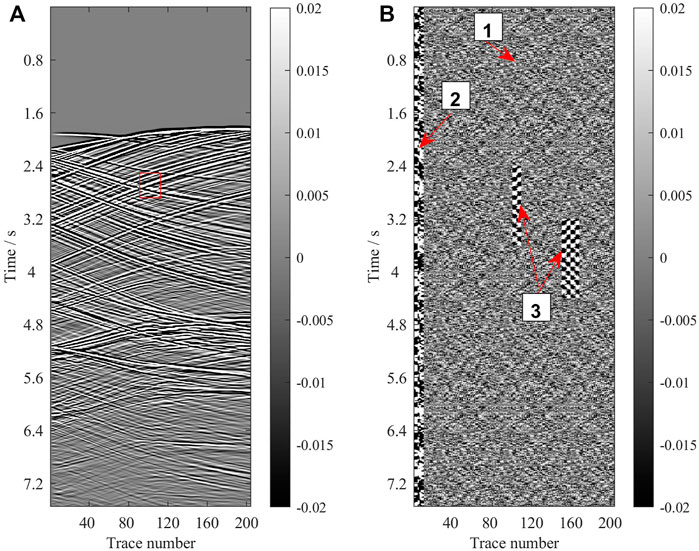
FIGURE 3. (A) Synthetic noise-free complete signal data and the shot is located at
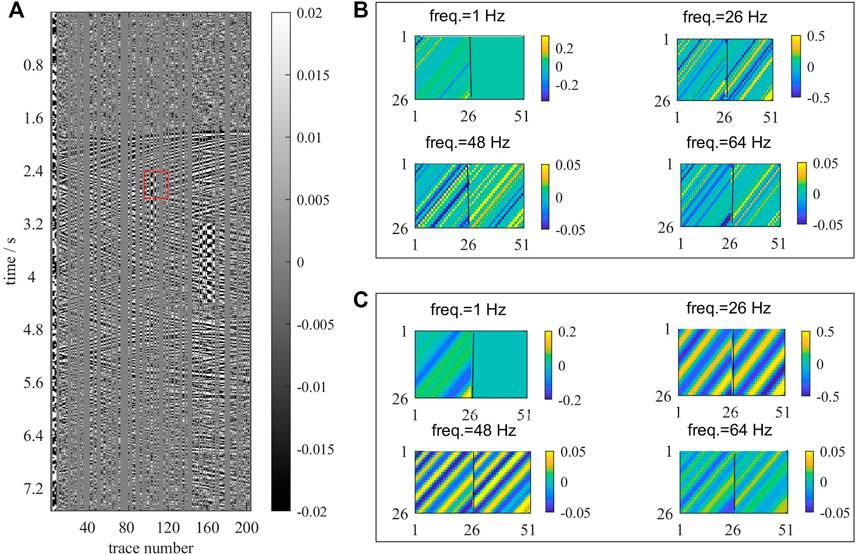
FIGURE 4. (A) Synthetic noisy incomplete data based on Figure 3 and the missing trace percentage is 56.4%. (B) Hankel matrices in different frequencies of the noise incomplete data in the red rectangle of Figure 4A; each Hankel matrix contains a real part (left side) and an imaginary part (right side). (C) Hankel matrices in different frequencies of the noise-free complete data in the red rectangle of Figure 3A; each Hankel matrix contains a real part (left side) and an imaginary part (right side).
The training environment is in the PyTorch framework with GPU (8 cores) in the Linux system. The total training cost is about 25 h, and the loss error in epochs is shown in Figure 5.
The reconstruction and denoising effectiveness of the trained RRU-net is validated by two synthetic datasets and one field dataset. One of the synthetic datasets is modeled by the same velocity model as the training dataset (Figure 4) with different source positions. The other is from the Marmousi2 model. The field DAS-VSP records are employed to test the generalization capacity of the RRU-net. Moreover, to prove the superiority of the RRU-net in handling simultaneous reconstruction and denoising of the DAS-VSP data, we compare the results of the RRU-net with those of the rank reduction method and U-net trained with t-x-domain data.
There are 26 shot gathers in the first synthetic records to be tested. One of the processed gathers by the rank reduction method, U-net, and RRU-net is presented in Figures 6C,D,E, respectively. The original data are shown in Figures 6A,B. These figures show data with 65% missing traces. Figures 6C,D show that the rank reduction method and U-net cannot suppress the strong ringing noise as marked by the red arrows, while the RRU-net is able to suppress it more entirely as seen in Figure 6E. Meanwhile, the signals divided in the window with the strong ringing noise also are suppressed by the rank reduction method (Figure 6C) because in the SVD process for the near traces, ringing noise dominates the eigenvalues. As we can see in Figures 6D,E, the RRU-net suppressed the horizontal noise (red rectangle) more efficiently than the other two methods. In addition, the RRU-net performs the best in suppressing the background noise. For the missing signal reconstruction, the near traces are barely reconstructed by the rank reduction method as shown in Figure 6C, while the U-net method has poor effectiveness for the big gap as marked by the yellow arrow in Figure 6D. Contrary to the rank reduction method and U-net, the reconstructed signal by the RRU-net is complete, and the event continuity is the best as shown in Figure 6E.
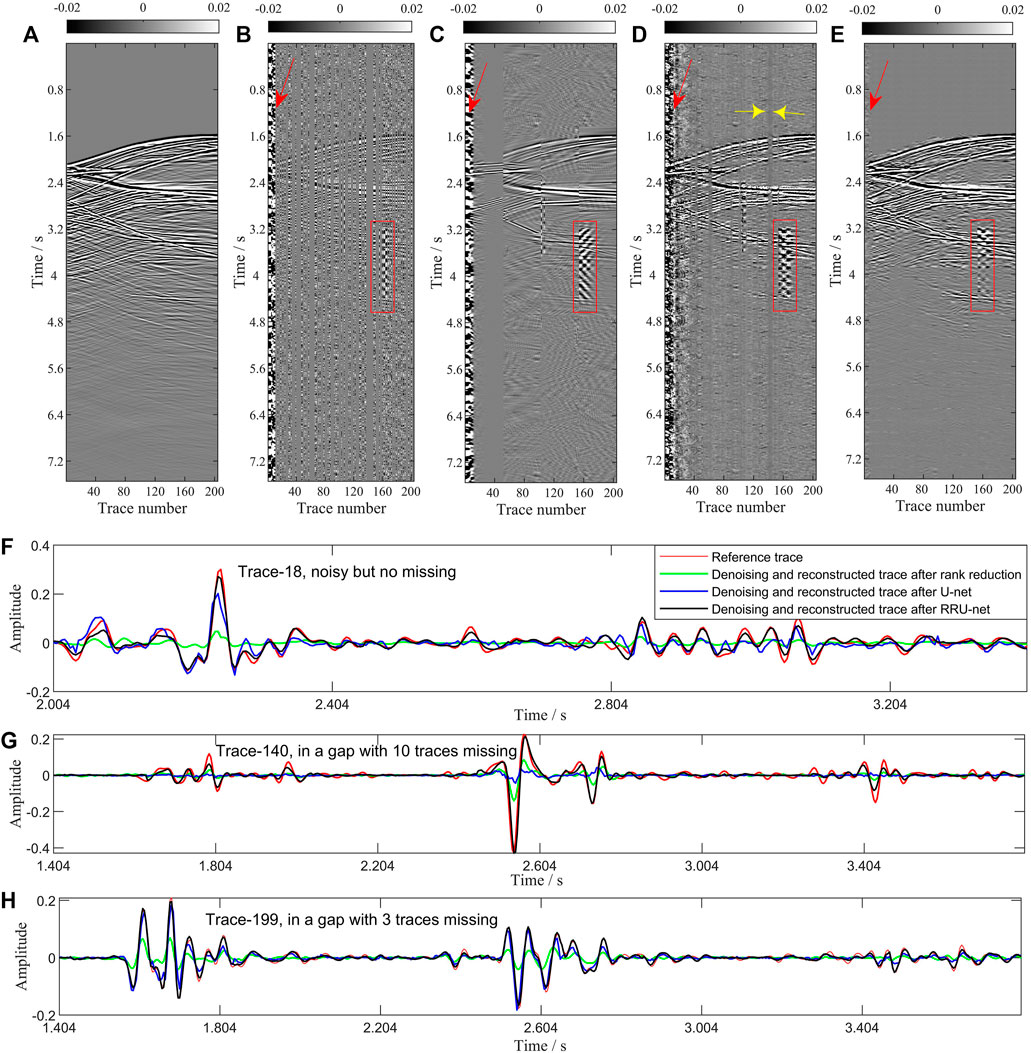
FIGURE 6. Simultaneous reconstruction and denoising results of the three methods on synthetic data generated with the SEAM model. (A) Synthetic noise-free complete signal data and the shot is located at
To prove the accuracy of the reconstructed signals and to confirm whether the studied method harms the signal in the denoised results, we carry out a detailed 1D waveform comparison. Three traces are shown in Figures 6F–H, respectively. Figure 6F is the denoised results of the 18th trace in Figure 6B. Figures 6G,H are the reconstructed signals of the 140th and 199th trace, respectively, which are in different gaps. The 1D waveform comparison shows that the RRU-net method best fits the single trace and yields fewer reconstruction errors. Additionally, the SNR of the 26 shot gathers processed by the three methods is presented in Figure 7. It is obvious that the SNR of the proposed network is much higher than that of the other two methods. To complete the processing of the 26 shot gathers, the rank reduction method takes 44 s, and the U-net and RRU-net take less than 5s, which demonstrates the efficiency of the deep learning method. All these analyses affirm that the proposed RRU-net can suppress the noise and reconstruct the missing signal effectively. However, for weak signals below 4s, none of these three methods can obtain satisfactory reconstruction results as the weak signal is completely buried in the strong background noise as shown in Figure 6B. In addition, the cross term between the real part and imaginary part of the Hankel matrix in the frequency domain is ignored as we apply the real neural network, which may affect the effectiveness of the proposed method.
To test the effect of the trained network on other synthetic data, we use the RRU-net to reconstruct and denoise the DAS-VSP data generated using the Marmousi2 model. The data include a total of 21 shots and 255 receivers per shot, and every trace has 1,000 temporal sampling points. One of the processed gathers by the three methods is presented in Figure 8. As highlighted by the arrows and the boxes (Figures 8B–E), the RRU-net yields the best denoising results, and the 1D waveform comparison of different traces (Figures 8F–H) shows the accuracy of the reconstructed signals by our method. The average SNR value of gathers with noise and 65% missing traces is −17.09 dB, which is increased to 25.69 dB after reconstruction by the RRU-net.
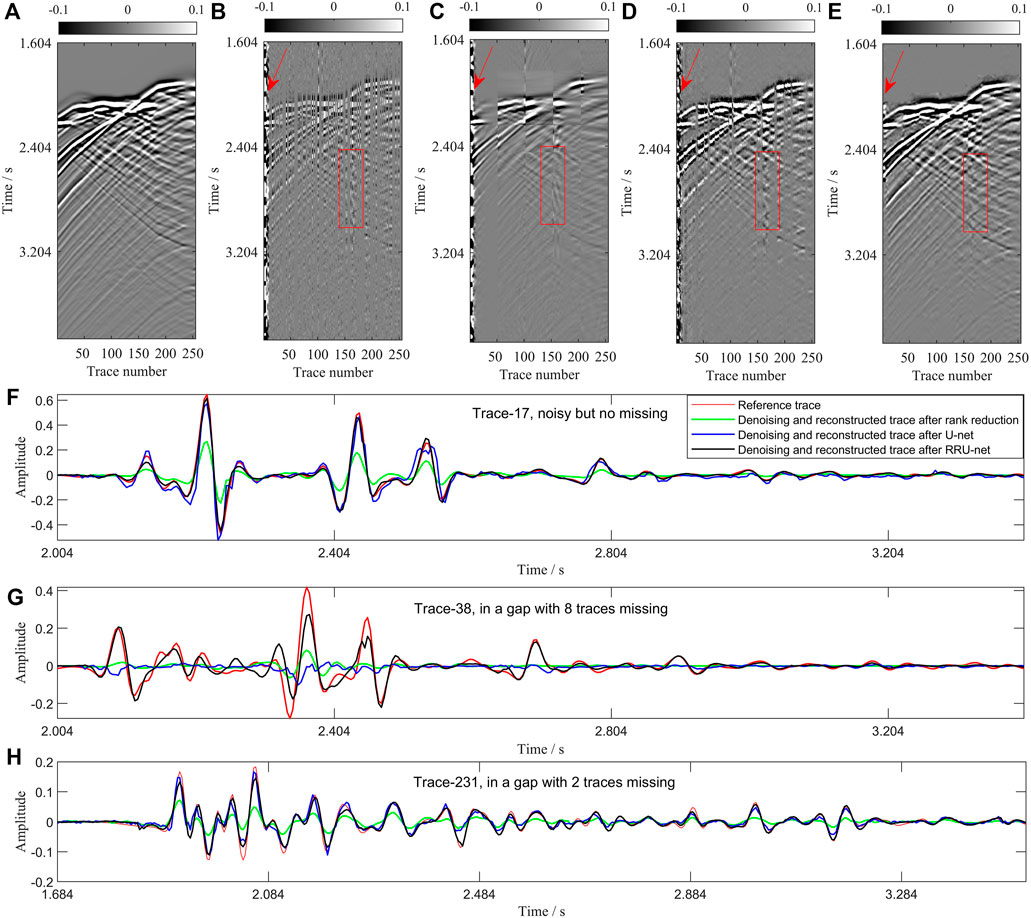
FIGURE 8. Simultaneous reconstruction and denoising results of the three methods on synthetic data generated using the Marmousi2 model. (A) Synthetic noise-free complete signal data. (B) Original gather with noise and the trace missing percentage is 63%. (C) Result by rank reduction. (D) Result by U-net. (E) Result by RRU-net. (F–H) One-dimensional waveform comparison.
To further prove the effectiveness of the proposed method, two real DAS-VSP gathers are tested. The data contain 5001 samples along the time axis with a 1-ms time interval and 204 receivers along the well with a 0.1-m space interval as shown in Figures 9Ai,Ei. The signal in Figures 9Ai,Ei is strongly contaminated by several types of noise, and nearly 50% of the traces are missing. The denoised and reconstructed results by rank reduction, U-net, and RRU-net are presented in Figures 9Bi–Di, Fi–Hi, respectively. The rank reduction method in Figures 9Bi,Fi shows the ability to suppress the background noise but fails to preserve the signal events. The RRU-net could suppress the strong ringing noise (red arrows) and the horizontal noise (red rectangles) in Figures 9Di,Hi, while the other two methods could not (Figures 9Bi,Ci,Fi,Gi). At the same time, the RRU-net method also performs very well in recovering the missing signals. The FK spectrum in Figures 9Aii–Dii,Eii–Hii further illustrates the validity of this algorithm.
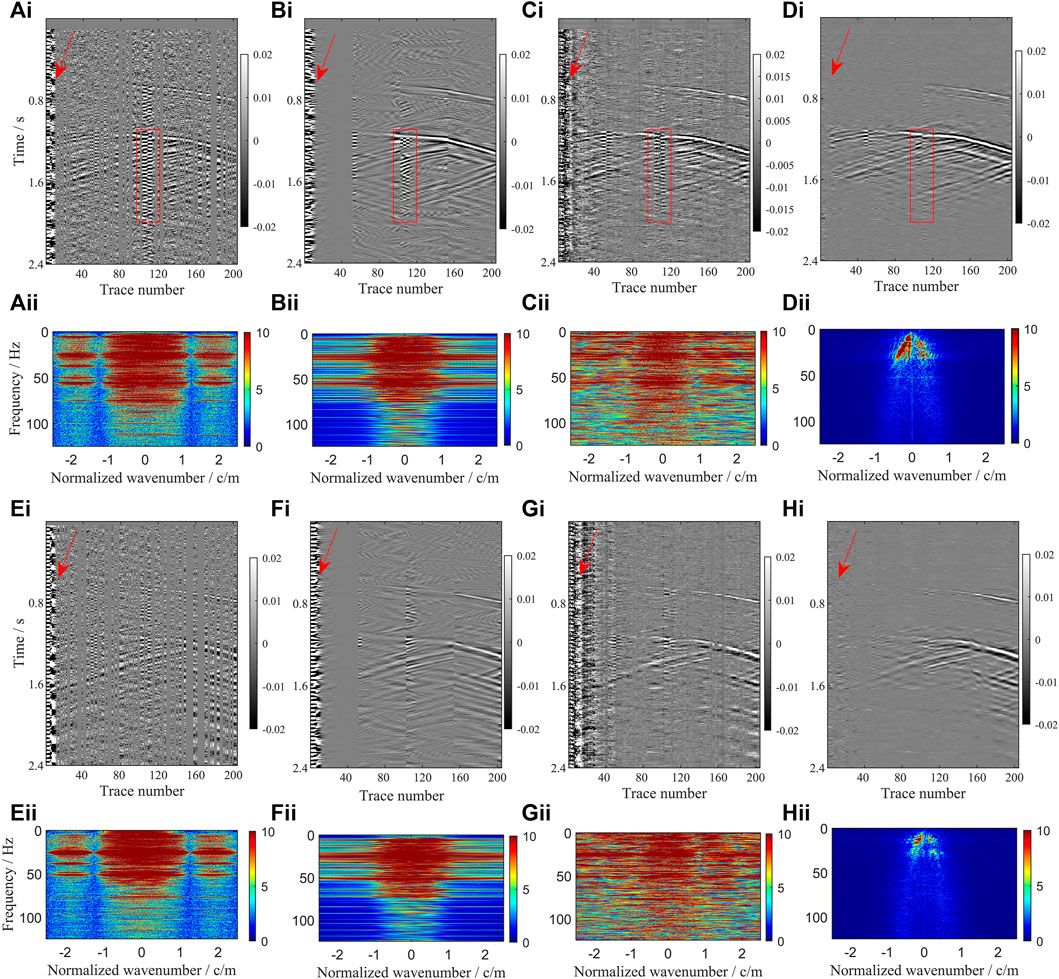
FIGURE 9. Simultaneous reconstruction and denoising results of the three methods in field DAS-VSP data. (Ai) Original field DAS-VSP data, shot1. (Bi) Result of (Ai) by rank reduction. (Ci) Result of (Ai) by U-net. (Di) Result of (Ai) by RRU-net. (Aii–Dii) FK spectrum of (Ai–Di), respectively. (Ei) Original field DAS-VSP data, shot1. (Fi) Result of (Ei) by rank reduction. (Gi) Result of (Ei) by U-net. (Hi) Result of (Ei) by RRU-net. (Eii–Hii) FK spectrum of (Ei–Hi), respectively.
Testing the trained RRU-net on both synthetic and field data indicates its ability to reconstruct randomly missing data with high accuracy on different datasets, which validates the feasibility and generalization capacity of the proposed method.
We proposed the RRU-net to simultaneously pursue the reconstruction and denoising of the massive DAS-VSP seismic data. It is difficult for training the U-net directly with
There are still issues that require further investigation in the simultaneous reconstruction and denoising of DAS-VSP seismic data. Issues, such as preserving the weak signals, and the application of the neural network with complex convolution for seismic data in the frequency domain also need further investigation.
The original contributions presented in the study are included in the article/Supplementary Material; further inquiries can be directed to the corresponding authors.
HT contributed to the original conception, algorithm implementation, and method validation; HT wrote the original draft of the manuscript; WM provided suggestions; and SC and WL assisted with the algorithm. All authors contributed to the study and improved the manuscript.
This work was supported by the National Key Research and Development Program of China under grant 2021YFA0716802 and the National Natural Science Foundation of China under grants 42130808 and 41974163.
The authors appreciate the valuable suggestions and comments from Qianru Xu, Lingli Gao, Huan Song, and E. I. Evinemi. The authors thank the developers of PyTorch on which they implemented this work.
The authors declare that the research was conducted in the absence of any commercial or financial relationships that could be construed as a potential conflict of interest.
All claims expressed in this article are solely those of the authors and do not necessarily represent those of their affiliated organizations, or those of the publisher, the editors, and the reviewers. Any product that may be evaluated in this article, or claim that may be made by its manufacturer, is not guaranteed or endorsed by the publisher.
Cadzow, J. (1988). Signal enhancement-A composite property mapping algorithm. IEEE Trans. Acoust. 36 (1), 49–62. doi:10.1109/29.1488
Chai, X., Tang, G., Wang, S., Lin, K., and Peng, R. (2020). Deep learning for irregularly and regularly missing 3-D data reconstruction. IEEE Trans. Geosci. Remote Sens. 99, 6244–6265. doi:10.1109/TGRS.2020.3016343
Chen, R., and Wang, Q. (2021). Seismic data reconstruction with data augmentation-based convolutional neural network. Chin. J. Eng. Geophys. 18 (4), 471–478. doi:10.3969/j.issn.1672-7940.2021.04.009
Chen, Y., Zhang, D., Jin, Z., Chen, X., Zu, S., Huang, W., et al. (2016). Simultaneous denoising and reconstruction of 5-D seismic data via damped rank-reduction method. Geophys. J. Int. 206 (3), 1695–1717. doi:10.1093/gji/ggw230
Dong, X., Li, Y., Liu, F., Feng, Q., and Zhong, T. (2021). New suppression technology for the random noise in the DAS seismic data based on convolutional neural network. Chin. J. Geophys. 64 (7), 2554–2565. doi:10.6038/cjg2021O0274
Dong, X., Zhong, T., and Li, Y. (2020). New suppression technology for low-frequency noise in desert region: The improved robust principal component analysis based on prediction of neural network. IEEE Trans. Geosci. Remote Sens. 58 (7), 4680–4690. doi:10.1109/TGRS.2020.2966054
Falk, T., Mai, D., Bensch, R., Cicek, O., Abdulkadir, A., Marrakchi, Y., et al. (2019). U-Net: deep learning for cell counting, detection, and morphometry. Nat. Met. 16, 67–70. doi:10.1038/s41592-018-0261-2
Fang, W., Fu, L., Zhang, M., and Li, Z. (2021). Seismic data interpolation based on U-net with texture loss. Geophysics 86 (1), 41–54. doi:10.1190/geo2019-0615.1
Feng, Q., and Li, Y. (2022). Denoising deep learning network based on singular spectrum analysis-DAS seismic data denoising with multichannel SVDDCNN. IEEE Trans. Geosci. Remote Sens. 60, 1–11. doi:10.1109/TGRS.2021.3071189
Gao, J., Sacchi, M., and Chen, X. (2011). “A fast rank reduction method for the reconstruction of 5D seismic volumes,” in SEG technical Program expanded abstracts 2011 (San Antonio, Texas: Society of Exploration Geophysicists), 3622–3626. doi:10.1190/1.3627953
Jia, Y., and Ma, J. (2017). What can machine learning do for seismic data processing? An interpolation application. Geophysics 82 (3), 163–177. doi:10.1190/geo2016-0300.1
Jia, Y., Yu, S., and Ma, J. (2018). Intelligent interpolation by Monte Carlo machine learning. Geophysics 83 (2), 83–97. doi:10.1190/geo2017-0294.1
Jiang, J., Ren, H., and Zhang, M. (2021). A convolutional autoencoder method for simultaneous seismic data reconstruction and denoising. IEEE Geosci. Remote Sens. Lett. 19, 1–5. doi:10.1109/LGRS.2021.3073560 https://ieeexplore.ieee.org/abstract/document/9416991
Krizhevsky, A., Sutskever, I., and Hinton, G. (2012). Image Net classification with deep convolutional neural networks. Adv. neural Inf. Process. Syst. 25.
Li, W., and Wang, J. (2021). Residual learning of cycle-GAN for seismic data denoising. IEEE Access 9, 11585–11597. doi:10.1109/ACCESS.2021.3049479
Liu, G., Reda, F., Shih, K., Wang, T., Tao, A., and Catanzaro, B. (2018). “Image inpainting for irregular holes using partial convolutions,” in Proceedings of the European Conference on Computer Vision (ECCV), 85–100.
Mandelli, S., Borra, F., Lipari, V., Bestagini, P., Sarti, A., and Tubaro, S. (2018). “Seismic data interpolation through convolutional auto encoder,” in SEG technical Program expanded abstracts 2018 (Anaheim, CA: Society of Exploration Geophysicists), 4101–4105. doi:10.1190/segm2018-2995428.1
Miller, D., Parker, T., Kashikar, S., Todorov, M., and Bostick, T. (2012). Vertical seismic profiling using a fibre-optic cable as a distributed acoustic sensor. Copenhagen, Denmark: EAGE publications. doi:10.3997/2214-4609.20148799
Oliveira, D., Ferreria, R., Silva, R., and Brazil, E. (2018). Interpolating seismic data with conditional generative adversarial networks. IEEE Geosci. Remote Sens. Lett. 15 (12), 1952–1956. doi:10.1109/LGRS.2018.2866199
Oropeza, V., and Sacchi, M. (2011). Simultaneous seismic data de-noising and reconstruction via multichannel singular spectrum analysis. Geophysics 76 (3), 25–32. doi:10.1190/1.3552706
Popa, J., Minkoff, S., and Lou, Y. (2021). An improved seismic data completion algorithm using low-rank tensor optimization: Cost reduction and optimal data orientation. Geophysics 86 (3), 219–232. doi:10.1190/geo2020-0539.1
Ronneberger, O., Fischer, P., and Brox, T. (2015). “U-Net: Convolutional network for biomedical image segmentation,” in International Conference on Medical image computing and computer-assisted intervention (Cham: Springer), 234–241.
Siahkoohi, A., Kumar, R., and Herrmann, F. (2019). “Deep-learning based ocean bottom seismic wavefield recovery,” in SEG technical Program expanded abstracts 2019 (San Antonio, Texas: Society of Exploration Geophysicists), 2232–2237. doi:10.1190/segm2019-3216632.1
Trickett, S. (2008). “F-xy Cadzow noise suppression,” in SEG technical Program expanded abstracts 2008 (Las Vegas, Nevada: Society of Exploration Geophysicists), 2586–2590. doi:10.1190/1.3063880
Wang, B., Zhang, N., Lu, W., and Wang, J. (2019). Deep-learning-based seismic data interpolation: A preliminary result. Geophysics 84 (1), 11–20. doi:10.1190/geo2017-0495.1
Wang, F. (2020). Research on seismic data denosing and reconstruction using deep learning. Hangzhou: Zhejiang University.
Wang, Y., Lu, W., Liu, J., Zhang, M., and Miao, Y. (2019). Random seismic noise attenuation based on data augmentation and CNN. Chin. J. Geophys. 62 (1), 421–433. doi:10.6038/cjg2019M0385
Keywords: DAS-VSP, reconstruction, denoising, RRU-net, Hankel matrix
Citation: Tang H, Cheng S, Li W and Mao W (2023) Simultaneous reconstruction and denoising for DAS-VSP seismic data by RRU-net. Front. Earth Sci. 10:993465. doi: 10.3389/feart.2022.993465
Received: 13 July 2022; Accepted: 16 September 2022;
Published: 09 January 2023.
Edited by:
Baoshan Wang, University of Science and Technology of China, ChinaReviewed by:
Yichuan Wang, University of Calgary, CanadaCopyright © 2023 Tang, Cheng, Li and Mao. This is an open-access article distributed under the terms of the Creative Commons Attribution License (CC BY). The use, distribution or reproduction in other forums is permitted, provided the original author(s) and the copyright owner(s) are credited and that the original publication in this journal is cited, in accordance with accepted academic practice. No use, distribution or reproduction is permitted which does not comply with these terms.
*Correspondence: Weijian Mao, d2ptYW9Ad2hpZ2cuYWMuY24=
Disclaimer: All claims expressed in this article are solely those of the authors and do not necessarily represent those of their affiliated organizations, or those of the publisher, the editors and the reviewers. Any product that may be evaluated in this article or claim that may be made by its manufacturer is not guaranteed or endorsed by the publisher.
Research integrity at Frontiers

Learn more about the work of our research integrity team to safeguard the quality of each article we publish.