 Li ZiWei
 Tang Xiangling*
- Guilin University of Technology Institute of Earth Science, Guilin, China
Based on level 3 stratosphere aerosol profile data retrieved from CALIPSO during 2007–2018, optical properties of stratospheric aerosols over the Xinjiang China are analyzed. The results are as follows:Firstly, the optical depth of stratospheric aerosol over Xinjiang is considerably higher in spring (0.0006) and summer (0.0009), than in autumn (0.0003) and winter (0.0002). Secondly, the backscattering ratio of stratospheric aerosol particles decreases with the increase of altitude, with the bottom of the stratosphere as the main contributor of the optical depth. Thirdly, for latitudinal distribution (35°–50° north latitude), the backscattering ratio gradually increases from south to north, with an average value that reaches 0.0013 × 10⁻³ km−1sr−1 at maximum in May and 0.0003 × 10⁻³ km−1sr−1 at minimum in January, October and December.
1 Introduction
Aerosols are tiny particles in liquid or solid state with a diameter between 0.001 and 100 μm suspended in the atmosphere (Rosenfeld et al., 2007). Aerosol optical depth (AOD) is one of the basic optical characteristics of Aerosol, and it is the integral of Aerosol extinction coefficient in the vertical direction. AOD can calculate aerosol content, determine aerosol scale, and evaluate aerosol climate effect, reflecting the degree and type of regional atmospheric pollution to a certain extent (Xia et al., 2007; Kremser et al., 2016).
Stratospheric aerosols play an important role in atmospheric radiation balance, atmospheric photochemistry, and stratospheric atmospheric circulation processes (Xu et al., 1998; Zhou et al., 2011; Zhang et al., 2012). On the one hand, stratospheric aerosols can reflect or scatter short-wave (solar) radiation, and therefore reduce the transmitted portion, decreasing ground surface temperature. On the other hand, stratospheric aerosols can absorb short-wave radiation and/or long-wave (ground) radiation, thus increasing stratospheric temperature (Hu and Shi, 1998; Qu et al., 2010). Precedent studies showed that, after volcanic eruption, the chemical reaction of massive aerosols in the stratosphere could change the balance of stratospheric trace gases (especially nitrogen oxides NOX) (Liu et al., 2007; Cai et al., 2011; Huang, 2018). For example, Liu Yu et al. (2007) analyzed the change trend of stratospheric ozone and aerosols and studied the time series of surface density of stratospheric aerosols in Qinghai-Tibet Plateau using SAGEⅡdata and found that large volcanic eruption had a dramatic influence that could have lasted about 6 years on stratospheric aerosols in Qinghai-Tibet Plateau. Other scholars used the distribution of stratospheric aerosols to study the characteristics of stratospheric atmospheric circulation (Trepte and Hitchman, 1992; Hitchman et al., 1994). Therefore, it is of great significance to explore the long-term spatial and temporal distribution of stratospheric aerosols and its role on regional and even global atmospheric radiation and circulation.
Globally, ground-based observations of stratospheric aerosols have been few, especially in harsh natural environments such as alpine, desert and oceanic regions, where the scarcity of ground observatories hindered the acquisition of continuous and accurate stratospheric aerosol data. In this regard, satellite remote sensing technology can make up for the shortcomings of ground observations including low spatial resolution and data availability gap, and bring new opportunity for further study. Current researchers in Xinjiang are seizing this opportunity but mostly focus on studying the characteristics of tropospheric aerosol distribution (Xia et al., 2005; Gao, 2008; Yang et al., 2014; Zhang et al., 2015), while researches on stratospheric aerosols are still scarce. Therefore, this paper used CALIPSO spaceborne LIDAR data from 2007 to 2018 to reveal the spatial and temporal distribution characteristics of stratospheric aerosols in Xinjiang. The results of this study can provide a scientific basis for atmospheric environment control and future pollution control in Xinjiang.
2 Studied area and data sources
2.1 Studied area and data sources
Located in the northwest of China, Xinjiang Autonomous Region features dry climate with little rain, and high, mountainous and desert-dominant terrain. With Tianshan Mountains as the boundary, the studied area (35°–50° N, 70°–90° E) is divided into North Xinjiang and South Xinjiang (see Figure 1), the latter of which hosts the largest mobile desert of China (Taklimakan Desert).
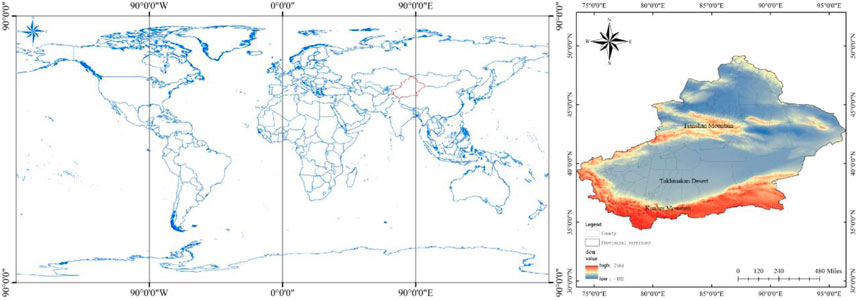
FIGURE 1. Geographical location of the study area.
2.2 Data source
In this study, the nighttime stratospheric aerosol data from 2007 to 2018 are derived from the level-3 product of stratospheric profile acquired by CALIPSO, a polar-orbiting satellite launched by NASA in June 2006 as a member of the “A-Train” earth observing satellite formation. The equatorial transit time of the satellite is 13:30 or 01:30 (UTC). The dual-wavelength lidar (532 nm and 1,064 nm) it carries can obtain the global vertical distribution profile of clouds and aerosols, and provide reliable data for studying the interaction between clouds and aerosols (Winker et al., 2006; Liu et al., 2016; Zheng et al., 2018).
The vertical resolution of the level-3 product of stratospheric aerosols data was 900 m in altitude (covering 8.2–36.2 km), and the horizontal resolution is 5° in latitude (covering 82.5° N∼82.5° S) and 20° in longitude (covering 170° W∼170° E). Two variables are selected from the 532 nm channel of the product to analyze the temporal and spatial distribution of stratospheric aerosols in Xinjiang, namely the stratospheric aerosols optical depth (AOD) and particle backscattering intensity, each of which was divided into the background value and the total aerosol value. The background value was obtained by subtracting the level-2 value of could, aerosols and polar stratiform cloud from the level-3 value, while the total aerosol value was obtained by subtracting the level-2 value of could and polar stratiform cloud from the level-3 value, reserving the aerosol value. The total stratospheric aerosol value includes the value of volcanic ash, sulfates, polar aerosols and rising smoke. The distribution characteristics of stratospheric aerosols in the studied area are based on the difference between total aerosol value and background value.
The total attenuation backscatter and optical thickness are used to analyze the optical properties of stratospheric aerosols. Among them, the total attenuation backscatter variable to the background value is in the range of 0–5.3 × 10⁻⁴ km−1 sr−1 effective range for quality control, optical thickness within −0.05–0.06 effective range for quality control; The total attenuation backscattering parameter for the total aerosol value is in the range of 0–6.3 × 10⁻⁴ km−1 sr−1 effective range for quality control, optical thickness within −0.02–2 effective range for quality control. In addition, the quality of the meteorological variable stratospheric average potential temperature is controlled within the effective range of 300–1,250 km.
2.3 Research methods
2.3.1 Aerosol optical properties index
In this study, the optical properties of stratospheric aerosols in Xinjiang region were determined by the difference between the total attenuating backscatter (Total Attenuated Background,TAB) and the background value of the optical thickness (Aerosol Optical Depth,AOD) and the total aerosol value. The optical properties of stratospheric aerosols in Xinjiang were determined by the difference between the total attenuating backscatter (TAB) and the optical thickness (AOD) of the aerosols. The calculation formula is:
In the above equation, AOD is the aerosol optical thickness, TAB is the total attenuated aerosol backscattering, subscript “all” represents the total aerosol value, and bg in the subscript is the Background abbreviation, representing the Background value (Angell, 1993; McCormick et al., 1995; Li et al., 2019; Prasad et al., 2019).
2.3.2 Data analysis index
The 3D variable total attenuated backscatter (TAB) represents the difference between the total and background aerosols of the TAB. The dimension of the variable is reduced, that is, the zonal distribution is the integration of the variable in the direction of Longitude. Similarly, the radial distribution means that the variable is integrated in the direction of Latitude. The calculation formula is:
In Eq. 3, TM is the average total attenuated backscattering value, and N is the number of third-level stratospheric aerosol data from 2007 to 2018.
3 Result and analysis
3.1 Seasonal distribution of global night orbit scanning numbers of CALIPSO
In this study the four seasons are defined as spring from March to May, summer from June to August, autumn from September to November, and winter from December to February. Figure 2 shows the seasonal distribution of the global sub-satellite point scanning lines by CALIPSO lidar at nighttime from 2007 to 2018. As can be seen from Figure 2, the south Atlantic region has invalid values of the number of orbital scans in all four seasons. The reason is that the detection data in this region is set as invalid because of noise problems. At the same time, the distribution of invalid data values also appears in the Northern hemisphere high latitude area in summer night, which may be caused by the limitation of CALIPSO orbit scanning range, which is consistent with other research results (Andersson et al., 2015). In addition, the number of nighttime orbital scans in the southern, southern and northern hemisphere of the four seasons is different at high latitudes. Therefore, the use of the level-3 stratospheric aerosol data of CALIPSO for Xinjiang region, with relative low attitudes, will not be affected by the above phenomena.
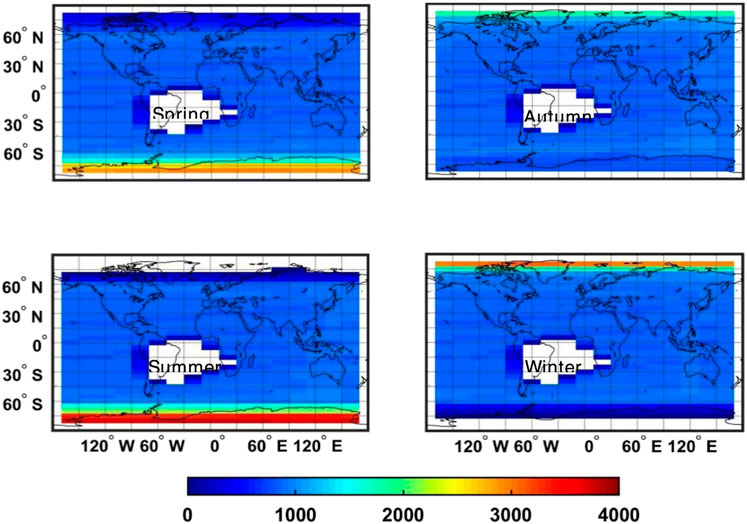
FIGURE 2. Distribution of CALIPSO number of scan lines at nighttime during 2007–2018 by season.
3.2 Mean background and total values of stratospheric AOD over Xinjiang
Figure 3 shows the seasonal distribution of the mean background and total aerosol optical depth (AOD) values in the stratosphere over Xinjiang from 2007 to 2018 by CALIPSO. The distribution of stratospheric aerosols in the studied area can be obtained by comparing the background AOD (excl. Stratospheric aerosols) and the total AOD (incl. Stratospheric aerosols). In general, the distribution pattern of stratospheric AOD over Xinjiang is lower in autumn and winter, but higher in summer. Possible reason is the increased convective activity and strong wind in summer, which intensifies aerosol exchange between troposphere and stratosphere; while the convective activity decreased in autumn and winter, resulting in less aerosol exchange between troposphere and stratosphere (Zhang, 2019). In winter, the optical depth value of stratospheric aerosols in North Xinjiang increases significantly against the background value, likely caused by the denser population and higher fossil fuel consumption for heating in North Xinjiang than South Xinjiang, therefore the generation of more soot aerosols (i.e., the rising smoke) that is detected by CALIPSO lidar (Hu et al., 2019) once reaching the stratosphere.
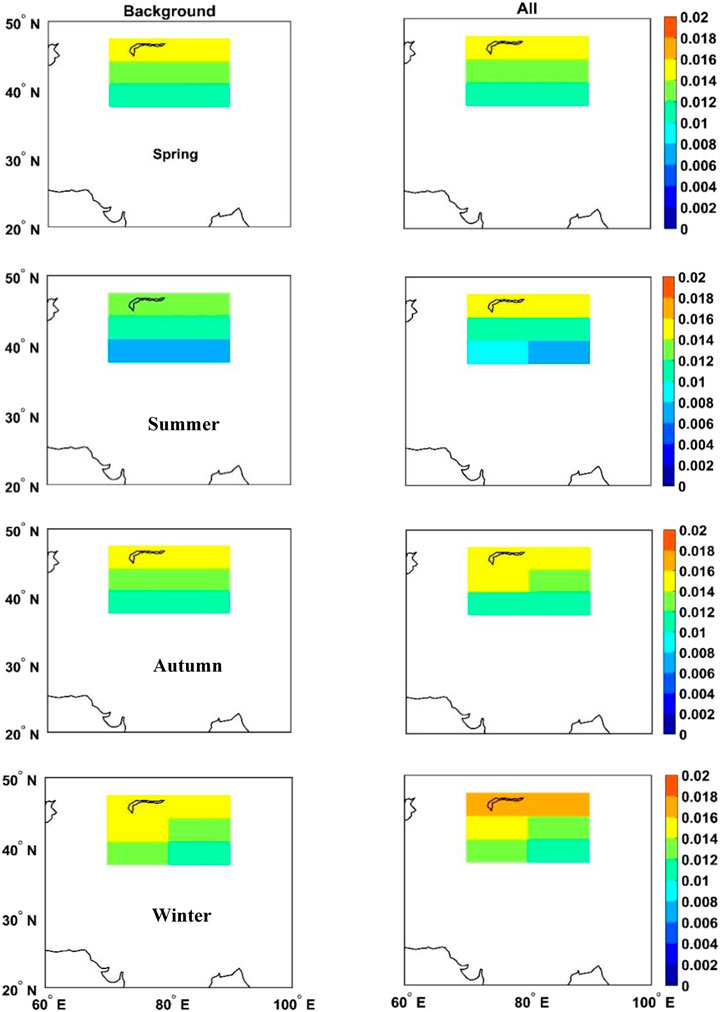
FIGURE 3. CALIPSO based distribution of mean background and total stratospheric AOD values over Xinjiang from 2007 to 2018 by season.
The maximum difference between the background value and the total value is 0.0009, which occurs in summer, while the difference between autumn and winter is much smaller (0.0002 and 0.0003, respectively). In spring, the average difference between the two is 0.0006.
3.3 Vertical distribution of mean background and total aerosol backscattering ratios in the stratosphere over Xinjiang
Figure 4 shows the monthly variation of altitude-latitude (35°–50° N) distribution of mean background and total values of stratospheric aerosol backscattering ratio over Xinjiang from 2007 to 2018 based on CALIPSO. In Figure 4, the colored values are the thousandths place values. In general, the vertical distribution of the mean background and total aerosol backscattering values in all 12 months shows a pattern of decreasing with the altitude. The latitudinal distribution of aerosol backscattering values show a gradually increasing trend from south to north, indicating a higher concentration of stratospheric aerosols in North Xinjiang than in South Xinjiang, likely due to the denser population distribution in North Xinjiang, resulting in more soot aerosols emitted by human activities (Zhang et al., 2016). In addition, in April, May, June, July, August and September, stratospheric aerosols could be detected at a higher upper limit altitude (about 21 km) than in other months, likely related to factors such as convective activity and atmospheric dynamics.
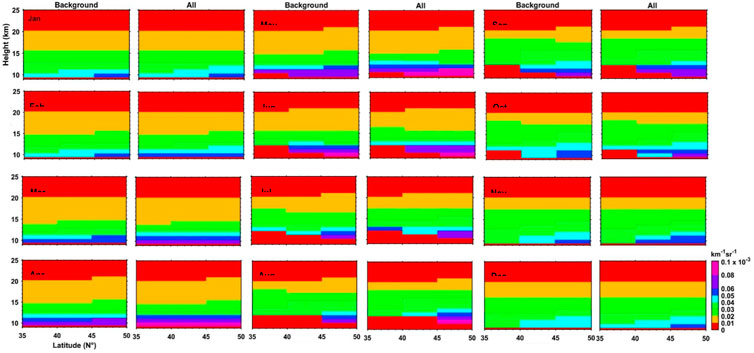
FIGURE 4. Monthly height-latitude distribution of mean background and total aerosol particulate backscatter values during 2007–2018 over Xinjiang. The color scale values are thousandths place values.
Figure 5 shows the monthly variation of height-longitude (70°–90° E) distribution of mean background and total values of stratospheric aerosol backscattering ratio over Xinjiang from 2007 to 2018 based on CALIPSO. Similar to the altitude-latitude distribution, the backscattering ratio of stratospheric aerosols decreases with the altitude, and the maximum value occurs at about 10–11 km. In May, June, July and August, the distribution height of stratospheric aerosols is higher than in other months by about 1–2 km. In addition, Table 2 summarizes the monthly latitudinal and longitudinal mean background and total aerosol backscattering ratios over Xinjiang during 2007–2018 (latitudinal aerosol backscattering ratio was obtained by averaging the three-dimensional data over each longitudinal scanning line, and the longitudinal distribution was obtained similarly by averaging over each latitudinal line). In general, the backscattering ratios of stratospheric aerosols in spring and summer (March, April, May, June, July and August) were larger than those in autumn and winter (October, November, December, January and February), excluding September. Specifically, the latitudinal distribution of stratospheric aerosol backscattering ratios has a maximum value of 0.0013 × 10⁻³ km−1sr−1 in May, and a minimum value of 0.0003 × 10⁻³ km−1sr−1 in January, October and December. The longitudinal distribution of stratospheric aerosol backscattering ratios has a maximum value of 0.0011 × 10⁻³ km−1sr−1 in July and a minimum value of 0.0002×10⁻³ km−1sr−1 in December.
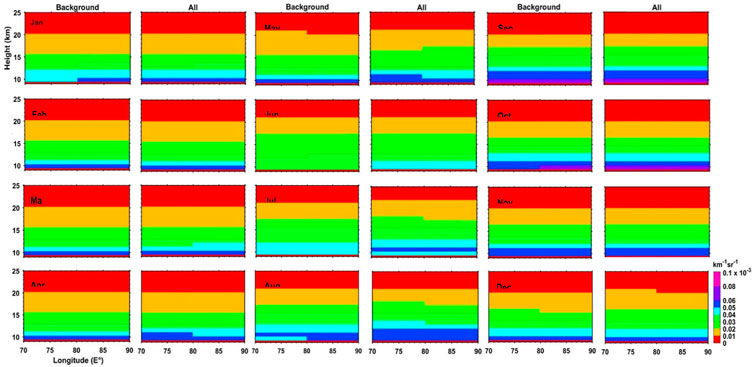
FIGURE 5. Same as Figure. 4, except this is the height-l.
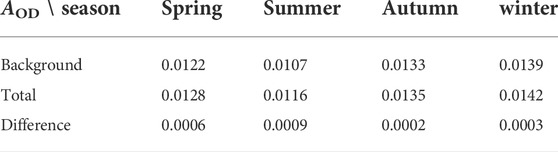
TABLE 1. Mean background and total stratospheric AOD values over Xinjiang from 2007 to 2018 by season.
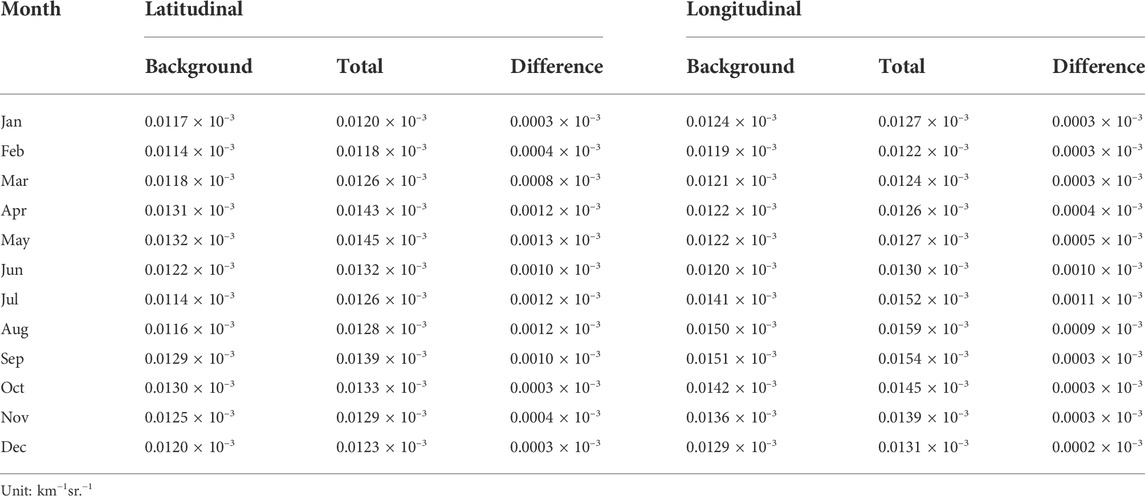
TABLE 2. Mean background and total aerosol particulate backscatter values over Xinjiang from 2007 to 2018 by month.
3.4 Vertical distribution profile of mean background and total backscattering ratios of stratospheric aerosols over Xinjiang
Figure 6 shows the vertical distribution of the monthly mean background and the total aerosol backscattering values in Xinjiang (latitudinal+longitudinal). In autumn and winter (January, February, September, October, November and December), the profile of mean background mostly overlap with the profile of total aerosol backscattering values, indicating that stratospheric aerosol contents are very low in those months. In March, April and May, the profile of background values and that of total values differ in the altitude range of 10–12 km. In June, July and August, their profiles differ in the altitude range of 12–16 km. This means the optical depth of aerosols in stratosphere is mainly contributed by the bottom layer, which is consistent with the finding of Andersson et al. (2015). Some scholars have also shown that in the case of advection, the influence of wind on the aerosol size distribution is huge. In the case of strong wind, the aerosol effective radiation of the whole boundary layer is much larger than that of light wind (Schuster et al., 2012; Bibi et al., 2015; Kumar et al., 2018; Lee et al., 2018; Makuch et al., 2021). Overall, the difference in vertical distribution of aerosol backscattering ratios among different months is supposed to be related to the aforementioned same factors, i.e. convective activity and atmospheric dynamic action, which lead to the exchange of aerosols between the troposphere and the stratosphere (Qin et al., 2017).
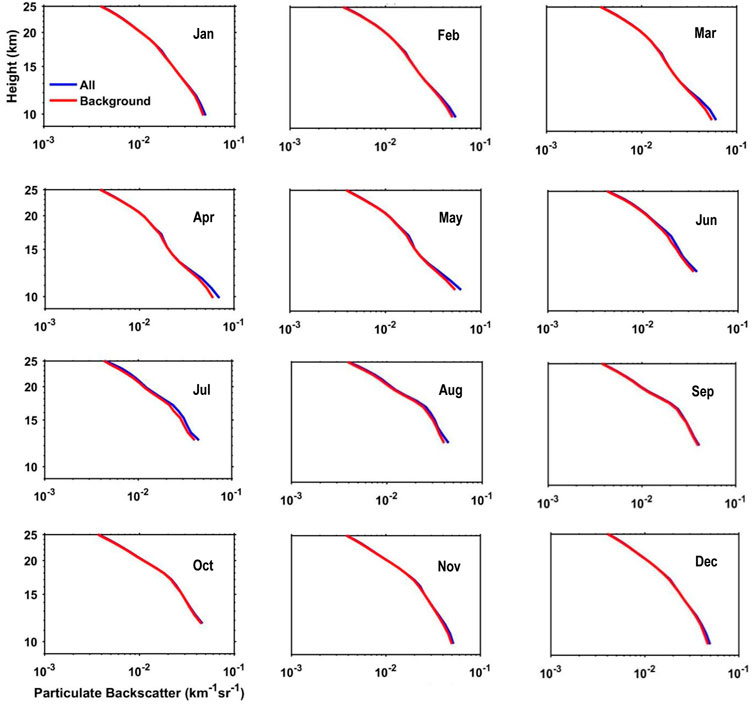
FIGURE 6. Vertical profile of monthly mean background and total aerosol particulate backscattering ratios in the stratosphere over Xinjiang from 2007 to 2018 retrieved from CALIPSO.
4 Conclusion
The stratospheric aerosols over Xinjiang from 2007 to 2018 show distribution difference to some extent, both seasonally and geographically. On the one hand, the optical depth values of stratospheric aerosols over Xinjiang in spring and summer (0.0006 and 0.0009 respectively) are higher than in autumn and winter (0.0003 and 0.0002). On the other hand, the vertical distribution of backscattering ratios of stratospheric aerosols decreases with the altitude, and the maximum value appears at an altitude about 10 km. Moreover, the latitudinal distribution of the backscattering ratios of stratospheric aerosols gradually increases from south to north, indicating that there are more stratospheric aerosols in North Xinjiang than in South Xinjiang. In addition, in autumn and winter, the vertical profile of the background values of aerosol backscattering mostly overlap with the vertical profile of total aerosol values. However, in spring and summer, the two profiles show differential distribution in the altitude range of 10–12 km and the range of 12–16 km, respectively.
Data availability statement
The raw data supporting the conclusions of this article will be made available by the authors, without undue reservation.
Author contributions
LZ: Writing—Original Draft: Preparation, creation and/or presentation of the published work, specifically writing the initial draft (including substantive translation) XT: Conceptualization: Ideas; formulation or evolution of overarching research goals and aims Methodology: Development or design of methodology; creation of models Data Curation: Management activities to annotate (produce metadata), scrub data and maintain research data (including software code, where it is necessary for interpreting the data itself) for initial use and later reuse Writing—Review and Editing (初稿的审阅和修改): Preparation, creation and/or presentation of the published work by those from the original research group, specifically critical review, commentary or revision—including pre-or postpublication stages Funding acquisition: Acquisition of the financial support for the project leading to this publication.
Funding
This study is jointly financed by the natural science foundation of China GuangXi (2020GXNSFAA297266). and the Qinzhou Science and Technology Bureau project (20189910).
Acknowledgments
The authors gratefully acknowledge funding for this research and would like to thank Xinjiang Meteorological Information Center for providing the raw data and for homogenizing the meteorological data. The authors would also like to express their sincere thanks to Pan Hong-Lin for the help with data processing. At the same time, the authors are grateful to the reviewers and editors for their input and constructive comments.
Conflict of interest
The authors declare that the research was conducted in the absence of any commercial or financial relationships that could be construed as a potential conflict of interest.
Publisher’s note
All claims expressed in this article are solely those of the authors and do not necessarily represent those of their affiliated organizations, or those of the publisher, the editors and the reviewers. Any product that may be evaluated in this article, or claim that may be made by its manufacturer, is not guaranteed or endorsed by the publisher.
References
Andersson, S. M., Martinsson, B. G., Vernier, J. P., Friberg, J., Brenninkmeijer, C. A. M., Hermann, M., et al. (2015). Significant radiative impact of volcanic aerosol in the lowermost stratosphere. Nat. Commun. 6, 7692. doi:10.1038/ncomms8692
Angell, J. K. (1993). Comparison of stratospheric warming following Agung, El Chichon and Pinatubo volcanic eruptions. Geophys. Res. Lett. 20, 715–718. doi:10.1029/93gl00366
Bibi, H., Alam, K., and Chishtie, F., et al. Intercomparison of MODIS, MISR, OMI, and CALIPSO aerosol optical depth retrievals for four locations on the Indo-Gangetic plains and validation against AERONET data[J]. Atmos. Environ., 2015, 111.doi:10.1016/j.atmosenv.2015.04.013
Cai, H., Guo, J., and Zhou, R., et al. The relation of stratospheric aerosols with trace gases and temperature[J]. Chin. J. Atmos. Sci., 2011, 35(06): 1159–1168.
Gao, W. Analysis on element content in Xinjiang soil and contribution to dust aerosols[J]. J. Arid Land Resour. Environ., 2008(08): 155–158.
Hitchman, M. H., McKay, M., and Trepte, C. R. A climatology of stratospheric aerosolJ. J. Geophys. Res., 99(D10), 20689–20700. doi:10.1029/94jd015251994
Hu, J., Zhong, K., and Kang, Y., et al. Variation in aerosol optical depth over the typical cities in the Xinjiang region[J]. China Environ. Sci., 2019, 39(10): 4074–4081. doi:10.19674/j.cnki.issn1000-6923.2019.0475
Hu, R., and Shi, G. Horizontal two-dimensional distribution of radiative forcing and climate effect due to stratospheric aerosol[J]. Chin. J. Atmos. Sci., 1998(01): 19–25.
Huang, R. The effect of stratospheric aerosol on stratospheric water vapor content[C]. Chinese Meteorological Society. The S25 postgraduate forum of the 35th annual meeting of Chinese meteorological society. Beijing, China: Chinese Meteorological Society: Chinese Meteorological Society, 2018: 50–51.
Hunt, W. H., Winker, D. M., and Vaughan, M. A., et al. CALIPSO Lidar description and performance assessment[J]. J. Atmos. Ocean. Technol., 2008, 26(7): 1214–1228.
Kremser, S., Thomason, L. W., von Hobe, M., Hermann, M., Deshler, T., Timmreck, C., et al. (2016). Stratospheric aerosol-Observations, processes, and impact on climate. Rev. Geophys. 54 (2), 278–335. doi:10.1002/2015rg000511
Kumar, A., Singh, N., and Solanki, R., et al. Evaluation and utilization of MODIS and CALIPSO aerosol retrievals over a complex terrain in Himalaya[J]. Remote Sens. Environ., 2018, 206.doi:10.1016/j.rse.2017.12.019
Lee, H., Jeong, J., Kalashnikova, O., Tosca, M., Kim, S., and Kug, J. (2018). Characterization of wildfire-induced aerosol emissions from the maritime continent peatland and central african dry savannah with MISR and CALIPSO aerosol products. J. Geophys. Res. Atmos. 123 (6), 3116–3125. doi:10.1002/2017jd027415
Li, Z., Wang, Y., Guo, J., Zhao, C., Cribb, M. C., Dong, X., et al. (2019). East asian study of tropospheric aerosols and their impact on regional clouds, precipitation, and climate (EAST-AIR CPC ). JGR. Atmos. 124 (23), 13026–13054. doi:10.1029/2019jd030758
Liu, Y., Guo, C., and Li, W., et al. Trends of stratospheric ozone and aerosols over Tibetan plateau[J]. Acta Meteorol. Sin., 2007(06): 938–945.
Liu, Z., Zhang, X., and Zheng, Y., et al. Spatio-temporal distribution and transport behavior of a dust event based on the CALIPSO in China[J]. Acta Sci. Circumstantiae, 2016, 36(12): 4315–4327. doi:10.13671/j.hjkxxb.2015.0689
Makuch, P., Sitarek, S., Markuszewski, P., Petelski, T., and Stacewicz, T. (2021). Lidar observation of aerosol transformation in the atmospheric boundary layer above the Baltic Sea. Oceanologia 63 (2), 238–246. doi:10.1016/j.oceano.2021.01.002
McCormick, M. P., Thomason, C. R., and Trepte, L. W. (1995). Atmospheric effects of the Mt Pinatubo eruption. Nature 373 (6513), 399–404. doi:10.1038/373399a0
Prasad, P., Raman, M. R., Ratnam, M. V., Ravikiran, V., Madhavan, B., and Bhaskara Rao, S. V. (2019). Nocturnal, seasonal and intra-annual variability of tropospheric aerosols observed using ground-based and space-borne lidars over a tropical location of India. Atmos. Environ. 213, 185–198. doi:10.1016/j.atmosenv.2019.06.008
Qin, W., Li, X., and Lu, X., et al. Aerosol vertical distribution characteristics in northwest China[J]. Acta Opt. Sin., 2017, 37(03): 130–137. doi:10.3788/aos201737.0301001
Qu, W., Liu, Y., and Huang, F., et al. The space-time propagation patterns of the stratospheric volcanic aerosols and the preliminary analysis of their climate effect[J]. J. Appl. Meteorological Sci., 2010, 21(05): 627–631.
Rosenfeld, D., Dai, J., Yu, X., Yao, Z., Xu, X., Yang, X., et al. (2007). Inverse relations between amounts of air pollution and orographic precipitation. Science 315 (5817), 1396–1398. doi:10.1126/science.1137949
Schuster, G. L., Vaughan, M., MacDonnell, D., Su, W., Winker, D., Dubovik, O., et al. (2012). Comparison of CALIPSO aerosol optical depth retrievals to AERONET measurements, and a climatology for the lidar ratio of dust. Atmos. Chem. Phys. 12 (278), 7431–7452. doi:10.5194/acp-12-7431-2012
Trepte, C. R., and Hitchman, M. H. (1992). Tropical stratospheric circulation deduced from satellite aerosol data. Nature 355, 626–628. doi:10.1038/355626a0
Winker, D., Vaughan, M., and Hunt, B. (2006). The CALIPSO mission and initial results from CALIOP. Newport News, United States: SPIE Asia-Pacific Remote Sensing.
Xia, L., Hu, X., and Cui, C., et al. Research on dust aerosol optical properties in South tarim basin and classification of different dusty weather in China[J]. J. Desert Res., 2005(04): 488–495.
Xia, X., Chen, H., and Li, Z., et al. Significant reduction of surface solar ir-radiance induced by aerosol in a suburban region in northeastern China[J]. J. Geophys. Res., 2007, 112(D22): 928–935. doi:10.1029/2006jd007562
Xu, L., Fan, X., and Shi, G., et al. Morphological feature and chemical composition of individual particles in the troposphere and stratosphere[J]. Acta Meteorol. Sin., 1998(05): 40–48.
Yang, Z., Zhang, X., and Mao, W. The remote sensing monitoring application research in dust weather of Xinjiang based on FY-3B/VIRR data[J]. Desert Oasis Meteorology, 2014, 8(05): 48–52.
Zhang, F., Liu, Y., and Li, W. Review on current development of stratospheric aerosol models[J]. Meteorological Sci. Technol., 2012, 40(03): 456–465. doi:10.19517/j.1671-6345.2012.03.024
Zhang, J., Tian, W., and Xiao, L., et al. Fact and simulation of dust aerosol transported to stratosphere during a strong dust storm in South Xinjiang[J]. Plateau Meteorol., 2015, 34(04): 991–1004.
Zhang, M. Spatial-temporal distribution and influencing factors of aerosol optical depth in Xinjiang from 2001 to 2017[D]. Beijing, China: Jiangxi University of Science and Technology, 2019.
Zhang, Z., Ding, J., and Wang, J., et al. Regional analysis on indirect effect of aerosol in arid area of Xinjiang[J]. China Environ. Sci., 2016, 36(12): 3521–3530.
Zheng, J., Liu, D., and Wang, Z., et al. Global distribution and seasonal variation of clouds observed from CloudSat/CALIPSO[J]. Acta Meteorol. Sin., 2018, 76(03): 420–433.
Keywords: stratospheric aerosol, temporal and spatial distribution, CALIPSO lidar, Xinjiang, stratosphere
Citation: ZiWei L and Xiangling T (2022) Temporal and spatial distribution characteristics of stratospheric aerosols over xinjiang region based on CALIPSO spaceborne lidar observation. Front. Earth Sci. 10:991025. doi: 10.3389/feart.2022.991025
Received: 11 July 2022; Accepted: 06 September 2022;
Published: 21 September 2022.
Edited by:
Jing Wei, University of Maryland, United StatesReviewed by:
Qing Chen, The University of Iowa, United StatesSanjay Kumar Mehta, SRM Institute of Science and Technology, India
Cheng Da, University of Maryland, United States
Copyright © 2022 ZiWei and Xiangling. This is an open-access article distributed under the terms of the Creative Commons Attribution License (CC BY). The use, distribution or reproduction in other forums is permitted, provided the original author(s) and the copyright owner(s) are credited and that the original publication in this journal is cited, in accordance with accepted academic practice. No use, distribution or reproduction is permitted which does not comply with these terms.
*Correspondence: Tang Xiangling, OTE1OTA3MTczQHFxLmNvbQ==