 Xuege Wang
 Wenchao Ma
 Jun Lv3
- 1Changchun Institute of Technology, School of Hydraulic and Environmental Engineering, Changchun, China
- 2Institute of Industrial Science, The University of Tokyo, Tokyo, Japan
- 3Songliao Water Resources Research Institute, Changchun, Jilin, China
Lalin River is a first-level tributary of the right bank of Songhua River. High-quality corn production bases irrigated by the Lalin River are famous throughout the country. However, in the last few decades, the hydrological regimes changed severely due to expansion of the irrigation area, leading to more water used for irrigation. To investigate the variation of the hydrological situation, we analyzed the daily runoff data at the Caijiagou Hydrological Station from 1954 to 2015 by using the Indicators of Hydrologic Alteration (IHA) and the range of variability approach (RVA). The results showed a severe decreasing trend of the average monthly flow during the water level with regular and high periods, with a negative slope of −2.924 in August and −2.518 in September. The increasing trend of low pulse and fall rate of flow and the decreasing trend of the rising rate of flow demonstrate that water resources are drying up. Regarding the flow rate, the annual maximum value decreased significantly in slopes of −7.9, −7.6, −6.09, −5.28, and −2.98 on the 1-day, 3-day, 7-day, 30-day, and 90-day, respectively. The flow reversals’ average value is 65 to 50 times/year from 1954 to 2015. From RVA analysis, the hydrological alteration of the basin decreased 50% after 1978. To investigate the influencing factors for the hydrological alteration, we analyzed the variation in land cover and land use between 1978 and 2015. The results showed that the area of paddy fields in 2015 was 1.5 times that of 1978, and the water consumption in paddy fields accounts for 80.8% of the total water resources. Consequently, the wetland area of the basin in 2015 was only 53% of 1978, and the wetland area of the two wetland nature reserves at the mouth of the Lalin River in 2015 was about 53% of 1978. Furthermore, the meteorological condition in the LRB shows a warming and drying tendency. The air temperature has shown an intensively increased tendency, and precipitation decreased in the last 50 years. This indicates that the hydrological situation in the Lalin River Basin has changed considerably under the dual influence of human activities and global warming.
Introduction
Water resources are critical for the ecosystem by driving a broad range of ecological, biogeochemical, and geomorphological processes (Hart and Finelli, 1999; Craswell, 2009; Sponseller et al., 2013). The distribution and movement of rivers play a dominant role in those regions where water resources are mainly composed of surface water. Also, the changes in river water volume directly affect the catchment ecosystem (Norris and Thoms, 1999; Richter and Richter, 2000; Bunn and Arthington, 2002; Richter et al., 2003; Richter and Thomas, 2007). Along with a large-scale development of arable land, construction of barrages, and acceleration of urbanization, the underlying surface conditions of catchments have changed. The changes in hydrological conditions and their impact on the ecological environment are widely studied at home and abroad (Richter et al., 1996; Zhang et al., 2010; Lian et al., 2012; Li et al., 2016; Wang et al., 2016; Ge et al., 2018).
The “Indicators of Hydrologic Alteration” (IHA) is a popular tool proposed by Richter et al. in assessing hydrologic variations for management and river research (Richter et al., 1996; Richter et al., 2003). IHA is capable of describing environmental flow regimes and providing assessment evidence for reservoir operations (Li et al., 2018), detecting control on water availability in a fragmented landscape (Chisola et al., 2020), and evaluating balance among new and existing dams operations (Richter and Thomas, 2007). Furthermore, in the aspect of scaling influence for the ecosystem, IHA explicitly identifies species distribution and community ecological attributes with water resource stress (Cantonati et al., 2020) and achieves environmental benefit based on suitable natural flow regimes (Richter and Thomas, 2007). Based on the understanding and application of IHA, Richter et al. (1996) proposed the range of variability approach (RVA) for evaluating the flow regime alteration in the hydrological situation at different times (Richter et al., 1996). The RVA can quantitatively analyze the change of the hydrological characteristics of the river after being affected by the environment. The combination of IHA and RVA was found to be helpful in evaluating the hydrological variations, such as those caused by the construction of hydropower (Zhang et al., 2014) reservoirs (Yin et al., 2011; Belmar et al., 2013; Yu et al., 2016). After that, Suen and Eheart (2006) tested the revised RVA methods for multiple application purposes and others ( Shiau and Wu, 2008; Yin et al., 2011; Yu et al., 2016) to improve the performance of the original RVA methods. In contrast to the infrastructure mentioned above, human activities sometimes affect hydrology and water resources. In China, most regions had considerable development and promotion for urbanization since the reform and opening-up in 1978 (Sun et al., 2014). Amount of water resources has changed according to the demand for urbanization and farming. However, for most of the region, the amount of water used lacks record. It is necessary to investigate the hydrologic variations by analyzing the flow regime alteration. Many studies mainly focused on the degree of change in the hydrological situation before and after the construction of water conservancy projects. For example, Zeng et al. (2021) and Guo et al. (2022) aimed at the source of the Dongjiang River (Zeng et al., 2021) and the Minjiang River (Guo et al., 2022), respectively, taking the construction time of the water conservancy project as an impact and analyzing the hydrological changes before and after the construction of the water conservancy project.
Lalin River is the principal tributary on the right bank of Songhua River, one of China’s primary rivers. As a first-level branch, Lalin River basin covers 19,923 km2 from 44°00′ to 45°30′ N latitude and 125°34′ to 128°34′ E longitude (Figure 1). The elevation of the Lalin River Basin (LRB) varies from several to thousand meters. Most of the basin is located in the middle and lower reaches of the plains, which is mainly covered by farmland. The water resources of Lalin River play a dominant role in regional agriculture (Yin et al., 2018). There are high-quality corn production bases which function as prominent resources in Wuchang city, Yushu city, Fuyu city, and Shuang Cheng district; especially the Wuchang rice variety is famous in China. With the development of irrigation districts and increase of urbanization, significant changes have taken place in water resources for irrigation, urban water supply, and power generation. Changes in hydrological conditions impact the ecological integrity and biodiversity of the Lalin River aquatic organisms and wetlands in the lower estuary. At present, there are few studies on the changes in the water environment and ecological environment of the Lalin River. But, the changes in the hydrological regime of the Lalin River are rarely studied. Therefore, a survey of the changes in the hydrological situation in the LRB is taken which helps analyze its impact on the ecological environment. In December 1978 , there was a program named Chinese economic reform, and the opening-up for promoting urbanization was carried out by the government (Sun et al., 2014). There were changes in water consumption along with this program, although there is no record for this human activity. Therefore, testing the variation of hydrological alteration before and after 1978 will help understand the water resource variation in the LRB.
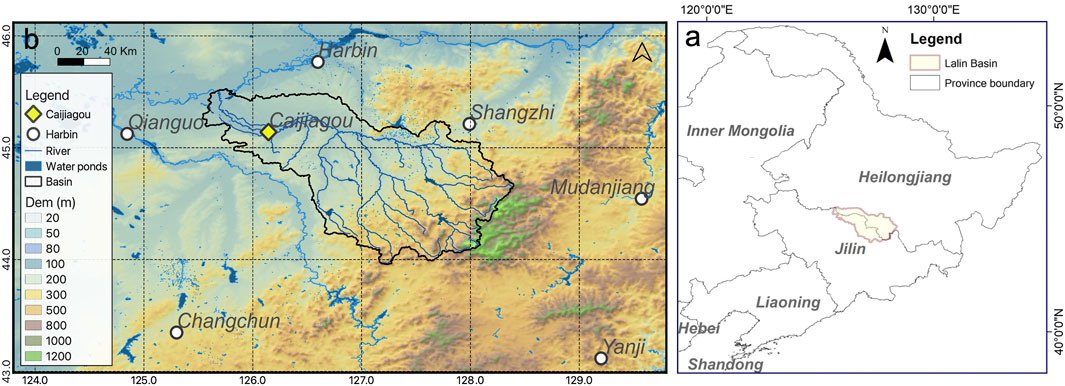
FIGURE 1. Location of the Lalin River basin (A) and the distribution of river systems and meteor-hydrological stations in the LRB (B).
The ecosystem of the LRB has been subjected to significant challenges in recent decades. The wetland area takes a large portion of the LRB, most of which are river flood wetlands. There are two famous nature reserves in the LRB, including the Provincial Nature Reserve of the Fuyu Flooded Wetland in Jilin province and the Lalin River Mouth Provincial Nature Reserve in Heilongjiang province. The existence of these wetlands highly depends on the waters of the Lalin River. There are several species of fish on the brink of extinction in this region (Wang et al., 2017). The critically endangered species include the following: Acipenser schenckii (Brandt), Huso dauricus (Georgi), and Brachymystax lenok (Pallas); the vulnerable species include the following: Lampetra reissneri (Dybowski), Silurus soldatovi (Nikolsky et Soin), Hucho taimen (Pallas), Coregonus ussuriensis (Berg), and Thymallus arcticus grubei (Dybowski). From the previous study, impacts have contributed to the decline and increased endangerment of fish survival, such as anthropogenic influence, water pollution, and changes in aquatic habitat (Liu et al., 2013). As a condition that determines the survival and reproduction of fish, water resource is a critical requirement. For example, to maintain water table levels, fish and amphibian eggs are suspended, enabling fish to move to feed, and low flows of the river decide spawning areas. On the contrary to the low-flow pulses, the high-flow pulses represent hydrological conditions to aerate fish eggs in spawning gravels, prevent siltation, and maintain suitable salinity conditions (Richter and Thomas, 2007). Therefore, investigation of the hydrological regime variation provides critical evidence for the local ecosystem.
The Caijiagou hydrological station is located in the lower reaches of the Lalin River. In the upper reaches of the Caijiagou hydrological station, there are many reservoirs and other structures used for agricultural irrigation and urban water supply. The hydrological regime change of the Caijiagou hydrological station is the result of the comprehensive influence of society, economy, and agriculture in the upper and middle reaches of the Lalin River, which can reflect the comprehensive change of the hydrological regime of Lalin River. Based on this, we analyze the hydrology of Lalin River in the Caijiagou hydrological station. For investigating the influence caused by hydrological variation, we conducted the IHA method to quantitatively analyze how much the water resources changed in the LRB. This study will highlight the principle of hydrologic change in Lalin River basin during the last 50 years. The IHA is evaluated for implying essential water resources for the ecosystem. At the same time, this work innovatively investigates the influence of human activities as selecting the Reform and Opening in China from 1978 to analyze the range of variability of the hydrologic regime. Furthermore, along with a variation of the hydrological regime, changes of land cover and meteorological variation were investigated.
Materials and methods
Discharge in the Caijiagou hydrological station
The Caijiagou hydrological station (CHS) is located in the lower reaches of Lalin River (Figure 1). The daily river discharge of the CHS from 1954 to 2015 was collected by the Ministry of Water Conservancy of China, Songliao Water Resources Commission. There are numerous reservoirs and other river-blocking structures built in the upper reaches of the CHS for agricultural irrigation and urban water supply. As an outlet of the LRB, the hydrological variation in the CHS involves comprehensive social, economic, and agricultural impacts.
Meteorological data
In addition to anthropic activities, climate warming has been considered one of the main factors influencing local climate and hydrologic alteration in consequence in the past few decades (Duan et al., 2016). Therefore, we collected the daily observation of air temperature, evaporation, and precipitation for visualizing the local climate variation. The meteorological stations with closer geographical distances from the LRB were selected, including Harbin, Qianguo, Changchun, and Shangzhi (Figure 1, white circle). The meteorological data from 1951 to 2013 were downloaded from the National Earth System Science Data Center, P.R. China.
Land use and land cover
As a sensitive indicator of water resource variation, we compared the land use and land cover between 1978 and 2015, which is provided by the Songliao Water Resources Research Institute. As an essential grain production base in Heilongjiang and Jilin provinces, the LRB produces rice, corn, soybeans, and millet. The farmland and densely populated urban regions need plenty of water resources (Figure 2A figure for 1978). Along with the variation of the hydrological regime, the land cover of the LRB significantly changed from 1978 to 2015, for example, shrinking of the wetland, decreasing of dense grassland into a paddy field in high elevation region, and decaying of paddy fields in the middle section of the Lalin River (Figure 2). Although no article records the role of land use and land cover and hydrological change, we compared the differences between land use and land cover in the LRB.
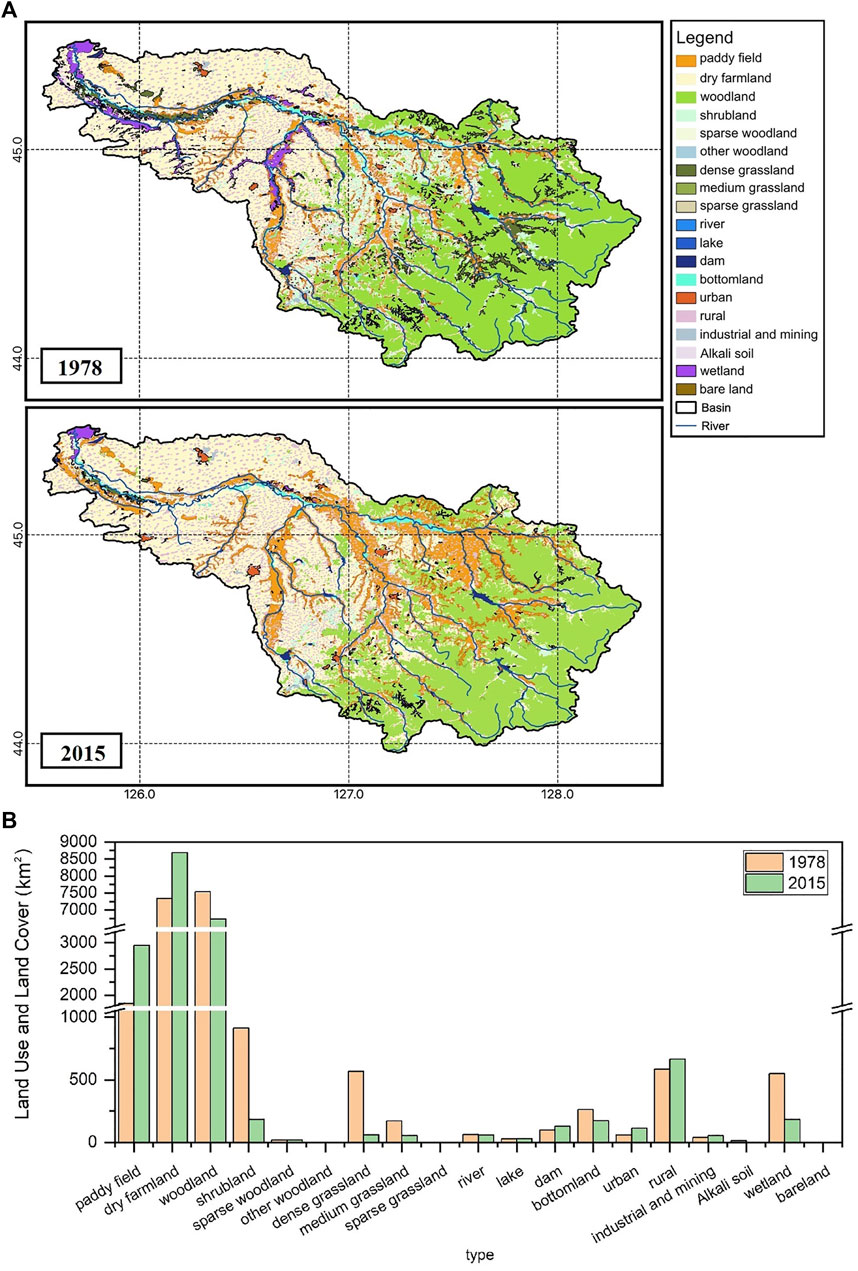
FIGURE 2. Degression of wetland and increase of paddy fields in the LRB from 1978 to 2015 (A), and the comparisons of each type (B).
The topographic maps in 1:100,000 under the national standard in the 1950s and Landsat TM remote sensing images with a resolution of 30 m in 1978 and 2015 were selected in this study. The land use and coverage in the LRB reference and the land use classification system of LU 2000 (Liu, 1997; Liu et al., 2002) were taken into consideration. Accordingly, in this study, the land-use classification system is composed of six primary types and 12 secondary types. The land-use classification system of the study area will locate paddy fields, drylands, woodlands, shrub forests, sparsely forested land, high-cover grasslands, medium-cover grasslands and low-cover grasslands, rivers, lakes, reservoirs, river beaches, residential land, sandy land, saline–alkali land, swampland, and other types of land.
Indicators of hydrologic alteration and range of variability approach
In this study, we estimated the IHA to assess the hydrological regime alteration. The IHA method evaluates the degree of river eco-hydrological changes and their impact on the ecosystem based on the daily hydrological data of the river. The indicator system and the corresponding ecosystem impact list are in the following table. Five types of indicators related to ecosystem influence were selected, including 33 hydrological indicators such as monthly average flow indicators, limit flow indicators, frequency, duration, and rate of change.
Based on the evaluation of IHA, the RVA was estimated to compare pre and post impacts of the hydrological alteration. Here, we use the original IHA and RVA estimation following Richter et al. (1997). We conducted the IHA and RVA using the Indicators of Hydrologic Alteration (IHA) software version 7.1, which is developed by The Nature Conservancy (The Nature Conservancy, 2009).
To quantitatively evaluate the degree of change in the basin after impact, the range of variability approach (RVA) (Liu et al., 2002) was estimated as follows:
where
The degree of hydrological alteration of IHA indicators is defined as follows: when:
Results
Magnitude of monthly water conditions
Under the characteristics of temperate continental monsoon climate, the LRB with four distinct seasons is shown in Figures 3 and 4. River discharge significantly varied in the dry season, and the dry season starts from winter. In December, the average monthly runoff was between 4 and 52 m3/s, mainly concentrated between 4 and 30 m3/s. Runoff with high amplitude was shown in 1968 and 1980, only. The average monthly runoff in January is between 0 and 19 m3/s, most of which is between 2 and 11 m3/s. The maximum flow occurred in 1981, followed by 1994 and 2013, and the river dried up in 1980. In February, the monthly average runoff varied from 0 to 16 m3/s mainly concentrated in 1–10 m3/s. Again, the maximum flow occurred in 1981, followed by 2014 and 1988.
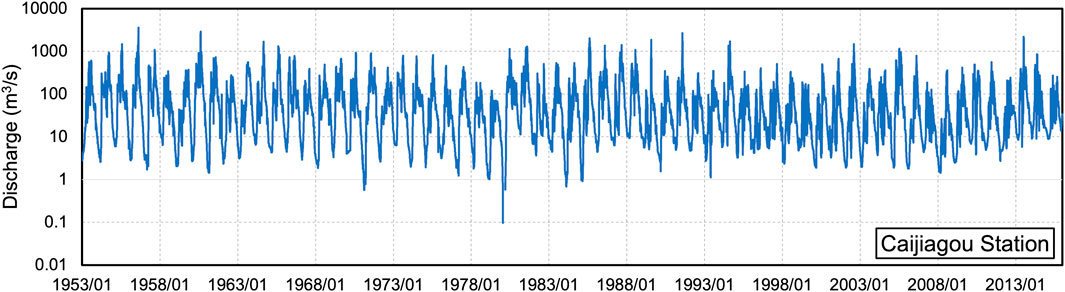
FIGURE 3. Discharge variations of the Caijiagou hydrological station from 1953 to 2015.
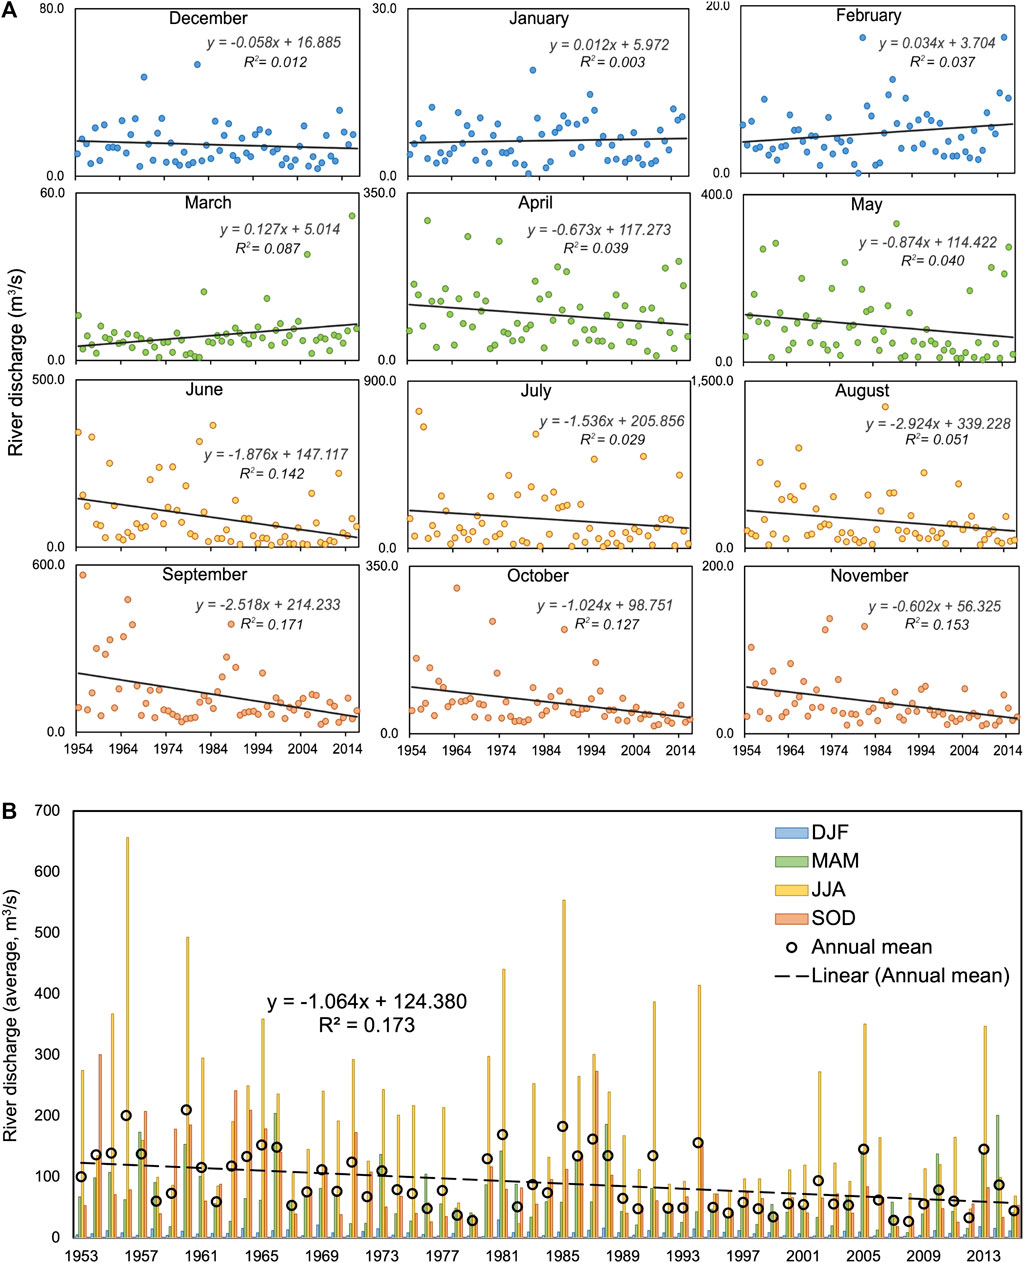
FIGURE 4. Trend and variation of monthly (A) average discharge from January to December (significance level, p values are less than 0.05 for all months) and (B) seasonal and annual (p < 0.05) tendency (DJF: December, January, and February; MAM: March, April, and May; JJA: June, July, and August; and SON: September, October, and November).
In spring, along with snow melting and river thawing, the flow amount increased gradually. The monthly average in March is between 0 and 52 m3/s, mainly 2∼12 m3/s. The maximum flow rate occurred in 2014, followed by 2004, 1981, and 1995. Also, in April, the average monthly flow was between 10 and 280 m3/s. In 1957, 1966, 1973, 1986, 2010, and 2013, the flow rate was higher than the average values. The amplitude of discharge changes obviously in May, with an average monthly runoff between 0 and 320 m3/s. The years with a large flow are 1957, 1960, 1976, 1988, and 2014. Compared to 1988, which showed the largest discharge, there was no significant flow from 1989 to 2004.
A significant decreased tendency in river discharge is shown in summer and autumn (Figure 4A). The average monthly runoff in June is between 0 and 360 m3/s. High-flow years were frequently observed before 1983. However, after 1983, the flow rate changed slightly, and there was no large runoff. Only marginally more substantial flow rates occurred in 1988, 2005, and 2011 (Figure 4B). In July, the monthly average runoff varied between 0 and 750 m3/s. There was no large flow from 1957 to 1980, and the basic flow from 1995 to 2015 was relatively less, and only a slightly larger flow occurred in a few years. High values were observed in 1955, 1956, 1981, 1994, 2005, and 2013. The monthly runoff in August mainly concentrated between 50 and 350 m3/s. There were larger runoffs in 1956, 1965, 1985, and 1994, and runoffs from 1988 to 2015. It is relatively small, and only slightly larger runoff occurred in 1994 and 2002.
For autumn, the monthly average runoff in September is between 20 and 560 m3/s, where 1954, 1957, 1960, 1963, 1964, 1965, and 1987 had larger runoffs (Figure 4A). Relatively large values were observed before the 1960s; on the contrary, after the 1960s, the runoff was relatively small, and only a few years had a slightly larger runoff. The monthly average runoff in October is between 20 and 300 m3/s. Among them, high discharge values were observed in 1993, 1971, 1987, and 1994. Remarkably, after 1994, the runoffs were almost stable at between 20 and 60 m3/s with a decreasing trend. In November, the monthly average runoff varied between 10 and 60 m3/s. Large runoffs were observed in 1954, 1971, 1972, and 1980. Also, after 1980, there was no excessive runoff, that is, between 10 and 55 m3/s.
The average monthly discharge of the CHS in winter and March showed a slightly increasing trend, in which the absolute value is relatively smaller than that of the wet season. The average monthly discharge from April to November showed an apparent decreasing trend (Figure 4A). August and September have the most significant decrease among them, and the trend line slopes were −2.924 and −2.518, respectively. A large flow seldom or never was observed after the 1980s. The decline tendency in June, July, and October is relatively tenderer than that in summer, with the slope as −1.876, −1.536, and −1.024, respectively. It should be noted that the decline tendency in April and May indicated river discharge severely decreased in the wet season, spring, and early summer. Overall, this tendency shows severe runoff reduction in summer and autumn (Figures 4A and B) and slightly increased in the dry season (from December to March) of the Caijiagou section.
Annual extreme variation
To show the variation of extreme values, we selected the annual maximum and minimal value in terms of the annual 1-day, 3-day, 7-day, 30-day, and 90-day occurrence (Table 1; Figure 5). Consistent with the monthly and seasonal decreasing tendency, the results show that the average annual maximum flow rate on the 1, 3, 7, 30, and 90 days all showed a decreasing trend and the decreasing trend range was larger. The slopes were −7.9, −7.6, −6.09, −5.28, and −2.98, respectively. Compared with the decreasing tendency of maximum indexes, the average annual minimum flow rate on the 1, 3, 7, 30, and 90 days showed a slightly increasing trend. But, the magnitude of the increase is small, and the slopes are all less than 0.05. Among them, the minimum flow on the 1, 3, 7, and 30 days showed significant flow rates in 1988 and 2014, while the average value of the 90-day minimum flow was relatively large in 1981 and 2004. A similar tendency of reduced maximum runoff and increased runoff with minimal runoff occurs in many watersheds (Zeng et al., 2021; Guo et al., 2022).
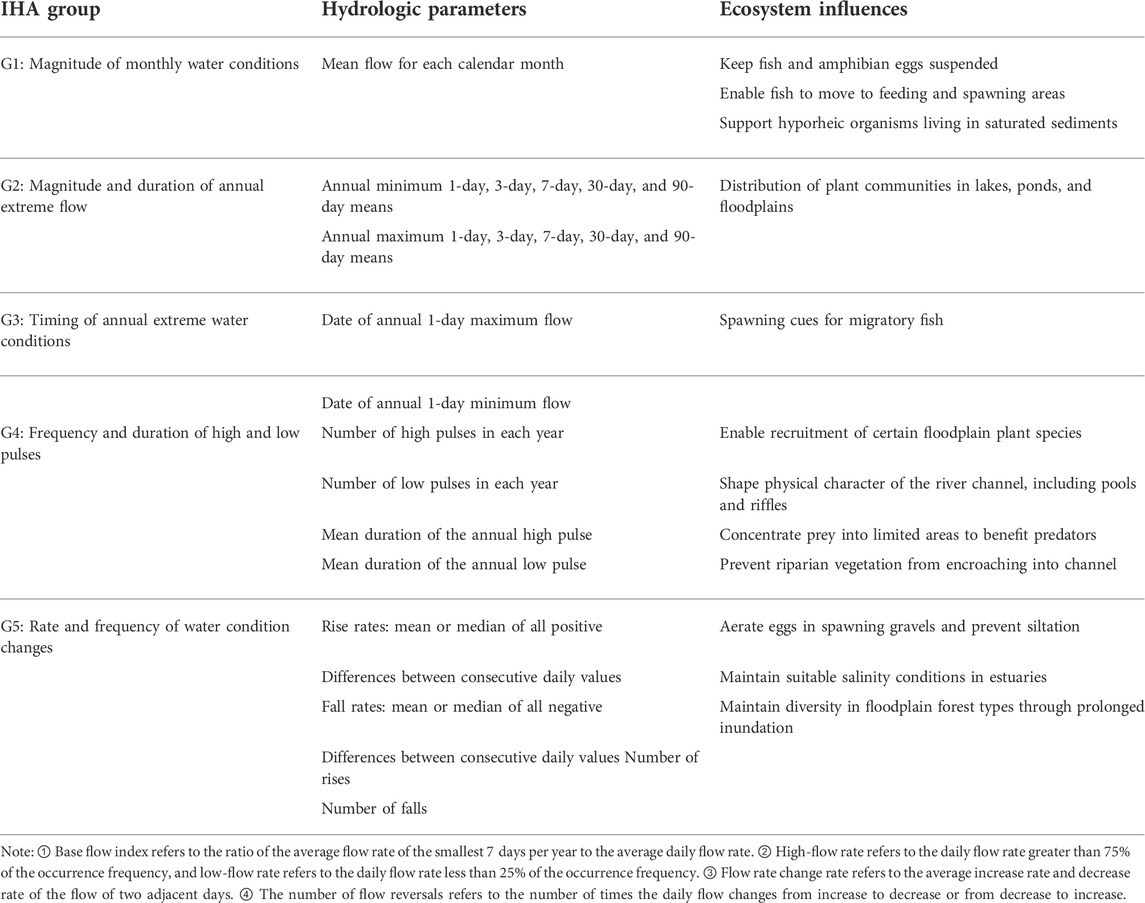
TABLE 1. IHA parameters and the impact on ecosystems (Richter and Thomas, 2007; Ge et al., 2018).
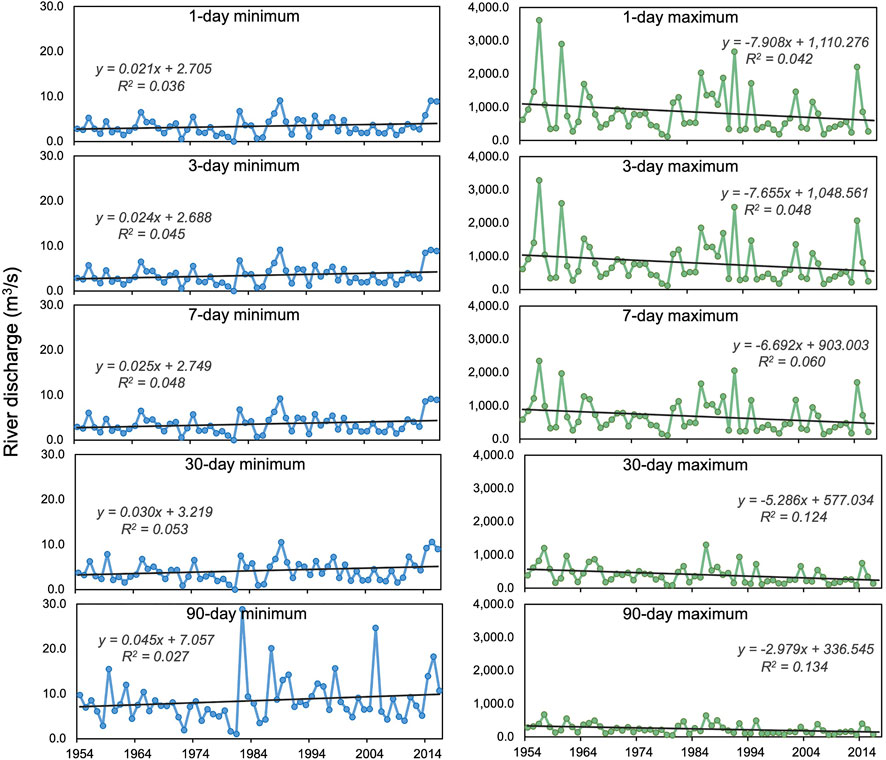
FIGURE 5. Annual 1-day, 3-day, 7-day, 30-day, and 90-day minimum and maximum flow trends (p < 0.05 for all items).
Notably, the decrease in the maximum flow rate is much larger than the increase in the minimum flow rate (Figure 5). Among them, the maximum flow rate on the 1, 3, and 7 days all had larger flow rates in 1957, 1961, 1992, and 2014, while the flow rate on the 30th day and 90th day changed greatly, and the average flow rate on the 30th day was larger in 1956, 1966, 1986, 1992, and 2015. The 90th day maximum daily average discharge occurred in 1957, 1961, 1966, 1982, 1986, and 1988. The number of days with zero flow was the same.
Timing of annual extreme flow
It is known that the highest discharge value is observed in the wet season and the lowest in the dry season (Chang, 2022). The results demonstrate the timing of the extreme values in the LRB changes following a remarkable pattern. For example, the lowest flow rate generally occurs from December to March. However, in 1993, 2010, 2013, and 2014, the annual 1-day maximum flow was observed in May (Figure 5, blue bar). The delayed dry signal is indicating that there was no snowfall or meager snowfall in the previous year’s winter.
On the contrary, the highest flow rate in this region is observed earlier than the previous year (Figure 6, origin bar). Moreover, the highest values are observed in spring sometimes, which should show from July to September as usual. For example, the annual 1-day maximum flow is found on 210th to 240th, from the 1950s to the 1960s except 1959. The results show that in 1959, the highest flow is also minimal, indicating no large peak flow from July to September (Figure 4). Before the 1970s, the highest flow rate appeared in the 200th to 270th days. In the 1970s, the highest flow rate appeared between the 120th and 240th days, and then in the 1980s, it began to delay and then decrease. Finally, from the early 1980s to 2015, the highest flow rate was lower, which is basically between the 110th and 250th days. The aforementioned results show that the extreme daily values before and after the 1970s show different overall patterns.
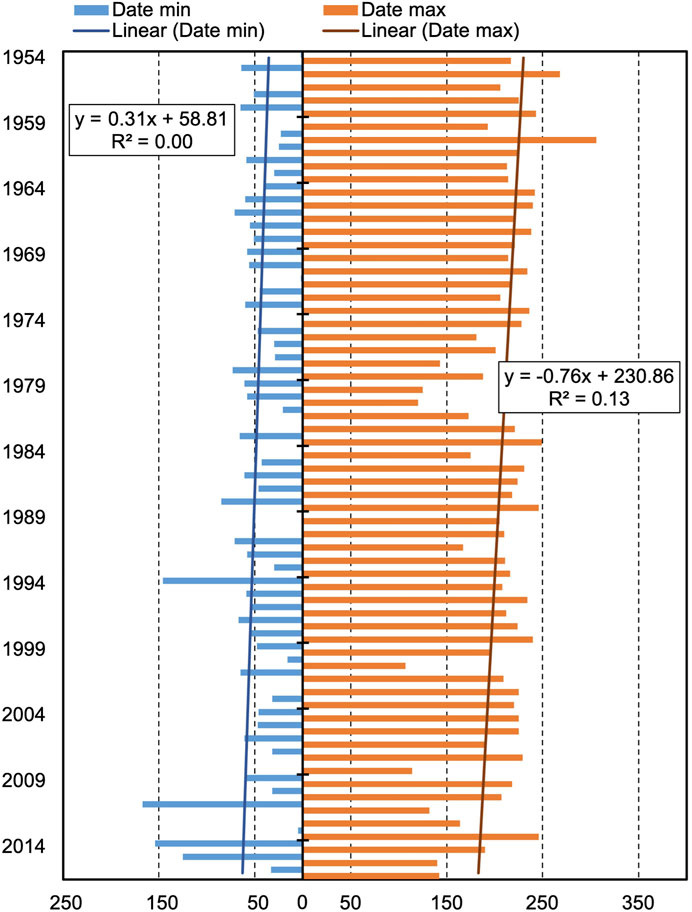
FIGURE 6. Temporal variation of extreme daily values from 1954 to 2016 (p < 0.05).
Frequency and duration of high and low flow
Variation tendencies of the frequency and duration are consistent with the notion that the hydrological condition in the LRB is getting dryer. In terms of low flow (Figure 7A), the frequency was not more than twice a year from the 1950s to the 1990s. Notably, since the 1990s, the number of low-flow frequencies has increased, achieving five or seven, indicating a significant increasing tendency. The average duration of low flow is different from the frequency of low flow every year. The duration of low flow varied between 20 and 90 days before the 1990s, while after the 1990s, the duration of low flow was around 10–20 days, with longer durations only in 2003, 2006, and 2012.
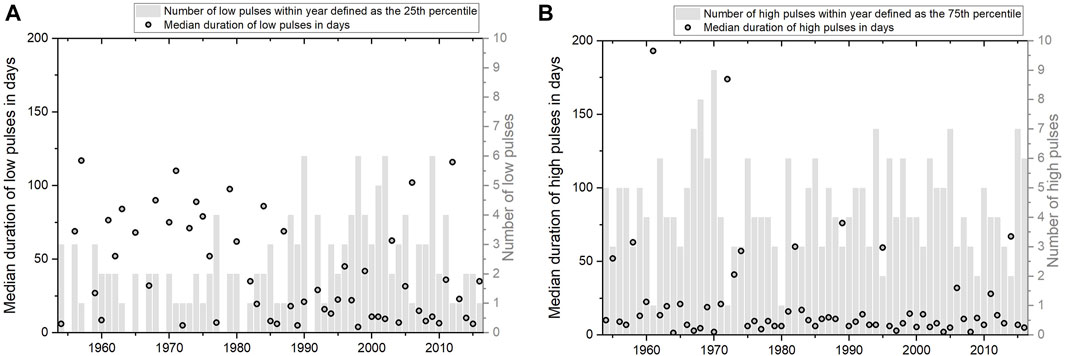
FIGURE 7. Frequency and duration of high (B) and low (A) flow.
The amplitude of variation for high-flow frequency fluctuates wildly each year, ranging from one to nine times, with an average of about four times, and sustaining between two and six times (Figure 7B). Nine major flood peaks were observed in 1969, whereas only one flood peak was observed in 1961, 1972, and 1980. In case of the duration of high flow, most of the years are within 20 days, and some achieve 80 days. Also, there was a longer duration of 190 days in 1961 and 170 days in 1972. The maximum flow on the 1, 3, 7, and 30 days shows that the runoff in 1961 was significant and the longer duration was consistent with the findings of the conclusion.
Rate and frequency of water condition changes
The mean value of the continuous increase rate of flow varies between 0.5 and 11.5 m3/s (Figure 8). Thus, the range of changes before the 1990s is relatively large, and the value is high. The continuous growth rate of flow is basically between 1 and 11.5 m3/s. Among them, the most considerable flow rate was observed in 1980. However, after the 1990s, the increase rate changed slightly, varying between 0.5 and 4 m3/s. Only a significant change was seen in 2013, which was 8 m3/s. The mean value of the continuous flow reduction rate varied from −8 to 0 m3/s. Before the 1990s, the constant flow reduction rate changed notably. Moreover, there was a significant reduction rate in 1960, 1971, 1980, and 1988. However, after the 1990s, the reduction rate was stable between −3 and 0 m3/s, and only a noticeable reduction rate appeared in 2014.
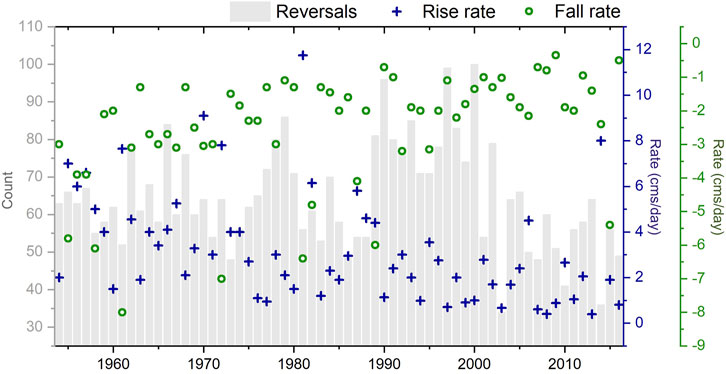
FIGURE 8. Variation of change rate and frequency of river discharge.
For Group 5 (Table 1), we also found that the flow rates of rising/fall vary between 50 and 85 times/year from the 1950s to the 1990s and 70–100 times/year from the 1990s to 2000. But after 2000, only 30–65 times per year occurred. There were more flow rates of rising/fall from the 1990s to 2000 because the low flow lasted longer during 1990–2000, and a slight increase in runoff can cause flow reversals. However, the number of annual flow reversals shows a decreasing trend. The average value is from 65 to 50 times/year, which reduces the number of flow reversals by 15 times. Therefore, the phenomenon of flow equalization in the LRB is more pronounced.
Analysis of range of variability approach
RVA analysis results showed the comparison of discharge in 1953–1978 (pre-impact) and 1979–2015 (post-impact). Figure 9 indicates that the alteration for the index of May, 3-day and 7-day minimum, 90-day maximum, and fall rate is high. On the other hand, the 1-day, 30-day, and 90-day minimum, 3-day, 7-day, and 30-day maximum, base flow index, low pulse count and low pulse duration, rise rate, and the number of reversals denote moderate alteration. The basin’s degree of hydrological alteration overall is 50%, with a moderate alteration. Overall, the hydrological regime of the LRB has undertaken drastic changes after 1978.
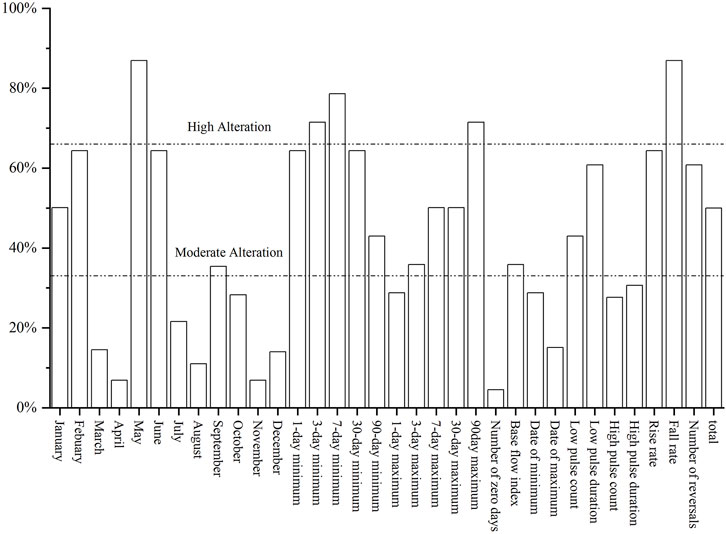
FIGURE 9. Hydrologic alteration of the RVA for CHS (the number represents the IHA indicator, and the total represents the overall degree of change).
Based on Figure 10, the post-impact flow regime alteration presents a noticeable change compared to that of pre-impact. All the maximum index of river discharge decreased lower than the pre-impact, which is consistent with the overall decrease from April to December in Figure 10A. From the aspect of monthly variation, almost all of the discharges were decreased from April to December (Figure 10B). On the contrary, all minimum indexes increased, which is consistent with the increasing trend from January to March (Figure 10B), during the dry season in the LRB. These variations emphasized that the water resources of the LRB have undergone drastic changes from 1953 to 2015. The amplitude of the monthly variations for the post-impact fell below half of the pre-impact in May, June, and November.
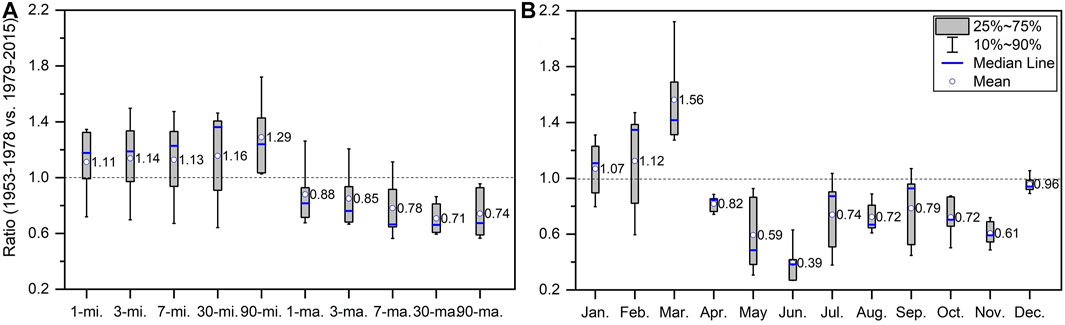
FIGURE 10. Variation of RVA for the LRB before and after 1979, in extreme pattern (1-mi. represents 1-day minimum, and 1-ma. indicates 1-day maximum value) (A), and in monthly pattern (B).
Discussion
The impact of changes in hydrological regime on the ecological environment
According to the changes in the hydrological conditions, the average monthly runoff during the wet and regular water periods showed a decreasing trend. Moreover, the degree of hydrological alteration in May, June, and September was high or moderate before and after 1978 (Figure 9). The average annual maximum flow on the 1, 3, 7, 30, and 90 days decreased significantly. The degree of hydrological alteration is moderate for the 3-day, 7-day, and 30-day maximum and high for the 90-day maximum (Figure 9).
Furthermore, the duration of the high-annual flow showed obvious results. The downward trend of the average duration has dropped from about 35 days to less than 10 days, or even only lasts for 1 day. In summary, the runoff required by the wetlands in the LRB showed a decreasing trend from April to October. The degree of hydrological alteration of the basin is 50%, which is moderate alteration. The substantial runoff and its duration were reduced, reducing the number of floods entering the flooded wetlands. These variations imply that the wetlands did not have sufficient water sources. The utilization of water resources in the LRB critically dominates the ecosystem in this region. Replenishment of aquatic plants and aquatic animals has all undergone significant changes.
The water resources of the CHS on the LRB have undergone severe changes. In 2015, the wetland area accounted for 53% of the area compared to 1978 (Figure 2). At the mouth of the Lalin River, there is also the Provincial Nature Reserve of the Fuyu Flooded Wetland in Jilin province and the Lalin River Mouth Provincial Nature Reserve of Heilongjiang province. These two wetland nature reserves depend on the outflow of a sufficient river discharge. They are the main channels and habitats for waterfowl migration, rest, and reproduction in northeast Asia. These two wetland nature reserves also have red-crowned cranes, great bustards, and their habitats. Floods are the main source of water for the survival of flooded wetlands. It is difficult for floods to overflow out of the dikes and enter the wetlands, decreasing the frequency and degree of flooding along the Lalin River. As a result, the runoff needed for wetlands in the LRB from April to October shows a decreasing trend. Due to the reduced extreme large runoff and its duration, the amount of floodwater entering the flooded wetland was also reduced. Consequently, the flooded wetland on both sides of the Lalin River is not supplied with enough water, and the function of the wetland cannot be maintained. The wetland area of the two wetland nature reserves accounted for 30.22% in 1978 and only 15.12% in 2015 (Figure 11). Furthermore, degression of the current ecosystem function is likely worse if the water resources continuously decrease, whose results are consistent with those of the LRB and the Songhua River Basin (Wang et al., 2017).
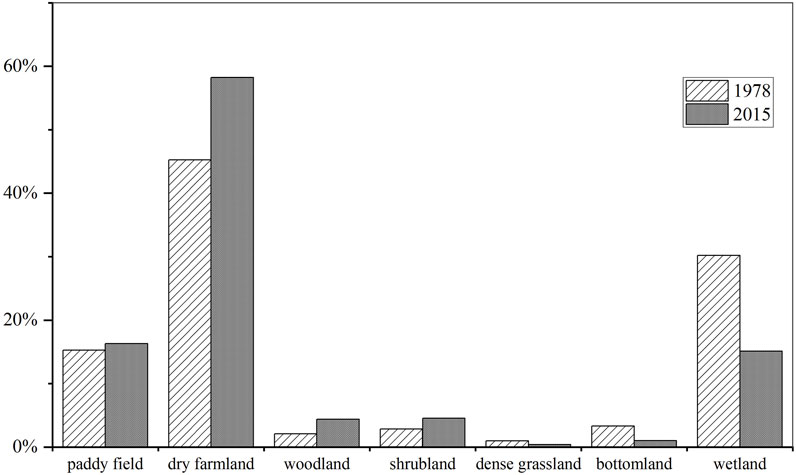
FIGURE 11. Map of the land-use area change in the Lalin River Estuary Wetland Nature Reserve.
Variation of hydrological regimes may cause fatal effects for aquatic creatures. The normal spawning time and reproductive behavior significantly impact the size and structure of the population. For example, fish generally spawn from April to June in the Lalin River, which requires a certain amount of peak flow stimulation. According to the analysis of changes in the monthly average flow of hydrological regimes, only 14 years have large flows from April to June, and the remaining 49 years have medium or small flows. Results show that only 1957, 1966, 1973, 1986, 2010, and 2013 have shown a large flow in April. Also, for May and June, only 1957, 1960, 1966, 1976, 1988, 2010, and 2014 have shown a large flow. There were only large flows in June in 1956, 1960, 1981, and 1983. Furthermore, there was an extremely low-flow phenomenon and no small flood peaks occurred in May in 1993, 2010, 2013, and 2014. Therefore, the required hydrological conditions for fish spawning were not available, which would disturb the fish’s survival and health.
Analysis of the driving forces of hydrological changes
According to Wang et al. (2014), the extent of human activities affecting runoff reduction is 71–97%, while precipitation is 3–29% in the Songhua River Basin. The LRB provides a large amount of water resources for irrigating, which is mainly carried out during May, June, and September. The irrigation requiring many water resources mainly depends on surface water, which is supplied through reservoirs, diversion gates, and dams of rivers and lakes. According to statistics on the area of paddy fields in the LRB (Figure 2), the number of paddy fields showed a rapid growth trend. For example, the area of paddy fields in 2015 was 1.5 times that of 1970. The increase in paddy fields has resulted in reduction of wetlands. Specifically, the water consumption in paddy fields accounts for 80.8% of the total water resources (Liu et al., 2019; Dang et al., 2021).
In addition, even more alarmingly, the meteorological condition in the LRB shows a warming up and drying up tendency (Figure 12). Under global warming, the air temperature observed from the surrounding locations (Figure 1) shows an intensively increased tendency in the last 50 years (Duan et al., 2019). On the contrary, the precipitation amount decreased, which reduced river discharge in the Lalin River. Furthermore, although the observed evaporation values were only available before 2000, they increased as the basin accelerated water resource loss. In summary, along with the continuous global warming, hydrological regimes may worsen for the LRB. As a result, the hydrological situation in the LRB has changed considerably under the dual influence of human activities and the global warming situation.
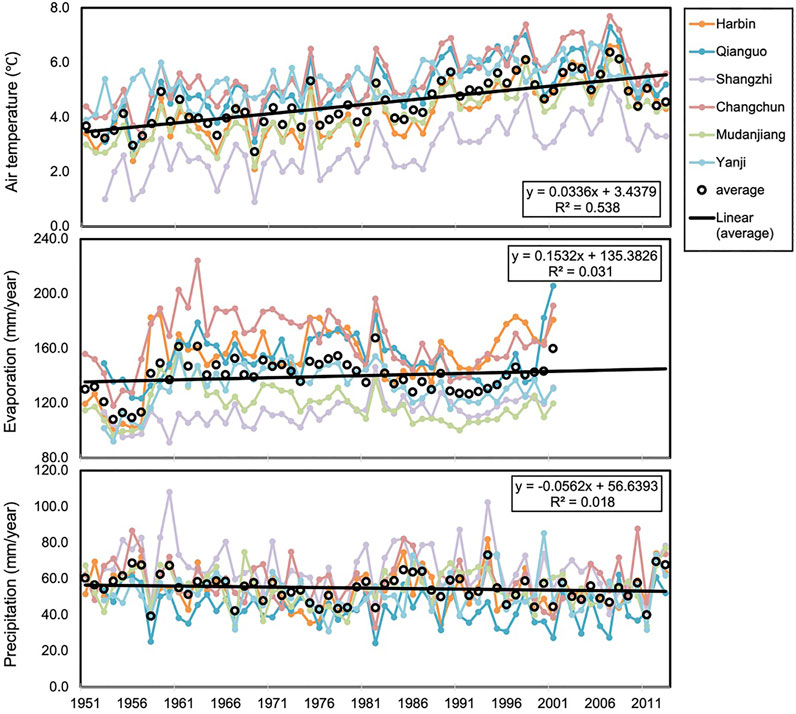
FIGURE 12. Meteorological variation around the LRB. The average value of meteorological stations was plotted as black circle and is regressed as a black line showing the linear variation tendency (the significance level, p are less than 0.05 for all variables).
Conclusion
This study revealed the significant hydrological variation of the LRB. We analyzed daily runoff with the IHA at the CHS from 1954 to 2015. The results showed that the average monthly flow during the water level with regular and high periods showed a decreasing trend. The magnitude of the maximum flow decreased significantly. The annual maximum flow decreased significantly and slightly increased on the yearly minimum flow. The hydrological alteration of the basin is 50% (moderate) before and after 1978. Overall, the LRB is drying up regarding the increasing trend of low pulse and fall rate of flow and the decreasing trend of the rising rate of flow. Furthermore, the wetland ecosystem is undergoing severe changes due to reduction of peak discharge, and the stimulation of fish is reduced, affecting fish spawning and fish resources.
The changes in land use and land cover are evidence of draft changes that occurred in the LRB. For example, many reservoirs have been built to regulate water resources for paddy field irrigation under the development of the society and economy. In another aspect, more paddy fields are planted, and water conservancy projects consume water resources. These changes will significantly impact the hydrological regime, and there is a great potential to affect the water-related ecological environment.
Due to the lack of records, it is hard to identify how much the meteorological variation and human activities affected the hydrological regime. Therefore, it is difficult to distinguish how much the hydrological variation caused the ecosystem to change in the LRB. In particular, the role of human activities as one of the influencing factors may lead to water resources decreasing and fish species becoming endangered. However, it is worthy to emphasize that apparent changes in the ecological survival conditions have taken place regarding the extreme hydrological variation. Therefore, reasonably sustaining and maintaining the Lalin River basin’s water resources is an urgent task, especially under the continuous warming of climate. Furthermore, identifying how human activities and hydrological resources affect each other will be an expected topic that helps make better decisions and manage water resources.
Data availability statement
The original contributions presented in the study are included in the article/Supplementary Material; further inquiries can be directed to the corresponding author.
Author contributions
XW and WM prepared the data collection and analyzing; JL, HL, GM, and DB assisted the data preparation; WM and XW took the lead in writing the manuscript. All authors provided critical feedback and helped shape the research analysis and manuscript.
Funding
This research was funded by the “National Key R&D Program of China, 2019YFC0409102”; Changchun Science and Technology Program Project (21ZGM12) and the Science and Technology Research Project of Education Department of Jilin Province (JJKH20210668KJ).
Conflict of interest
The authors declare that the research was conducted in the absence of any commercial or financial relationships that could be construed as a potential conflict of interest.
Publisher’s note
All claims expressed in this article are solely those of the authors and do not necessarily represent those of their affiliated organizations, or those of the publisher, the editors, and the reviewers. Any product that may be evaluated in this article, or claim that may be made by its manufacturer, is not guaranteed or endorsed by the publisher.
References
Belmar, O., Bruno, D., Martinez-Capel, F., Barquin, J., and Velasco, J. (2013). Effects of flow regime alteration on fluvial habitats and riparian quality in a semiarid Mediterranean basin. Ecol. Indic. 30, 52–64. doi:10.1016/j.ecolind.2013.01.042
Bunn, S. E., and Arthington, A. H. (2002). Basic principles and ecological consequences of altered flow regimes for aquatic biodiversity. Environ. Manag. 30 (4), 492–507. doi:10.1007/s00267-002-2737-0
Cantonati, M., Kelly, M. G., Demartini, D., Angeli, N., Dörflinger, G., Papatheodoulou, A., et al. (2020). Overwhelming role of hydrology-related variables and river types in driving diatom species distribution and community assemblage in streams in Cyprus. Ecol. Indic. 117, 106690. doi:10.1016/j.ecolind.2020.106690
Chang, j. (2022). Study on variation of environmental flow components and hydrological regimes in middle yelow river based on IHA/RVA method. Water Resour. Power 40 (02), 17–21.
Chisola, M. N., der Laan, M. v., and Bristow, K. L. (2020). A landscape hydrology approach to inform sustainable water resource management under a changing environment. A case study for the Kaleya River Catchment, Zambia. J. Hydrology Regional Stud. 32, 100762. doi:10.1016/j.ejrh.2020.100762
Craswell, E. T. (2009). Ecohydrology. Processes, models and case studies. Edited by D. Harper, M. Zalewski and N. Pacini. Wallingford, UK: Cambridge university press (2008), pp. 391, £ 75.00. ISBN 978-1-84593-002-8. Exp. Agric. 45 (4), 510–511. doi:10.1017/S0014479709990299
Dang, L., Li, Y., and Feng, Y. (2021). Discussion on regional water resources allocation in Lalin River Basin. Water Resour. Hydropower Northeast China (12), 23–24. doi:10.14124/j.cnki.dbslsd22-1097.2021.12.009
Duan, W., He, B., Nover, D., and Fan, J. (2016). Floods and associated socioeconomic damages in China over the last century. Nat. Hazards 82 (1), 401–413. doi:10.1007/s11069-016-2207-2
Duan, W., Naota, H., Hideo, S., Chen, Y., Zou, S., Nover, D., et al. (2019). Evaluation and future projection of chinese precipitation extremes using large ensemble high-resolution climate simulations. J. Clim. 32 (8), 2169–2183. doi:10.1175/JCLI-D-18-0465.1
Ge, J., Peng, W., Huang, W., Qu, X., and Singh, S. K. (2018). Quantitative assessment of flow regime alteration using a revised range of variability methods. Water 10 (5), 597. doi:10.3390/w10050597
Guo, W., Zhou, H., Zhang, L., Jiao, X., and Wang, H. (2022). Evaluation of hydrological situation of Minjiang River in the past 60 Years, China. China Rural. Water Hydropower (04), 1–7.
Hart, D. D., and Finelli, C. M. (1999). Physical-biological coupling in streams: The pervasive effects of flow on benthic organisms. Annu. Rev. Ecol. Syst. 30 (1), 363–395. doi:10.1146/annurev.ecolsys.30.1.363
Li, D., Wan, W., and Zhao, J. (2018). Optimizing environmental flow operations based on explicit quantification of IHA parameters. J. Hydrology 563, 510–522. doi:10.1016/j.jhydrol.2018.06.031
Li, Y., Chang, J., Tu, H., and Wang, X. (2016). Impact of the sanmenxia and xiaolangdi reservoirs operation on the hydrologic regime of the lower yellow river. J. Hydrol. Eng. 21 (3), 06015015. doi:10.1061/(ASCE)HE.1943-5584.0001290
Lian, Y., You, J.-Y., Sparks, R., and Demissie, M. (2012). Impact of human activities to hydrologic alterations on the Illinois river. J. Hydrol. Eng. 17 (4), 537–546. doi:10.1061/(asce)he.1943-5584.0000465
Liu, H., Lv, J., Wang, M., Li, X., and Guo, M. (2019). Land use changes and its effects on eco-environment in Lalin River basin. Soil Water Conservation China (6), 38–41. doi:10.14123/j.cnki.swcc.2019.0142
Liu, J. Y. (1997). Study on national resources & environment survey and dynamic monitoring using remote sensing. Natl. Remote Senseing Bull. 03, 225–230.
Liu, J., Zhuang, D., Zhang, Z., Gao, Z., and Deng, X. (2002). The establishment of land-use spatial-temporal database and its relative studies in China. J. Geo-Information Sci. (3), 3–7. doi:10.14123/j.cnki.swcc.2019.0142
Liu, Y., Shen, J., Chen, Z., Ren, N., and Li, Y. (2013). Distribution of polycyclic aromatic hydrocarbons in surface water and sediment near a drinking water reservoir in Northeastern China. Environ. Sci. Pollut. Res. 20 (4), 2535–2545. doi:10.1007/s11356-012-1164-x
Norris, R. H., and Thoms, M. C. (1999). What is river health? Freshw. Biol. 41 (2), 197–209. doi:10.1046/j.1365-2427.1999.00425.x
Richter, B., Baumgartner, J., Wigington, R., and Braun, D. (1997). How much water does a river need? Freshw. Biol. 37 (1), 231–249. doi:10.1046/j.1365-2427.1997.00153.x
Richter, B. D., Baumgartner, J. V., Powell, J., and Braun, D. P. (1996). A method for assessing hydrologic alteration within ecosystems. Conserv. Biol. 10 (4), 1163–1174. doi:10.1046/j.1523-1739.1996.10041163.x
Richter, B. D., Mathews, R., Harrison, D. L., and Wigington, R. (2003). Ecologically sustainable water management: Managing river flows for ecological integrity. Ecol. Appl. 13 (1), 206–224. doi:10.1890/1051-0761(2003)013[0206:ESWMMR]2.0.CO;2
Richter, B. D., and Richter, H. E. (2000). Prescribing flood regimes to sustain riparian ecosystems along meandering rivers. Conserv. Biol. 14 (5), 1467–1478. doi:10.1046/j.1523-1739.2000.98488.x
Richter, B. D., and Thomas, G. A. (2007). Restoring environmental flows by modifying dam operations. Ecol. Soc. 12 (1). doi:10.5751/ES-02014-120112
The Nature Conservancy (2009). Indicators of hydrologic alteration version 7.1 user’s manual. doi:10.1002/0470848944
Shiau, J.-T., and Wu, F.-C. (2008). A histogram matching approach for assessment of flow regime alteration: Application to environmental flow optimization. River Res. Appl. 24 (7), 914–928. doi:10.1002/rra.1102
Sponseller, R. A., Heffernan, J. B., and Fisher, S. G. (2013). On the multiple ecological roles of water in river networks. Ecosphere 4 (2), art17. doi:10.1890/es12-00225.1
Suen, J.-P., and Eheart, J. W. (2006). Reservoir management to balance ecosystem and human needs: Incorporating the paradigm of the ecological flow regime. Water Resour. Res. 42 (3). doi:10.1029/2005wr004314
Sun, F., Yang, Z., and Huang, Z. (2014). Challenges and solutions of urban hydrology in beijing. Water Resour. manage. 28 (11), 3377–3389. doi:10.1007/s11269-014-0697-9
Wang, X., Lv, J., and Zhang, L. (2017). The ecological environment change of Songhua River Basin is connected with river and lake system. Changchun: Jilin University Press.
Wang, Y., Rhoads, B. L., and Wang, D. (2016). Assessment of the flow regime alterations in the middle reach of the yangtze river associated with dam construction: Potential ecological implications. Hydrol. Process. 30 (21), 3949–3966. doi:10.1002/hyp.10921
Wang, Y., Wang, S., and Su, T. (2014). Quantification of impacts of precipitation and human activities on runoff changes in different sections of Songhua River during 1955-2010. Prog. Geogr. 33 (1), 65–75. doi:10.11820/dlkxjz.2014.01.008
Yin, W., Teng, Y., Zhai, Y., Hu, L., Zhao, X., and Zhang, M. (2018). Suitability for developing riverside groundwater sources along Songhua River, Northeast China. Hum. Ecol. Risk Assess. Int. J. 24 (8), 2088–2100. doi:10.1080/10807039.2018.1438174
Yin, X., Yang, Z., and Petts, G. E. (2011). Reservoir operating rules to sustain environmental flows in regulated rivers. Water Resour. Res. 47. doi:10.1029/2010wr009991
Yu, C., Yin, X. a., and Yang, Z. (2016). A revised range of variability approach for the comprehensive assessment of the alteration of flow regime. Ecol. Eng. 96, 200–207. doi:10.1016/j.ecoleng.2015.12.001
Zeng, J., Liu, Z., Liu, Y., Zou, J., Tong, X., Liu, X. x., et al. (2021). Eco-hydrological regime of source area of Dongjiang River based on IHA-RVA. Bull. Soil Water Conserv. 31, 157–164. doi:10.13961/j.cnki.stbvtb.2021.06.022
Zhang, H. B., Xin, C., Wang, Y. M., and Huang, Q. (2010). Influence of drawing water to Baojixia irrigation area on hydrologic regularity and ecosystem of Weihe River. J. Northwest A F Univ. - Nat. Sci. Ed. 38 (04), 226–234. doi:10.13207/j.cnki.jnwafu.2010.04.008
Keywords: hydrological regime, IHA, ecological environment, LULC, Lalin River basin
Citation: Wang X, Ma W, Lv J, Li H, Liu H, Mu G and Bian D (2022) Analysis of changes in the hydrological regime in Lalin River basin and its impact on the ecological environment. Front. Earth Sci. 10:987296. doi: 10.3389/feart.2022.987296
Received: 10 July 2022; Accepted: 08 August 2022;
Published: 01 September 2022.
Edited by:
Weili Duan, Xinjiang Institute of Ecology and Geography (CAS), ChinaReviewed by:
Xujing Guo, Chengdu University of Information Technology, ChinaPei Wang, Beijing Normal University, China
Copyright © 2022 Wang, Ma, Lv, Li, Liu, Mu and Bian. This is an open-access article distributed under the terms of the Creative Commons Attribution License (CC BY). The use, distribution or reproduction in other forums is permitted, provided the original author(s) and the copyright owner(s) are credited and that the original publication in this journal is cited, in accordance with accepted academic practice. No use, distribution or reproduction is permitted which does not comply with these terms.
*Correspondence: Wenchao Ma, d21hQGlpcy51LXRva3lvLmFjLmpw