 Qifei Ma
 Peng Jia1,2*
95% of researchers rate our articles as excellent or good
Learn more about the work of our research integrity team to safeguard the quality of each article we publish.
Find out more
ORIGINAL RESEARCH article
Front. Earth Sci. , 25 August 2022
Sec. Interdisciplinary Climate Studies
Volume 10 - 2022 | https://doi.org/10.3389/feart.2022.986467
This article is part of the Research Topic Energy, Economy, and Climate Interactions: Challenges and Opportunities View all 12 articles
Exploring the regional differences of transport carbon emission efficiency (TCEE) and accurately identifying its influencing factors are crucial for achieving carbon neutrality in transport industry as soon as possible. The TCEE of 30 provinces in China from 2003 to 2018 was measured, and its spatial imbalance and influencing factors were determined. The following conclusions are drawn. First, previous studies have shown that the TCEE is increasing at an overall low level with significant regional differences. Second, the total regional differences of China’s TCEE presents a trend of rising first and then falling, and the intra-regional differences are the main source of total differences. Third, this study shows that certain factors, such as the economic level, transport structure, energy structure, and technical level, significantly influenced the TCEE, but there were notable spatial-temporal differences in each factor. Finally, targeted and differentiated carbon emissions reduction policies were proposed for transport departments to realize carbon neutrality as rapidly as possible.
Global warming has become an important obstacle to sustainable economic and social development. Effectively controlling and reducing greenhouse gas emissions, mainly carbon dioxide (CO2), has become an important issue facing mankind (Duan et al., 2019; Jiang et al., 2021; Zandalinas et al., 2021). According to official data, carbon emissions in China accounted for 31% of the total global carbon emissions in 2020, ranking first in the world in emissions (International Energy Agency, 2020). However, transport is the foundation and leading industry supporting social and economic development; it is also an important part of energy consumption and CO2 emissions (Bai et al., 2020; Ma et al., 2021). Data show that CO2 emissions from the transport industry account for approximately 10% of the total carbon emissions in China. They have thus become the third-largest source of CO2 emissions after industry and construction (Wang et al., 2020a; Jiang et al., 2020).
In response to global climate change, China declared its intention to achieve peak carbon emissions by 2030 and carbon neutrality by 2060 (Lin and Wang, 2020; Zheng et al., 2021). In February 2021, the Chinese government issued the Guidelines on Developing Comprehensive Transport Network, emphasising the need to accelerate the development of green and low-carbon transport and achieve peak carbon emissions in the transport sector as soon as possible (Xu et al., 2021). The carbon emissions efficiency is an important indicator of the development level of a low-carbon economy. Improving the transport carbon emission efficiency (TCEE) is the most effective means of achieving emissions reduction targets.
To date, many studies have discussed various aspects of transport carbon emissions, including their calculation (Wang et al., 2018; Yuan et al., 2019), spatial evolution characteristics (Requia et al., 2015; Solaymani, 2019), peak predictions (Li and Yu, 2019; Lu et al., 2020), and influencing factors (Grubb et al., 2015; Guo and Meng, 2019), thus contributing to a better understanding of these aspects. However, few studies have investigated TCEE. Related research mainly focuses on energy or environmental efficiency evaluation in the transport field (Cheng et al., 2019; Omrani et al., 2019; Palander et al., 2020).
The methods used to measure the TCEE first included single-factor evaluation methods, such as those involving the determination of carbon emissions per unit freight turnover, per unit energy and per unit GDP (Greening et al., 1999; Jobert et al., 2012). With the wide application of production boundary theory and the complexity of traffic carbon emissions, the single-factor evaluation method has gradually been replaced by the total-factor evaluation method (Hampf and Kruger, 2014; Wang et al., 2020b; Wang et al., 2021). The total factor evaluation method can measure the allocation efficiency of traffic factors, especially the data envelopment analysis method, which is favored by researchers in the field of efficiency evaluation because it does not need any weight assumption, does not need to determine the input-output function relationship in advance, does not need dimensionless data processing, and can quickly deal with the evaluation problem of complex multi-input and multi-output systems (Cucchiella et al., 2018; Xie et al., 2018; Zhou et al., 2018; Ma et al., 2022). For example, Yang et al. (2021) established a life cycle DEA model, and measured the management performance of CO2 and PM 2.5 in China. Chen et al. (2021) combined with four-stage DEA and non-radical direction distance function (NDDF) model, considering the bad output and environmental factors, the energy efficiency of China’s transport sector is calculated.
The exponential decomposition, input-output methods and econometric regression model can identify the influencing factors of the TCEE. The exponential decomposition method usually uses the IPAT, STIRPAT, and Kaya equations to decompose the influencing factors of the carbon emissions efficiency into population scale, wealth, and technology effects (De Oliveira-De Jesus, 2019; Liu et al., 2020). The input-output method mainly relies on the Malmquist index to separate carbon emissions efficiency into pure technical efficiency, scale efficiency, and technological changes (Zhang et al., 2015; Jiang et al., 2020; Ma et al., 2021). The econometric regression model generally adopts the vector autoregression (VAR) (Zhou and Hong, 2018), Tobit (Cui and Li, 2015), wavelet analysis (Raza et al., 2019), and spatial econometric models (Yu et al., 2020; Zhao et al., 2022) to test the relationship between the influencing factors and carbon emissions efficiency. Among these models, the spatial econometric models can consider spatial effects and thus have gradually become the mainstream method to explore the factors affecting carbon emissions efficiency.
However, existing studies still have the following shortcomings. First, the spatial effect of TCEE in the existing literature is limited to the analysis of spatial-temporal pattern evolution and spatial correlation, which ignores the regional differences. According to previous studies, there are obvious differences in the development of regional transport industry in China (Xu and Lin, 2016; Xia, et al., 2018). First, previous studies mostly used qualitative methods to describe the difference distribution of regional TCEE, but did not conduct in-depth research on the source, degree and dynamic evolution law of the difference (Peng et al., 2020). Second, the TCEE is influenced by various factors, such as economic level, population density, transport mode, and energy structure (Shao and Wang, 2021; Zhao et al., 2022). However, due to the differences in transport infrastructure, economic levels, population distributions and technical competence among provinces, the leading factors affecting the TCEE in different provinces are unclear, which leads to different effects from the carbon reduction policies. The spatial econometric model can only measure the overall effect of the influencing factors on the TCEE, but it cannot identify the temporary and spatial differences. This leads to a lack of pertinence in the evaluation results, thus affecting the implementation of carbon emissions reduction policies.
In view of this, the SBM model was used to calculate the TCEE in China. The Dagum Gini coefficient model were used to study the spatial disequilibrium of TCEE. Subsequently, the GTWR model were used to measure the spatial-temporal differences in the influencing factors on the TCEE. We propose two major innovations in this study. First, this paper presents an in-depth analysis of TCEE’s spatial disequilibrium, identifies the source of regional differences. Second, we use the GTWR model to determine the influencing factors of the TCEE, and verify the spatial and temporal differences of each influencing factor on the TCEE in China. The overall purpose of this study is to determine the impact mechanism of the TCEE, provide decision support for transport departments to formulate targeted emission reduction measures and aid the transport industry in rapidly achieving carbon neutrality.
We use input-output data of transport industry from 2003 to 2018 for 30 mainland provinces in China (excluding Tibet). The data are obtained from the China Statistical Yearbook (2004–2019) and the China Energy Statistics Yearbook (2004–2019). Infrastructure, labor, capital, and energy consumption are selected as input indicators, the traffic added value are regarded as expected outputs, and carbon emissions of transport industry are regarded as unexpected outputs. Among them, the infrastructure is expressed in terms of total mileage of road, railway, waterway and pipeline transport network. The labor force is represented by employees in the transport industry. The capital stock of the transport industry is calculated using the perpetual inventory method (Li and Zhang, 2016). The data are converted to 2003 base period prices; the added value of the transport industry is also treated. Additionally, according to the conversion coefficient of standard coal, as published in the China Energy Statistics Yearbook, all types of energy are standardized and converted to calculate the energy consumption of the transport industry. Transport carbon emission data is calculated according to Liu et al. (2021).
For the influencing factors, We refer to the previous research (Heinold and Meisel, 2018; Kimbrough et al., 2018; Shao and Wang, 2021; Zhao et al., 2022), and finally selected 8 indicators such as economic level (GDP), population size (POP), industrial structure (IS), energy structure (ES), transport structure (TS), transport intensity (TI), transport price (TP), and technical level (TL) to explore the impact mechanism of transport carbon emission efficiency (Table 1). Before regression, we calculated the variance inflation factor (VIF) of each variable to prevent multicollinearity between the explanatory variables (Table 2). The results showed that the VIF values were all <5, indicating that no multicollinearity was present among the variables.
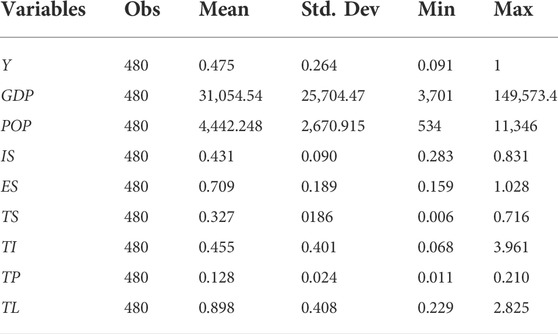
TABLE 1. Descriptive statistics of the variables.

TABLE 2. Results of the multicollinearity test.
The following describes all of the variables used in this study.
Economic level. An improvement in the economic level leads to an increase in the transport demand and changes in residential travel modes. Economically developed provinces often have more advanced technologies, which can reduce CO2 emissions and affect changes in the TCEE. In this study, the per capita GDP was selected as the index of regional economic development, with 2003 as the base period, to reduce the influence of price changes.
Population size. The impact of the population size on the TCEE is bidirectional (Zhao et al., 2022). The expansion of the population scale accelerates the spatial flow of people and goods between provinces, resulting in an increase in the transport demand, which in turn leads to an increase in energy consumption and CO2 emissions and a decrease in the TCEE. Furthermore, an increase in the transport demand due to population expansion increases the economic output of the transport industry and improves the TCEE. We used the total population of a province to determine its population size.
Industrial structure. The optimisation of and upgrades to the industrial structure can promote regional economic growth, increase transport demand, and change transport intensity. Furthermore, the evolution of the industrial structure can change the energy consumption structure and transition economic development from relying on fossil fuels, such as coal and petroleum, to clean energy, which effectively reduces carbon emissions and improves the TCEE (Shao and Wang, 2021). In this study, the proportion of the tertiary industry was used to represent the industrial structure.
Energy structure. The impact of the energy structure on the TCEE mainly depends on the consumption ratio of diesel oil and gasoline. Owing to its high carbon emissions coefficient and maximum consumption, the higher the ratio of the energy structure, the lower the TCEE (Yuan et al., 2017). Therefore, the energy structure was expressed as the ratio of diesel and gasoline consumption to the total energy consumption of the transport industry.
Transport structure. Energy consumption mainly reflects the impact of the transport structure on the TCEE. As a “green” mode of transport, an increased proportion of railway and waterway transport use yields reduced energy consumption, which is conducive to improving the TCEE. Conversely, the higher the proportion of road transport, the lower the TCEE (Zhao et al., 2022). Based on the large proportion of current road transport in China, we used the ratio of road turnover and comprehensive turnover to measure the transport structure.
Transport intensity. Transport intensity can reflect the relationship between transport and economic development, which is usually expressed as the ratio of the transport turnover to the regional GDP. A lower transport intensity usually indicates a higher technical level of transport organisation and management (Shao and Wang, 2021); thus, the TCEE is higher. When calculating this index, passenger and freight volumes were converted into a comprehensive conversion turnover according to the conversion coefficient specified by the Chinese statistical system.
Transport price. The transport price significantly affects the transport demand and supply, which in turn affects the economic output of the transport system, leading to changes in the TCEE (Ma et al., 2021). The transport price variable was expressed as the per capita annual traffic and communication expenditure/per capita annual consumption expenditure of urban households.
Technical level. Advanced energy-saving technologies can effectively reduce CO2 emissions. At the same time, an improvement in the technology level can reduce the production costs of an industry, promote economic growth, and form a cycle of economic growth and environmental improvement, thus improving the TCEE (Ma et al., 2021; Zhao et al., 2022). In this study, the reciprocal of the energy intensity was used to express the level of energy-saving technologies.
The DEA model is the most popular method for measuring the carbon emissions efficiency (He et al., 2013; Park et al., 2016; Chu et al., 2021). Among the various DEA models (e.g., the CCR, BCC, and SBM, among others), the SBM model proposed by Tone (2001) considers unexpected output and reveals the influence of slack variables on the measured value. Therefore, we selected the SBM model to measure the TCEE with MaxDEA software. According to Tone (2001), the SBM formula is as follows:
where θ represents the value of TCEE, N, M, and I represent the number of inputs, expected outputs and unexpected output indicators, respectively.
The Dagum Gini coefficient is widely used by researchers because it decomposes the Gini coefficient into three parts, intra-regional difference contribution (Gw), inter-regional difference contribution (Gnb), and super-variable density contribution (Gt). It effectively compensates for the fact that the traditional Gini coefficient and Theil index cannot solve the overlap between samples and cannot reveal the source of the overall difference (Dagum, 1998; Sun and Zhu, 2020). The formula is as follows:
where G represents the total Gini coefficient, n represents the number of provinces, μ is the average value of TCEE in China, and k represents the number of regions divided. In this study, China was divided into three regions, east, central, and west, with k = 3. yji refers to the TCEE value of any province in region j, nj refers to the number of provinces in region j, and yhr and nh have the same meanings as indicated previously herein. Gjj stands for the Gini coefficient in region j, and Gjh is the Gini coefficient between regions j and h. The Gw, Gnb, and Gt satisfy the following relationship: Gw + Gnb + Gt = 1. Among them, Gt represents the influence of the interaction item between intra-regional differences and inter-regional differences of TCEE in the three regions on the overall regional differences. Djh indicates the degree of influence of the relative TCEE contribution rate between j and h regions, djh indicates the difference in TCEE contribution rates between regions, and pjh is the first moment of over-variation. We use MATLAB software to realize the above calculation.
Huang et al. (2010) added time information to the geographically weighted regression (GWR) model and proposed a GTWR model, which aims to solve the inability of the GWR model to process time data and analyse the time heterogeneity of the influencing factors. GWR model can both describe the relationship between the dependent and explanatory variables, and reflect spatial heterogeneity. By introducing the spatial position of the data into the regression coefficients, based on the estimated values of the regression coefficients at each geographical location, regional heterogeneity and spatial non-stationarity of the parameters can be explored (Guo et al., 2020; Liu et al., 2021). However, GWR model only considers the spatial position of the influencing variables and ignores the time parameters, and can not accurately explore the “spatio-temporal” nonstationarity. The GTWR model just makes up for this shortcoming (Rong et al., 2020). We using the spatial analysis tool in ArcGIS 10.2 software, the GTWR model is used to discuss the influencing factors of TCEE. The formula is as follows:
where Yi represents the TCEE in province i, Xij represents the jth explanatory variable in province i, (μi,vi,ti) indicates the Mercator projection coordinates of province i in year t, β0 is the intercept term coefficient, βk (μi,vi,ti) is the estimated coefficient of the kth explanatory variable, and εi is a residual item.
The estimated coefficient of βk(μi,vi,ti) can be expressed as follows:
where
Figure 1 shows the time-varying trends in carbon emissions and TCEE of China. The transport carbon emissions in all China’s provinces have steadily increased, but the rate of increase has gradually decreased, among which the CO2 emissions level are as follows: eastern > central > western. For the TCEE, the eastern, central, and western regions are all transitioned from high to low values; the efficiency value in the eastern region was always higher than the national average. For changes in the trend, the TCEE showed the same characteristics; before 2009, it fluctuated and declined, whereas after 2009, it increased, but the ranges were different. The central region had the largest decline in the TCEE, with a slow recovery. The eastern region ranked second but recovered the fastest. The western region had the smallest decline and a relatively stable recovery rate.
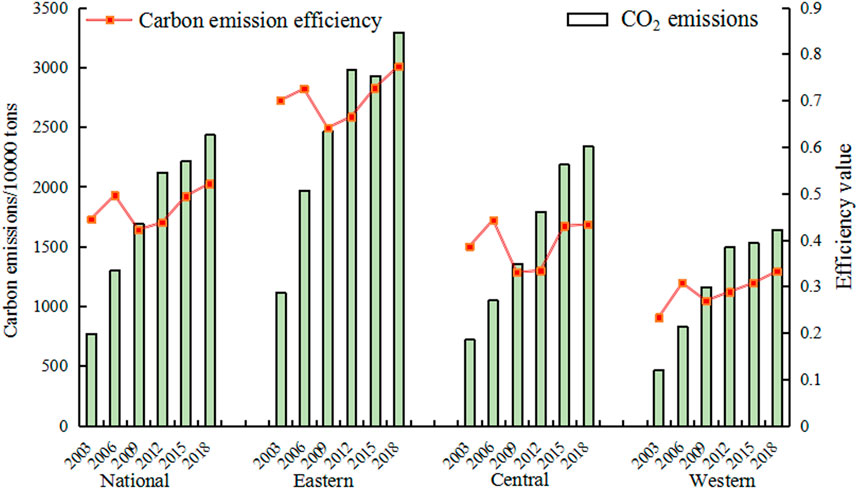
FIGURE 1. Trends in the carbon emissions and carbon emissions efficiency in the transport industry.
This is because there is a large gap between the development level of the economy and the transport network in various regions. Before 2009, eastern and central regions experienced rapid economic growth with a limited focus on environmental restoration, which led to a substantial increase in carbon emissions. In particular, when affected by emergency problems (such as the economic crisis in 2008), the prosperous eastern and central regions bear the brunt, resulting in a sharp decline in TCEE. However, compared to the central region, the eastern region has a large amount of financial support and technical support, and its resistance and recovery ability are stronger, which makes TCEE recover quickly after implementing environmental protection policies. As the western region is located in inland China, the level of economic development and completeness of the transport network is significantly less than those in the eastern and central regions. Emergencies have less of an effect on carbon emissions, thus showing the weakest fluctuations in the TCEE.
Figure 2 describes the spatial distribution patterns of the CO2 emissions and TCEE in China. We divide the carbon emissions into 4 intervals with natural breakpoints, and they are represented by different colors. The darker the color, the more carbon emissions. Similarly, the TCEE is expressed by a histogram, and the larger the TCEE is, the higher the histogram is. The transport CO2 emissions decreased from the east coast to the western interior. For the TCEE, the high-value provinces were mainly distributed in the Bohai Rim and Yangtze River Delta, whereas the efficiency values in the central and western regions and northeast China were lower. Specifically, only Tianjin, Shanghai, and Hebei had a TCEE of 1 from 2003 to 2018, indicating that the allocation of transport resources in these provinces had reached the optimal level. The other provinces must change the input-output ratio to improve their TCEE values. Among the non-effective provinces, those with an increasing TCEE were mainly distributed in the eastern regions, such as Beijing, Shandong, Jiangsu, and Guangdong, whereas the TCEE in the West, especially in Yunnan, Qinghai, Gansu, and Xinjiang, was always at its lowest level, indicating a significant spatial imbalance in the TCEE and large regional differences in the improvement potential across China.
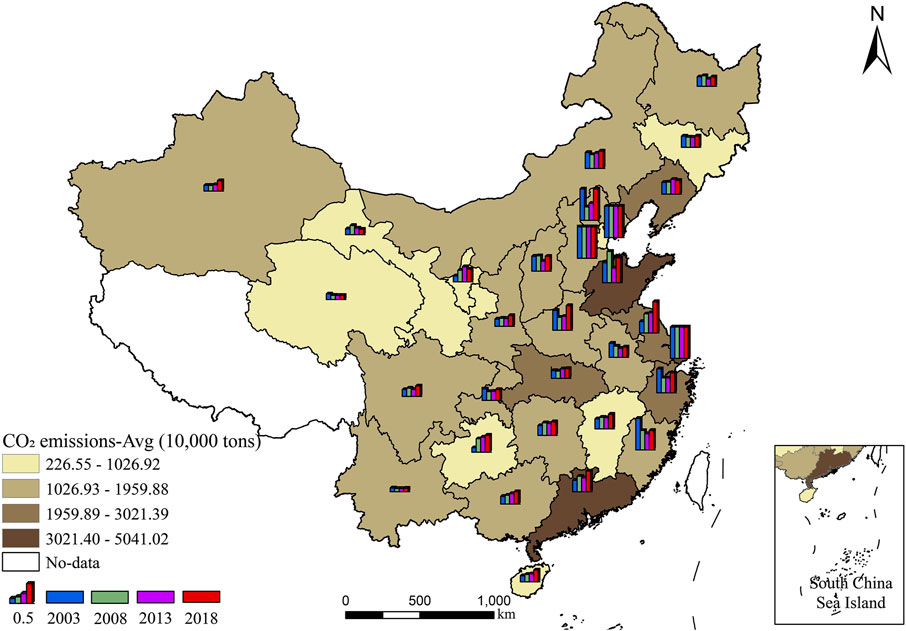
FIGURE 2. Distribution pattern of the carbon emissions and carbon emissions efficiency in the transport industry.
To further reveal the TCEE regional difference level in China, we calculated the total, intra-regional, inter-regional, and source of difference in China from 2003 to 2018 using the Dagum Gini coefficient decomposition method. The results are listed in Table 3. In order to make the results more intuitive, we visualized the results (Figures. 3–6).
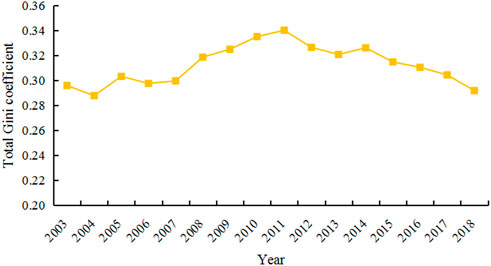
FIGURE 3. Total regional differences of TCEE in China.
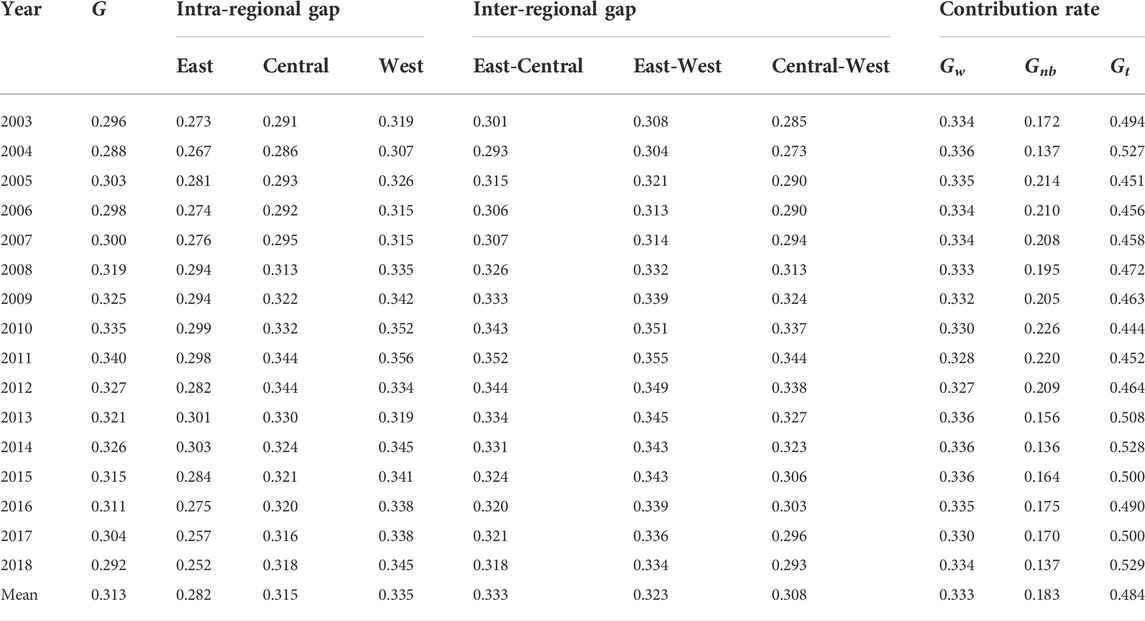
TABLE 3. Gini coefficient and decomposition of TCEE in China.
As shown in Figure 3, the total regional differences of TCEE in China showed a rising trend first and then declined in fluctuation, and the Gini coefficient was between 0.288 and 0.340, with a large overall difference. From the evolution process, the total Gini coefficient in 2003–2004, 2005–2006, 2011–2013, and 2014–2018 showed a downward trend, and the total regional disparities in TCEE narrowed. In 2004–2005, 2006–2011, and 2013–2014, the total Gini coefficient showed an upward trend, and the total regional disparities in TCEE widened. Specifically, from 2003 to 2004, the total regional disparities of TCEE in China showed a downward trend, with the Gini coefficient dropping to the lowest level (0.288) in 2004, and then rising to the highest level (0.340) after a short decline in 2004–2011. After that, except for an increase in 2014, the total Gini coefficient showed a downward trend year-by-year. Since the 21st century, with the acceleration of China’s market economy and the rapid growth of transport demand, China’s transport industry has entered a booming period. However, due to the huge differences in geographical location, capital supply, and technical level, the gap in TCEE is widening. After 2011, China attached great importance to the green development of transport, accelerated the structural reform of the transport supply side, and optimized resource allocation. The TCEE of various regions increased significantly, and the regional differences gradually narrowed.
According to Figure 4, the evolution trend of the intra-regional Gini coefficient in China’s TCEE, shows the following. First, on the whole, the regional differences in the three regions (eastern, central, and western) had the same trend before 2011, and the intra-regional Gini coefficient gradually increased in fluctuation. After 2011, the trends were different. After a short increase, the eastern region declined year-by-year, whereas the intra-regional Gini coefficient in the western region increased slowly in fluctuation, and in the central region was relatively stable. Second, the intra-regional differences of TCEE were the largest in the west and smallest in the east, which is the same as the research results of Zhang and Chen (2019). Owing to the advantages of location, capital, and technology, TCEE is generally higher in the eastern region, and it is closest to the frontier of technological production, resulting in the smallest intra-regional difference. Because the western region is an inland region, the passenger flow, logistics and capital flow are far lower than those in the eastern region, and the resource allocation level of each province is quite different, leading to the largest intra-regional difference in TCEE. Specifically, the Gini coefficient in western China ranged from 0.307 to 0.356, with an average of 0.335, which is always higher than that in eastern and central regions. The Gini coefficient in the central region ranges from 0.286 to 0.344, with an average value of 0.315, which is between the eastern and western regions. The Gini coefficient in the eastern region ranged from 0.267 to 0.303, with an average value of 0.282. The level of intra-regional differences was always lower than that in the central and western regions.
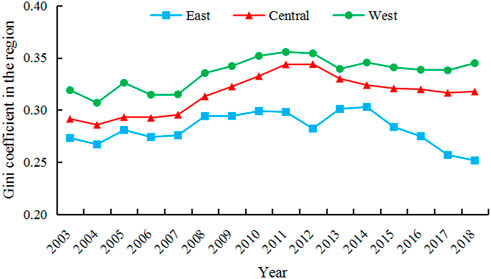
FIGURE 4. Intra-regional differences of TCEE in China.
Figure 5 shows the trend in inter-regional differences of TCEE from 2003 to 2018. First, the inter-regional Gini coefficient of TCEE fluctuations increased before 2011 but declined after 2011, which indicated that the inter-regional differences in the three regions showed a trend of expanding at first and then decreasing. Second, the inter-regional differences in east–central, east–west, and central–west regions fluctuated greatly from 2003 to 2005, dropping from 0.301, 0.308, and 0.285 in 2003 to 0.293, 0.304, and 0.273, in 2004, respectively, and then increased rapidly to 0.315, 0.321, and 0.290 in 2005. From 2005 to 2011, the inter-regional differences in the East–central, East–west, and central–west regions gradually increased to the highest point, which were 0.352, 0.355, and 0.344, respectively, and the relative fluctuation degree among them decreased. Third, from 2011 to 2018, the inter-regional differences in the east–central, east–west, and central–west regions all showed a downward trend. However, the speed of decline is different. The descending speed is the fastest in the central-west region, the second in the east-central region, and the lowest in the east-west region. Fourthly, the inter-regional differences in the central-west region have been at the lowest level throughout the study period, and the convergence rate is the fastest. The inter-regional differences between the east-west region are always at the highest level, and the convergence rate is the slowest, indicating that the regional differences in China’s transport carbon emission efficiency have not been effectively changed.
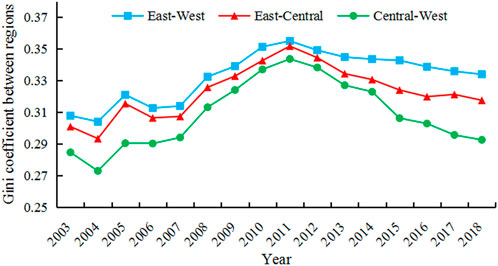
FIGURE 5. Inter-regional differences of TCEE in China.
Figure 6 shows the evolution trend of the regional difference contribution rate of the TCEE. Overall, the Gt was largest, the Gw was second, and the Gnb was smallest. Moreover, the distribution of the three were roughly symmetrical. With regard to the evolution trend, the Gnb and Gt have changed greatly, and the changing trend was opposite. The Gt increased in fluctuation, whereas the Gnb decreased slowly, and the changing trend of Gw was stable. Specifically, the evolution trend of Gt was approximately “W”, rising from 49.4% in 2003 to 52.7% in 2004 and then decreasing to 45.1% in 2005 and remaining relatively stable, slowly rising to 52.8% in 2014, and then rising to the highest point of 52.9% in 2018 after a short decline. This was the main source of the total regional disparities in the TCEE. The evolution trend of Gnb was roughly “M,” which was opposite to Gt. It decreased from 17.2% in 2003 to 13.7% in 2004 and then increased to 21.4% in 2005 and remained relatively stable, slowly decreasing to 13.6% in 2014. After a short increase, it fell to the lowest point of 13.2% in 2018. The Gnb contribution rate to the total regional differences in TCEE was always the lowest. The trend in Gw was relatively stable, accounting for approximately 33% of the total study period, which was the second largest source of regional differences in TCEE. Although Gt had the highest contribution rate to the total Gini coefficient, Gt and G showed the opposite trend, indicating that it play inhibitory role in the growth of total regional differences. Combining Figures 3, 6, it can be seen that the total Gini coefficient showed a “W” growth trend from 2003 to 2011 and then fell to the lowest point in fluctuation, whereas the Gt fluctuated to its highest point in 2018 after experiencing an “M” changing trend from 2003 to 2010, which indicates that the Gt hindered the growth of the total Gini coefficient. As mentioned earlier, the Gt represents the influence of interaction between intra-regional and inter-regional differences in TCEE among the three regions on the total regional differences. The Gt was large, indicating that the cross-overlapping problem of transport industry in the eastern, central, and western regions of China is prominent, and thus, the main reason for the regional difference in TCEE is intra-regional differences.
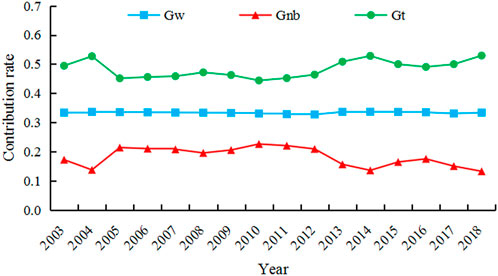
FIGURE 6. Contribution rate of regional differences in TCEE.
We used the GTWR model to discuss the spatial and temporal differences in the TCEE influencing factors. The results showed that the R2 and adjusted R2 values were 0.9264 and 0.9252, respectively, indicating that this model had a good fitting effect and strong interpretability.
Figure 7 shows the time variation in the regression coefficients of the various influencing factors. Figures 7A–H show the impact of economic level (GDP), population size (POP), industrial structure (IS), energy structure (ES), transport structure (TS),transport intensity (TI), transport price (TP), and technical level (TL) on transport carbon emission efficiency in year 2003 to 2018, respectively. From 2003 to 2018, the regression coefficient of the economic level was always positive (Figure 7A), indicating that the economic growth was beneficial to the TCEE. There was a downward trend and large range from 2003 to 2009, followed by a slow upward trend from 2009 to 2018, which conformed to the typical environmental Kuznets curve; its discrete state also changed with time. China’s economy grew rapidly in the initial stages of this study, but the carbon emissions increased significantly at the expense of the environment, which led to a significant decline in the promotion of economic growth with respect to the TCEE. In the later stage of the study period, the government focused on improving the ecological environment, emphasised the importance of civil ecological construction in the production process, and achieved remarkable results, which led to a steady increase in the positive role that economic development had on the TCEE.
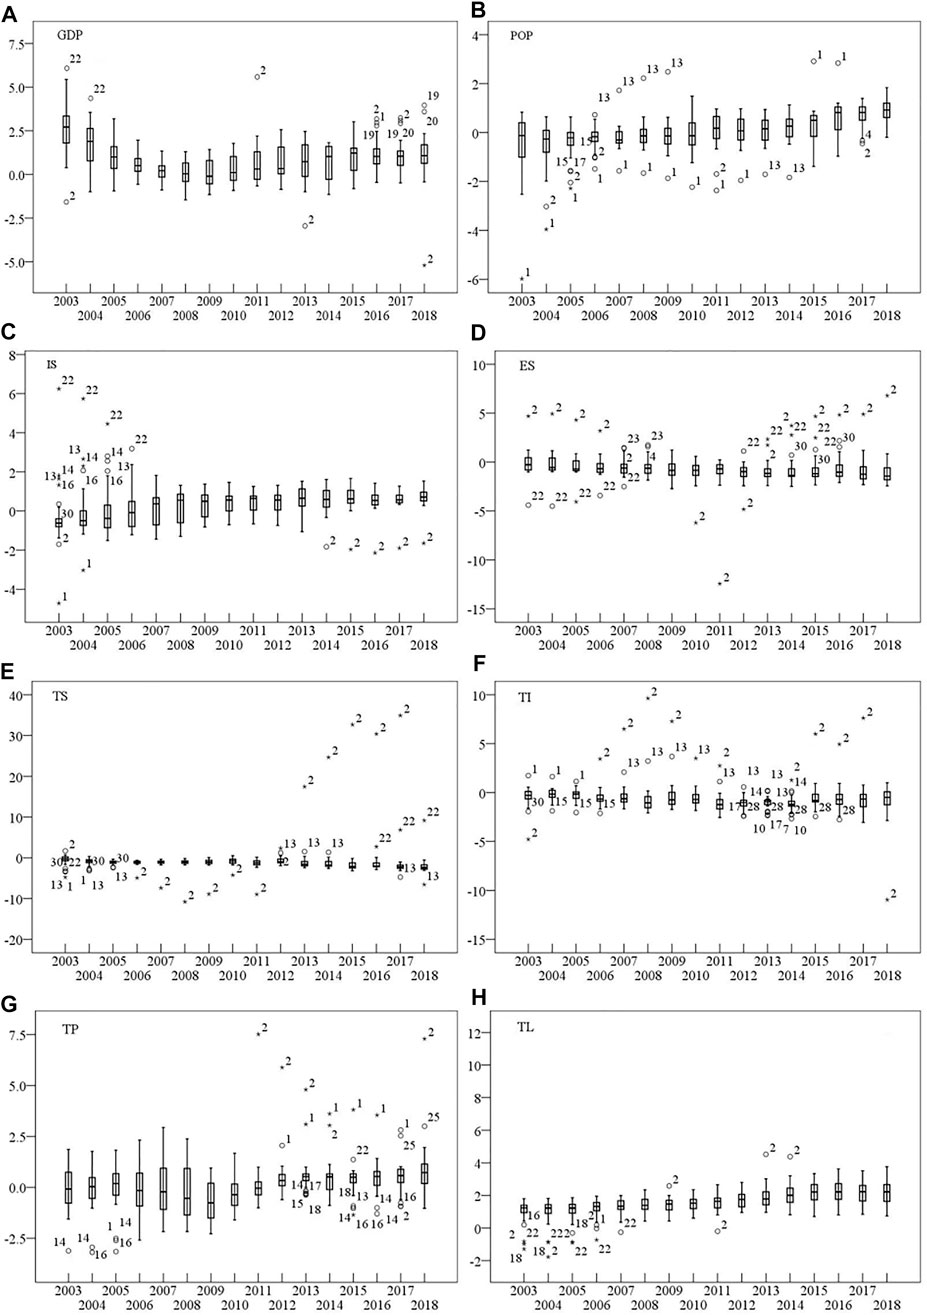
FIGURE 7. Time variation trends for the regression coefficients of the influencing factors.
The regression coefficient for the population size showed a steady upward trend (Figure 7B); the sign of the coefficient also changed from negative to positive, showing that the increase in the population had a positive effect on improving the TCEE. As the world’s most populous country, the “demographic dividend” has greatly promoted the growth of China’s economy. With the advancement of urbanisation, the population’s “quantitative dividend” has gradually changed to a “structural dividend,” which has improved the resources allocation efficiency and further promoted improvements to the TCEE.
The impact of the industrial structure on the TCEE was approximately identical to that of the population size (Figure 7C). The regression coefficient increased yearly, and the sign changed from negative to positive, indicating that the development of the tertiary industry is conducive to improvements to the TCEE. The influence mechanism of the industrial structure on the TCEE mainly relied on reducing the energy intensity, improving the energy consumption structure, promoting economic growth, and significantly reducing CO2 emissions. Therefore, optimising upgrades to industrial structures is an important means to improve the TCEE.
The regression coefficients of the energy and transport structures showed a slow downward trend (Figures 7D,E); the coefficients were negative throughout the entire study period, indicating that the energy and transport structures negatively impacted the TCEE with a gradually increasing degree of influence. With the growth of the economy, acceleration of urbanisation, and rapid increase in the number of motor vehicles, there has been a rapid increase in transport demand. The consumption of gasoline and diesel (primary fuels in the transport industry) has increased annually, accounting for approximately 70%, whereas electricity consumption in the transport industry accounts for <5%. Additionally, according to the Statistical Bulletin on the Development of the Transport Industry in 2020, road transport accounted for 71.3% of national passenger traffic and 73.8% of total freight traffic. Road transport mainly consumes fossil fuels, such as gasoline and diesel, while railway transport mainly consumes electricity; however, railway passenger traffic only accounts for 22.8% and a freight volume of <10%. Research has shown that high-speed rail, as a brand-new clean public transport mode, has changed people’s travel mode and contributed to the development of low carbon transport (Jin et al., 2020; Yang J. et al., 2021). Therefore, these unreasonable energy and transport structures have led to a rapid increase in CO2 emissions, which hinders improvements to the TCEE.
The regression coefficient of the transport intensity changed smoothly (Figure 7F), but the sign of the coefficient was negative, indicating that the transport intensity is not conducive to TCEE improvements. The transport intensity reflects the relationship between transport and economic growth. A reduction in the transport intensity indicates a reduction in turnover per unit GDP. Therefore, the transport intensity has a negative impact on the TCEE through economic growth; in other words, the transport intensity decreases while simultaneously improving the TCEE.
The regression coefficient of the transport price showed a fluctuating upward trend (Figure 7G); the sign of the coefficient also changed from negative to positive, indicating that the transport price had a negative impact on the TCEE in the early stages of the study period. In contrast, improvements to the transport price positively impacted the TCEE in the later stages of the study period. This is because China’s economy grew rapidly during the initial stages of the study period; there was a rapid increase in the spatial transfer frequency and transport volume of people and goods. Price increases have partially reduced the spatial flow of transport services, which is not conducive to economic growth. With steady economic growth, all levels of government have focused heavily on environmental issues and implemented a series of transport carbon emissions reduction policies, including measures to adjust energy consumption and transport structures through price leverage, which have achieved remarkable results. Therefore, in the later stages of the study period, the transport price positively impacted the TCEE.
The regression coefficient of the technical level showed a steady upward trend (Figure 7H), with a large value and constantly positive sign throughout the study period, indicating that improvements to the technical level significantly promoted increases in the TCEE. Science and technology were the primary productivities. Technological progress can optimise the resources allocation efficiency at the input side and reduce production costs. Furthermore, technological progress can significantly promote economic growth and reduce bad output by reducing energy consumption. Therefore, improving the technology level can promote steady improvements to the TCEE.
To observe the difference of each driving factor in spatial distribution more intuitively, this paper selects the average fitting result of each driving factor in each region for visualization (see Figure 8). Figure 8A shows that the economic level had a positive impact on the TCEE in all provinces, with coefficients ranging from 0.0394 to 1.2665, i.e., significant variations among all of the provinces. The provinces with high coefficients were mainly distributed in the northwest and southwest regions, such as Xinjiang, Inner Mongolia, Gansu, Ningxia, Hainan, Guangxi, and Yunnan, while the low coefficient regions were mainly in the eastern coastal provinces. This may have been due to the low TCEE in the western regions, which are far from the production frontier. Less economic output can produce greater marginal benefits, the TCEE in eastern developed regions located near the production frontier was generally higher. Compared with underdeveloped provinces, the same economic output had a more negligible effect on improving the TCEE.
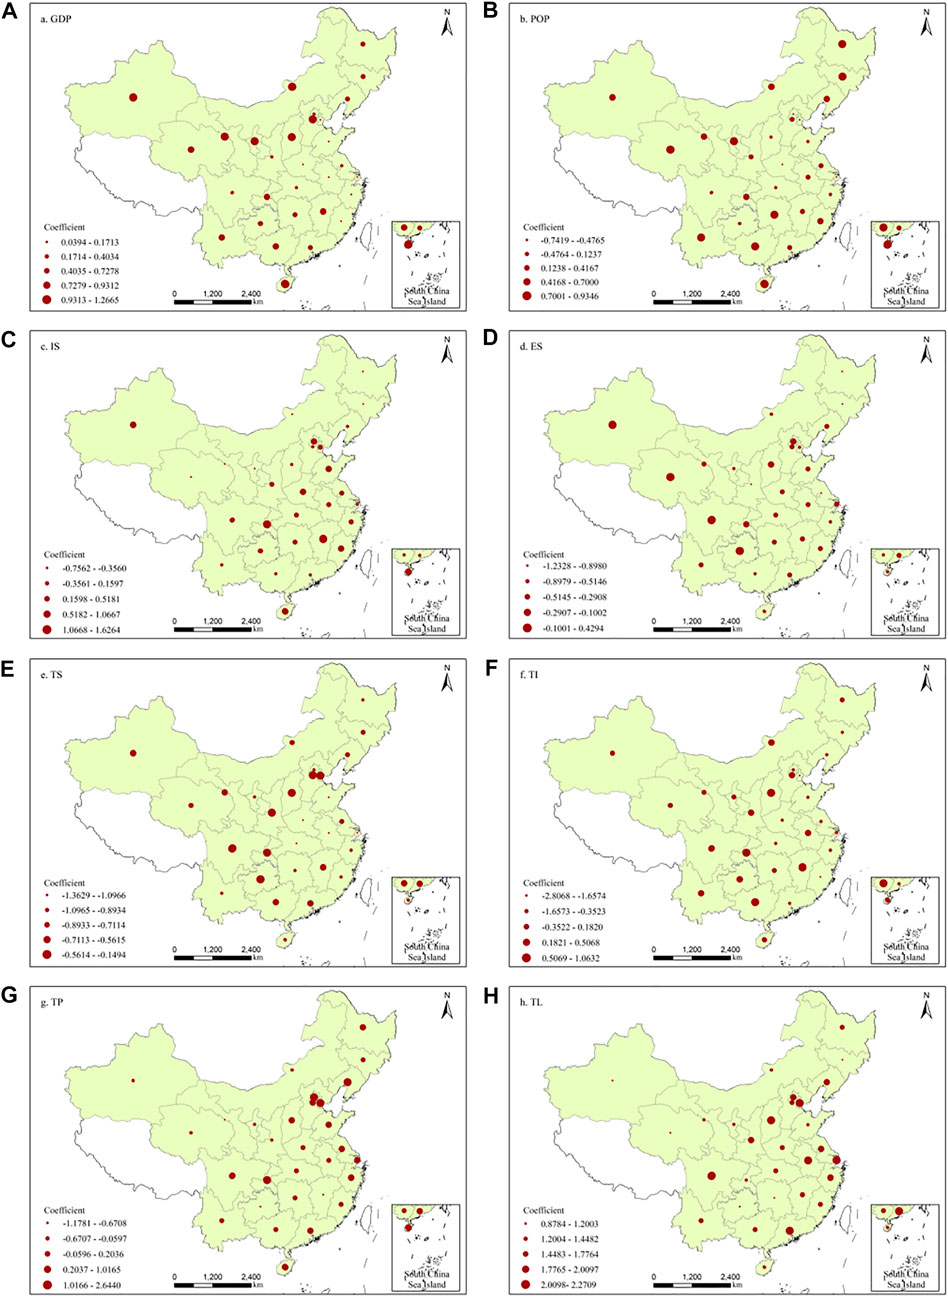
FIGURE 8. Spatial distribution characteristics of the coefficients for the influencing factors.
The distribution range of the population size regression coefficient was −0.7419 to 0.9346. Figure 8B shows that positive areas were mainly distributed in the low-population density provinces in northeast, northwest, and southwest China, while negative provinces were concentrated in high-population density provinces in eastern and central China, such as Henan, Shandong, Beijing, Tianjin, and Shanghai. Influenced by the economic level, industrial agglomeration, policy support, and other factors, China’s population and talent are concentrated in the eastern regions, which leads to insufficient developmental momentum in underdeveloped provinces, especially in northeast China, which has shown negative population growth. Therefore, increasing the population of these provinces can aid in promoting production, accelerating economic growth, and improving the TCEE. For central and eastern China, population expansion aggravates the contradiction between the transport supply and demand, resulting in serious congestion and environmental pollution. Therefore, population had a negative impact on the TCEE.
The coefficient of the tertiary industry ranged from –0.7562 to 1.6264; its spatial distribution pattern was opposite that of the population size (Figure 8C). Positive areas were concentrated in the central and eastern regions of China. The coefficients in north-eastern, north-western, and south-western China were generally small and negative in most provinces, especially in north-eastern and north-western China, where primary and secondary industries dominate economic development. In contrast, the tertiary industry accounted for a relatively small proportion, resulting in a weak driving effect on the economy. For the central and eastern regions, the proportion of the tertiary industry was relatively high, especially in Chongqing, Hainan, and other tourist cities. As the leading industry in terms of economic development, the expansion of the tertiary industry can attract more people, generate more transport services, stimulate economic growth, and promote improvements to the TCEE.
Figure 8D shows the spatial distribution characteristics of the energy structure coefficient, it had a negative impact on the TCEE in most provinces, indicating that increases in gasoline and diesel consumption reduced the TCEE. In terms of the spatial distribution, positive areas were mainly distributed in western provinces, such as Xinjiang, Qinghai, Sichuan, and Guizhou, while provinces with larger absolute negative coefficient values mainly included Heilongjiang, Jilin, Inner Mongolia, and Shaanxi. There are more heavy industries in these provinces such that the fossil energy consumption is higher, resulting in higher carbon emissions. Therefore, the unreasonable energy structure has hindered improvements to the TCEE.
The impact of the transport structure on the TCEE in all regions was negative (Figure 8E). The provinces with higher absolute coefficient values were mainly distributed in the western, while the absolute coefficient values were generally smaller in the central and eastern provinces. This may be related to the more reasonable transport structure in the central and eastern provinces. Compared with the western provinces, the railway and waterway transport systems in the eastern and central provinces were more optimal. With capital and technology support, the eastern and central provinces are leaders in reforming the transport structure, such as expediting “road-to-waterway” and “road-to-railway” processes, developing smart cars, and promoting the use of clean energy. Owing to limitations associated with topography, capital, and technology, the transport services in the western provinces are still dominated by road transport, which leads to more substantial TCEE inhibition in the western provinces than that in the eastern and central regions.
The effect of the transport intensity on the TCEE varied significantly in different provinces (Figure 8F); the regression coefficients ranged between –2.8008 and 1.0632. From a spatial distribution perspective, the negative areas were concentrated in the eastern and central regions, while the positive areas were mainly confined to the western regions, showing notable gradient characteristics. The transport intensity reflects the degree of dependence that regional economic growth had on the transport services. The increase in the transport turnover not only yielded economic value but also increased carbon emissions. For the western region, the level of economic development was relatively low; economic growth depended more on increases in the transport volume. Increasing the transport turnover of the same unit can yield greater economic benefits in the western regions than that in the eastern and central regions. Therefore, the transport intensity promoted the TCEE in the west but inhibited it in the eastern and central regions.
The coefficients of the transport price variable ranged between –1.1781 and 2.6440 (Figure 8G). The positive areas were mostly distributed in the eastern coastal provinces; the coefficients were smaller or even negative for the inland provinces, showing notable ladder characteristics. The eastern provinces have developed transport and large-scale flow processes for people and goods, which has led to a series of transport problems, such as congestion and pollution. Raising transport prices could encourage people to favour public transport and clean transport modes, thus reducing congestion and pollution while promoting the TCEE. For the central and western provinces, the economic development level was lower than that of the eastern provinces; therefore, we must increase the spatial transfer of people and goods by reducing transport costs to drive economic development and promote improvements to the TCEE.
The coefficient of the technical level was between 0.8784 and 2.2709, showing that improvements to the technical level had a positive impact on the TCEE in all provinces (Figure 8H). The coefficient decreased from the south-eastern coast to the northwest inland, indicating that the influence of the technology level on the TCEE was the greatest in the east, followed by the central and western regions. According to Ma et al. (2021), improvements to transport efficiency in the central and eastern provinces is mainly a result of technological progress and improvements to the management level. In contrast, the western provinces mainly rely on production scale expansion, which supports the perspective of this study. Therefore, all provinces should increase their investments in science and technology, attach importance to the transformation of scientific research achievements, especially in the western provinces, and focus on undertaking technology spillovers in the eastern provinces. Technological progress can become a new driving force for TCEE growth by implementing these initiatives.
Achieving the goal of “peak carbon emissions and carbon neutrality” is an important political initiative that faces China in the 21st century. As the third largest source of carbon emissions, the transport industry must make substantial strides to reduce their carbon emissions. Therefore, it is of great significance to measure the TCEE, explore the regional differences of transport carbon emissions in China, and identifying the influencing factors of carbon emission efficiency, so as to formulate differentiated transport carbon emission policies and promoting carbon emission reduction.
Our research shows that, although China’s transport carbon emission efficiency has been improving in recent years, the overall level is low (only 0.475), which is mainly due to the uncoordinated development of various transportation modes and the lack of horizontal connection between them. Moreover, the sharing rate of road transport is much higher than that of railway and water transport, which leads to unreasonable resource allocation, sharp increase in energy consumption and carbon emissions, and huge waste of transportation system investment. In addition, there are significant regional differences in carbon emission efficiency of transport, and the root of this difference lies in intra-regional differences. Many factors, such as economy, population distribution, scientific and technological level, etc., lead to the unbalanced development of the transportation in various provinces. Reducing the carbon emission from transportation and improving the efficiency of carbon emission are the hot spots of all countries in the world. Future improvements to China’s TCEE should focus on the following aspects:
Industrial structure optimisation and economic growth promotion. First, we must construct an institutional system conducive to upgrading the regional industrial structure. In contrast, for provinces with a large proportion of secondary industries, we must avoid the tendency of “de-industrialisation,” optimise the industrial structure, and actively promote industrial transformation and high-quality development. Furthermore, creating differentiated population policies is necessary. For provinces with a low population density and serious population loss in north-eastern and western China, the government should encourage childbearing, formulate preferential settlement policies, and attract people and talent to drive economic growth and improve the TCEE.
Changes in the energy and transport structures and improvements to the energy efficiency. Highway transport consumes a large amount of fossil energy and generates a lot of carbon emissions, which seriously hinders the promotion of TCEE. On the one hand, the government should vigorously develop new energy vehicles, such as those using pure electric power, hybrid power and hydrogen energy, to reduce the consumption of fossil fuels such as gasoline and diesel. On the other hand, vigorously promote the transformation from road to water and rail transport, and adopt new transport organization methods such as multimodal transport to promote container transport and reduce transport intensity, in order to optimize the energy and transport structure, and improve TCEE.
Establishment of a rational pricing system. In terms of freight transport, the government should reduce the price of railway and waterway transport and encourage a transition from roads to railways and waterways for the long-distance transport of bulk goods. In terms of passenger transport, the government should reduce the cost of public transport, improve the service quality of public transport, encourage citizens to choose public transport and clean energy vehicles, and reduce energy consumption through policy and price leverage.
Increased investment in science and technology and technical upgrades. First, increase support for scientific and technological research, and upgrade the regional scientific and technological level. In contrast, strengthening the exchange and cooperation of talent, capital, and technology between provinces; giving full recognition to the leading roles of developed provinces, such as the BR (Bohai Rim), YRD (Yangtze River Delta), and PRD (Pearl River Delta) in western and north-eastern China; promoting the overflow of new technologies, methods, and knowledge; reducing regional differences; and realising overall improvements to the TCEE are all necessary.
I have to say, there are still some shortcomings in this article. Considering the availability and convenience of the data, all the data in this paper come from the National Bureau of Statistics, and the calculation results are rough. In the future, the completeness and accuracy of the data need further refinement. In addition, this paper takes the provincial units as the research object, and the research scale is large, lacking the first-hand data verification support. In the future, it is necessary to refine the grain size, take prefecture-level cities as evaluation units, and conduct specific case analysis based on actual investigation or monitoring data to evaluate China’s transport carbon emission efficiency, so as to improve the scientificity and credibility of the research results.
The transport carbon emissions in China showed an upward trend with a decreasing growth rate. The TCEE first showed a decreasing and then increasing trend, but was characterised by an overall low level. The spatial distribution characteristics of the CO2 emissions and TCEE had the following distribution across the provinces: eastern > central > western, with significant regional differences.
The total regional differences of TCEE in China are quite large. The intra-regional differences is greatest in the western, then in the central, and next the eastern. The inter-regional differences in the eastern–western regions were determined to be the largest, followed by the eastern–central regions, and the smallest in the central–western regions. Intra-regional differences are the main source of regional differences in TCEE.
The estimated results for the GTWR model confirmed that the influencing factors of the TCEE had notable spatial differences and changed over time. Generally, the economic level and technological progress played a significant role in promoting the TCEE in all provinces while the energy and transport structures played a significant role in its inhibition.
The original contributions presented in the study are included in the article/Supplementary Material, further inquiries can be directed to the corresponding author.
Methodology, PJ; software and validation, QM; formal analysis, QM; writing—original draft preparation, QM; writing—review and editing, PJ and HK; visualization, QM; supervision, PJ and HK. funding acquisition, PJ and HK. All authors have read and agreed to the published version of the manuscript.
This research was funded by the National Key Research and Development Program of China (NO. 2019YFB1600400), National Natural Science Foundation of China (NO. 72174035), LiaoNing Revitalization Talents Program (NO. XLYC2008030), the Cultivation Program for the Excellent Doctoral Dissertation of Dalian Maritime University (NO. 2022YBPY012).
The authors declare that the research was conducted in the absence of any commercial or financial relationships that could be construed as a potential conflict of interest.
All claims expressed in this article are solely those of the authors and do not necessarily represent those of their affiliated organizations, or those of the publisher, the editors and the reviewers. Any product that may be evaluated in this article, or claim that may be made by its manufacturer, is not guaranteed or endorsed by the publisher.
Bai, C. Q., Zhou, L., Xia, M. L., and Feng, C. (2020). Analysis of the spatial association network structure of China's transportation carbon emissions and its driving factors. J. Environ. Manag. 253, 109765. doi:10.1016/j.jenvman.2019.109765
Chen, Y. F., Cheng, S. Y., and Zhu, Z. T. (2021). Measuring environmental-adjusted dynamic energy efficiency of China's transportation sector: A four-stage NDDF-DEA approach. Energy Effic. 14 (3), 35. doi:10.1007/s12053-021-09940-5
Cheng, Y., Lv, K. J., Wang, J., and Xu, H. (2019). Energy efficiency, carbon dioxide emission efficiency, and related abatement costs in regional China: A synthesis of input–output analysis and DEA. Energy Effic. 12 (4), 863–877. doi:10.1007/s12053-018-9695-8
Chu, X., Du, G., Geng, H., and Liu, X. (2021). Can energy quota trading reduce carbon intensity in China? A study using a DEA and decomposition approach. Sustain. Prod. Consum. 28, 1275–1285. doi:10.1016/j.spc.2021.08.008
Cucchiella, F., D’Adamo, I., Gastaldi, M., and Miliacca, M. (2018). Efficiency and allocation of emission allowances and energy consumption over more sustainable European economies. J. Clean. Prod. 182, 805–817. doi:10.1016/j.jclepro.2018.02.079
Cui, Q., and Li, Y. (2015). An empirical study on the influencing factors of transportation carbon efficiency: Evidences from fifteen countries. Appl. Energy 141, 209–217. doi:10.1016/j.apenergy.2014.12.040
Dagum, C. (1998). A new approach to the decomposition of the Gini income inequality ratio. Income Inequal. Poverty, Econ. Welf., 47–63. doi:10.1007/978-3-642-51073-1_4
De Oliveira-De Jesus, P. M. (2019). Effect of generation capacity factors on carbon emission intensity of electricity of Latin America & the Caribbean, a temporal IDA-LMDI analysis. Renew. Sustain. Energy Rev. 101, 516–526. doi:10.1016/j.rser.2018.11.030
Duan, Y., Han, Z. L., Mu, H. L., Yang, J., and Li, Y. H. (2019). Research on the impact of various emission reduction policies on China’s iron and steel industry production and economic level under the carbon trading mechanism. Energies 12 (9), 1624. doi:10.3390/en12091624
Greening, L. A., Ting, M., and Davis, W. B. (1999). Decomposition of aggregate carbon intensity for freight: Trends from 10 OECD countries for the period 1971-1993. Energy Econ. 21 (4), 331–361. doi:10.1016/S0140-9883(99)00010-9
Grubb, M., Sha, F., Spencer, T., Hughes, N., Zhang, Z. X., and Agnolucci, P. (2015). A review of Chinese CO2 emission projections to 2030: The role of economic structure and policy. Clim. Policy 15, 7–39. doi:10.1080/14693062.2015.1101307
Guo, A. D., Yang, J., Sun, W., Xiao, X. M., Xia, J. H., Jin, C., et al. (2020). Impact of urban morphology and landscape characteristics on spatiotemporal heterogeneity of land surface temperature. Sustain. Cities Soc. 63, 102443. doi:10.1016/j.scs.2020.102443
Guo, M. Y., and Meng, J. (2019). Exploring the driving factors of carbon dioxide emission from transport sector in Beijing-Tianjin-Hebei region. J. Clean. Prod. 226, 692–705. doi:10.1016/j.jclepro.2019.04.095
Hampf, B., and Kruger, J. J. (2014). Technical efficiency of automobiles: A non-parametric approach incorporating carbon dioxide emissions. Transp. Res. Part D Transp. Environ. 33, 47–62. doi:10.1016/j.trd.2014.08.020
He, D. Q., Liu, H., He, K. B., Meng, F., Jiang, Y., Wang, M., et al. (2013). Energy use of, and CO2 emissions from China’s urban passenger transport sector-carbon mitigation scenarios upon the transport mode choices. Transp. Res. Part A Policy Pract. 53, 53–67. doi:10.1016/j.tra.2013.06.004
Heinold, A., and Meisel, F. (2018). Emission rates of intermodal rail/road and road-only transportation in europe: A comprehensive simulation study. Transp. Res. Part D Transp. Environ. 65, 421–437. doi:10.1016/j.trd.2018.09.003
Huang, B., Wu, B., and Barry, M. (2010). Geographically and temporally weighted regression for modeling spatio-temporal variation in house prices. Int. J. Geogr. Inf. Sci. 24 (3-4), 383–401. doi:10.1080/13658810802672469
Jiang, M. H., An, H. Z., Gao, X. Y., Jia, N. F., Liu, S. Y., and Zheng, H. L. (2021). Structural decomposition analysis of global carbon emissions: The contributions of domestic and international input changes. J. Environ. Manag. 294, 112942. doi:10.1016/j.jenvman.2021.112942
Jiang, X. H., Ma, J. X., Zhu, H. Z., Guo, X. C., and Huang, Z. G. (2020). Evaluating the carbon emissions efficiency of the logistics industry based on a super-SBM model and the malmquist index from a strong transportation strategy perspective in China. Int. J. Environ. Res. Public Health 17 (22), 8459. doi:10.3390/ijerph17228459
Jin, S. H., Yang, J., Wang, E. X., and Liu, J. (2020). The influence of high-speed rail on ice–snow tourism in northeastern China. Tour. Manag. 78, 104070. doi:10.1016/j.tourman.2019.104070
Jobert, T., Karanfil, F., and Tykhonenko, A. (2012). Convergence of per capita carbon dioxide emissions in the EU: Legend or reality? Energy Econ. 32 (6), 1364–1373. doi:10.1016/j.eneco.2010.03.005
Kimbrough, S., Hanley, T., Hagler, G., Baldauf, R., Snyder, M., and Brantley, H. (2018). Influential factors affecting black carbon trends at four sites of differing distance from a major highway in Las Vegas. Air Qual. Atmos. Health 11 (2), 181–196. doi:10.1007/s11869-017-0519-3
Li, J. W., and Zhang, G. Q. (2016). Estimation of capital stock and capital return rate of China’s transport infrastructure. Contemp. Finance Econ. (06), 3–14. (in Chinese).
Li, X., and Yu, B. Y. (2019). Peaking CO2 emissions for China’s urban passenger transport sector. Energy Policy 133, 110913. doi:10.1016/j.enpol.2019.110913
Lin, B., and Wang, M. (2020). The role of socio-economic factors in China’s CO2 emissions from production activities. Sustain. Prod. Consum. 27, 217–227. doi:10.1016/j.spc.2020.10.029
Liu, J. G., Li, S. J., and Ji, Q. (2021). Regional differences and driving factors analysis of carbon emission intensity from transport sector in China. Energy 224, 120178. doi:10.1016/j.energy.2021.120178
Liu, X., Hang, Y., Wang, Q. W., and Zhou, D. Q. (2020). Drivers of civil aviation carbon emission change: A two-stage efficiency-oriented decomposition approach. Transp. Res. Part D Transp. Environ. 89, 102612. doi:10.1016/j.trd.2020.102612
Lu, Q. Y., Chai, J., Wang, S. Y., Zhang, Z. G., and Sun, X. C. (2020). Potential energy conservation and CO2 emissions reduction related to China’s road transport. J. Clean. Prod. 245, 118892. doi:10.1016/j.jclepro.2019.118892
Ma, Q. F., Jia, P., Sun, C. Z., and Kuang, H. B. (2022). Dynamic evolution trend of comprehensive transportation green efficiency in China: From a spatio-temporal interaction perspective. J. Geogr. Sci. 32 (3), 477–498. doi:10.1007/s11442-022-1957-x
Ma, Q. F., Jia, P., and Kuang, H. B. (2021). Green efficiency changes of comprehensive transport in China: Technological change or technical efficiency change? J. Clean. Prod. 304, 127115. doi:10.1016/j.jclepro.2021.127115
National Bureau of Statistics of the People's Republic of China (2004-2019b). China energy statistics Yearbook. Beijing: China Statistics Publishing House.
National Bureau of Statistics of the People's Republic of China (2004-2019a). China statistics Yearbook. Beijing: China Statistics Publishing House.
Omrani, H., Shafaat, K., and Alizadeh, A. (2019). Integrated data envelopment analysis and cooperative game for evaluating energy efficiency of transportation sector: A case of Iran. Ann. Oper. Res. 274 (1-2), 471–499. doi:10.1007/s10479-018-2803-5
Palander, T., Haavikko, H., Kortelainen, E., and Kärhä, K. (2020). Comparison of energy efficiency indicators of road transportation for modeling environmental sustainability in “green” circular industry. Sustainability 12 (7), 2740. doi:10.3390/su12072740
Park, Y. S., Lim, S. H., Egilmez, G., and Szmerekovsky, J. (2016). Environmental efficiency assessment of U.S. Transport sector: A slack-based data envelopment analysis approach. Transp. Res. Part D Transp. Environ. 61, 152–164. doi:10.1016/j.trd.2016.09.009
Peng, Z. M., Wu, Q. Q., Wang, D. F., and Li, M. (2020). Temporal-spatial pattern and influencing factors of China's province-level transport sector carbon emissions efficiency. Pol. J. Environ. Stud. 29 (1), 233–247. doi:10.15244/pjoes/102372
Raza, S. A., Shah, N., and Sharif, A. (2019). Time frequency relationship between energy consumption, economic growth and environmental degradation in the United States: Evidence from transportation sector. Energy 173, 706–720. doi:10.1016/j.energy.2019.01.077
Requia, W. J., Koutrakis, P., and Roig, H. L. (2015). Spatial distribution of vehicle emission inventories in the Federal District, Brazil. Atmos. Environ. 112, 32–39. doi:10.1016/j.atmosenv.2015.04.029
Rong, P. J., Zhang, Y., Qin, Y. C., Liu, G. J., and Liu, R. Z. (2020). Spatial differentiation of carbon emissions from residential energy consumption: A case study in kaifeng, China. J. Environ. Manag. 271, 110895. doi:10.1016/j.jenvman.2020.110895
Shao, H. Q., and Wang, Z. F. (2021). Spatial network structure of transport carbon emissions efficiency in China and its influencing factors. China Popul. Resour. Environ. 31 (4), 32–41. (in Chinese).
Solaymani, S. (2019). CO2 emissions patterns in 7 top carbon emitter economies: The case of transport sector. Energy 168 (3), 989–1001. doi:10.1016/j.energy.2018.11.145
Sun, C. Z., and Zhu, Y. L. (2020). Discussion on the spatial disequilibrium pattern and causes of regional marine innovation in China based on Dagum Gini coefficient. Econ. Geogr. 40 (01), 103–113. (in Chinese).
Tone, K. (2001). A slacks-based measure of efficiency in data envelopment analysis. Eur. J. Operational Res. 130, 498–509. doi:10.1016/S0377-2217(99)00407-5
Wang, B., Sun, Y. F., Chen, Q. X., and Wang, Z. H. (2018). Determinants analysis of carbon dioxide emissions in passenger and freight transportation sectors in China. Struct. Change Econ. Dyn. 47, 127–132. doi:10.1016/j.strueco.2018.08.003
Wang, L., Fan, J., Wang, J. Y., Zhao, Y. F., Li, Z., and Guo, R. (2020a). Spatio-temporal characteristics of the relationship between carbon emissions and economic growth in China’s transportation industry. Environ. Sci. Pollut. Res. 27 (26), 32962–32979. doi:10.1007/s11356-020-08841-x
Wang, S., Wang, X. L., Lu, F., and Fan, F. (2021). The impact of collaborative innovation on ecological efficiency empirical research based on China s regions. Technol. Anal. Strateg. Manag. 33 (2), 242–256. doi:10.1080/09537325.2020.1812564
Wang, Z., Xu, X., Zhu, Y., and Gan, T. (2020b). Evaluation of carbon emission efficiency in China’s airlines. J. Clean. Prod. 243, 118500. doi:10.1016/j.jclepro.2019.118500
Xia, J. H., Cecilia), , Yang, J., and Liu, J. (2018). Spatio-temporal theories, technologies and applications for transport and urban planning. J. Spatial Sci. 63 (2), 199–201. doi:10.1080/14498596.2018.1502100
Xie, C. P., Bai, M. Q., and Wang, X. L. (2018). Accessing provincial energy efficiencies in China’s transport sector. Energy Policy 123, 525–532. doi:10.1016/j.enpol.2018.09.032
Xu, B., and Lin, B. (2016). Differences in regional emissions in China’s transport sector: Determinants and reduction strategies. Energy 95, 459–470. doi:10.1016/j.energy.2015.12.016
Xu, Y., Fan, J. Q., and Xu, H. C. (2021). Study on the operation efficiency of toll roads in China from the perspective of scale economy. J. Adv. Transp. 2021, 1–15. doi:10.1155/2021/8830521
Yang, F., Choi, Y., and Lee, H. (2021). Life-cycle data envelopment analysis to measure efficiency and cost-effectiveness of environmental regulation in China's transport sector. Ecol. Indic. 126, 107717. doi:10.1016/j.ecolind.2021.107717
Yang, J., Yang, R. X., Chen, M. H., Su, C. H., Zhi, Y., and Xi, J. C. (2021). Effects of rural revitalization on rural tourism. J. Hosp. Tour. Manag. 47, 35–45. doi:10.1016/j.jhtm.2021.02.008
Yu, X., Wu, Z. Y., Zheng, H. R., Li, M. Q., and Tan, T. L. (2020). How urban agglomeration improve the emission efficiency ? A spatial econometric analysis of the Yangtze River Delta urban agglomeration in China. J. Environ. Manag. 260, 110061. doi:10.1016/j.jenvman.2019.110061
Yuan, C. W., Zhang, S., Jiao, P., and Wu, D. Y. (2017). Temporal and spatial variation and influencing factors research on total factor efficiency for transport carbon emissions in China. Resour. Sci. 39 (4), 687–697. (in Chinese). doi:10.18402/resci.2017.04.10
Yuan, R. Q., Tao, X., and Yang, X. L. (2019). CO2 emission of urban passenger transport in China from 2000 to 2014. Adv. Clim. Change Res. 10 (1), 59–67. doi:10.1016/j.accre.2019.03.005
Zandalinas, S. I., Fritschi, F. B., and Mittler, R. (2021). Global warming, climate change, and environmental pollution: Recipe for a multifactorial stress combination disaster. Trends Plant Sci. 26 (6), 588–599. doi:10.1016/j.tplants.2021.02.011
Zhang, J. B., and Chen, Q. L. (2019). Analysis of spatial-temporal evolution and influencing factor in regional integrated transport efficiency differences. J. Guizhou Univ. Sci. 37 (06), 34–42. (in Chinese).
Zhang, N., Zhou, P., and Kung, C. C. (2015). Total-factor carbon emission performance of the Chinese transportation industry: A bootstrapped non-radial malmquist index analysis. Renew. Sustain. Energy Rev. 41, 584–593. doi:10.1016/j.rser.2014.08.076
Zhao, P., Zeng, L., Li, P., Lu, H., Hu, H., Li, C., et al. (2022). China’s transportation sector carbon dioxide emissions efficiency and its influencing factors based on the EBM DEA model with undesirable outputs and spatial Durbin model. Energy 238, 121934. doi:10.1016/j.energy.2021.121934
Zheng, T. L., Wang, Z., Liu, S. H., Bao, X., Ji, M. X., and Mengxue, J. (2021). The development trend and prospect of automobile energy-saving standard system under the goal of peak carbon dioxide emissions. E3S Web Conf. 271 (9), 02006. doi:10.1051/e3sconf/202127102006
Zhou, Y. X., and Hong, X. J. (2018). Measurement and dynamic driving mechanism of Chinese transport total factor carbon emission efficiency. J. Bus. Econ. (5), 62–74. (in Chinese).
Keywords: carbon emissions efficiency, transport industry, spatial imbalance, influencing factor, Dagum gini coefficient, geographically and temporally weighted regression model
Citation: Ma Q, Jia P and Kuang H (2022) Spatial imbalance and factors influencing carbon emission efficiency in China’s transport industry. Front. Earth Sci. 10:986467. doi: 10.3389/feart.2022.986467
Received: 06 July 2022; Accepted: 05 August 2022;
Published: 25 August 2022.
Edited by:
Bing Xue, Chinese Academy of Sciences (CAS), ChinaReviewed by:
Yonglei Jiang, Beijing Jiaotong University, ChinaCopyright © 2022 Ma, Jia and Kuang. This is an open-access article distributed under the terms of the Creative Commons Attribution License (CC BY). The use, distribution or reproduction in other forums is permitted, provided the original author(s) and the copyright owner(s) are credited and that the original publication in this journal is cited, in accordance with accepted academic practice. No use, distribution or reproduction is permitted which does not comply with these terms.
*Correspondence: Peng Jia, amlhcGVuZ0BkbG11LmVkdS5jbg==
Disclaimer: All claims expressed in this article are solely those of the authors and do not necessarily represent those of their affiliated organizations, or those of the publisher, the editors and the reviewers. Any product that may be evaluated in this article or claim that may be made by its manufacturer is not guaranteed or endorsed by the publisher.
Research integrity at Frontiers
Learn more about the work of our research integrity team to safeguard the quality of each article we publish.