
94% of researchers rate our articles as excellent or good
Learn more about the work of our research integrity team to safeguard the quality of each article we publish.
Find out more
ORIGINAL RESEARCH article
Front. Earth Sci. , 25 October 2022
Sec. Marine Geoscience
Volume 10 - 2022 | https://doi.org/10.3389/feart.2022.984355
This article is part of the Research Topic Early Career Scientists' Contributions to Submarine Volcanism and Associated Hydrothermal Systems View all 5 articles
 Victoria Preston1,2,3*
 Genevieve Flaspohler1,3,4Jason Kapit1William Pardis1Sarah Youngs1Donald E. Martocello III3,5,6Nicholas Roy2
 Peter R. Girguis1,7
 Scott D. Wankel5
 Anna P. M. Michel1*
Seafloor hydrothermalism plays a critical role in fundamental interactions between geochemical and biological processes in the deep ocean. A significant number of hydrothermal vents are hypothesized to exist, but many of these remain undiscovered due in part to the difficulty of detecting hydrothermalism using standard sensors on rosettes towed in the water column or robotic platforms performing surveys. Here, we use in situ methane sensors to complement standard sensing technology for hydrothermalism discovery and compare sensors on a towed rosette and an autonomous underwater vehicle (AUV) during a 17 km long transect in the Northern Guaymas Basin in the Gulf of California. This transect spatially intersected with a known hydrothermally active venting site. These data show that methane signalled possible hydrothermal-activity 1.5–3 km laterally (100–150 m vertically) from a known vent. Methane as a signal for hydrothermalism performed similarly to standard turbidity sensors (plume detection 2.2–3.3 km from reference source), and more sensitively and clearly than temperature, salinity, and oxygen instruments which readily respond to physical mixing in background seawater. We additionally introduce change-point detection algorithms—streaming cross-correlation and regime identification—as a means of real-time hydrothermalism discovery and discuss related data supervision technologies that could be used in planning, executing, and monitoring explorative surveys for hydrothermalism.
Detecting and characterizing seafloor hydrothermal vents is critical in understanding the fundamental interactions among the geochemical and biological processes on the seafloor, and the fluxes that these processes cause to and from the deep ocean. Since the first discovery of deep sea hydrothermalism in 1977 (Corliss et al., 1979), hundreds of hydrothermal venting sites have been discovered and analyzed (Beaulieu et al., 2015). These studies reveal that hydrothermal vents play a major role in ocean-scale elemental and micronutrient budgets (e.g., (Resing et al., 2015; Le Bris et al., 2019), serve as nutrient pumps to the deep ocean (e.g., Dick et al., 2013; Bell et al., 2017; Vic et al., 2018; Scholz et al., 2019), and sustain abundant and unique (e.g., chemosynthetic) forms of complex life (Grassle 1987; Georgieva et al., 2021). Hundreds of vent sites are hypothesized to exist and yet remain undiscovered in the deep ocean (Beaulieu et al., 2015), limiting efforts to constrain nutrient and energy budgets of the deep ocean, to assess the magmatic budget hypothesis which estimates the global stock of hydrothermal-activity, and to understand these novel ecosystems.
Exhaustive search of the seafloor is an impractical method for discovering new vents due to the scale of the ocean environment. Instead, adaptive surveying strategies and novel sensing technologies can be combined to detect hydrothermalism far (over 1 km laterally) from the plume source using water column observations. Hydrothermal plumes form due to a density difference between background seawater and (often significantly) heated vent fluids. The resulting buoyant force creates a coherent rising stem from the vent (the buoyant stem) and a spreading cloud (the neutrally-buoyant layer) at an isopycnal, when the cooling, mixing, hydrothermally-derived fluids reach equivalent density to the ambient background (Morton et al., 1956; Speer and Rona 1989). The chemical composition of hydrothermal fluids differs greatly from that of background seawater and the plume-derived fluids near an active vent can be detected using most standard properties (i.e., temperature, salinity, chemical composition, turbidity). However, the spatial expression of the buoyant plume stem is typically no more than a few tens of square meters, making the buoyant stem difficult to localize on a survey. As emitted fluids travel further within the plume, the physically and chemically distinctive nature of the hydrothermal water mass is rapidly diluted as the plume entrains background seawater. Throughout this advective evolution of the plume, reactive (non-conservative) tracers can be consumed or transformed. Thus, despite the neutrally buoyant layer having a spatial scale extending for several square kilometers, detecting these plume fluids requires innovation in sensing and data analysis.
In this paper, we discuss the potential for water column-based hydrothermal plume discovery using standard sensing equipment (e.g., CTD, optode, transmissometer) in concert with two novel in situ methane instruments installed onboard an autonomous underwater vehicle (AUV) and a towed rosette. We present results from a field deployment at the northern Guaymas Basin in the Gulf of California in November 2021 and use these results to inform the planning of informative plume transects and the monitoring of real-time instrument responses. Both towed rosettes and AUVs are well-established tools for hydrothermal plume surveys. Rosettes deployed for hydrothermal plume hunting are typically used in either a vertical transect mode, or cast, performed at regularly spaced spatial waypoints along a ship transect, or a “towed” mode, in which the CTD is lowered and pulled through the water by the ship’s motion (e.g., Chin et al., 1994; Bennett et al., 2013). AUVs, by virtue of being untethered from the ship, have the ability to finely control location within the water volume, and can typically operate closer to the seafloor than a towed rosette. Standard sensors mounted on either a rosette or AUV can detect different forms of hydrothermalism. High turbidity several hundred meters from the seafloor may be indicative of a neutrally-buoyant plume generated by a black smoker, whereas changes in oxidation-reduction potential and clear waters near the seafloor may be indicative of diffuse flow. Analyzing these sensors individually and in combination can distinguish these types of hydrothermalism and elucidate plume structure and characteristics of venting sources on the seafloor.
In 2021, our expedition aboard the R/V Roger Revelle (RR2107) with AUV Sentry and ROV JASON, offered a unique opportunity to examine the emission of hydrothermally-derived fluids, their buoyant rise, as well as the evolution and fate of the neutrally-buoyant plume in the mid-water. Here, we present the results of a targeted lateral transect using chemical sensors mounted on AUV Sentry and a towed rosette, including novel in situ methane instruments demonstrated for the first time in the field here. Figure 1 illustrates the overall design of the transect experiment. We show that methane acts as a reliable indicator of hydrothermal-activity in the northern Guaymas Basin on a spatial scale of 1.5–3 km at 100–150 m altitude. Methane performed similarly to standard turbidity sensors in this trial (detection 2.2–3.3 km), more sensitively than oxidation reduction potential, and more clearly than temperature, salinity, and oxygen instruments which readily responded to physical mixing in background seawater. We additionally examine the relationships between different sensing modalities, and demonstrate how real-time cross correlative or time-series regime identification could be used to assist in survey design for future exploratory missions.
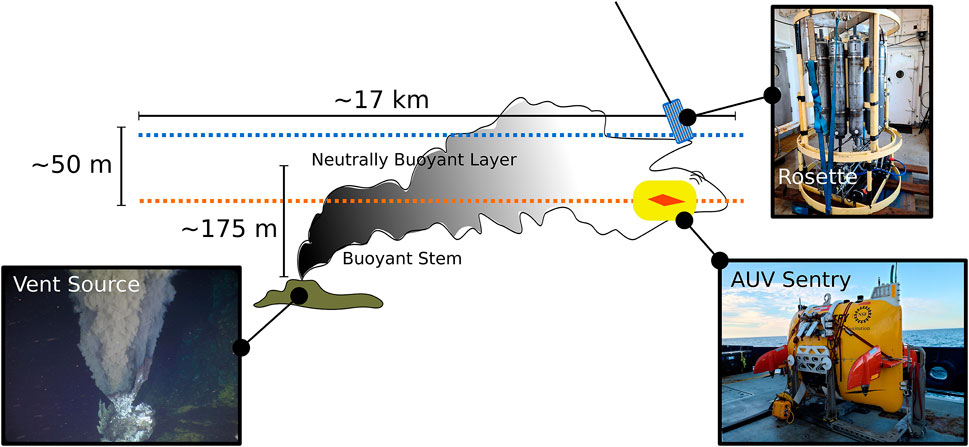
FIGURE 1. Overview of general transect design. Plumes generated by black smoker chimneys at an active hydrothermal ridge in the Northern Guaymas Basin (one example pictured here, taken with an arm mounted MISO camera by ROV JASON during RR2107) rise approximately 175 m in the water column and are advected and turbulently mixed with background seawater. AUV Sentry and a towed CTD rosette, both equipped with turbidity, oxygen, temperature, salinity, and methane probes, fly trajectories that aim to intersect the lower and upper neutrally buoyant plume layer, respectively. A comparison of the observations collected by both platforms is then used to demonstrate the efficacy of various sensors and algorithmic detection schemes.
Located in the central Gulf of California (Mexico), the Guaymas Basin is a mid-ocean ridge extensional spreading center system, with the unique characteristic of being heavily overlain with high amounts of organic-rich sediment. While the primary spreading center axis trends southwest to northeast, the axis of the spreading center in the more well-studied southern end does not extend linearly northeastward, with the northern end of the axis offset to the northwest. The subseafloor eruption and emplacement of lava into the heavy sediment overburden gives rise to a unique set of hydrothermal characteristics. Among these, the geochemical composition of the emergent fluids and volatiles is highly enriched in dissolved organic compounds, carbon dioxide (CO2), hydrogen (H2), ammonium (
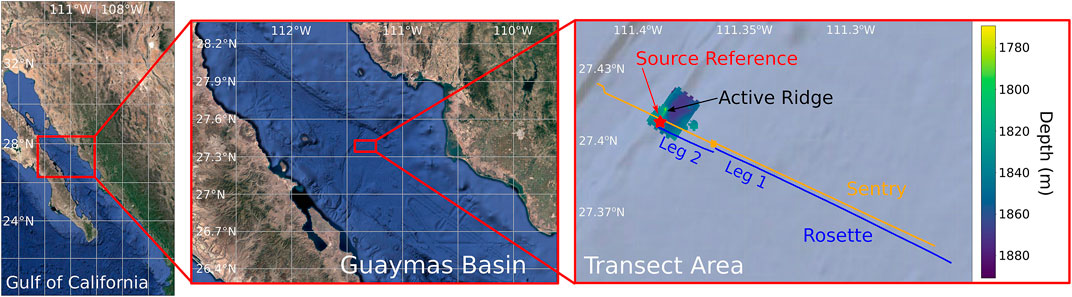
FIGURE 2. AUV Sentry and a towed rosette were used to perform coincident several kilometer long trajectories in the Northern Guaymas Basin. The rosette was redeployed mid-trajectory in order to empty the Niskin bottles onboard; this split the rosette trajectory into Leg 1 and Leg 2. The trajectories intersected a region of known hydrothermal-activity in the northern basin; a bathymetric relief of this region is overlaid on the far right panel. The red star on the bathymetric relief marks the nearest point of identified hydrothermal-activity (black smokers) relative to the trajectories (27.407489 N, 111.389893°W), and is used as a reference point in this work. Imagery is provided by the GoogleTiles API in Cartopy. The bathymetric relief is rendered using data collected by AUV Sentry during research cruise RR2107; the same bathymetric data are rendered in Supplementary Figure S4.
During expedition RR2107, AUV Sentry and a towed rosette were deployed to perform a multi-kilometer transect. Two novel in situ methane instruments were deployed during the transect, one on Sentry, and the other on the towed rosette. Physical water samples collected by the Niskin bottles on the rosette were processed shipboard to measure both methane and ammonium content. To increase the total number of bottle samples that could be collected over the transect, the towed rosette was deployed and recovered twice; we will refer to the rosette transect before the first recovery as “Leg 1” and after re-deployment as “Leg 2.” AUV Sentry was placed in a holding pattern when the rosette was on the ship deck to ensure that spatial measurements between the platforms were temporally comparable.
AUV Sentry executes pre-set trajectories (encoded as a set of waypoints) once underway. During this transect, a starting point at (27.345152 N, 111.253108°W) and ending point at (27.460812 N, 111.527694°W) were given, and a holding pattern was programmed to be executed when the rosette was on the ship deck for sample retrieval after Leg 1. This holding pattern was centered at (27.39592 N, 111.3674°W) and was a lawnmower (back and forth) pattern of approximate dimensions 225 m × 225 m with 15 m resolution. The standard scientific instrumentation deployed on Sentry include an oxygen optode (Aanderaa 4330F), an optical backscatter sensor or OBS (Seapoint Turbidity Meter), an oxidation-reduction potential sensor or ORP (NOAA), a CTD (SeaBird SBE49), and 7,000 m rated pressure sensor (Paroscientific 8B7000-I). The Pythia instrument (described in Section 2.2.3.2) was additionally installed onto Sentry for the transect.
During the transect, the rosette was equipped with an ultra-short baseline (USBL) acoustic transceiver to allow the real-time position of the rosette to be tracked with respect to the ship. Scientific instruments mounted on the rosette included a transmissometer (C-Star), a 6,000 m rated CTD (SeaBird SBE 911plus), twelve 10 L Niskin sampling bottles, and an oxygen optode (Aanderaa). The SAGE instrument (described in Section 2.2.3.1) was also fixed to the rosette for the transect. Default instrumentation on the rosette was communicated via the winch cable to the rosette watchstander station in the computer lab onboard the ship. Ship speed was set to ∼0.5 m s−1 (∼1 knot) to assist in controlling rosette depth and winch tension. Niskin bottles were fired according to a schedule that favored more bottles near the ridge. A scheduled stop approximately 3 km from the ridge was used to collect samples from twelve full Niskin bottles and re-deploy the rosette to take an additional twelve bottle samples from the stop to the end of the transect.
A Los Gatos Research (LGR) Dissolved Gas Extraction Unit (DGEU) and coupled LGR Greenhouse Gas Analyzer (GGA) were used to measure dissolved methane in seawater collected by Niskin sampling bottles fired during the transect. The DGEU uses a membrane contactor for dissolved gas extraction. Extracted gas is then pumped to the GGA which uses off-axis integrated cavity output spectroscopy for making 1 Hz, precise (
Concentrations of ammonium (
Two novel sensors for in situ methane observation were deployed on the rosette and AUV Sentry. The Sensor for Aqueous Gases in the Environment (SAGE) was deployed on the rosette and a real-time cavity ringdown spectrometer called Pythia, was deployed on AUV Sentry (Figure 3). Both instruments were in active development during this cruise, and so we report all measurements from these instruments as normalized observations (this can be interpreted as a sensor “saturation” value) in lieu of calibrated concentrations. For the purposes of the analyses herein, there is no loss of generality in the methods proposed to detect hydrothermalism using these normalized values.
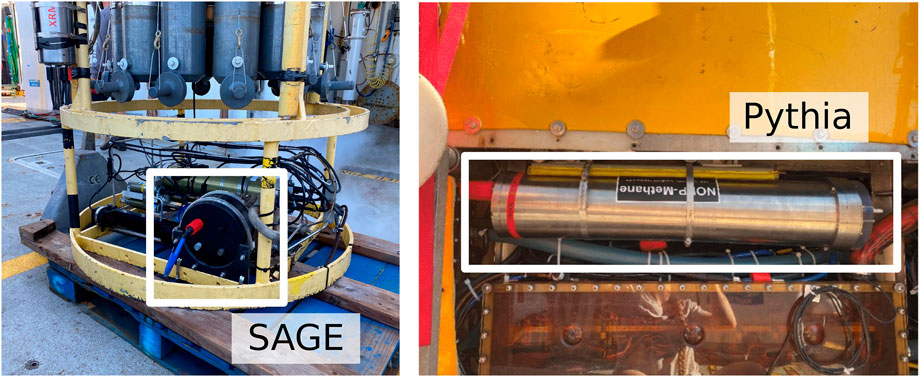
FIGURE 3. The SAGE and Pythia instruments mounted on the rosette and AUV Sentry, respectively.
SAGE is a dissolved gas sensing technology developed at the Woods Hole Oceanographic Institution (WHOI), and this expedition served as the first at-sea validation of the sensor’s operation. SAGE technology has been previously described in Kapit and Michel 2021a,b. Briefly, SAGE is based on infrared absorption spectroscopy performed on extracted gas from seawater via a gas permeable (and water impermeable) membrane. Once the gas enters the sensor, it fills a hollow-core optical fiber (HCF) which also guides light from a laser source tuned to measure the gas species of interest. The amount of target gas present is determined by measuring the amount of light absorption through the HCF using a photodetector. This prototype version of SAGE was configured to measure methane in the range of 0–10,000 ppm. The resolution of the sensor is
Pythia is a novel deep-sea methane sensor developed utilizing real-time cavity ringdown spectroscopy (rt-CRDS) developed by WHOI (Michel et al., 2022) and Ring-IR Inc. (Harb et al., 2012), and capable of operating to 4,000 m depths. Pythia extracts dissolved gas from sea water using a large (113 cm2) surface area membrane. The extracted sample gas enters an optical cell where it is interrogated by a pulsed mid-infrared Quantum cascade laser (QCL). The laser light is absorbed by methane present in the cell, and the concentration of methane is determined by monitoring the pulsed ringdown signal from the cell using a mercury cadmium telluride (MCT) detector. While the response time of the sensor is slow, on the order of 35 min, the sensor is responsive to small (
Observations collected by sensors deployed on AUV Sentry, including Pythia, were merged into a single dataframe using a common 1 Hz time reference; data were linearly interpolated onto this common time reference if they did not share an exact timestamp. With the exception of the derivative of ORP signal, all data for the purposes of visualization is smoothed using a centered rolling average over 5 min intervals. Additionally, temperature, oxygen, and salinity measurements are normalized with respect to depth (as these quantities are anticipated to be functions of depth in the weakly stratified deep waters). Depth correction is performed by fitting a linear function to the average observation collected in 20 m wide depth-bins, and computing the residuals of all data points with respect to this line (see SI Section 4 for plots of the linear functions). Rosette data is treated in the same fashion as Sentry data. Down-cast and up-casts are removed from both Sentry and rosette data streams for all visualizations.
AUV Sentry and the rosette were deployed in the basin approximately 16 km from the northern hydrothermal ridge structure, at (27.348152 N, 111.253108 W) with a course of 295° set to intersect the southern part of the ridge (Figure 2). The Sentry trackline was placed approximately 200–300 m north of the rosette to avoid any risk of entanglement. Sentry was set in altitude hold mode, targeting 120 m from the bottom (this places Sentry at a depth of approximately 1750–1700 m, and at the top of its altitude-hold range). Rosette depth was targeted to be approximately 1,650–1,600 m, controlled primarily by the speed of the ship and length of the winch cable. These depths were designed based on an estimated model of the neutrally buoyant plume layer, as described in Section 2.4.1. Leg 1 of the rosette trajectory was terminated at a planned stop at (27.393855 N, 111.364637°W), and Leg 2 was resumed at (27.460812 N, 111.527694°W); see SI Section 2 for the schedule of bottle samples collected during Leg 2 presented in this manuscript. At the time of the transect, there were no known hydrothermal sites present over the sampling trajectory, save for the northern ridge. Hydrothermal vents in the southern basin were located approximately 40 km further south from the transect starting location (Teske et al., 2016).
The selection of heights for the rosette and AUV Sentry was informed by a simple buoyancy model of expected plume characteristics on the ridge, and known operational constraints of AUV Sentry (i.e., an absolute floor and ceiling of operation above the bottom). Using an adapted plume crossflow model developed by Tohidi and Kaye (2016) (See SI Section 5 for more detailed information) with a nominal current crossflow value of 0.1 m s−1, vent temperature of 340°C, and estimated background seawater stratification as per Speer and Rona 1989, we hypothesized that a neutrally-buoyant layer may form between 1,570 m and 1,750 m. We selected the depths for the rosette (1,600–1,650 m) and AUV Sentry (1,700–1,750 m) given this information in order to target both the upper and lower estimated neutrally buoyant layer (NBL), respectively. We targeted the NBL to increase the likelihood of intersecting plume waters during the transect over a broad, multi-kilometer scope. This is in contrast with targeting the plume buoyant stem, which though significantly easier to distinguish from background seawater, may only have an expression on the order of several square meters.
During the transect, data from the standard rosette sensors were available in near-real time at the watchstander station in the shipboard computer lab. This allowed watchstanders to monitor the depth of the rosette and relay requests to the winch operator on deck, and display the data on live-updating visualizers. AUV Sentry relayed occasional data packets up to 128 bytes in length at a rate of approximately 0.01 Hz. These data packets were subsequently graphed on a computer monitor that was linked to the Sentry network. A total of 600 messages with information about the standard science instruments on Sentry, and 583 messages with information from the Pythia instrument were transferred during the transect.
Elevated methane was observed over a spatial scale of several kilometers, significantly rising as both AUV Sentry and the rosette approached the source of known hydrothermalism on the transect (Figure 4). As both methane instruments used on this cruise were in active development, we report methane observations as normalized values from 0 to 1. We use a normalized value of 0.5 as a conservative threshold for classifying elevated methane measurements. Pythia, mounted on Sentry, reached and exceeded this threshold for elevated methane starting at approximately 3 km from the hydrothermal reference point at (27.407489 N, 111.389893°W); SAGE, flying nearly 50 m higher in the water column, reached this threshold starting 1.5 km away. For a less conservative threshold (0.3), these spatial detection points are reached 6.8 km and 2.2 km away, respectively. SAGE observed a sharp peak of methane just under 1 km from the reference source, with rapid decline of observable methane soon after. In contrast, Pythia reached a methane peak essentially at the 0 km reference point, and shows a gradual decline in methane as Sentry descends into a graben just north of the hydrothermal ridge; the rosette was pulled from the water at the ridge. The difference in spatial detection patterns indicated by these instruments may be a function of both the different sensor modalities/sensitivities, and the natural structure of the neutrally-buoyant layer and the relative position of the two platforms within it.
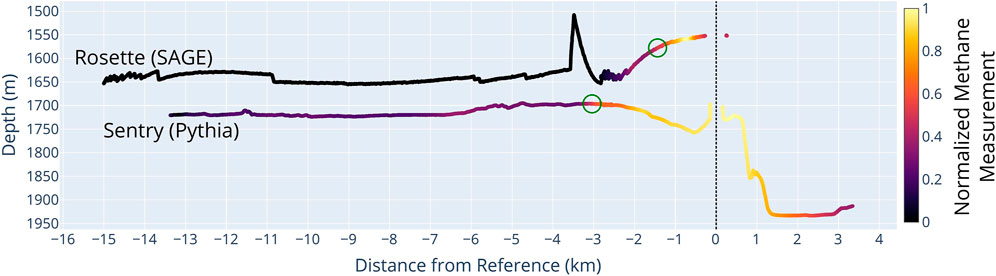
FIGURE 4. Normalized methane values observed with both SAGE (rosette) and Pythia (Sentry) over reference distance from (27.407489 N, 111.389893°W). The transect begins at the left of the plot and proceeds to the right. Strong methane anomalies, defined as points above a conservative threshold of 0.5 normalized values, are present starting 3 km from the reference source as observed by Pythia, and 1.5 km as observed by SAGE (open green circles).
Ammonium is a microbial energy source and reduced compound that is produced by the hydrothermal vents at Guaymas Basin. It is expected that ammonium and methane behavior in the basin will behave similarly, providing a “check” on the methane trends we observe in methane bottle samples, and recorded by SAGE. Focusing primarily on Leg 2 of the rosette transect, we observed a correspondence between methane and ammonium elevation in the approach to the hydrothermal ridge (Figure 5). Methane samples processed directly from Niskin bottles as outlined in Section 2.2.2 show a peak methane concentration of 3,000–4,000 nM (this range is associated with the extremes of calibrated extraction efficiencies valid for the equipment used), approximately 0.75 km from the hydrothermal reference point. Ammonium tracks closely with methane, at 3–4 times smaller concentration, reaching a peak of approximately 1,000 nM.
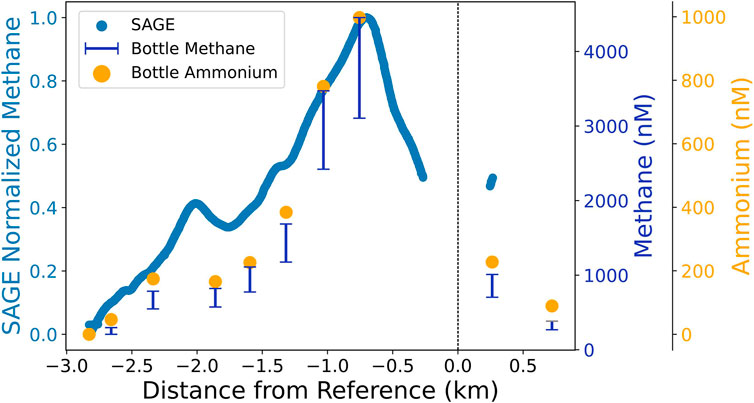
FIGURE 5. Normalized methane measurements by SAGE plotted with methane measurements taken from Niskin bottle samples (as measured by DGEU/GGA equipment) and ammonium measurements. Bottle methane measurements are reported as a range to reflect sensitivity of the measurement procedure to a calibrated extraction efficiency. All measurements trend towards a peak observation of methane and ammonium 0.75 km from the reference source. SAGE additionally observes a secondary peak approximately 2 km from the source, which is essentially missed by the bottle sample schedule.
Normalized methane observations by SAGE generally follow the trends shown by the bottle samples, similarly showing a spatial peak at 0.75 km. However, by its nature, SAGE yields a significantly more resolved signal; a small, secondary peak is observed by SAGE at 2 km from the reference point which is essentially missed by the bottle samples. Additionally, by virtue of operating continuously, there is no need for human interaction (unlike for processing bottle samples, which can require time-intensive ex situ analysis).
Turbidity is a commonly used indicator for detecting hydrothermalism from smoking vents; particulate matter produced by smoking vents can remain suspended in the neutrally buoyant layer, acting as a non-conservative tracer for hydrothermalism (e.g., Feely et al., 1992). In the Guaymas Basin, suspended particulates have been shown to be composed of metals like iron, aluminum, and manganese (Scholz et al., 2019) and are primarily mixed into bottom waters from hydrothermal-activity. We report turbidity measurements as normalized values to make direct comparison between the platforms; in absolute terms, the transmissometer on the rosette reported beam attenuation values between 0 and 0.2 and the OBS on Sentry observed backscatter values between 0.08 and 0.14. The OBS on Sentry encountered an error from the beginning of the dive, potentially caused by a persistent air bubble, until approximately 4.5 km from the ridge reference point; we therefore do not report these early measurements.
We observed elevated turbidity (defined by a conservative threshold of 0.5 in the normalized data) with the transmissometer on the rosette starting approximately 2.2 km from the reference source and 3.3 km with the OBS on Sentry (Figure 6). Even with a less conservative threshold (0.3) these detection points only slightly improve to 2.5 km and 3.4 km respectively. With Sentry, we observe a rapid decline in turbidity within tens of meters west of the source reference (positive distance in Figure 6). This may be indicative of the direction of prevailing crossflow (southeast) in the basin, which would directionally bend a buoyant plume stem and advect the neutrally buoyant layer.
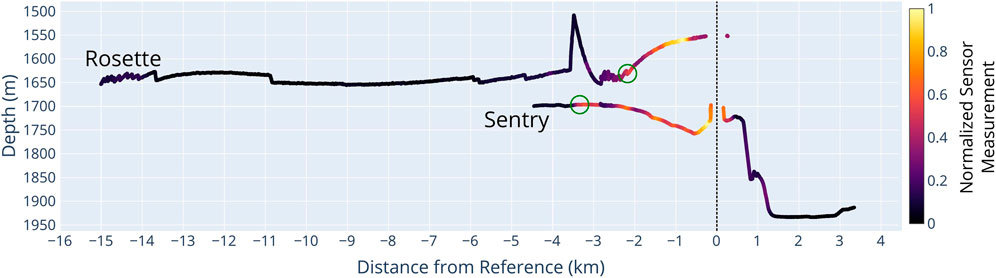
FIGURE 6. Turbidity observed as beam attenuation on the rosette transmissometer and optical backscatter on AUV Sentry instruments. Sentry encountered a sensor error until approximately 4.5 km from the ridge reference point. After this point, elevated turbidity is detectable throughout the dive, with significant elevations within 3.3 km east of the ridge reference point, dissipating within tens of meters to the west. Elevated turbidity is observed by the rosette 2.2 km from the ridge reference point to the east.
AUV Sentry carries an ORP sensor; there was no comparable sensor on the rosette. ORP sensors are commonly used in hydrothermal plume hunting, and can be a strong indicator of recently emitted hydrothermal fluids. The derivative of ORP (noted here as dORP/dt) is particularly used, in which negative dORP/dt values typically indicate transition from background water into hydrothermal fluid. During the transect, only one significant dORP/dt deviation was observed, within 200 m from the ridge reference point (Figure 7).
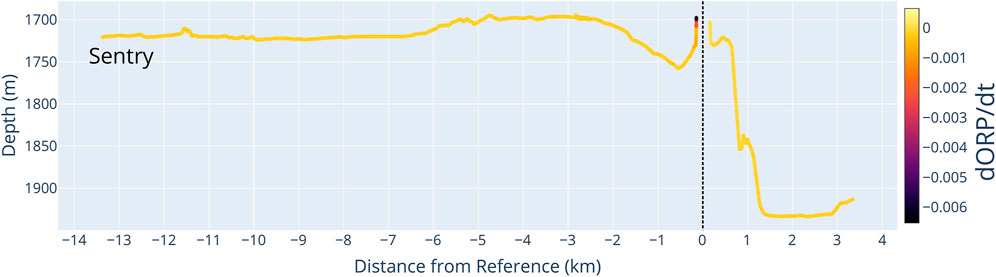
FIGURE 7. The derivative of ORP observed by data collected on AUV Sentry. Negative slopes are indicative of entering hydrothermal fluids. Only one region of the transect demonstrated a significant reaction to ORP, within 200 m of the reference point.
Temperature, salinity, and oxygen are expected to be weakly stratified in deep ocean waters, however fluids from hydrothermalism should register as anomalies when present. The magnitude of valid anomalies (i.e., anomalies that positively identify fluids impacted by hydrothermalism) can be exceedingly small; temperature at a vent can be hundreds of degrees Celsius, but anomalies in the water column on the spatial order of only 10 m can be measured as single degrees, and within a nonbuoyant plume on the order of hundreds of meters from the source, only register a few hundredths of a degree (Yoerger et al., 2007).
We compute temperature, salinity, and oxygen anomalies according to the process described in Section 2.3 and show the results in Figure 8. Salinity anomalies, although apparently coherent, are reported within the empirical sensor noise for the CTD instruments on both the rosette and Sentry. Temperature anomalies on the scale of hundredths of a degree are observed throughout the transect, with two key regions of high temperature anomaly, one located 6–12 km from the reference source, and the other within 3 km of the source. Both the rosette and Sentry observe these regions; with Sentry observing the first anomaly in a narrower margin between 8 and 11 km from the reference source. The first region of positive temperature anomaly closely corresponds with marginally fresher water; whereas the region of higher temperature anomaly near the source is not consistently matched in temperature (the rosette observes more salinity content, whereas Sentry observes neutral or slightly less salinity content). Oxygen is reported as nominal or slightly depleted within the regions of notable temperature and salinity anomaly.
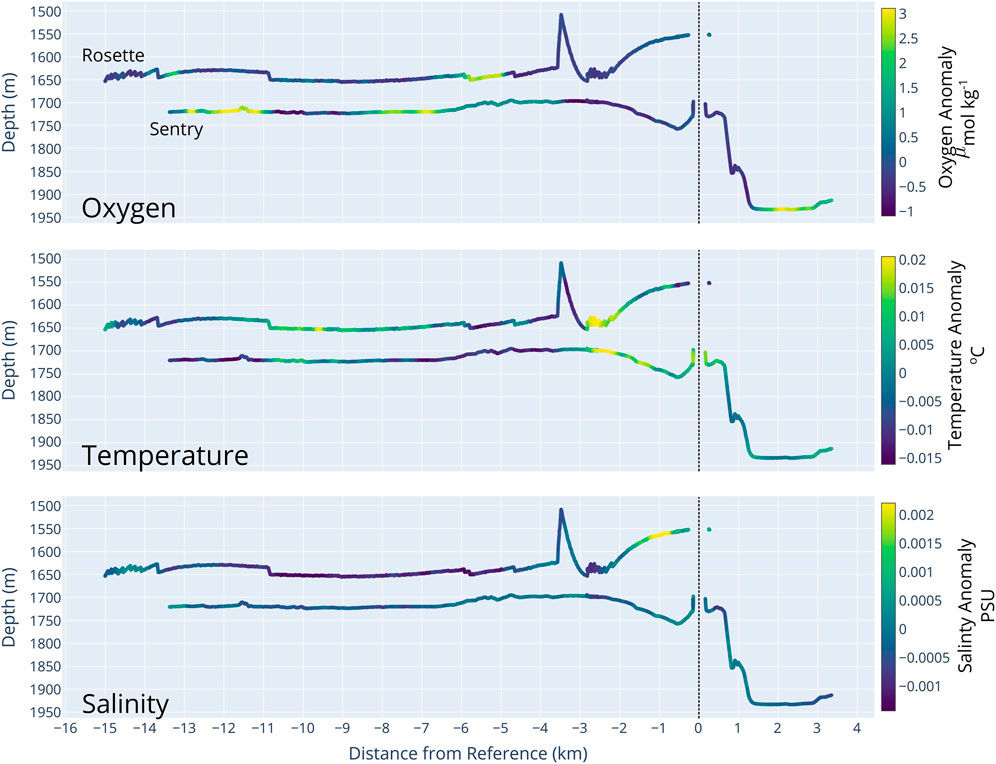
FIGURE 8. Depth-corrected oxygen, temperature, and salinity over reference distance. Two notable regions of high temperature deviation from expected temperature are observed between 6 and 12 km (rosette; 8–11 km by Sentry) and within 3 km of the reference source. The first region of temperature anomaly is closely matched with fresher salinity measurements; whereas salinity is measured as marginally higher near the reference source by the rosette CTD and nominal or lower by the Sentry CTD. In both regions, oxygen is nominal or slightly depleted, with regions of notably elevated oxygen at the boundary of these regions.
The first region of interest, far afield from the plume reference point, appears coherent and has similar detection qualities to the near-reference region; however, given the typical expectation of temperature dissipation from hydrothermal sources, it would be surprising if this first region were connected with hydrothermalism. The shape of the warm, slightly fresher and oxygen depleted intrusion (laterally broad higher in the water column, and appearing to narrow based on the observations taken by the rosette and Sentry approximately 50 m offset in altitude) also does not follow expected patterns in a neutrally buoyant plume layer. Lack of significant methane and turbidity observations in this same region, as presented in Section 3.1 and Section 3.3 respectively, additionally casts doubt on hydrothermalism as a driver for this anomaly. Water mass mixing between the bottom waters, largely sourced from Pacific Deep Waters and the Pacific Intermediate Waters (Bray 1988) may be an alternative explanation, but is out of scope for this paper to investigate.
Successfully detecting hydrothermalism in the deep ocean is a significant challenge, and detection may be most effective using a combination and corroboration of anomalies across multiple sensor inputs (e.g., Jakuba 2007). Here, we examine the cross-correlation between sensors mounted on each of the platforms. Both a global and rolling Pearson correlation coefficient was computed, showing respectively overall correlation trends, and situation dependent correlation.
Figure 9 shows the global correlation among sensors mounted on the rosette individually over Leg 1 and Leg 2, in addition to sensors mounted on Sentry. In the absence of significant geochemical features in a target environment, it is expected that no or only weak correlation will be computed globally, as individual sensor noise (which is independent) will dominate the computation; when geochemical structure is present in the environment, it is expected that weak to strong global correlation will be computed as the environment is imposing a (shared) signal across at least a subset of sensors. This is well illustrated by the cross-correlation matrices for the rosette legs, with global coefficients for Leg 1 reporting no correlation between sensors save for a slightly negative correlation between temperature and oxygen, and for Leg 2 reporting weak to strong correlations between all sensors, with notably strong positive correlation between turbidity and methane. Interestingly, in Leg 2 a negative correlation is reported between temperature and methane, and a positive correlation is measured between methane and oxygen measurements. This runs directly counter to expectations; and also counter with the relationships observed by Sentry which marks relationships between methane and temperature as positively correlated, and between methane and oxygen as negatively correlated.
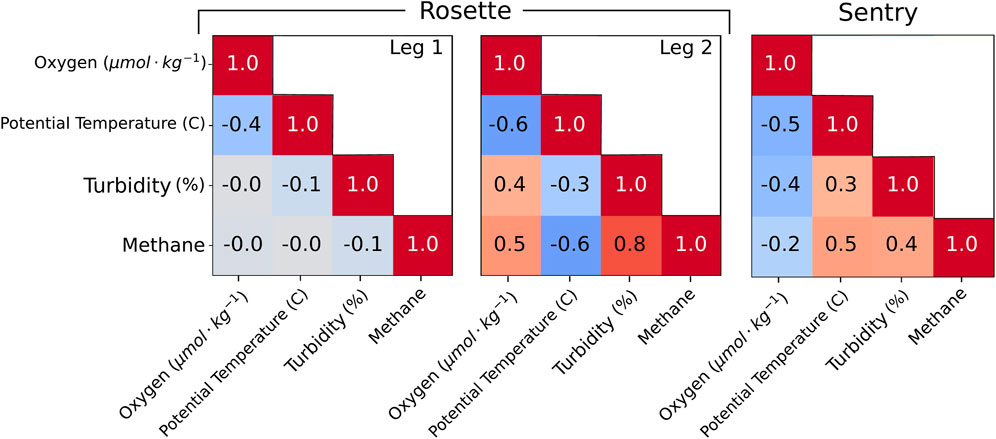
FIGURE 9. Global Pearson correlation coefficient between sensors mounted on the rosette and Sentry. Correlation differences between Leg 1 (far from the reference point) and Leg 2 (near the reference point) are indicative of different sensor correlation behaviors with respect to ambient seawater conditions and hydrothermal fluid interception. Sentry correlation coefficients reflect an expected relationship between temperature and methane (positive), methane and oxygen (negative), and turbidity and methane (positive) that may be stereotypically associated with hydrothermal fluids. In contrast, the Leg 2 rosette correlation factors do not meet this expectation, despite showing strong overall correlative structure.
The difference between correlative behaviors between the rosette legs, and also between the platforms generally, motivates a finer study of correlation. Figure 10 shows a rolling correlation coefficient computed over a window of 30 min for the rosette. Computing local cross-correlations with respect to time, rather than distance, is mathematically more sound, and also aligns directly with how cross-correlative monitoring may be used during live exploration missions. With respect to the rosette, we observe that in Leg 1, nominal correlation is weak or non-existent between most sensors, with exception for oxygen and temperature. We can additionally see that the correlative “micro-structure” of the local window shows regions of possible interest that are greater than nominal—for instance, measurements taken between 03:00 and 05:00 show a coherent region of negative correlation between temperature and turbidity, and positive correlation between temperature and oxygen. Similarly, around 02:00 a region of strong positive correlation between oxygen and temperature is observed. In Leg 2, we see overall more strong, pronounced correlations between sensors, with a distinct period centered in the hour around 10:00 in which correlation between temperature and methane, temperature and turbidity, oxygen and methane, and oxygen and turbidity appear to “flip” compared to the periods of time directly before and after this period, potentially indicating a significant anomalous feature. This time period is well aligned with the spatial proximity of the rosette with the reference source.
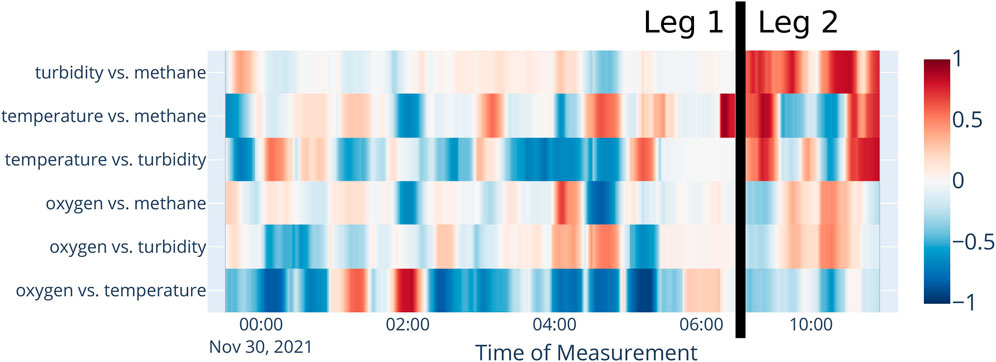
FIGURE 10. Local (rolling) Pearson correlation coefficients between sensors mounted on the rosette over 30 min windows.
Local correlation trends during the Sentry transect are reported in Figure 11, and show an intense relationship between oxygen and temperature throughout the dive, with most regions reporting a strong negative correlation, both with two regions showing positive correlation between 07:00–08:00 and again at 11:00. This strong relationship is also reflected in the relationships of temperature and oxygen with methane, being nearly correlative mirrors with respect to methane. During periods in which the turbidity sensor was operational, a gradual correlative “flip” and intensity increase around the 11:00 sampling time may indicate a structured water mass. This time agrees with the spatial proximity of Sentry with the reference source.
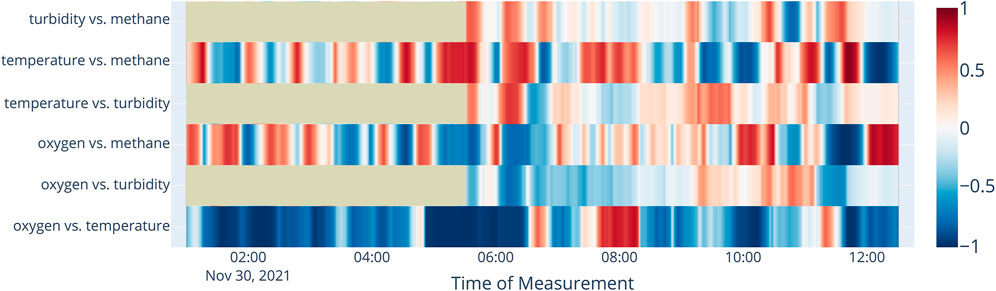
FIGURE 11. Local (rolling) Pearson correlation coefficient between sensors mounted on AUV Sentry over 30 min windows.
Correlation alone is not sufficient evidence for the presence of hydrothermal fluids. For instance, some of the coherent regions of positive or negative correlation with methane any time during Leg 1, or early in the Sentry transect, are misleading, as the overall methane content of the water was exceedingly small or essentially background. Rolling correlations, coupled with absolute thresholds as reported in this results section, may together be useful tools for indicating transition into new water masses, their absolute properties of which could be used to more closely classify the types of water masses. This correlative study also demonstrates that correlations in expectation (e.g., temperature and methane being positively correlated in hydrothermal fluid) may be reductive assumptions of the complexities of plume evolution within a water column, supporting similar findings by, e.g., Cowen et al., 2002. For instance, aging plume waters in the neutrally buoyant layer may long have settled to a temperature indistinguishable from background, but still be particulate and possibly gas rich. This motivates additional study of the “classes” of hydrothermal fluids and their classifying characteristics, which could in turn be used to support studies of microbial evolution and nutrient consumption in plume fluids, or sediment and particulate transport modeling.
As indicated by Section 4.1, changes in correlative structure may be a more useful signal than absolute correlation alone. This notion can be codified as regime changes, which detect inflection points in which a series of observations collected in time may change in typical value, oscillation frequency, or pattern. Here, we compute regime changes using a 30 min detection window using the ruptures Python library and a radial basis function detection kernel, and report regimes using alternating red and blue color blocks in the included figures.
In Figure 12 we show uniquely identified regimes across the entire rosette transect over multiple sensors. We observe that the water-mixing anomaly that occurs early in the transect (Section 3.5) appears to be detected as regime changes in potential temperature, oxygen, and even a correspondence in lowered beam attenuation. Similarly, regime changes in turbidity and methane are early indicators of significant elevation of both of these factors as the rosette intersects with hydrothermal fluids. Interestingly, a regime change in oxygen and temperature is evident immediately following the first small peak in methane and turbidity. These peaks, in addition to these regime changes, may together be indicative of mixing plume sources from other hydrothermal vents located along the ridge (that must travel further than fluids from our reference point) or the mixing of aging plume waters with more recently emitted fluids.
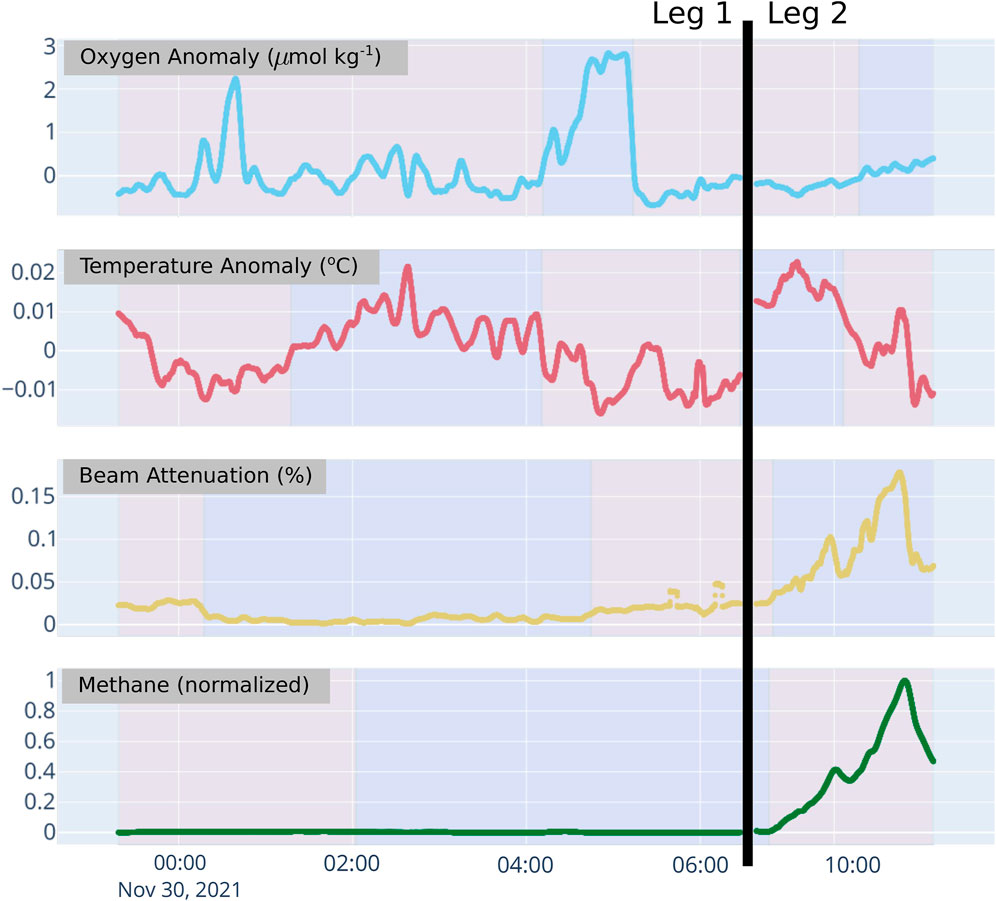
FIGURE 12. Regimes, indicated as alternating blue and red regions, detected during the rosette transect with a 30 min detection window.
With instruments mounted on Sentry, we see clear “steps” of methane observed by Pythia each marked as a regime (Figure 13). Some of these steps are nearly coincident with regime changes in turbidity, temperature, and oxygen (particularly the steps at 06:30 and 09:30).
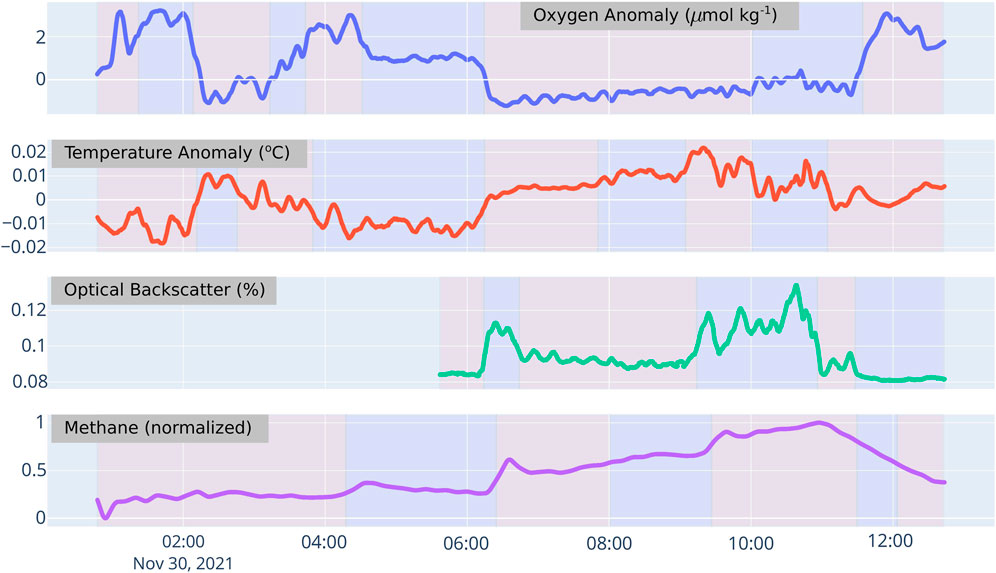
FIGURE 13. Regimes, indicated as alternating blue and red regions, detected during the AUV Sentry transect with a 30 min detection window.
Regimes can be mathematically identified in streaming data, making this a potentially useful method to adopt for real-time hydrothermalism discovery. Coupled with absolute measurements by sensing instruments and rolling correlative structure, identifying water masses across multiple data streams can be done live from streaming data on the ship, or computed/estimated directly onboard an AUV computer and reported back to watchstanders remotely under data-limited transmission protocols (e.g., acoustic pings).
AUV and sensor deployments during expedition RR2107 served as an initial proving ground for the SAGE and Pythia in situ methane instruments for deep sea exploration, and the utility of methane as a potential tracer for hydrothermalism discovery. We showed that, during this transect, both instruments observed significantly elevated methane over a span of several kilometers from a known hydrothermal source in Guaymas Basin. Methane proved to be a strong predictor for hydrothermalism that was not easily confounded by physical oceanographic events (e.g., mixing), giving it an advantage over oxygen, temperature, and salinity. Indeed, in this trial, each of the oxygen, temperature, and salinity instruments were impacted by an unknown physical feature not driven by hydrothermalism, but registered as similar scales of expected anomaly. Methane was also shown to be more expressive than ORP, which only registered a possible anomaly long after significant methane measurements were observed. Turbidity was a similarly useful and expressive feature of hydrothermalism in this basin, with similar detection scales to methane during this transect. Notably, for less strict detection criteria (i.e., thresholds) on detection, methane significantly outperformed turbidity in terms of detection scale (positive identification up to 6.8 km away, in contrast to 3.4 km for turbidity). Turbidity and methane together make for a strong pairing for hydrothermalism discovery. While neither one alone is a “universal” proxy for hydrothermal activity—not all hydrothermalism of interest produces particulate heavy smoke (i.e., diffuse flow fields) nor do all vents produce significantly elevated methane—they are complementary indicators which can assist in deep sea exploration for anomalous water masses derived from hydrothermalism.
Collecting high resolution measurements of methane during this transect highlighted the rich structure of dissolved gasses in a neutrally buoyant plume layer over multiple kilometers, with multiple peak detections being possibly indicative of mixing novel and aging hydrothermal fluids, the contribution of multiple sources of hydrothermalism, or complicated internal mixing causing spatiotemporal multimodal distributions of dissolved gas “pockets” throughout the layer. Bottle samples collected on the cruise verified the presence and general trend of methane observed by the instruments, but failed to resolve several features that may be of scientific interest. This motivates the use of in situ methane sensors for future studies of hydrothermal fluids in the water column.
Enabling the interpretation of real-time sensor data and adapting scientific missions accordingly are critical future skills for scientific expeditions and exploration in the deep sea. In preparation for this transect, we utilized a simple physical model to inform the design of the trajectory and monitored progress with live data displays for both the rosette and AUV Sentry. While real-time data display for rosettes is now considered standard for oceanographic research, streaming capabilities of scientific data from autonomous platforms like Sentry is a relatively new capability. This display infrastructure enabled the science team to make note of the OBS sensor error on Sentry while performing the transect, caught a power and logging failure of the Pythia logger upon deployment (which, if left unresolved, would have meant an absence of all methane data associated with Sentry for this analysis), and allowed real-time control and decision-making about the rosette positioning and bottle firing possible. While data presented here was analyzed after the mission, several of these analyses, including rolling correlation and regime detection, could be performed from streaming observations. As a whole, the techniques in this paper present an opportunity for advancing technical infrastructure on a research vessel in order to enhance decision-making capabilities of the science party and engineering teams, both logistically to better diagnose instrument operation in situ and scientifically to enhance data collection.
Real-time data collection and processing could have further implications for embodied intelligence as a tool for scientific expeditions. Using models, inference methods, and streaming data, autonomous agents like AUV Sentry could be made capable of performing adaptive decision-making for sample collection. Hydrothermalism discovery has long been a motivating use case for intelligent autonomy at sea (e.g., Jakuba 2007; Yoerger et al., 2007; Branch et al., 2020; Wang et al., 2020). This transect experiment demonstrates the utility of simple models for tractable, intelligent planning, motivates the possibility of using methane as an additional, reliable data source for performing autonomous behaviors (e.g., adaptive sampling, tracking), and presents the opportunity to embed simple analytical methods for classifying hydrothermal fluids from sensor streams. Being able to not only estimate and map the source of hydrothermal plumes, but to also chart the evolving nature of fluids in the mid-water, would enable an advancement of scientific inquiries that could be pursued with respect to hydrothermalism in the deep ocean. Such queries include the detailed structure of multiple-source plume collision, directly measuring in situ the 4D structure of mixing in neutrally buoyant plumes and buoyant plume stems, assessing biological activity supported by plume fluids, tracing the fate of dissolved gasses, and more. We have shown that detection of hydrothermal sources is possible on the scale of several kilometers even in this relatively small basin, and have taken some initial steps to demonstrate core data infrastructure that can improve human decision-making in hydrothermalism discovery; future work and engagement will be focused on advancing these tools to enable the next generation of scientific inquiry in the deep ocean.
Ship-based and towed rosette data can be found in the Rolling Deck to Repository (R2R) at https://doi.org/10.7284/909325. AUV Sentry, SAGE, and Pythia data presented in this study are available on the Woods Hole Open Access Server (WHOAS) at https://hdl.handle.net/1912/29403 with DOI 10.26025/1912/29403. Software and data analysis tools are available on Github at https://doi.org/10.5281/zenodo.6789105.
AM served as the chief scientist and JK as lead instrument engineer on RR2107. GF, PG, JK, AM, DM, VP, WP, and SW conceptualized the transect experiment. JK, AM, WP, and SW designed, developed, and deployed the SAGE and Pythia instruments used in this study. JK, VP, WP, and SY performed post-cruise calibrations on SAGE and Pythia. GF, JK, AM, DM, VP, SW, and SY gathered data and performed shipboard analysis presented herein. GF, NR, AM, and VP conceptualized the science model used to design the transect; GF and VP implemented and used the science model for transect design. VP wrote an initial draft of this manuscript; GF, PG, JK, AM, DM, VP, and SW contributed writing and editing to the final draft of the manuscript.
Funding for Cruise RR2107 on the R/V Revelle with AUV Sentry and ROV JASON was supported by NSF OCE OTIC #1842053. Funding for the development of the methane instruments was provided by the Woods Hole Oceanographic Institution under an Innovative Technology Award, NSF OCE OTIC (#1842053), NOAA Ocean Exploration (#NA18OAR0110354), and Schmidt Marine Technology Partners (#G-21-62431). Funding for VP was provided by an NDSEG Fellowship and the Martin Family Society of Fellows for Sustainability. Funding for GF was provided by a Microsoft Research Fellowship and in part by the Department of Energy/National Nuclear Security Administration under Award Number DE-NA000392. DM was supported by in part by the Houghton Fund through the Program in Atmospheres, Oceans and Climate in the Department of Earth, Atmospheric and Planetary Sciences at MIT. PG was supported by supported by NASA under Grant No. NNX17AB31G, issued through the Planetary Science and Technology Through Analog Research program, as well as NSF-OCE (#0838107), and a grant from the Gordon and Betty Moore Foundation (award #9208).
The authors thank Captain D. Murline and the entire crew of the R/V Roger Revelle; the AUV Sentry and ROV JASON teams; Ring-IR Inc. for their engineering role in the development of the Pythia sensor and 4H-Jena (Contros) for their help with deep sea membranes; the AVAST Center in the George and Wendy David Center for Ocean Innovation for providing collaboration space for developing the SAGE and Pythia sensors; H. Delapp at Scripps Institution of Oceanography for her help with cruise planning; the Government of Mexico for enabling us to work in the Guaymas Basin; our Mexican collaborators Ron Spelz-Madero (Universidad Autónoma de Baja California), Raquel Negrete-Aranda (CICESE), Karina Fuentes Bustillos (CICESE), and Florian Neumann (CICESE); D. Fornari for MISO cameras support; S. Traylor’s assistance with calibrating the DGEU instrument used in this study; B. Colson and J. Fisher for their helpful feedback on this study; and the entire science party. Additionally, we acknowledge research permit authorization EG0072071 granted for RR2107 by the General Directorate of Geography and Environment of the National Institute of Statistics and Geography.
The authors declare that the research was conducted in the absence of any commercial or financial relationships that could be construed as a potential conflict of interest.
All claims expressed in this article are solely those of the authors and do not necessarily represent those of their affiliated organizations, or those of the publisher, the editors and the reviewers. Any product that may be evaluated in this article, or claim that may be made by its manufacturer, is not guaranteed or endorsed by the publisher.
The Supplementary Material for this article can be found online at: https://www.frontiersin.org/articles/10.3389/feart.2022.984355/full#supplementary-material
Beaulieu, S. E., Baker, E. T., and German, C. R. (2015). Where are the undiscovered hydrothermal vents on oceanic spreading ridges? Deep Sea Res. Part II Top. Stud. Oceanogr. 121, 202–212. doi:10.1016/j.dsr2.2015.05.001
Bell, J. B., Woulds, C., and Oevelen, D. V. (2017). Hydrothermal activity, functional diversity and chemoautotrophy are major drivers of seafloor carbon cycling. Sci. Rep. 7, 12025. doi:10.1038/s41598-017-12291-w
Bennett, S. A., Coleman, M., Huber, J. A., Reddington, E., Kinsey, J. C., McIntyre, C., et al. (2013). Trophic regions of a hydrothermal plume dispersing away from an ultramafic-hosted vent-system: Von Damm vent-site, Mid-Cayman Rise. Geochem. Geophys. Geosyst. 14, 317–327. doi:10.1002/ggge.20063
Branch, A., McMahon, J., Xu, G., Jakuba, M. V., German, C. R., Chien, S., et al. (2020). “Demonstration of autonomous nested search for local maxima using an unmanned underwater vehicle,” in 2020 IEEE international conference on robotics and automation (ICRA) (IEEE), 1888–1895.
Bray, N. (1988). Water mass formation in the Gulf of California. J. Geophys. Res. 93, 9223–9240. doi:10.1029/jc093ic08p09223
Chin, C. S., Coale, K. H., Elrod, V. A., Johnson, K. S., Massoth, G. J., and Baker, E. T. (1994). In situ observations of dissolved iron and manganese in hydrothermal vent plumes, Juan de Fuca ridge. J. Geophys. Res. 99, 4969–4984. doi:10.1029/93jb02036
Corliss, J. B., Dymond, J., Gordon, L. I., Edmond, J. M., von Herzen, R. P., Ballard, R. D., et al. (1979). Submarine thermal springs on the galapagos rift. Science 203, 1073–1083. doi:10.1126/science.203.4385.1073
Cowen, J. P., Wen, X., and Popp, B. N. (2002). Methane in aging hydrothermal plumes. Geochimica Cosmochimica Acta 66, 3563–3571. doi:10.1016/s0016-7037(02)00975-4
Dick, G. J., Anantharaman, K., Baker, B. J., Li, M., Reed, D. C., and Sheik, C. S. (2013). The microbiology of deep-sea hydrothermal vent plumes: Ecological and biogeographic linkages to seafloor and water column habitats. Front. Microbiol. 4, 124. doi:10.3389/fmicb.2013.00124
Feely, R. A., Massoth, G. J., Baker, E. T., Lebon, G. T., and Geiselman, T. L. (1992). Tracking the dispersal of hydrothermal plumes from the Juan de Fuca Ridge using suspended matter compositions. J. Geophys. Res. 97, 3457–3468. doi:10.1029/91jb03062
Geilert, S., Hensen, C., Schmidt, M., Liebetrau, V., Scholz, F., Doll, M., et al. (2018). On the formation of hydrothermal vents and cold seeps in the Guaymas Basin, Gulf of California. Biogeosciences 15, 5715–5731. doi:10.5194/bg-15-5715-2018
Georgieva, M. N., Little, C. T., Maslennikov, V. V., Glover, A. G., Ayupova, N. R., and Herrington, R. J. (2021). The history of life at hydrothermal vents. Earth-Science Rev. 217, 103602. doi:10.1016/j.earscirev.2021.103602
Grassle, J. F. (1987)., 23. Elsevier, 301–362.The ecology of deep-sea hydrothermal vent communities. Adv. Mar. Biol.
Harb, C. C., Boyson, T. K., Kallapur, A. G., Petersen, I. R., Calzada, M. E., Spence, T. G., et al. (2012). Pulsed Quantum cascade laser-based CRDS substance detection: Real-time detection of TNT. Opt. Express 20, 15489–15502. doi:10.1364/OE.20.015489
Holmes, R. M., Aminot, A., Kérouel, R., Hooker, B. A., and Peterson, B. J. (1999). A simple and precise method for measuring ammonium in marine and freshwater ecosystems. Can. J. Fish. Aquat. Sci. 56, 1801–1808. doi:10.1139/f99-128
Jakuba, M. V. (2007). Stochastic mapping for chemical plume source localization with application to autonomous hydrothermal vent discovery. Cambridge, MA: Ph.D. thesis, Massachusetts Institute of Technology.
Kapit, J., and Michel, A. P. (2021a). Dissolved gas sensing using an anti-resonant hollow core optical fiber. Appl. Opt. 60, 10354–10358. doi:10.1364/ao.439787
Kapit, J., and Michel, A. P. (2021b). “Measurement of dissolved gases using a hollow core optical fiber and capillary membrane inlet,” in Cleo: Applications and technology (Washington, DC: Optical Society of America), AM3Q–3.
Le Bris, N., Yücel, M., Das, A., Sievert, S. M., LokaBharathi, P., and Girguis, P. R. (2019). Hydrothermal energy transfer and organic carbon production at the deep seafloor. Front. Mar. Sci. 5, 531. doi:10.3389/fmars.2018.00531
Lonsdale, P., and Becker, K. (1985). Hydrothermal plumes, hot springs, and conductive heat flow in the Southern Trough of Guaymas Basin. Earth Planet. Sci. Lett. 73, 211–225. doi:10.1016/0012-821x(85)90070-6
Michel, A. P., Kapit, J., Colson, B., Pardis, W., Preston, V., Youngs, S., et al. (2022). “Gas sensing in the deep ocean: Advancing our ability to chemically explore,” in Ocean Science Meeting 2022, virtual, February 24–March 4, 2022.
Michel, A. P., Preston, V. L., Fauria, K. E., and Nicholson, D. P. (2021). Observations of shallow methane bubble emissions from cascadia margin. Front. Earth Sci. (Lausanne). 9, 613234. doi:10.3389/feart.2021.613234
Morton, B., Taylor, G. I., and Turner, J. S. (1956). Turbulent gravitational convection from maintained and instantaneous sources. Proc. R. Soc. Lond. Ser. A. Math. Phys. Sci. 234, 1–23.
Ondréas, H., Scalabrin, C., Fouquet, Y., and Godfroy, A. (2018). Recent high-resolution mapping of Guaymas hydrothermal fields (Southern Trough). Bulletin de la Société Géologique de France 189 (1). doi:10.1051/bsgf/2018005
Resing, J. A., Sedwick, P. N., German, C. R., Jenkins, W. J., Moffett, J. W., Sohst, B. M., et al. (2015). Basin-scale transport of hydrothermal dissolved metals across the South Pacific Ocean. Nature 523, 200–203. doi:10.1038/nature14577
Scholz, F., Schmidt, M., Hensen, C., Eroglu, S., Geilert, S., Gutjahr, M., et al. (2019). Shelf-to-basin iron shuttle in the Guaymas Basin, Gulf of California. Geochimica Cosmochimica Acta 261, 76–92. doi:10.1016/j.gca.2019.07.006
Seewald, J. S., Seyfried, W. E., and Shanks, W. C. (1994). Variations in the chemical and stable isotope composition of carbon and sulfur species during organic-rich sediment alteration: An experimental and theoretical study of hydrothermal activity at Guaymas Basin, Gulf of California. Geochimica Cosmochimica Acta 58, 5065–5082. doi:10.1016/0016-7037(94)90232-1
Soule, S. A., Seewald, J., Wankel, S. D., Michel, A., Beinart, R., Briones, E. E., et al. (2018). Exploration of the northern Guaymas Basin. Oceanography 31, 39–41.
Speer, K. G., and Rona, P. A. (1989). A model of an Atlantic and Pacific hydrothermal plume. J. Geophys. Res. 94, 6213–6220. doi:10.1029/jc094ic05p06213
Taylor, B. W., Keep, C. F., Hall, R. O., Koch, B. J., Tronstad, L. M., Flecker, A. S., et al. (2007). Improving the fluorometric ammonium method: Matrix effects, background fluorescence, and standard additions. J. North Am. Benthol. Soc. 26, 167–177. doi:10.1899/0887-3593(2007)26[167:itfamm]2.0.co;2
Teske, A., De Beer, D., McKay, L. J., Tivey, M. K., Biddle, J. F., Hoer, D., et al. (2016). The Guaymas Basin hiking guide to hydrothermal mounds, chimneys, and microbial mats: Complex seafloor expressions of subsurface hydrothermal circulation. Front. Microbiol. 7, 75. doi:10.3389/fmicb.2016.00075
Tohidi, A., and Kaye, N. B. (2016). Highly buoyant bent-over plumes in a boundary layer. Atmos. Environ. 131, 97–114. doi:10.1016/j.atmosenv.2016.01.046
Vic, C., Gula, J., Roullet, G., and Pradillon, F. (2018). Dispersion of deep-sea hydrothermal vent effluents and larvae by submesoscale and tidal currents. Deep Sea Res. Part I Oceanogr. Res. Pap. 133, 1–18. doi:10.1016/j.dsr.2018.01.001
Von Damm, K., Edmond, J. t., Measures, C., and Grant, B. (1985). Chemistry of submarine hydrothermal solutions at Guaymas Basin, Gulf of California. Geochimica Cosmochimica Acta 49, 2221–2237. doi:10.1016/0016-7037(85)90223-6
Wang, L., Pang, S., and Xu, G. (2020). Global Oceans 2020: Singapore–US Gulf Coast, 1–7.3-dimensional hydrothermal vent localization based on chemical plume tracing(IEEE)
Keywords: methane, in situ instrumentation, hydrothermalism, deep sea exploration, eater mass classification, science-informed models, AUV, decision-making infrastructure
Citation: Preston V, Flaspohler G, Kapit J, Pardis W, Youngs S, Martocello DE, Roy N, Girguis PR, Wankel SD and Michel APM (2022) Discovering hydrothermalism from Afar: In Situ methane instrumentation and change-point detection for decision-making. Front. Earth Sci. 10:984355. doi: 10.3389/feart.2022.984355
Received: 01 July 2022; Accepted: 27 September 2022;
Published: 25 October 2022.
Edited by:
Karen Bemis, Rutgers, The State University of New Jersey, United StatesReviewed by:
Mustafa Yucel, Middle East Technical University, TurkeyCopyright © 2022 Preston, Flaspohler, Kapit, Pardis, Youngs, Martocello, Roy, Girguis, Wankel and Michel. This is an open-access article distributed under the terms of the Creative Commons Attribution License (CC BY). The use, distribution or reproduction in other forums is permitted, provided the original author(s) and the copyright owner(s) are credited and that the original publication in this journal is cited, in accordance with accepted academic practice. No use, distribution or reproduction is permitted which does not comply with these terms.
*Correspondence: Victoria Preston, dnByZXN0b25AbWl0LmVkdQ==; Anna P. M. Michel, YW1pY2hlbEB3aG9pLmVkdQ==
Disclaimer: All claims expressed in this article are solely those of the authors and do not necessarily represent those of their affiliated organizations, or those of the publisher, the editors and the reviewers. Any product that may be evaluated in this article or claim that may be made by its manufacturer is not guaranteed or endorsed by the publisher.
Research integrity at Frontiers
Learn more about the work of our research integrity team to safeguard the quality of each article we publish.