- 1Key Laboratory of Aero Geophysics and Remote Sensing Geology, Ministry of Natural Resources, Beijing, China
- 2China Aero Geophysical Survey and Remote Sensing Center for Natural Resources, Beijing, China
Surface deformation due to hydrocarbon extraction from buried reservoirs may gradually evolve to geological hazards, which can undermine the safety of infrastructure facilities. Monitoring the surface deformation and studying on the influencing factors of surface deformation have great significance to ensure the stability of oilfield development, and prevent geological hazards. In this study, Sentinel-1 interferometric synthetic aperture radar (InSAR) data of Karamay Oilfield acquired between January 2018 to December 2020 was used to map how the land surface has deformed in response to hydrocarbon exploitation. Based on the monitoring results of time series InSAR, geological data, and oilfield data, the correlations between the different factors and the surface deformation were analyzed. The results show that the reservoir buried depth, porosity and permeability have an impact on the surface deformation, and the influence on surface uplift is obviously greater than that on surface subsidence. Surface uplift decreases with the increasing buried depth and the decreasing porosity and permeability, and the correlation between porosity and surface uplift is the best. However, the impact is limited in the area with shallow reservoir depth, high porosity, and high permeability, such as the heavy oil blocks in the study area.
Introduction
Land surface deformation derived from oil and gas extraction has been observed in many productive oilfields and reported for over a century (Pratt and Johnson, 1926; Coplin and Galloway, 1999; Ng et al., 2015; Métois et al., 2020). The changes of reservoir pore pressure through time is the fundamental cause of land surface deformation (Shi et al., 2022). Land surface instability caused by hydrocarbon extraction can substantially damage buildings and infrastructure facilities and even produce geological hazards. Compared with the large-scale deformation caused by earthquake, coal mining and volcanic eruption, the land surface deformation induced by hydrocarbon exploitation is characterized by long duration and small deformation rate. For instance, the distribution of mines and oilfields in Ordos Basin overlaps considerably (Wang et al., 2014), which makes the surface deformation caused by hydrocarbon exploitation easily covered by the influence of mining. Therefore, in order to study the influence of geological factors on surface deformation caused by hydrocarbon exploitation, it is necessary to select suitable areas where other factors have little effect or can be easily removed. Karamay Oilfield in China is an appropriate selection due to the less vegetation cover and the fewer other influencing factors.
The capability in surface deformation monitoring increases rapidly with the advances in remote sensing technology. Interferometric synthetic aperture radar (InSAR) has been routinely used for mapping surface deformation over wide areas with millimeter accuracy (Bürgmann et al., 2000; Staniewicz et al., 2020). Small baseline subset InSAR (SBAS-InSAR) is an effective method to monitor oilfield surface deformation (Aimaiti et al., 2017; Hu et al., 2020). Previous studies have used SBAS-InSAR in Cushing Oilfield in east central Oklahoma, United States, to identify surface deformation with respect to the location of waste water injection wells (Loesch and Sagan, 2018). SBAS-InSAR was also used in Tengiz Oilfield in Kazakhstan to study the primary factors controlling the surface deformation, and the result showed that the hydrocarbon extraction industrial processes and natural subsurface tectonics are probably the controlling factors (Bayramov et al., 2022). In this study, SBAS-InSAR method was chosen to obtain the large-scale surface deformation results.
Previous monitoring results of Karamay Oilfield have provided the distribution and the rate of the surface deformation, and indicated that the surface uplift caused by subsurface fluid injection is related to the increase of reservoir pore pressure (Ji et al., 2016; Aimaiti et al., 2017; Shi et al., 2019; Yang et al., 2019). However, the influencing factors of surface deformation need more discussion. Most previous studies on the formation mechanism of surface deformation are based on the theoretical model of elastic deformation of uniform medium and inversion of reservoir parameters (Xu et al., 2001; Ji et al., 2016; Liu et al., 2016; Yang et al., 2019). In this study, we intend to analyze the influence of crude oil properties, exploitation methods, buried depths, sedimentary facies, and physical properties of the main reservoirs on surface deformation in Karamay Oilfield, which can effectively control the damage caused by surface deformation.
Geological setting
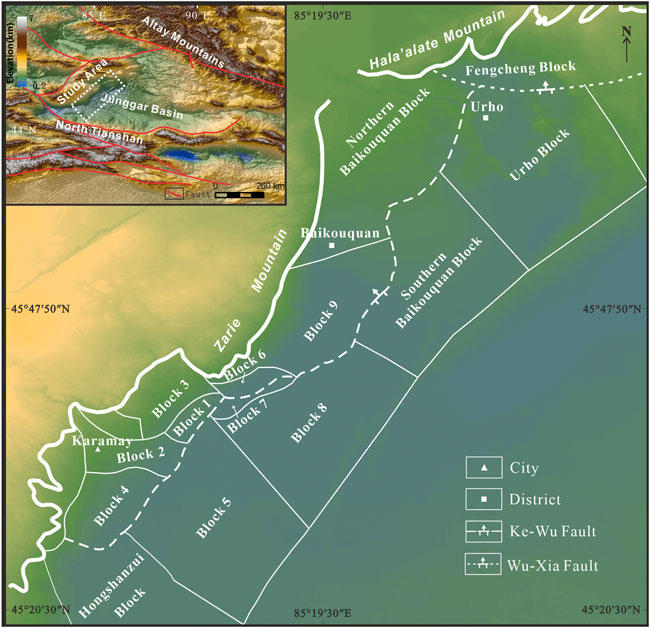
Karamay Oilfield is located in the northwestern of the Junggar Basin, it is the first and largest oilfield discovered in the Western China (Figure 1). Carboniferous, Triassic, Jurassic, and Cretaceous strata are exposed on the land surface. The altitude is high in the northwest and low in the southeast, with an average elevation of 265 m. The study area has a typical temperate continental desert climate and a low vegetation coverage, with an average annual precipitation of 110 mm and an annual evaporation of 2,690 mm (Yang et al., 2019).
Strata and structure
The study area is located in the thrust belt of Zaire Mountain and Hala’alate Mountain, which has experienced intense thrust during Permian, weakened thrust from Triassic to middle Jurassic, and become tectonically stable since Cenozoic (Yin et al., 2016). The giant nappe structure with a length of 250 km and a width of 20∼30 km was buried after middle Jurassic (Zou et al., 2007). The NE-SW trending Ke-Wu thrust fault and Wu-Xia thrust fault constitute the main fault belt in the study area, and high-angle NW-SE trending transverse faults are also developed. The complex fault systems have contributed to hydrocarbon migration and accumulation. According to the oilfield data, the study area has been divided into several blocks by faults, including Block 1∼9, Hongshanzui Block, Northern Baikouquan Block, Southern Baikouquan Block, and Fengcheng Block (Figure 1). The geological factors are similar within the same block and vary from block to block. Affected by the long-term activities of the thrust faults, the buried depths of the contemporaneous strata in the hanging wall and the foot wall are quite different. The Permian, lower Triassic and lower Jurassic strata of the hanging wall were eroded in different degrees, while the strata of the foot wall were completely developed and deeply buried (Table 1).
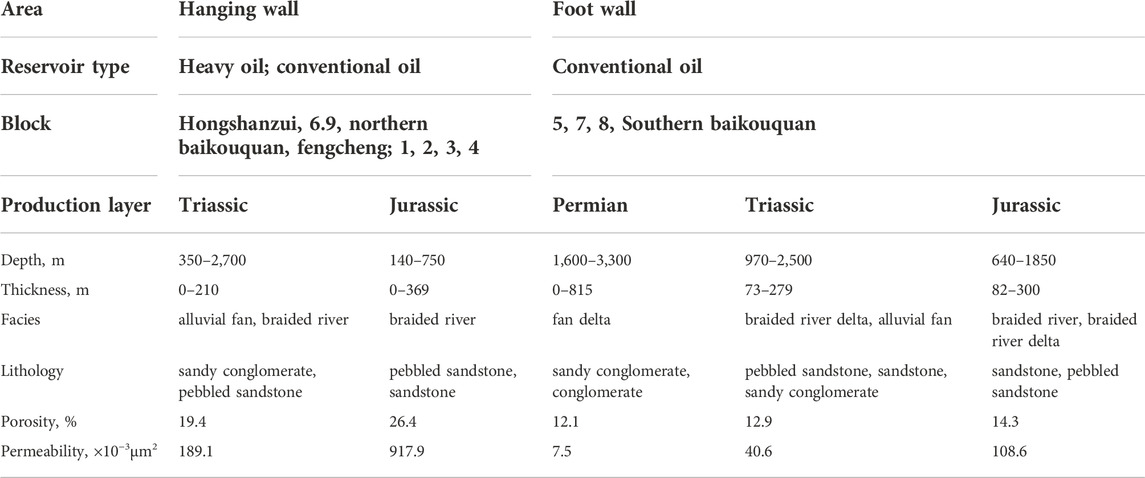
TABLE 1. Reservoir differences between the hanging wall and the foot wall of the thrust fault belt in the study area (revised from Zhu et al., 2010).
Sedimentary characteristics
The sedimentary facies in the study area were also influenced by the thrust fault belt, which acted as a boundary fault controlling the depositional process from Permian to Triassic. In Permian, fan delta reservoirs mainly consist of sandy conglomerate developed in the foot wall along the fault. In Triassic, the alluvial fan bodies gradually decreases, and braided river and braided river delta deposition developed both in the hanging wall and in the foot wall. In Jurassic, braided river and braided river delta were widely developed. Hydrocarbon is mainly accumulated in alluvial conglomerates and sandstones of Permian-Jurassic, and fluvial sandstones of Jurassic. The source rocks are mainly from the lower Permian. Both alluvial fan deposition and braided river deposition lead to strong heterogeneity of reservoir physical properties. Because of the shallow burial depths of the reservoirs in the hanging wall, the reservoir compaction is relatively weak and the primary pores are preserved well. Moreover, it was easy for the acid fluid to enter the strata through the faults and unconformities in the hanging wall, and the dissolution enhanced the reservoir quality. Therefore, the porosity and permeability of the reservoirs in the hanging wall is greater than those in the foot wall (Table 1).
Crude oil types
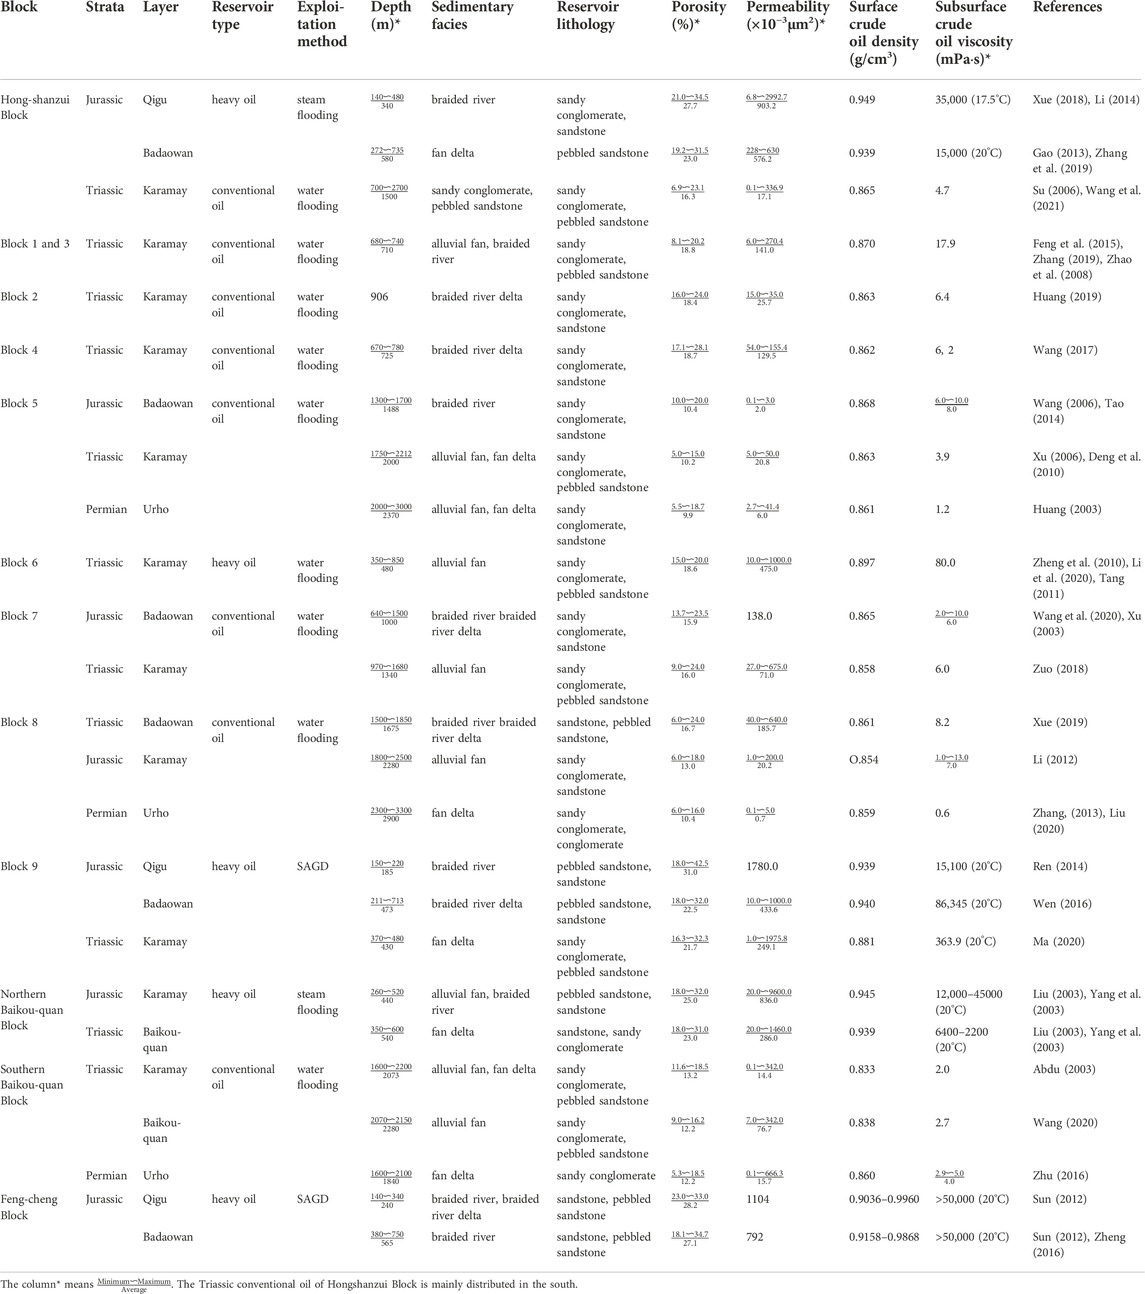
Different oil types have been found in the study area. According to the API Gravity index, crude oil can be divided into four categories, light oil, medium oil, heavy oil, and extra-heavy oil. In this study, we divide the oil into two broad categories, conventional oil means light oil and medium oil, heavy oil and extra-heavy oil are collectively called heavy oil with a viscosity of >50 mPas, or a viscosity of >100 mPas after degassing under oil layer conditions. Conventional oil in the study area is distributed in Block 1∼4 in the hanging wall and all the blocks in the foot wall of the thrust fault belt. Except for conventional oil, the study area is rich in heavy oil resources. Karamay heavy oil is known not only for its high quantity but also for its unique rheological property derived from low asphaltene and sulfur contents (Zhang et al., 2021). Previous studies have shown that heavy oil is generally formed by oxidation of conventional oil during migration and accumulation, and usually distributed in the pinch-out area of the updip strata with good physical properties through the channeling of faults (Wang and Jiang, 1998). At present, the heavy oil under production is mainly distributed in the Triassic and Jurassic strata in Hongshanzui Block, Block 6, Block 9, Northern Baikouquan Block, and Fengcheng Block, which are all in the hanging wall of the thrust fault belt. Jurassic heavy oil reserves account for more than 80% of the total reserves in the study area, such as Badaowan Formation and Qigu Formation. The heavy oil reservoirs are generally at a depth of less than 700 m with high viscosity and relatively low temperatures (Table 2).
Exploitation methods
Different production methods have been applied to the exploitation of different oil types. Thermally enhanced oil recovery techniques have been used in heavy oil recovery, such as steam flooding and steam assisted gravity drainage (SAGD). Steam flooding is usually adopted after steam stimulation in order to enhance heavy oil recovery, which means continuous injection of high dryness steam into the reservoir by the injection well. The injected steam not only continuously heats the reservoir, thus greatly reduces the viscosity of the formation crude oil, but also turns into hot fluid, driving the oil around the producing well and bringing it to the surface. SAGD is injecting steam into the injection well to form a steam chamber at the top of the formations, which can expand upward and laterally, and exchange heat with the oil in the reservoir. Then the heated oil and steam condensate are released by gravity to the horizontal producing well below. SAGD is commonly used to recover the heavy oil with higher viscosity. Water flooding development is usually adopted in conventional oil reservoirs and heavy oil reservoirs with a viscosity of less than 100 mPas under oil layer conditions, such as Block 6. The production methods are mainly determined by the physical properties of the crude oil.
InSAR Data and Prosessing
The C-band Sentinel-1A datasets covering the region of interest were provided by the European Space Agency (ESA). Sentinel-1A launched in April 2014 allows for generating ∼250 km wide across-track images with a slant range resolution of 5 m and an azimuth resolution of 20 m, and operates on a sun-synchronous orbit with a cycle time of 12 days (Geudtner et al., 2014). In this study, 31 single look complex (SLC) datasets from January 2018 to December 2020 were downloaded from the Alaska Satellite Facility (ASF) Distributed Active Archive Centers (DAAC) (Table 3). All of the datasets were collected from the ascending track 114. A digital elevation model (DEM) with 90 m resolution from the Shuttle Radar Topography Mission (SRTM) was used for removing topographic phase from interferograms, which was downloaded from http://www.gscloud.cn/.
Sentinel-1A data processing was carried out using SBAS-InSAR method and the SARscape software. First, the region of interest was cut from the original datasets. Interferometric pairs with both short perpendicular and temporal baselines were selected to construct network of the SBAS interferometric pairs. We chose critical spatial baseline percentage smaller than 2% and temporal baselines smaller than 120 days as the thresholds of the interferograms, and got 71 interferometric pairs (Figure 2). A master image was used as the geometry reference for SLC coregistration to minimize the effect of mis-coregistration caused by geometric, temporal, and Doppler decorrelations. The topographic phase in each interferogram was removed by the SRTM DEM. The interferograms were filtered by the Goldstein method. The minimum cost flow (MCF) algorithm and the unwrapping coherence more than 0.36 was chosen to unwrap the interferograms. 30 ground control points were selected in the region without interference fringes far from the deformation region, since orbital refinement and re-flattening were needed to remove the residual phase.
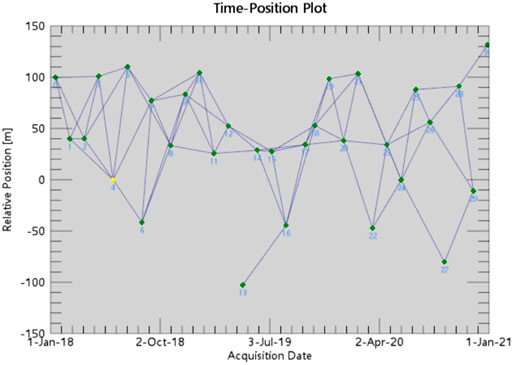
FIGURE 2. Connected network of interferograms. The yellow dot represents the master image. Each green dot denotes one slave image. The line between each two dots represents one interferometric pair.
After unwrapping and re-flattening, time series inversion was carried out in order to obtain the temporal evolution of ground displacement between each acquisition date and the average velocity of each pixel independently. The inversion included two steps, the first step was performed by the linear model for estimating the approximate deformation rate and the topographic phase, the second step aimed to remove the atmospheric phase by both low-pass filtering and high-pass filtering. Assuming that the atmosphere has strong spatial correlation and low temporal correlation, the filtering parameters were set as a low pass size of 1,200 m and a high pass size of 365 days. All the product coherence thresholds were 0.36. Finally, the processing result coordinates were transformed into geographic coordinates.
Results
The annual average deformation rate in the line of sight (LOS) over the Karamay Oilfield was obtained by SBAS-InSAR method. As shown in Figure 3, surface deformation generally exists in the oilfield exploitation area, and the surface uplift and subsidence are distributed in mosaic type. Both surface uplift and surface subsidence are developed in the study area, which is consistent with previous research results (Ji et al., 2016; Aimaiti et al., 2017; Yang et al., 2019). The pore pressure near the injection well increases due to fluid injection, which will lead to surface uplift. The pore pressure near the production well decreases due to underground fluid extraction, which will lead to surface subsidence. The surface uplift is more developed in the hanging wall than that in the foot wall of the thrust fault belt. The surface subsidence area is mainly distributed in the middle of the study area, that is, Block 8 and part of Block 9, and Block 5.
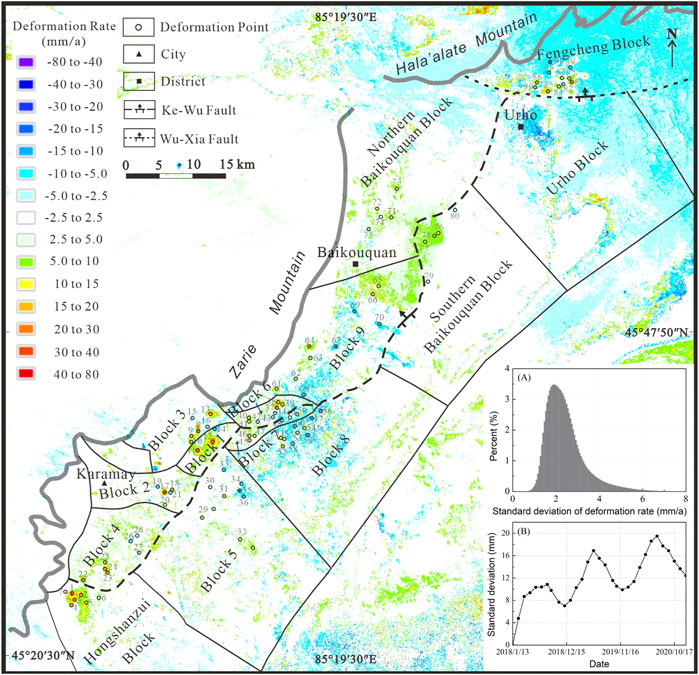
FIGURE 3. Deformation rate map in the line of sight (LOS) direction obtained by SBAS-InSAR processing from January 2018 to December 2020, in which (A) illustrates the precision of the deformation rate calculated by SARscape software, (B) shows the standard deviation of the surface deformation on each SAR acquisition date.
The average surface deformation rate caused by oil exploitation in the study area is mainly distributed in the range of -20∼30 mm/a from January 2018 to December 2020. The maximum average uplift rate is 58.3 mm/a located in the Hongshanzui Block and the maximum average subsidence rate is −36.6 mm/a located in the Block 5 (Figure 3). The mean standard deviation of average deformation rates in the study area is 2.46 mm/a calculated by SARscape software (Figure 3A). As shown in Figure 3B, the standard deviation of the cumulative surface deformation on each acquisition date increases with time and fluctuates on a yearly basis, which may be related to seasons and the periodicity of production activities. Previous research result of Hongshanzui Block and Block 1∼8 from March 2017 to August 2018 showed that four obvious surface uplift zones were developed, the maximum rate of surface subsidence in the line of sight was about −32 mm/a, and the maximum rate of surface uplift was about 100 mm/a (Yang et al., 2019). The locations of the obvious surface uplift zones in the previous result are consistent with this study, and the average deformation rate are also in the similar range.
According to the remote sensing image of the study area provided by Tianditu and the deformation rate map (Figure 3), we selected 91 representative deformation points in different blocks for further analysis. These points are located in the centers of the main surface deformation areas where hydrocarbon exploitation occurs. As shown in Figure 4, the surface deformation distribution and rate vary in different blocks. A large area of surface uplift is developed in the Hongshanzui Block with the cumulative uplift in the range of 60∼140 mm, while the surface subsidence is weakly developed. Both uplift and subsidence are developed in Block 1 and Block 3, where the uplift area and the cumulative uplift are obviously larger than the subsidence area and the cumulative subsidence. Surface uplift is more developed than subsidence in Block 2 and Block 4. The largest cumulative uplift reaches up to 118 mm and the subsidence ranges from −24 mm to −78 mm in Block 2. The cumulative uplift ranges from 69 mm to 105 mm and subsidence ranges from −33 mm to -46 mm in Block 4. The uplift area in Block 5 is larger than the subsidence area, but the cumulative uplift is small, generally less than 40 mm. The subsidence area is mainly developed in the northeast of Block 5, but the cumulative subsidence is generally larger than the cumulative uplift, up to −100 mm. Surface uplift and subsidence are developed simultaneously in Block 6, and the cumulative uplift is obviously greater than the cumulative subsidence. Both area and cumulative deformation of uplift and subsidence are similar in Block 7. A large area of surface subsidence is developed in Block 8, and the cumulative uplift is basically equal to the cumulative subsidence. Surface uplift and subsidence are developed simultaneously in Block 9. Obvious uplift is developed in some regions of Block 9, and the cumulative uplift is greater than the cumulative subsidence. Small-scale uplift is dominant in Baikouquan area. The cumulative uplift is larger than the cumulative subsidence in Northern Baikouquan Block, and the cumulative uplift is similar to the cumulative subsidence in Southern Baikouquan Block. In the Fengcheng Block, the surface uplift and subsidence develop in mosaic type, the cumulative uplift is greater than the cumulative subsidence, and the cumulative deformation changes with mining activities, with obvious waveform characteristics.
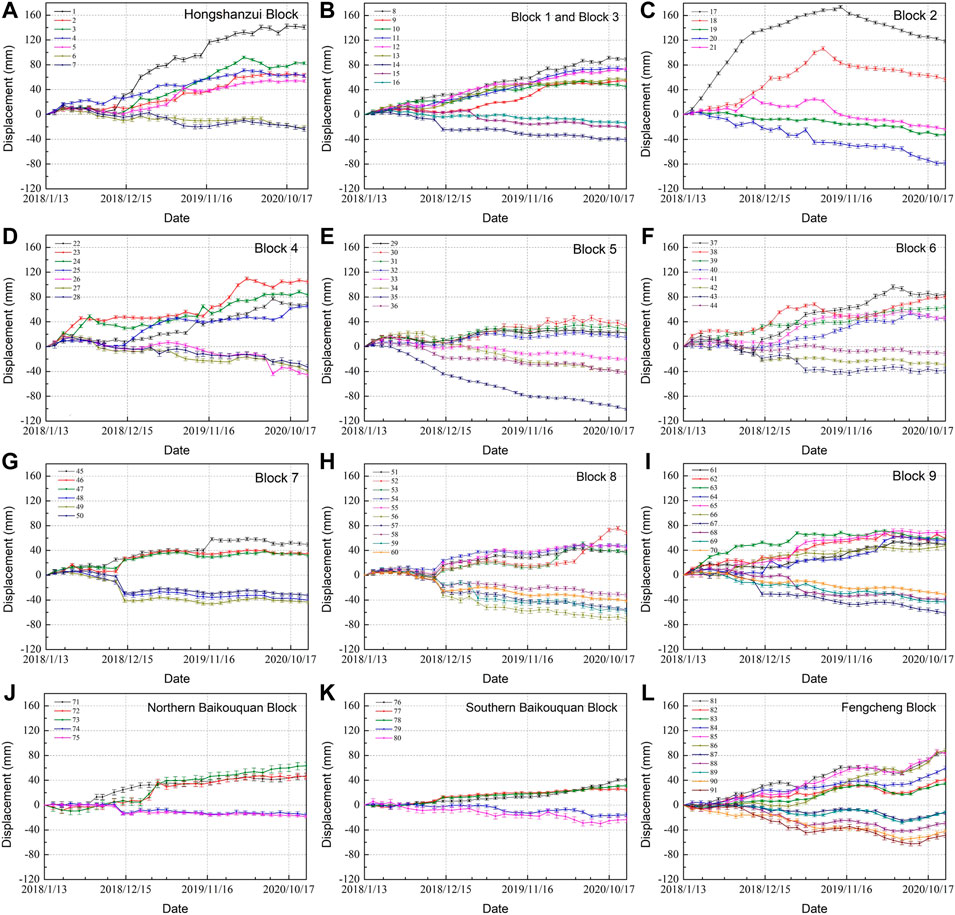
FIGURE 4. Time series deformation curves of the 91 deformation points in different blocks from January 2018 to December 2020. The positions of the 91 deformation points are shown in Figure 3. Each deformation curve is plotted with error bars, representing the mean standard deviation of average deformation rate.
Discussion
The surface deformation caused by hydrocarbon exploitation is affected by both geological factors and production parameters. Geological factors have a macroscopic impact on surface deformation, while production parameters, for instance, fluid injection volume and injection rate, usually affect a much smaller area, such as well groups. Even though the geological factors are the same, surface deformation of different well groups may vary greatly due to the different production parameters. When it comes to a much larger area, such as oilfield blocks, the surface deformation range can reveal the impact of the geological factors.
Geological factors classification
In order to study the influence of geological factors on surface deformation, geological data and oilfield data of different blocks were collected, including the main productive layers, reservoir types, crude oil properties, exploitation methods, buried depths, sedimentary facies, lithology, and physical properties of the reservoirs (Table 2). Some of these geological factors have relationships. Exploitation method is determined by crude oil properties. Porosity and permeability of the reservoirs are mainly controlled by reservoir buried depth, and also related to sedimentary facies and diagenesis. Although heavy oil is generally distributed at a depth of less than 700 m, the formation of heavy oil is determined by oxidation conditions. Sedimentary facies have an important impact on lithology. Therefore, based on the geological genetic relationships, the geological factors were classified into three groups, the factors related to crude oil properties (exploitation method), the factors related to reservoir buried depth (reservoir porosity and permeability), and the factors related to sedimentary facies (lithology).
The influence of one factor group can be separated if the other factor groups are basically the same. According to the crude oil properties and the buried depth of the reservoirs, we divided the 91 deformation points into three categories: the points of the heavy oil blocks in the hanging wall, the points of conventional oil blocks in the hanging wall, and the points of conventional oil blocks in the footwall, which are shown in different colors for further analysis (Figure 5). The points with same color have similar crude oil properties and the reservoir buried depth. The red points and pink points are similar in buried depth, but different in crude oil properties. The pink points and blue points are similar in crude oil properties, but different in buried depth.
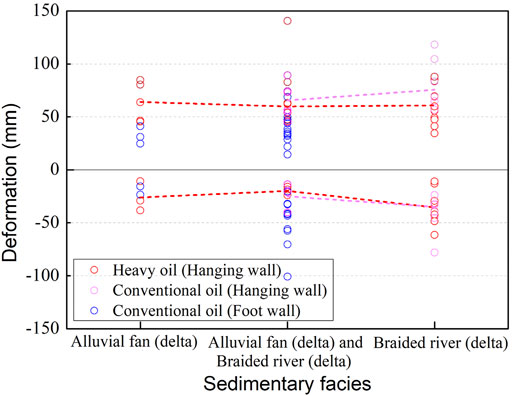
FIGURE 5. Relationship between the sedimentary facies and surface deformation. The red points represent the heavy oil, distributed only in the hanging wall of the thrust fault belt. The pink points and the blue points represent the conventional oil, distributed in both hanging wall and foot wall.
Sedimentary facies and lithology
As shown in Table 2, since the lithology in different blocks is basically the same due to multiple production layers, the influence of lithology on surface deformation is negligible. In order to study the influence of sedimentary facies on surface deformation, we divide the blocks into three categories, the blocks with alluvial fan facies or fan delta facies, the blocks with braided river facies or braided river delta facies, and the blocks with both of the two kinds of facies mentioned above. The relationship between the sedimentary facies and surface deformation is shown in Figure 5. The influence of different sedimentary facies on the surface deformation can be identified, when other factors are basically the same. The points with same color have similar crude oil properties and reservoir buried depth. Since most of the points in conventional oil blocks in the footwall (blue points) are developed both alluvial fan and braided river deposits, the influence of different sedimentary facies on the surface deformation can be only identified by the red points and pink points. The average surface deformation of the points with same color in different sedimentary facies was calculated and connected with dotted lines. As shown in Figure 5, except for a few points, the main surface deformation range of the same color points and the average values in different sedimentary facies are similar, indicating that sedimentary facies have little impact on surface deformation.
crude oil properties and exploitation methods
The viscosity and density of crude oil have a good positive correlation. Figures 6A,B illustrate the relationships between the viscosity and density of the crude oil and the surface deformation. The average crude oil viscosity of each block is calculated by the average crude oil viscosity of the different production layers. Comparing the deformation range of the red points and the pink points, which have similar buried depth and different crude oil properties, the result shows that the surface deformation ranges of the red points and pink points are similar, indicating the physical properties of crude oil have little impact on surface deformation. Comparing the deformation range of the pink points and the blue points, which have similar crude oil properties and different buried depth, the result shows that the deformation ranges of the pink points and blue points are different. As shown in Figure 6A, when the crude oil viscosity is about 6 mPas, the surface uplift of the pink points is generally greater than that of the blue points, indicating the surface uplift is affected by different buried depth.
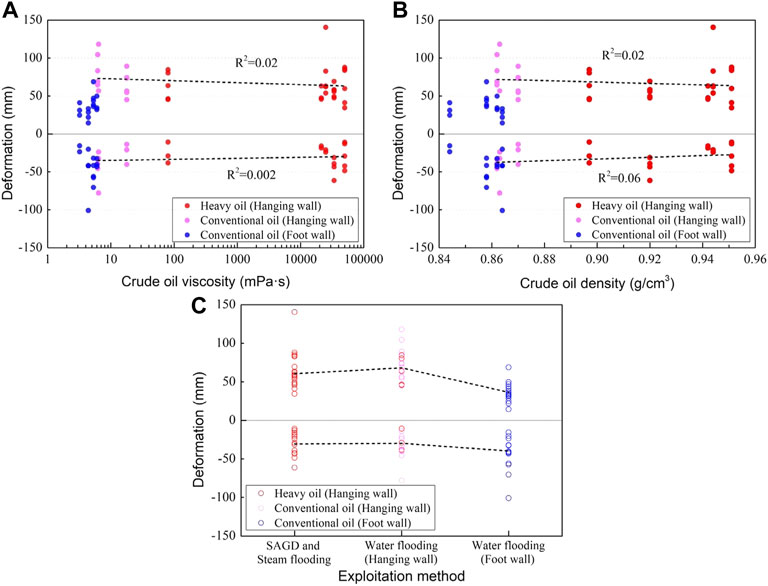
FIGURE 6. Relationships between crude oil properties as well as exploitation methods and surface deformation. The red points represent the heavy oil, distributed only in the hanging wall of the thrust fault belt. The pink points and the blue points represent the conventional oil, distributed in both hanging wall and foot wall.
The relationship between the exploitation methods and the surface deformation is shown in Figure 6C. The average surface deformation of different exploitation methods was calculated and connected with dotted lines. Thermal exploitation method including SAGD and steam flooding is only applicable to the heavy oil reservoirs in the hanging wall. The reservoir buried depths of the surface deformation points in the hanging wall are relatively close. By comparing the surface deformation caused by thermal exploitation and water flooding in the hanging wall, it can be seen that the surface deformation range and average value are basically equal. The reservoir buried depth of the hanging wall and footwall is quite different. By comparing the surface deformation caused by water flooding in the hanging wall and footwall, it can be seen that the surface uplift caused by water flooding of the hanging wall is greater than that caused by water flooding of the footwall. Therefore, the exploitation methods also have little impact on surface deformation, but the reservoir buried depth accounts for the surface deformation, especially the surface uplift.
Buried depth, porosity and permeability
The buried depths of the reservoirs in the hanging wall and in the foot wall vary greatly due to the NE-SW trending thrust fault belt, and the buried depths of the contemporaneous reservoirs in the foot wall can reach up to 1,000 m deeper than those in the hanging wall (Table 2). Since Figure 6 have shown that the buried depth affects the surface deformation, and porosity and permeability have close relationship with buried depth, it can be inferred that the porosity and permeability also have an impact on surface deformation. The influence of the burial depth and the reservoir physical properties on surface deformation can be revealed by all of the points without classification in Figure 7, because Figure 6 has indicated that the crude oil properties have little impact on surface deformation. As shown in Figure 7, when the buried depth is less than 700 m, the porosity is more than 18%, and the permeability is more than 150 ×10−3μm2, the surface deformation has little change with buried depth and reservoir physical properties. When the depth is greater than 700 m, the porosity is less than 18%, and the permeability is less than 150 ×10−3μm2, the buried depth and reservoir physical properties have an impact on surface uplift, but have little influence on surface subsidence. The surface uplift decreases with the increasing depth and the decreasing porosity and permeability, and the correlation between reservoir porosity and surface uplift is the best.
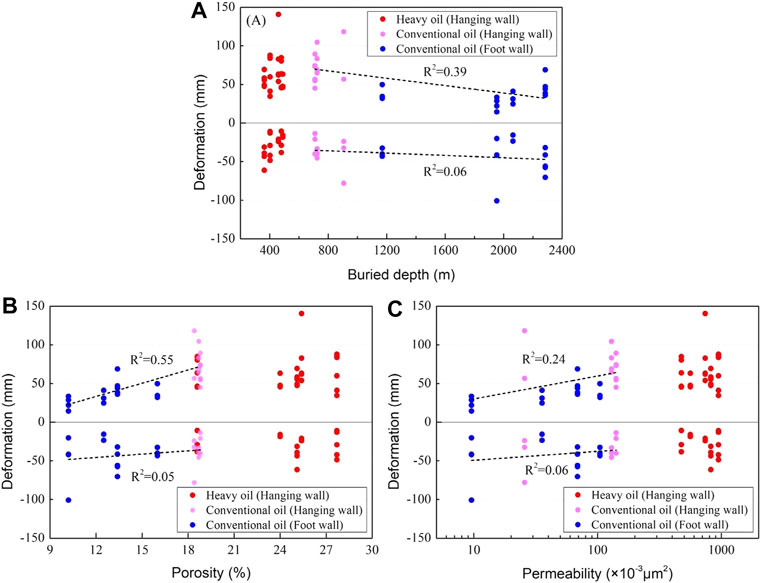
FIGURE 7. Relationship between the buried depth as well as the physical properties of the reservoirs and surface deformation.
Figure 7 also illustrates that the buried depth more than 700 m, the porosity less than 18%, and the permeability less than 150×10−3μm2, corresponds to the conventional oil blocks, and the area with the buried depth less than 700 m, the porosity more than 18%, and the permeability more than 150 ×10−3μm2, mainly corresponds to the heavy oil blocks. According to the previous analysis, all of the geological factors have little influence on the surface deformation of the heavy oil blocks, and the reservoir buried depth, porosity, and permeability have an impact on the surface deformation of the conventional oil blocks.
Conclusion
Surface deformation is widely developed in hydrocarbon exploitation areas, and the average surface deformation rate is mainly distributed in the range of -20–30 mm/a from January 2018 to December 2020. The maximum average uplift rate is 58.3 mm/a, and the maximum average subsidence rate is -36.6 mm/a.
Geological factors affect the surface deformation in a macroscopic scale. Tectonic movements led to the formation of the faults as well as the heavy oil reservoirs and the conventional oil reservoirs in the study area. The NE-SW trending thrust fault belt results directly in different buried depths of reservoirs, sedimentary facies, and reservoir physical properties between the hanging wall and the footwall. Among these geological factors, reservoir buried depth, porosity and permeability have an impact on the surface deformation. However, the impact is limited in the heavy oil blocks, because of the shallow buried depth as well as the high porosity and high permeability. In the conventional oil blocks, surface uplift decreases with the increasing buried depth and the decreasing porosity and permeability, and the correlation between porosity and surface uplift is the best. Compared with surface uplift, surface subsidence has little correlation with geological factors.
Data availability statement
Publicly available datasets were analyzed in this study. This data can be found here: https://search.asf.alaska.edu, http://www.gscloud.cn/.
Author contributions
Technical route designed by LX, YY, and JY, data collection by LX, and XJ, data processing, analysis, and interpretation by LX and YY, manuscript drafted by LX.
Funding
This study is funded by Key Laboratory of Aero Geophysics and Remote Sensing Geology, Ministry of Natural Resources, China (2020YFL019).
Acknowledgments
We would like to thank Qian Li for his helpful suggestions on the manuscript.
Conflict of interest
The authors declare that the research was conducted in the absence of any commercial or financial relationships that could be construed as a potential conflict of interest.
Publisher’s note
All claims expressed in this article are solely those of the authors and do not necessarily represent those of their affiliated organizations, or those of the publisher, the editors and the reviewers. Any product that may be evaluated in this article, or claim that may be made by its manufacturer, is not guaranteed or endorsed by the publisher.
References
Abdu, R. Y. (2003). Reservoir description and rolling development of kexia formation in block Bai21 (in Chinese). Chengdu: Southwest Petroleum Institute.
Aimaiti, Y., Yamazaki, F., Liu, W., and Kasimu, A. (2017). Monitoring of land-surface deformation in the Karamay oilfield, xinjiang, China, using SAR interferometry. Appl. Sci. 7, 772. doi:10.3390/app7080772
Bayramov, E., Buchroithner, M., Kada, M., Duisenbiyev, A., Zhuniskenov, Y., Berardino, P., et al. (2022). Multi-temporal SAR interferometry for vertical displacement monitoring from Space of Tengiz oil reservoir using SENTINEL-1 and COSMO-SKYMED satellite MissionsA new algorithm for surface deformation monitoring based on small baseline differential SAR interferograms. Front. Environ. Sci.IEEE Trans. Geosci. Remote Sens. 1040 (11), 7833512375–7833512383. doi:10.1109/TGRS.2002.803792
Bürgmann, R., Rosen, P. A., and Fielding, E. J. (2000). Synthetic aperture radar interferometry to measure earth's surface Topography and its deformation. Annu. Rev. Earth Planet. Sci. 28 (1), 169–209. doi:10.1146/annurev.earth.28.1.169
Coplin, L. S., and Galloway, D. (1999). Houston-galveston, Texas, land subsidence in the United States, US geological Survey circular. U. S. Geol. Surv. Circ. 1182, 35–48.
Deng, Q., Hou, J. G., and Tang, X. (2010). Analysis on geological factors influencing early productivity of low permeability conglomerate reservoir: A case study of Wu 3 zhong T2k1 reservoir of Karamay oilfield (in Chinese). Pet. Geol. recov. Effic. 17 (3), 95–98. doi:10.13673/j.cnki.cn37-1359/te.2010.03.006
Feng, W. J., Wu, S. H., Xu, C. F., Xia, Q. Y., Wu, S. W., Huang, M., et al. (2015). Water flooding channel of alluvial fan reservoir and its controlling distribution pattern of remaining oil: A case study of triassic lower Karamay formation, yizhong area, Karamay oilfield, NW China (in Chinese). Acta Pet. Sin. 36 (7), 858–870. doi:10.7623/syxb201507010
Gao, Y. (2013). Research on encryption adjustment development of Badaowan Formation in hong 16 district (in Chinese). Jingzhou: Yangtze University.
Geudtner, D., Torres, R., Snoeij, P., Davidson, M., and Rommen, B. (2014). Sentinel-1 system capabilities and applications. IEEE Int. Symposium Geoscience Remote Sens. IGARSS 1457–1460. doi:10.1109/IGARSS.2014.6946711
Hu, B., Li, H., Zhang, X. F., and Fang, L. (2020). Oil and gas mining deformation monitoring and assessments of disaster using interferometric synthetic aperture radar technology. IEEE Geosci. Remote Sens. Mag. 6, 108–134. doi:10.1109/MGRS.2020.2989239
Huang, Q. G. (2019). Development and adjustment study at Karamay formation in block erdong of Karamay oilfield (in Chinese). Dongying: China University of Petroleum.
Huang, Q. M. (2003). The study of rolling exploration and development of upper wuerhe formation reservoir in the 5th district of Karamay oil field. Chengdu: Southwest Petroleum University.
Ji, L. Y., Zhang, Y., Wang, Q. L., Xin, Y. L., and Li, J. (2016). Detecting land uplift associated with enhanced oil recovery using InSAR in the Karamay oil field, xinjiang, China. Int. J. Remote Sens. 37 (7), 1527–1540. doi:10.1080/01431161.2016.1154222
Li, J. M. (2014). Well infilling and adjustment scheme for Qigu formation in hongqian 1 well area of xinjiang oilfield (in Chinese). Chengdu: Southwest Petroleum University.
Li, S. M., Han, R. H., Du, Y. J., Liu, P. C., and Bie, H. Y. (2020). Quantitative characterization of diagenetic reservoir facies of the Karamay alluvial fan in the Junggar Basin, western China. J. Petroleum Sci. Eng. 188, 106921. doi:10.1016/j.petrol.2020.106921
Li, Z. M. (2012). The evaluation of development effect and the comprehensive adjustment study of lower Karamay formation oil reservoir in the 8th area of Karamay (in Chinese). Chengdu: Chengdu University of Technology.
Liu, J. Y. (2003). Research on improving steam thermal efficiency. Chengdu: Southwest Petroleum Institute.
Liu, Y. L., Huang, H. J., Liu, Y. X., and Bi, H. B. (2016). Linking land subsidence over the yellow river delta, China, to hydrocarbon exploitation using multi-temporal InSAR. Nat. Hazards 84, 271–291. doi:10.1007/s11069-016-2427-5
Liu, Y. Z. (2020). Reserve evaluation of the non-producing area of wuerhe 2+3 segment in lower wuerhe reservoir of district No.8 (in Chinese). BeijingBeijing: China University of Petroleum.
Loesch, E., and Sagan, V. (2018). SBAS analysis of induced ground surface deformation from wastewater injection in east central Oklahoma, USA. Remote Sens. 10 (2), 283. doi:10.3390/rs10020283
Ma, L. (2020). Evaluation of the effect of steam stimulation on the Karamay formation in the 9-2 area and study on the influencing factors (in Chinese). Chengdu: Chengdu University of Technology.
Métois, M., Benjelloun, M., Lasserre, C., Grandin, R., Barrier, L., Dushi, E., et al. (2020). Subsidence associated with oil extraction, measured from time series analysis of Sentinel-1 data: Case study of the patos-marinza oil field, Albania. Solid earth. 11, 363–378. doi:10.5194/se-11-363-2020
Ng, A. H. M., Ge, L., and Li, X. (2015). Assessments of land subsidence in the gippsland basin of Australia using ALOS PALSAR data. Remote Sens. Environ. 159, 86–101. doi:10.1016/j.rse.2014.12.003
Pratt, W. E., and Johnson, D. W. (1926). Local subsidence of the goose creek oil field. J. Geol. 34, 577–590. doi:10.1086/623352
Ren, J. P. (2014). Application of directional well technology to potential heavy oil layers development by new well pattern in district No.9 in Karamay oilfield (in Chinese). Xinjiang Pet. Geol. 35 (6), 728–731.
Shi, J. C., Xu, B., Chen, Q., Hu, M. W., and Zeng, Y. R. (2022). Monitoring and analysing long-term vertical time-series deformation due to oil and gas extraction using multi-track SAR dataset: A study on lost hills oilfield. Int. J. Appl. Earth Observation Geoinformation 107, 102679. doi:10.1016/j.jag.2022.102679
Shi, J. C., Yang, H. L., Peng, J. H., Wu, L. X., Xu, B., Liu, Y., et al. (2019). InSAR monitoring and analysis of ground deformation due to fluid or gas injection in Fengcheng oil field, xinjiang, China. J. Indian Soc. Remote Sens. 47 (3), 455–466. doi:10.1007/s12524-018-0903-y
Staniewicz, S., Chen, J., Lee, H., Olson, J., Savvaidis, A., Reedy, R., et al. (2020). InSAR reveals complex surface deformation patterns over an 80, 000 km2 oil-producing region in the permian basin. Geophys. Res. Lett. 47 (21). doi:10.1029/2020GL090151
Su, W. Q. (2006). Study on sedimentary facies of middle triassic kexia formation in Hongshanzui oilfield (in Chinese). Chengdu: Southwest Petroleum University.
Sun, X. G. (2012). The application and optimization of dual horizontal well SAGD technology in shallow super heavy oil reservoir: A case study of Fengcheng oilfield (in Chinese). Chengdu: Southwest Petroleum University.
Tang, R. (2011). Distribution and potential exploitation of remaining oil in high water cut reservoirs of lower Karamay formation in the liuzhong area (in Chinese). Chengdu: Southwest Petroleum University.
Tao, J. L. (2014). Reservoir logging evaluation of Badaowan Formation in block 5 of Karamay oilfield (in Chinese). Chengdu: Southwest Petroleum University.
Wang, B. (2017). Research on residual oil distribution and adjustment solution for Karamay formation of 4-1 oilfield (in Chinese). Dongying: China University of Petroleum.
Wang, J., Yu, X. H., Zhong, Y. F., Zhou, M., and Yang, X. T. (2021). Braided River depositional characteristics of the triassic lower Karamay formation at Hongshanzui, Junggar Basin (in Chinese). Geosci 35 (3), 841–849.
Wang, X. R. (2006). Study on reservoir description of torrent and geologic model: An example of oil reservoir in Wu 2 eastern block in Karamay oil field (in Chinese). Beijing: China University of Geosciences.
Wang, Y. J. (2020). Study on sand body configuration and remaining oil distribution pattern of baikouquan formation reservoir in Bai21 well block (in Chinese). Jingzhou: Yangtze University.
Wang, Y. T., and Jiang, S. B. (1998). An approach to the distribution and origin of heavy oil in the northwest margin of Junggar Basin (in Chinese). Pet. explor. Dev. 25 (5), 18–20.
Wang, Y., Yang, W. L., Deng, J., Wu, B. L., Li, Z. Y., and Wang, M. Z. (2014). Accumulation system of cohabitating multi-energy minerals and their comprehensive exploration in sedimentary basin: A case study of Ordos Basin, NW China (in Chinese). Acta Geol. Sin. 88 (5), 815–824.
Wang, Z. Y., Lin, B. T., Yu, H. Y., Shi, S. Z., and Kou, X. R. (2020). Characteristics of in-situ stress in sandy conglomerate reservoir of Badaowan Formation in district No.7, Karamay oilfield (in Chinese). Xinjiang Pet. Geol. 41 (3), 314–320. doi:10.7657/XJPG20200309
Wen, Y. N. (2016). 3D geological modeling and application of Badaowan Formation in area J of Karamay oilfield (in Chinese). Chengdu: Southwest Petroleum University.
Xu, G. Y. (2003). Research on the limit of exploitation technology policy during high water cut period in conglomerate reservoir (in Chinese). Chengdu: Southwest Petroleum Institute.
Xu, H. B., Dvorkin, J., and Nur, A. (2001). Linking oil production to surface subsidence from Satellite radar interferometry. Geophys. Res. Lett. 28 (7), 1307–1310. doi:10.1029/2000GL012483
Xu, S. (2006). Reservoir description and remaining oil distribution of the lower Karamay formation at medium-high water cut stage in western 52 area of Karamay oilfield (in Chinese). Chengdu: Southwest Petroleum University.
Xue, L. (2019). Study on production rule and injection-production connectivity of well 530 in Badaowan Formation of Karamay oilfield (in Chinese). Beijing: China University of Petroleum.
Xue, Q. (2018). Study on the identification of dominant channel and countermeasures in HongQian-1 well Area (in Chinese). Chengdu: Southwest Petroleum University.
Yang, C. S., Zhang, D. X., Zhao, C. Y., Han, B. Q., Sun, R. Q., Du, J. T., et al. (2019). Ground deformation revealed by Sentinel-1 MSBAS-InSAR time-series over Karamay oilfield, China. Remote Sens. 11 (17), 2027. doi:10.3390/rs11172027
Yang, X. W., Wang, Y., XuJiang, X. Y. M., and Chen, J. L. (2003). Feasibility of heavy oil cold flow production in district baizhong-7 well of baikouquan oilfield (in Chinese). Xinjiang Pet. Geol. 24 (3), 238–239. doi:10.3390/rs11172027
Yin, S. L., Tang, Y., Hu, Z. M., Wu, T., Zhang, L., and Zhang, J. Y. (2016). Controls of tectonic activity on alluvial fan deposits and hydrocarbon accumulation: A case study of permian and triassic alluvial fans in northwestern margin of Junggar Basin (in Chinese). Xinjiang Pet. Geol. 37 (4), 391–400. doi:10.7657/XJPG20160403
Zhang, B. (2013). Reservoir prediction and favorable target area selection of the lower urho formation in the southern block 8 (in Chinese). Chengdu: Southwest Petroleum University.
Zhang, J. Y. (2019). Fine description of the water flow dominant channel in the kexia formation reservoir in yizhong district, Junggar Basin (in Chinese). Beijing: China University of Petroleum.
Zhang, S. F., Huo, J., Sun, X. G., Yang, F. X., Wang, P., Wu, J. X., et al. (2021). Molecular composition reveals unique rheological property of Karamay heavy crude oil. Energy fuels. 35, 473–478. doi:10.1021/acs.energyfuels.0c03639
Zhang, W. M., Yu, X. H., Yao, Z. Q., Zhou, L. H., Li, S. L., Yang, X. T., et al. (2019). Sedimentary characteristics and evolution rule of the jurassic Badaowan Formation in the Hongshanzui area of Junggar Basin (in Chinese). J. Northeast Petroleum Univ. 43 (3), 43–52. doi:10.3969/j.issn.2095-4107.2019.03.005
Zhao, Z. Y., Liu, C. M., Lv, X. X., Liao, J. D., Li, A. J., and Li, Y. J. (2008). Profile control and oil displacement formula of Karamay formation in the yizhong area of Junggar Basin (in Chinese). Sci. Tech. Inf. 6 (6), 151–152.
Zheng, X. (2016). 4-Property relationship and diagenesis study of the J1b reservoir of jurassic Badaowan Formation in wellblock zhong 18 of Fengcheng oilfield (in Chinese). Beijing: China University of Petroleum.
Zheng, Z., Wu, S. H., Xu, C. F., Yue, D. L., Wang, W., and Zhang, F. (2010). Lithofacies and reservoirs of allluvial fan in the lower keramay formation in the block-6 of Karamay oilfield, the Junggar Basin (in Chinese). Oil Gas. Geol. 31 (4), 463–471.
Zhu, R. F. (2016). The study of remaining oil distribution in NW margin of jungar basin oilfield urho baikouquan group. Xi’an: Northwest University.
Zhu, X. M., Zhu, S. F., Xian, B. Z., Chen, S. P., Kuang, L. C., Xue, X. K., et al. (2010). Reservoir differences and formation mechanisms in the ke-Bai overthrust belt, northwestern margin of the Junggar Basin, China. Pet. Sci. 7, 40–48. doi:10.1007/s12182-010-0005-0
Zou, C. N., Hou, L. H., Kuang, L. C., and Kuang, J. (2007). Genetic mechanism of diagenesis reservoir facies of the fan-controlled permo-triassic in the western marginal area, Junggar Basin (in Chinese). Chin. J. Geol. 42 (3), 587–601.
Keywords: surface deformation, time series InSAR, crude oil properties, buried depth, reservoir physical properties, sedimentary facies
Citation: Xu L, Yang Y, Ju X and Yang J (2023) Influence of geological factors on surface deformation due to hydrocarbon exploitation using time-series InSAR: A case study of Karamay Oilfield, China. Front. Earth Sci. 10:983155. doi: 10.3389/feart.2022.983155
Received: 30 June 2022; Accepted: 21 November 2022;
Published: 20 January 2023.
Edited by:
Chao Zhou, China University of Geosciences Wuhan, ChinaReviewed by:
Caijun Xu, Wuhan University, ChinaChaoying Zhao, Chang’an University, China
Wenyu Gong, Institute of Geology China Earthquake Administration, China
Copyright © 2023 Xu, Yang, Ju and Yang. This is an open-access article distributed under the terms of the Creative Commons Attribution License (CC BY). The use, distribution or reproduction in other forums is permitted, provided the original author(s) and the copyright owner(s) are credited and that the original publication in this journal is cited, in accordance with accepted academic practice. No use, distribution or reproduction is permitted which does not comply with these terms.
*Correspondence: Lei Xu, eHVsZWk2MjZAMTI2LmNvbQ==
 Lei Xu
 Yongpeng Yang1,2