- 1Center for Geohazards Studies, Department of Geology, University at Buffalo, Buffalo, NY, United States
- 2Department of Geosciences, University of Arizona, Tucson, AZ, United States
Pre-mixing of magma and external water plays a key role in driving explosive phreatomagmatic and submarine volcanic eruptions. A thin film of water vapor forms at the magma–water interface as soon as hot magma comes in direct contact with the cold water (Leidenfrost effect). The presence of a stable vapor film drives efficient mixing and mingling between magma and water, as well as magma and wet and water-saturated sediments. Such mixing occurs before explosive molten fuel–coolant type interactions. Using high-temperature laboratory experiments, we investigate the effect of magma and water temperatures on the stability of vapor film, which has not been performed systematically for a magmatic heat source. The experiments were performed with re-melted volcanic rock material, from which spherically-shaped rock samples were produced. These samples were heated to 1,110°C and then submerged in a water pool with a constant temperature (3–93°C). The experiments were recorded on video, and, synchronously, sample and water temperatures were measured using thermocouples. The time-dependent thickness of the vapor film was measured from the video material. The vapor film tends to oscillate with time on the order of 102 Hz. We find that the vertical collapse rates of vapor films along the sample–water interfaces are 13.7 mm s−1 and 4.2 mm s−1 for water temperatures of 3.0°C and 65°C, respectively. For a given initial sample temperature, the thickness and stability time scales decrease with decreasing water temperature, which has implications for the efficiency of pre-mixing required for explosive eruptions. Using thermodynamics and previously measured material parameters, it is shown that a sudden collapse of the vapor film can start brittle fragmentation of the melt and thus serves as the starting point of thermohydraulic explosions.
1 Introduction
Energetic interaction between magma and ground water results in explosive phreatomagmatic eruptions. Magma, in phreatomagmatic eruptions, either directly interacts with ground water or mingles with ground water-laden crystal rocks or sediments (McBirney, 1963; Kokelaar, 1986; White, 1996; Zimanowski, 1998; Zimanowski and Büttner, 2003; Soule et al., 2006; White and Ross, 2011; Valentine and White, 2012; Graettinger et al., 2013; Wohletz et al., 2013; Houghton et al., 2015; Liu et al., 2015; van Otterloo et al., 2015; Fitch et al., 2017; Sonder et al., 2018). Such energetic interactions between magma and water are also common under planetary environments (Wilson and Head, 2004; Hamilton et al., 2011; Moitra et al., 2021). During submarine eruptions, magma comes in direct contact with seawater and causes explosive and non-explosive styles of eruption (Allen et al., 2008; Chadwick et al., 2008; Sonder et al., 2011; Schipper et al., 2013; Fauria and Manga, 2018; Manga et al., 2018; Dürig et al., 2020; Murch et al., 2020; Cahalan and Dufek, 2021). In explosive scenarios, heat transfer from magma to water is rapid and causes brittle fragmentation of larger amounts of magma in a short time, an overall very explosive process termed molten fuel coolant interaction (MFCI, Németh and Kósik, 2020; Zimanowski et al., 1997a). Therefore, understanding the dynamics of interaction between magma and water is key to better assessing hazards associated with the resulting explosive volcanic eruptions.
When magma comes in direct contact with water, the high temperature difference causes evaporation of water in the direct vicinity of the interface, forming a thin film there. The phenomenon is not limited to magma–water heat transfer, but is considered a general phenomenon of heat transfer to water and other substances at high temperature drops and is also known as the “Leidenfrost effect” (Leidenfrost, 1966; Dhir, 1998; Incropera et al., 2007). As magma cools, the vapor film collapses. In its place, numerous steam bubbles form at the magma–water interface, transitioning from a film-boiling regime to a nucleate-boiling regime. The source temperature at which this collapse takes place is called a Leidenfrost point (Incropera et al., 2007). The Leidenfrost temperature and the extent of heat flux from magma to water also depend on the water temperature, with heat flux increasing with decreasing water temperature (Moitra et al., 2020).
The formation of a vapor film is thought to be a key phenomenon that results in energetic magma–water interaction (Wohletz et al., 2013, and references therein). The explosive interaction of magma and water, termed molten fuel–coolant interaction (MFCI) or also thermohydraulic explosion (Büttner and Zimanowski, 1998), relies on a pre-mixing stage before an explosion in which magma and liquid water mingle (for the highest explosivity into cm-sized water domains trapped inside the melt). Mixing liquids as different as magma and water is only possible in a limited time window. The Leidenfrost effect enables a vapor film to exist at such temperatures, and it limits the heat flux from melt to water as long as the melt temperature at the interface is above the Leidenfrost point (Moitra et al., 2020). The quasi-stable nature of the vapor film is also relevant since it can collapse rapidly if a small but steep pressure pulse passes through the film (Fletcher, 1995; Büttner and Zimanowski, 1998; Zimanowski et al., 2015). In that case, heat transfer increases rapidly, and if the collapse area is large enough, the melt breaks instantaneously before vapor is produced (Zimanowski et al., 1997b) due to thermal expansion of the water side and contraction of the melt side imposing high pressure across the interface, which initiates the explosion. Peperites are viewed as non-exploded relics of such mixing between magma and wet sediments (Skilling et al., 2002). To a somewhat lesser extent, film boiling states also play a role in non-explosive magma–water interaction, such as the thermal granulation of magma into small- and medium-sized particles. There, the film’s lifetime influences the average heat transfer rates, cooling rates, and produced particles (Schmid et al., 2010; Sonder et al., 2011).
Vapor film lifetime and stability were measured at metallic and other heat sources (Dhir, 1998; Vakarelski et al., 2012). On a magmatic heat source, film boiling was observed and described (Sonder et al., 2011; Schipper et al., 2013), but was not systematically investigated at varying water temperatures. In this study, we investigated the dynamics of the film boiling regime as magma comes in direct contact with water. We performed high temperature laboratory experiments with remelted rocks to investigate the film boiling regime due to the interaction between magmatic materials and water. Using the empirical results, we evaluated the stability and oscillatory behavior of the vapor of the film that has implications for explosive volcanic eruptions.
2 Laboratory experiments
2.1 Experimental methods
The magma–water interaction experiments in this study are modified versions of the heat transfer experiments in Moitra et al. (2020). Here, we explore vapor film thickness and collapse rates, which were not quantified before. The experiments were performed in two steps: 1) sample preparation and 2) experiments in the film boiling regime, which are described as follows.
2.1.1 Sample preparation
We first prepared spherical samples of about 3 cm diameter from remelted mafic rocks. The rocks were acquired from a quarry in Texas and have low silica content (Table 1 and Sonder et al. (2018)). After working with a few different rock types, we used this low-Si rock as it was readily available and the material was homogeneous. The material has a relatively low viscosity, which made it possible to cast a cm-sized sample. Centimeter-sized rock chips were melted in an argon-purged furnace and then were poured into an insulated spherical stainless steel mold. The spherical shape was chosen for consistent sample production and to allow for similar heat transfer conditions across the magma–water interface. Sharp corners, for example, such as those in cuboides, cool more rapidly than the main body. The spherical symmetry allows for better separate effects of geometry from the physical process. The sample shape is also convenient for building a model framework to quantify magmatic heat transfer rates (Moitra et al., 2018; Moitra et al., 2020). While casting the melt, a thin and hollow alumina tube was placed inside each sample through which later, for the heat transfer experiment, a thermocouple was inserted to measure the change in sample temperature. Each sample had a small tail with a negligible effect on heat transfer (Moitra et al., 2018). This small tail was used to hold the sample during the heat transfer experiment. After pouring and inserting the alumina tube, the sample was cooled under an insulated chamber to prevent any quench-induced fracturing. After solidification, the spherical molds were carefully removed from the samples.

TABLE 1. Oxides of major elements in the source rock, measured on volatile-free basis, as initially published by Sonder et al. (2018).
To prepare a sample, several physical processes have to be balanced: 1) thermally induced stress, caused by rapid cooling which leads to large temperature gradients, can lead to crack formation (“thermal shock”); therefore, the cooling rate after casting the melt into the mold has to be low enough. 2) When cooling is too slow the melt contact with the steel mold becomes too adhesive and the sample breaks after cooling when the mold is removed. 3) If the initial temperature of the steel mold is too high, the mold’s diameter will decrease more than that of the sample when the temperature drops. Since the thermal expansion of steel is much higher than that of any igneous material, the mold can eventually break the sample.
It was found that the right amount of heat applied to the steel mold in combination with the right cooling rate and the relatively low melt viscosity can balance these contradicting processes to create the samples. The result is the previously described approximate sphere. The surface texture is not quenched, but microcrystalline, and the porosity is less than 3%.
2.1.2 Experiments in film boiling regime
During the experiment, a sample was heated to 1,110°C in an argon-purged furnace and kept at this temperature for several hours. To ensure constant temperature, a thermocouple was inserted into the sample through the alumina tube before placing the sample assembly inside the furnace. When ready, the sample was taken quickly from the furnace and submerged in distilled water (Figure 1). The water pool was prepared in a 30 cm × 30 cm plexiglass tank and was about 15 cm deep so that the dimensions were much greater than the sample size of about 3 cm in diameter. To determine vapor film behavior at different degrees of subcooling, the experiments were performed at different water pool temperatures ranging from 3 to 93°C. Both water pool and sample temperatures were recorded at 100 Hz. Experiments were recorded by different cameras: two Sony™ FDR-AX100 were used from two different angles, one was recorded with 1,920 px × 1,080 px at 59.94 fps and the other was recorded with 1,280 px × 720 px at 119.88 fps. Two of the experiments were also recorded with a high-speed camera (pco. 1,200 hs) at 978 fps.
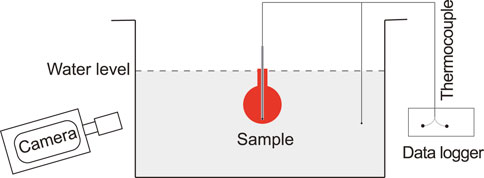
FIGURE 1. Schematic diagram showing the experimental set-up (not to scale). A spherical sample of magma, initially at 1,110°C, is submerged in a Plexiglas tank filled with distilled water, where thermocouples and data logger record the temperature data of the sample and the water, and the cameras record the experiment.
2.2 Data analysis
To measure the vapor film location, thickness, and direct melt-water contact area, video material was split into separate frames and then manually marked up in the ImageJ program (Schindelin et al., 2012). Polygons were drawn outlining regions of interest. To handle the resulting lists of image coordinates efficiently, an ImageJ plugin was written that allows to store all the drawn polygons of a video in a single JSON (JavaScript Object Notation) formatted text file. This file was read by Python scripts for further analysis.
A video record has to meet three main requirements to enable the data analysis described as follows. 1) The shutter speed of the camera has to be short enough so that the rapid film oscillations do not completely blur regions of interest. 2) Spacial image resolution has to be high enough so that the film’s thickness measures at least a couple of pixels on the camera sensor. 3) The video recording has to include at least one frame in which the sample is visibly in direct contact with water (no film boiling present) so that the sample size can be measured accurately. This is because even though the vapor film is transparent, the refraction index of vapor is different from that of liquid water such that the sample, including its boundaries, behind the film appears distorted (Figure 2).
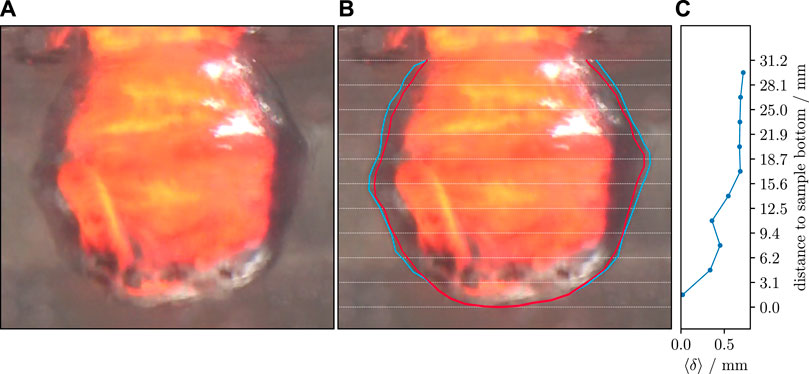
FIGURE 2. Film boiling example at 65°C pool water temperature. (A) Film boiling at Tw = 65°C, 0.25 s after initial water contact. Large parts of the sample are covered by the vapor film. Toward the sample bottom, there are smaller areas where the film becomes unstable. (B) Same video frame as (A) with added markup used to measure film thickness. The red polygon is the sample outline, determined after heat transfer (in the same video record). The blue polygon is the outline of the vapor film. White lines mark the 10 segments in which the film thickness was averaged. (C) Measured vapor film thickness, ⟨δ⟩, averaged for each of the 10 vertical segments. Broadly speaking, film thickness increases with distance from the sample bottom. In the particular frame shown, thickness has negligible values at the sample bottom and has its maximum of 0.72 mm at the top.
To measure film thickness in each analyzed video frame, a polygon outlining the outside of the vapor film was drawn (Figure 2). The use of the lower frame rate video has the advantage of higher image resolution and a continuous video stream through the complete boiling regime. In the end, the sample is visible without film boiling or distorting vapor bubbles. Then, it is possible to measure the sample size precisely from the same camera perspective as the film boiling is measured. The high-speed records only allowed to record less than 4 s, and the sample without film or bubble at the interface is not available.
Vertical dependencies for film thickness and direct contact area were measured by splitting the drawn polygons into segments according to their vertical (y) coordinate. For a total of 10 vertical and equidistant bands, the polygons were split into nine segments on either side of the sample, corresponding to the nine upper bands plus one bottom segment connecting the two sides, resulting in 19 sub-polygons which, when concatenated, reproduce the original polygon (see also Figure 2B).
2.2.1 Film thickness
The vapor film thickness was determined as the average distance between the two polygons outlining the sample and the film’s outer boundary. The thickness can be retrieved directly from the two-dimensional video material because the observed boundaries are parallel to the camera’s sensor and 2D geometry is sufficient to treat the problem.
An arbitrary simple curve S without loops may be approximated by a polygon represented as a sequence of N Cartesian coordinate pairs, si, which are connected by straight lines. Here, i is a running integer ∈ [1, N]. An arbitrary point on S is accessible using the segment number i and a parameter u that scales the connection vector between points si and si+1:
The minimum distance δi(r) of an arbitrary point r = (x, y) to the ith polygon segment is given by minimizing the absolute value of the difference
which requires that
If u determined that way is larger 1, the point closest to r lies outside the segment; but since the direction of a straight line does not change, the closest point within the segment is then si (1), that is, si+1. Similarly, if u < 0 the closest point within the ith segment is si (0) = si. The absolute minimum distance of point r from S can be determined by computing u from Equation 3 for all segments, determining the distance for those u, and selecting the minimum.
The average distance, ⟨δ⟩, between two non-intersecting curves S and F (F is approximated by a polygon of M points fk) can be determined by integrating the minimal distance of each point of F (Equation 4) to S, δS,min (fk), and dividing by the length of F:
Here, L is the total length of F, the sum of lengths of the M − 1 connection vectors
Integration can be split into the individual line segments of F
This is a form that can be implemented in a fairly straightforward way. The remaining integral was evaluated with the trapezoidal rule.
As described earlier, each of the raw polygons was split into 19 parts. Pairs of parts were built that belong to the same vertical band and same sample side, one describing the sample surface and the other the film. Averaged distances between those pairs were interpreted as the average film thickness in this y-band. Even though it makes no principal difference, for this analysis, polygon parts describing the sample surface were defined as S, whereas parts describing the film boundary were defined as F. That means the film’s polygon parts were used for integration.
2.2.2 Direct contact area
Areas of the sample surface where the vapor film had collapsed were outlined with polygons. Direct sample–water contact can be identified by a slightly higher color contrast of the sample surface and by a relatively undisturbed view of the surface details. It typically occurs at a small distance from the boundary of the area of the sample which is hot enough to appear in red or orange color on the video and is always covered by the vapor film (see Figure 3A; Supplementary Videos S1, S3, S4 and S5; and the archived source video material in Sonder and Moitra (2022)).
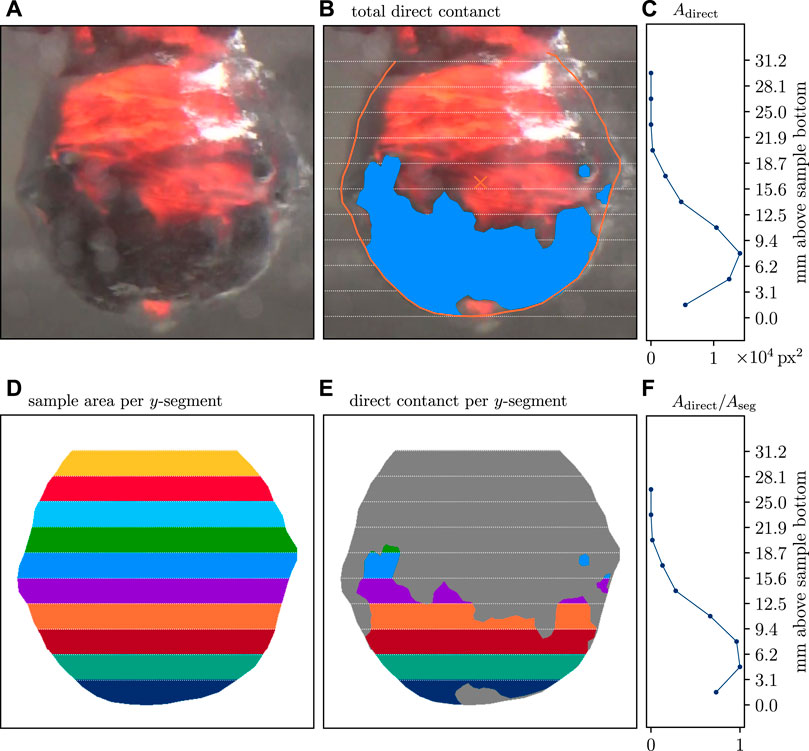
FIGURE 3. Area-based tracking of direct melt–water contact. Analysis of one frame of the Tw = 65°C run is shown. (A) Blank frame without marked areas for comparison. The translucent gray circular patches are caused by condensing water at the outside of the water container wall. (B) Three polygons outlining the direct contact area. (C) Vertical dependency of direct contact. (D) Area of the projected sample colored by the y-segments (Aseg). (E) Direct contact area (Adirect) of this frame. Gray background is the film-covered sample. (F) The ratio of areas colored in (D) and (E) is the relative direct contact area Arel = Adirect/Aseg. The bottom part of the sample has higher amounts of direct contact. The lower value of Arel in the lowest segment is likely caused by a small crack at the sample’s bottom, which produced local film boiling over an extended period.
Each analyzed video frame can contain more than one such closed polygon (Figure 3B). To track the vertical dependency, vertices to each pixel of a frame were created, and for each vertex, it was determined if it is contained by one of the polygons or not. Then, the polygon-contained vertices were associated with one of the y-segments, depending on their vertical coordinate (Figure 3D). The total direct contact area of a y-segment, Adirect, is then the number of pixels fulfilling these conditions multiplied by the area of one square pixel, which is the square of the image resolution. Each pixel is assumed to be either fully inside or fully outside a polygon. For many pixels, their number is a good measure of the total area they represent. Here, typical areas measured this way are of the order of 103 px2 to 104 px2.
A scalable definition of vapor film collapse cannot be given as an absolute area. Therefore, the relative direct contact area, the ratio Adirect/Aref, can be used, where the reference area, Aref, is the sample’s surface area (in each y-segment). As a criterion that the vapor film has collapsed, the following analysis assumes 90% direct contact, that is, Adirect/Aref ≥ 0.9.
3 Results
3.1 Qualitative observations
The experimental videos show that a thin film of water vapor forms instantaneously as soon as the hot sample is submerged in water. The film tends to oscillate over time as the sample cools and retreats, starting at the bottom and moving to the top of the sample, at any given water temperature. Parts of the sample surface which are covered by the vapor film stay hot longer than those parts in direct liquid water contact. This can be seen from the red radiation (“glow”) of the sample, which only occurs at high temperatures and which is only observed under the vapor film. As the film retreats, quench-induced dendritic cooling patterns were observed on the surface of the samples. The thickness of the film, from qualitative observations, decreases overall with decreasing water temperature. The film is thickest at 93°C water temperature, and it is the thinnest at 3°C water temperature (see Section 3.2).
Visually, the shape of the vapor film is most stable at 65°C water temperature, even though the thickness of the film is relatively small (∼ 0.5 mm) as compared to the higher water temperature experiment (∼ 0.5 cm). At 3°C, the vapor film forms only at the lower part of the sample and collapses within fractions of a second. At 93°C water temperature, the film is relatively thick but remains highly unsteady for the duration of its stability. However, at 65°C, the film is more quiescently present, making the measurement of film thickness possible.
3.2 Film thickness
Film thickness could only be measured for the T = 65°C experiment. In the 3°C experiment, the thickness was below the measurable threshold of one camera pixel (px) from the beginning. At 93°C, water temperature thickness often approaches values similar to the sample radius, but then rapidly collapses. Even though the camera shutter is fast enough to suppress motion blur, the frame rate was not high enough to clearly observe the oscillation’s amplitudes.
At 65°C, the overall behavior is that thickness increases with vertical distance from the sample bottom; and thickness decreases over time. The data for the lower sample half roughly follow an exponential decay
where i = 1, 2, … refers to the ith y-segment, starting at the sample bottom and relates to the vertical distance by
Values for Δy are listed in Table 2. A fit of Equation 8 to the lower sample half (i = 1 … 5) shows increasing values for time constants, t0,i, with vertical distance i (Figure 4). The average and extrapolated value for the initial thickness, δ0, for all y-segments is δ0 = 2.05 mm. It became clear during the analysis that the thickness decreases to a lower limit which cannot be resolved by the video material. However, the same material shows that the film then still exists for a while longer. We set the lower threshold for the film thickness to about 1 px (ca. 0.07 mm). Over time, thickness drops below this threshold starting from the sample bottom upwards. The speed at which the lower thickness threshold was approached was ca. 20 mm s−1 (Figure 8).
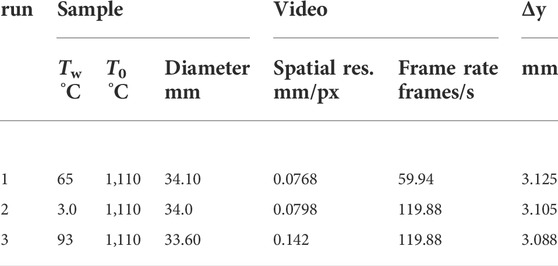
TABLE 2. Data on experimental setup and conditions. T0: initial sample temperature. Tw: initial water pool temperature. Sample diameter: the characteristic size from which the spatial resolution was determined (camera pixels were converted to length). Errors associated with measuring sample radius, Tw, and T0, were within ± 0.5 mm, ± 0.5 K, and ± 2 K, respectively. Δy: height of one of the 10 y-segments.
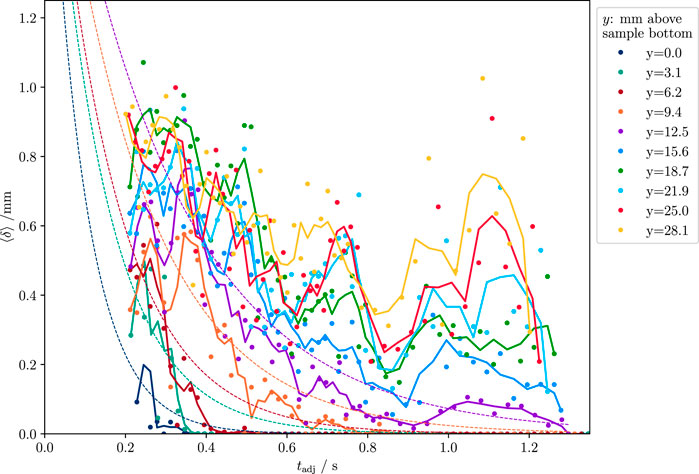
FIGURE 4. Average film thickness for each vertical segment of the T = 65°C experiment. Dots show measured thicknesses. Solid lines show a moving average of three samples, and the dashed lines show a fit of an exponential (Equation 8) to the lowest five segments (lower half of the sample). Film thickness increases with distance from the sample bottom. Segments in the upper sample half show larger oscillations than the lower half.
3.3 Direct contact area
Following the decrease of the film’s thickness with some delay, direct contact starts to grow from the sample bottom upwards. The time dependency of the relative direct contact area Arel = Adirect/Aref follows a smoothed step function starting from 0 and gradually growing to 1 (Figure 5). Comparing the time axes of Tw = 3°C and 65°C cases shows that in the former case, film collapse is roughly a factor 5 faster than the latter (Figures 5A–D, respectively).
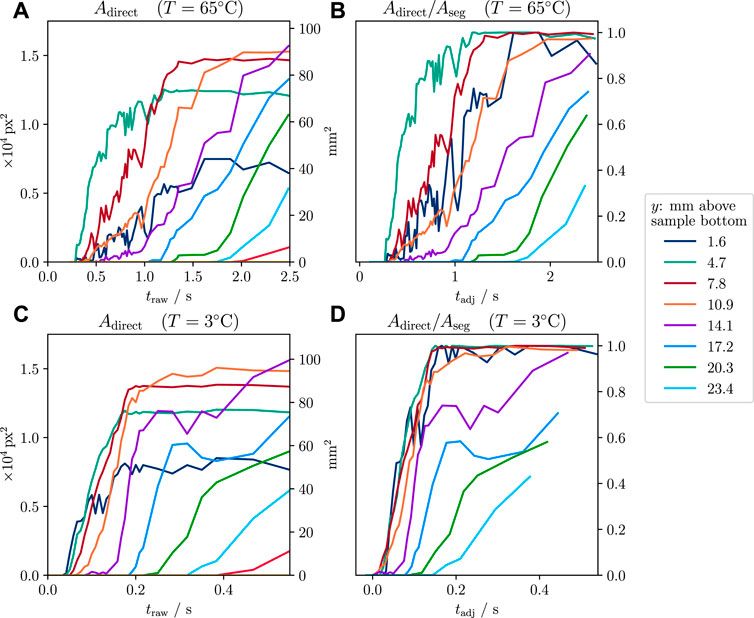
FIGURE 5. Measured direct contact area against time in each of the vertical segments. (A) and (B) show data of the T = 65°C experiment, and (C) and (D), data of the T = 3°C experiment. The center of each segment is given in the legend. Timescales of both experiments show that film collapse occurs roughly 5 times faster at T = 3°C than the T = 65°C case. (A) and (C): raw direct contact time dependencies show that film collapse starts at the sample bottom and progresses vertically with time, segment by segment. For larger times, areas approach different but constant values, which correspond to the sample’s segment areas (Aseg). (B) and (D): relative direct contact areas for the vertical segments plotted against a time axis that was adjusted to compensate for the sample motion (tadj): for each vertical segment, the time of first water contact was determined and set as 0 s. The total duration until the sample is fully submerged was 0.16 s for the 65°C experiments and 0.25 s for the 3°C experiments. Graph (D) shows that in the adjusted timeline, the small time delays visible in the lower segments in the raw timeline in (C) are not present.
In contrast to the thickness measurements, the detection of the existence of film boiling was successful in all three experiments. The most difficult case was for Tw = 93°C, where the strong film oscillations obstructed straightforward measurement as in the other two experiments. For this case, instead of continuous tracking of Adirect, the largest values of Adirect were measured, and the corresponding film lifetime values, therefore, represent minimum estimates.
The shape of this time dependency is best approximated by a function of the form
Here, t1 and t2 are two positive fit parameters, describing a constant shift on the time axis and the width (and maximal slope) of the step, respectively. As this function approaches 1 asymptotically, we assume 90 percentile direct contact for the film collapse condition, that is, Arel(tcoll) = 0.9. Solving Equation 10 for collapse time tcoll yields for the 90 percentile area-based film lifetime
For Tw = 3°C, there is no measurable delay between the lowest three vertical segments (y ≤ 9.3 mm). Only the fourth segment shows a short delay (Figure 6). The lifetime for this temperature lies between 0.13 and 0.16 s. A very rough estimate for the vertical collapse speed of ca. 180 mm s−1 can be given.
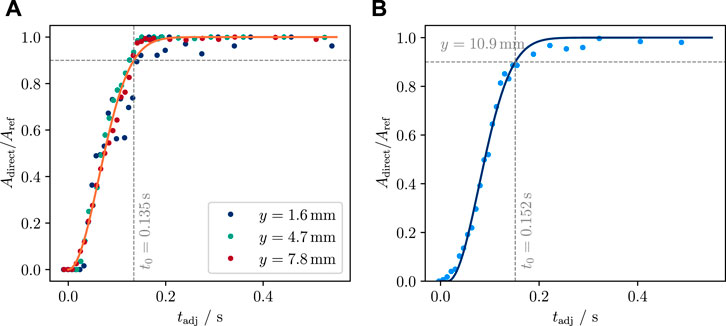
FIGURE 6. Measurement of vapor film lifetime at 3.0°C water temperature, using area-based measurements: relative direct contact area (Figures 5B,D) plotted against the sample motion-adjusted time since first contact. (A) Dots show the relative direct contact area of the first three y-segments for which no delay could be detected. A smeared-out step function is used to define the time window, t0, of film collapse (at t = t0 the relative direct contact area is 90%). The best fit time window is t0 = 0.135 s (orange curve). (B) Same as (A), but for the segment at y = 10.9°mm, the only other segment that yielded a conclusive result in this experiment. The 90% film lifetime here is 0.152 s.
At 65°C water temperature, film lifetime increases linearly from 0.78 to 2.89 s for the vertical range 4.7 mm ≤ y ≤ 17.2 mm. The film vanishes upwards at 5.6 mm s−1 (Figures 7, Figure 8). As mentioned earlier, the Tw = 93°C case shows massive film oscillations which are hard to interpret. Despite these instabilities, the minimum film lifetime measured here is greater than 10 s (Figure 8).
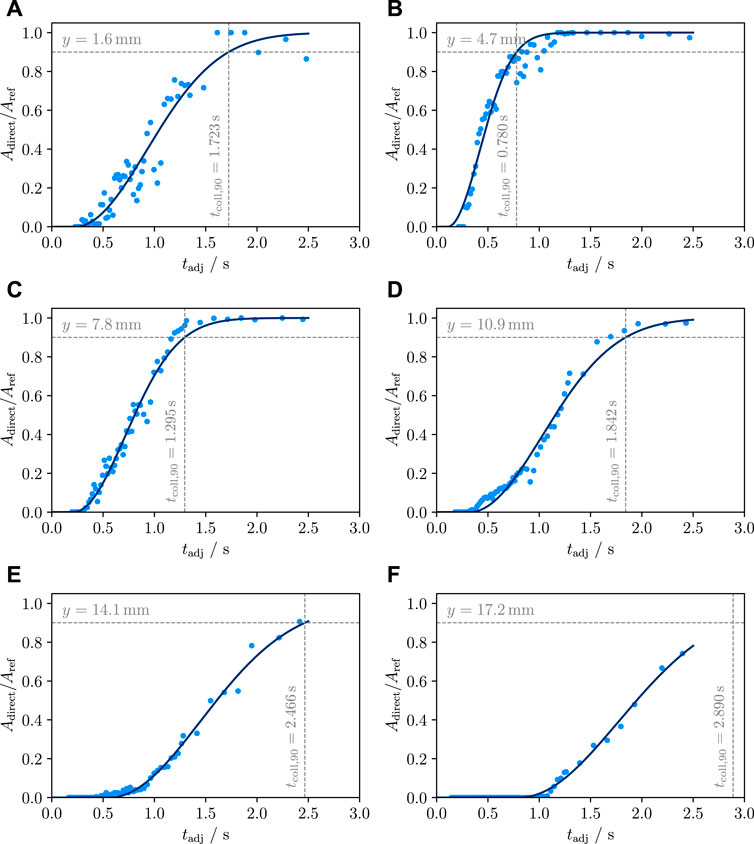
FIGURE 7. Time dependence of the relative direct contact area for the lowest six segments of the sample at Tw = 65°C (A: lowest, F: sixth lowest segment). The time axis was adjusted for the sample motion. Generally, the lifetime increases with an increase in the distance from the sample bottom. Similarly, the growth rate of direct contact (maximum slope) decreases with increasing y. We attribute the longer lifetime in the lowest segment to a small crack, which causes local film production over a relatively long period of time.
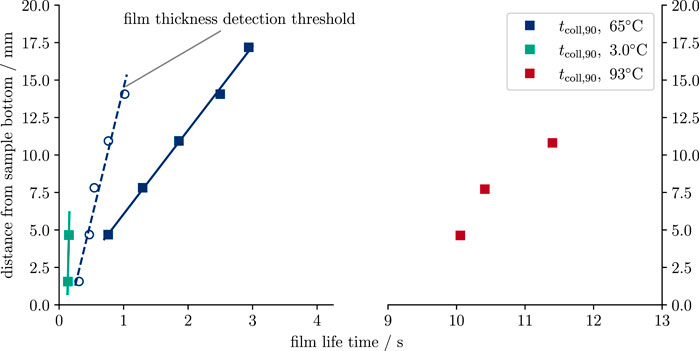
FIGURE 8. Vapor film lifetime dependence on vertical elevation above the bottom of the heat source. Squares show the film lifetime based on 90% relative direct contact area. Open circles show the 1 px (0.07 mm) film thickness detection threshold. Vertical collapse rates (slopes of the linear fits) are ca. 180 mm s−1 for 3.0°C and 5.6 mm s−1 for the 65°C experiments. For the 93°C run, the slope is not very different from 65°C; however, the measurement accuracy is low due to the oscillatory nature of the film boiling there.
4 Discussion
The film lifetime dependency on the vertical coordinate may be explained by convection: Heat transfer from the melt effectively increases water temperature at the interface above a given point, but less effectively below due to the changes in the density of liquid water and steam when heated. As mentioned in Section 2.1.1, we use spherical-shaped samples for reproducible results and quantification of heat transfer parameters. More research is necessary to quantify the geometric dependency in order to investigate its importance relative to the many other factors relevant to magma–water interaction, such as the magma’s own motion and deformation, external water flow (Moitra and Sonder, 2022), water salinity, and pressure (Gregg, 2013; Wohletz et al., 2013; Zimanowski et al., 2015).
4.1 Initiation of fragmentation in thermohydraulic explosions
The vapor film is often called “quasi-stable” because despite its remarkable stability at high temperatures, it may break down quickly if passed by a steep, but not necessarily large, pressure pulse. Previous research that recorded high-speed image material of thermohydraulic explosions showed immediate crack formation in the melt prior to steam production directly after film collapse (Zimanowski et al., 1997b). This implies that at least the start of melt fragmentation in the MFCI process is not caused by steam, but by direct liquid water to melt contact (Zimanowski, 1998). The only remaining physical reasons for crack formation at that point in time is a thermal expansion on the colder (water) side and thermal contraction on the hot (melt) side of the two hydraulically coupled liquids.
An estimate of the pressure that this thermohydraulic coupling can create may be given by computing the integral of the pressure change with respect to temperature on either side of the magma–water interface and expressing this with material parameters. At this point of the process, by assumption, pressure and temperature change rapidly. Therefore, the pressure change with temperature of an adiabatic (constant entropy) and an isochoric (constant volume) process are calculated for two temperatures, T1 and T2, which will be specified later:
Section 1.1 of the Supplementary Material shows that the derivatives can be expressed by the temperature and material parameters measured at constant pressure:
Here ρ, cp, αp, and βT, respectively, are the mass density, specific heat capacity, volumetric thermal expansion coefficient, and compressibility. The adiabatic case, in Equation 13, does not contain a compressibility term. Also, it predicts a larger pressure change for a lower thermal expansion coefficient. Both of these points are counter-intuitive and arise from the constant entropy condition in which temperature change is predominantly achieved by volume change. The isochoric case, in Equation 14, follows the common intuition: pressure change increases with rising thermal expansion coefficient and decreases with rising compressibility. Therefore, in the following, an isochoric process is assumed. The constant volume case is applicable as long as acceleration dominates over velocity (here volume change). A couple of microseconds after direct contact fractures are present in the melt, and constant volume is the wrong assumption then.
In the instance of film collapse, heat transfer is only possible by conduction, since convection material has to be accelerated into motion from (approximately) rest. It should be noted that even though known for relatively slow heat transfer, heat conduction supports high heat transfer rates, if the temperature gradient is large enough. The heat equation ∂T/∂t = a div (grad T) shows that a rapid temperature change (left-hand side) means a large temperature gradient (right-hand side) without any time delay (Landau and Lifshitz, 1970). For conductive heat transfer between two materials, which are thick compared to the region of the temperature gradient, a contact temperature is given by (Incropera et al., 2007)
The subscripts w and m refer to the water and melt materials, respectively. The weights j are given in terms of the thermal conductivity, k, and thermal diffusivity, a, for each material:
For liquid water and melt temperatures relevant to volcanic eruptions, the contact temperature lies above 850 K and therefore above the spontaneous nucleation temperature of water (max. 647 K). In the absence of many nucleation cores, when heated rapidly, liquid water may assume such superheated temperatures for a short time (Apfel, 1972). Since by assumption (and observation) water has not evaporated until crack formation, water temperature is assumed to stay below that threshold. Another research study on MFCI (Cronenberg, 1980), which is followed here, pragmatically assumes vapor formation starts at TN = 0.9 × 647 K ≃ 583 K.
With these assumptions, the integration boundaries of Equation 12, T1 and T2 become, respectively, for water and melt Tw, TN and Tc, Tm; Tw and Tm are the water and melt temperature before direct contact and are now far from the interface. The pressure change in the two materials becomes
It is noteworthy that the formulas are of the form (T1 − T2)α/β, which is also obtained by solving the thermoelastic problem for the surface stress of a heated sphere (Kingery, 1955; Landau and Lifshitz, 1970). With melt properties as listed in Table 3 this expression yields values for Δpw between 1.2 and 1.5 GPa for water temperatures between 4 and 90°C and melt temperatures between 1,050°C and 1,250°C (Figure 9). The pressure change in water, Δpw, has values between 300 and 500 MPa. For comparison, estimates for the strength of glass vary in a wide range, likely between 50 and 500 MPa (Brückner, 1970). The compressive strength of crystalline basalt is of the order of 350 MPa (Waltham, 2009). This shows that the thermohydraulic shock overcomes the material strength by more than a factor of 5, and pressure changes on either side of the interface are larger than the material strength of the melt.
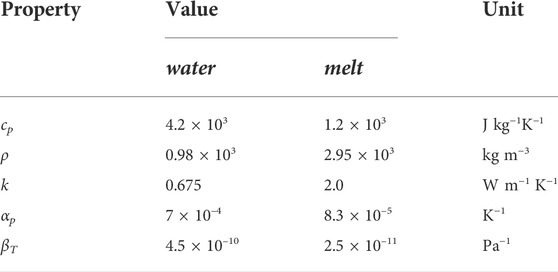
TABLE 3. Material properties of water and a magmatic melt that were used to calculate Δp (Equation 16). Water properties were derived with help of the IAPWS steam tables (Huber et al., 2012). Melt properties were taken from three different publications: ρ, cp, k from Moitra et al. (2018), αp from Büttner et al. (1998) and βT from Kuryaeva and Kirkinskii (1997).
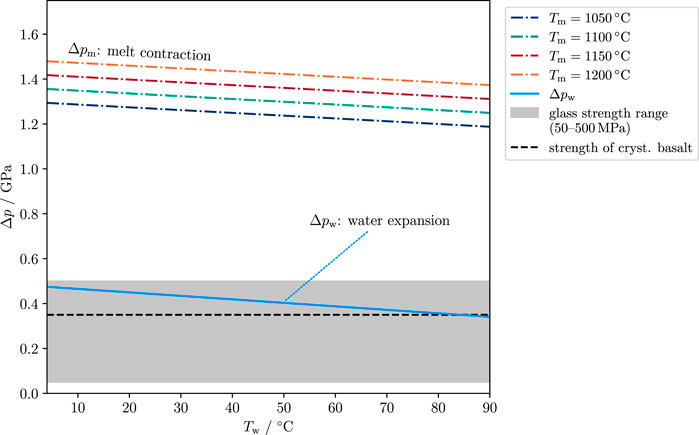
FIGURE 9. Estimate of pressure change in melt and water due to the sudden contact of the two liquid phases. Dash-dotted lines show the pressure change in the melt. The blue line shows the pressure change in the water. The gray area shows typical values for the compressive strength of glass (ca. 50–500 MPa, Brückner, 1970). The dashed black line (350 MPa) is a typical value for the compressive strength of crystalline basalt (Waltham, 2009).
Clearly, some caveats in this rough estimate exist: the temperature gap in the integration between TN and Tc is on the order of 200 K. It is clear that this temperature difference adds to the heat flux and thermal expansion, but is neglected here. Therefore, Equation 16 likely underestimates the acting pressure. The material properties are assumed to be constant. At least the heat capacity of water is known to increase in superheated states (Lienhard, 1977), and the material strengths of silicate melts under thermal shock conditions are likely not as high as their thermally stable counterparts. Therefore, one or both of Δpw and Δpm is likely underestimated here, while the strength may be overestimated. The nucleation temperature of the water is typically measured at constant pressure, and its sensitivity to pressure change is unclear, and subject to surface properties, such as wetting angles and roughness (Debenedetti, 1996). Another shortcoming of this formulation is that the two systems are only “coupled” by the temperature condition. It is clear that at least the confining pressure also plays a role. Δpw and Δpm only describe the thermally induced stress in each material. The total pressure acting across the interface depends on the specific geometry and the resulting material acceleration. However, each of the contributions Δpw and Δpm is large enough to overcome the compressive strength of the melt alone.
5 Conclusion
Our experiments show that water temperature is the primary factor that determines vapor film lifetime: between water temperatures of 3 and 93°C, the lifetime increases by a factor of 85. For a given water temperature, film lifetime increases by a factor of 3 over a distance of ca. 15 mm. Such small vertical changes are easily overcome in any realistic natural scenario. Therefore, when modeling magma–water heat transfer, film boiling lifetime should only assume ambient water temperatures locally around the lowest point of the heat source. Due to the sensitivity to vertical elevation, the question is not if film lifetime is increased compared to a static scenario, but how effective other factors, such as water flow, melt motion, deformation, and fracture generation, are. Neglecting these other factors, magma in contact with cold water will effectively create its own warm water conditions some cm above the lowest contact point, which allows for film lifetimes of several seconds, possibly more than 10 s. Whether or not it is possible to borrow from heat transfer of metal-based heat sources, which are thermally highly conductive as compared to magmatic materials, remains to be investigated.
The stability of vapor film plays a key role in efficiently pre-mixing magma and water, which is required for explosive molten–fuel coolant interaction. Using high-temperature laboratory experiments, this study systematically quantifies the time scale, thickness, and spatial dependency of vapor film. While our experiments were not designed to investigate energetic interactions between magma and water, the results obtained in this study likely provide better insights into the pre-mixing conditions during phreatomagmatic and explosive submarine volcanic eruptions. The presence and duration of stable vapor film also affect the non-explosive fragmentation of lava (Schmid et al., 2010; Sonder et al., 2011). The quantification of vapor film properties for a range of magmatic and water temperatures study sheds light on the dynamics of lava–water interaction during the non-explosive fragmentation and the generation of hyaloclastites, particularly under shallow submarine conditions. This study provides a basis for future investigation into the generation and stability of vapor films in contact with magma at elevated pressure conditions suitable under deep magmatic plumbing systems and submarine eruption settings.
The thermodynamic considerations in Section 3.4 show that rapid heat conduction is realistic and able to create large enough thermal stress to overcome the melt’s material strength and start fragmentation of liquid melt, emphasizing the role of film boiling in the MFCI process. The film collapse observed in our experiments was not forced by an external event, but occurred from the decreasing surface temperature of the melt sample. Therefore, the time scale of the collapse is a factor 105 to 107 larger than the estimated time scale for the initial direct liquid water to melt contact. To estimate thermal stresses as they occur in thermal granulation processes and other non-explosive situations, steady-state considerations are likely more appropriate (Kingery, 1955; Strobl et al., 2018; Moitra et al., 2020).
Data availability statement
All experimental data was compiled into a dataset and is publicly available at Zenodo (Sonder and Moitra, 2022, doi: 10.5281/zenodo.6950485). The complete code of the data analysis is available at the authors’ gitlab page (gitlab.com/isonder/vaporfilm-experiments) and is further specified in the Supplementary Material.
Author contributions
IS and PM conceptualized the project. PM worked on the experimental design and IS performed the experimental data analysis presented in this study. IS wrote the first draft. IS and PM edited and finalized the manuscript.
Funding
This work is supported by US National Science Foundation (NSF) grant OCE-2113770 to Sonder and OCE-2113709 to Moitra.
Acknowledgments
The authors would like to thank the three reviewers Nemeth, Murch and Dellino, as well as the editors Dürig and Acocella for their helpful comments, which very much improved the quality of this manuscript.
Conflict of interest
The authors declare that the research was conducted in the absence of any commercial or financial relationships that could be construed as a potential conflict of interest.
Publisher’s note
All claims expressed in this article are solely those of the authors and do not necessarily represent those of their affiliated organizations, or those of the publisher, the editors, and the reviewers. Any product that may be evaluated in this article, or claim that may be made by its manufacturer, is not guaranteed or endorsed by the publisher.
Supplementary material
The Supplementary Material for this article can be found online at: https://www.frontiersin.org/articles/10.3389/feart.2022.983112/full#supplementary-material
References
Allen, S., Fiske, R. S., and Cashman, K. (2008). Quenching of steam-charged pumice: Implications for submarine pyroclastic volcanism. Earth Planet. Sci. Lett. 274, 40–49. doi:10.1016/j.epsl.2008.06.050
Apfel, R. E. (1972). Water superheated to 279.5° C at atmospheric pressure. Nat. Phys. Sci. 238, 63–64. doi:10.1038/physci238063a0
Brückner, R. (1970). Properties and structure of vitreous silica. I. J. Non-Crystalline Solids 5, 123–175. doi:10.1016/0022-3093(70)90190-0
Büttner, R., Zimanowski, B., Blumm, J., and Hagemann, L. (1998). Thermal conductivity of a volcanic rock material (olivine-melilitite) in the temperature range between 288 and 1470 k. J. Volcanol. Geotherm. Res. 80, 293–302. doi:10.1016/s0377-0273(97)00050-4
Büttner, R., and Zimanowski, B. (1998). Physics of thermohydraulic explosions. Phys. Rev. E 57, 5726–5729. doi:10.1103/PhysRevE.57.5726
Cahalan, R., and Dufek, J. (2021). Explosive submarine eruptions: The role of condensable gas jets in underwater eruptions. J. Geophys. Res. Solid Earth 126, e2020JB020969. doi:10.1029/2020jb020969
Chadwick, W., Cashman, K., Embley, R., Matsumoto, H., Dziak, R., De Ronde, C., et al. (2008). Direct video and hydrophone observations of submarine explosive eruptions at nw rota-1 volcano, mariana arc. J. Geophys. Res. 113. doi:10.1029/2007jb005215
Cronenberg, A. W. (1980). Recent developments in the understanding of energetic molten fuel-coolant interactions. Nucl. Saf. 3, 319–337.
Debenedetti, P. G. (1996). Metastable liquids: Concepts and principles. Physical chemistry. Princeton, N.J: Princeton University Press.
Dhir, V. (1998). Boiling heat transfer. Annu. Rev. Fluid Mech. 30, 365–401. doi:10.1146/annurev.fluid.30.1.365
Dürig, T., White, J. D. L., Murch, A. P., Zimanowski, B., Büttner, R., Mele, D., et al. (2020). Deep-sea eruptions boosted by induced fuel–coolant explosions. Nat. Geosci. 13, 498–503. doi:10.1038/s41561-020-0603-4
Fauria, K. E., and Manga, M. (2018). Pyroclast cooling and saturation in water. J. Volcanol. Geotherm. Res. 362, 17–31. doi:10.1016/j.jvolgeores.2018.07.002
Fitch, E. P., Fagents, S. A., Thordarson, T., and Hamilton, C. W. (2017). Fragmentation mechanisms associated with explosive lava–water interactions in a lacustrine environment. Bull. Volcanol. 79, 12–16. doi:10.1007/s00445-016-1087-3
Fletcher, D. (1995). Steam explosion triggering: A review of theoretical and experimental investigations. Nucl. Eng. Des. 155, 27–36. doi:10.1016/0029-5493(94)00865-V
Graettinger, A. H., Skilling, I., McGarvie, D., and Höskuldsson, Á. (2013). Subaqueous basaltic magmatic explosions trigger phreatomagmatism: a case study from askja, Iceland. J. Volcanol. Geotherm. Res. 264, 17–35. doi:10.1016/j.jvolgeores.2013.08.001
Hamilton, C. W., Fagents, S. A., and Thordarson, T. (2011). Lava–ground ice interactions in elysium planitia, Mars: geomorphological and geospatial analysis of the tartarus colles cone groups. J. Geophys. Res. 116, E03004. doi:10.1029/2010je003657
Houghton, B., White, J. D., and Van Eaton, A. R. (2015). “Phreatomagmatic and related eruption styles,” in The encyclopedia of volcanoes (Netherlands: Elsevier), 537–552.
Huber, M. L., Perkins, R. A., Friend, D. G., Sengers, J. V., Assael, M. J., Metaxa, I. N., et al. (2012). New international formulation for the thermal conductivity of H2O. J. Phys. Chem. Reference Data 41, 033102. doi:10.1063/1.4738955
Incropera, F. P., DeWitt, D. P., Bergman, T. L., and Lavine, A. S. (2007). Introduction to heat transfer. New Jersey: John Wiley & Sons.
Kingery, W. D. (1955). Factors affecting thermal stress resistance of ceramic materials. J. Am. Ceram. Soc. 38, 3–15. doi:10.1111/j.1151-2916.1955.tb14545.x
Kokelaar, P. (1986). Magma-water interactions in subaqueous and emergent basaltic. Bull. Volcanol. 48, 275–289. doi:10.1007/bf01081756
Kuryaeva, R. G., and Kirkinskii, V. A. (1997). Influence of high pressure on the refractive index and density of tholeiite basalt glass. Phys. Chem. Minerals 25, 48–54. doi:10.1007/s002690050085
Landau, L. D., and Lifshitz, E. M. (1970). Theory of elasticity of Course of theoretical physics. second edn. Oxford: Pergamon Press.
Leidenfrost, J. G. (1966). On the fixation of water in diverse fire. Int. J. Heat Mass Transf. 9, 1153–1166. doi:10.1016/0017-9310(66)90111-6
Lienhard, J. H. (1977). Estimation of specific heat of superheated water. Nucl. Sci. Eng. 62, 302–304. doi:10.13182/NSE77-A26965
Liu, E., Cashman, K., Rust, A., and Gislason, S. (2015). The role of bubbles in generating fine ash during hydromagmatic eruptions. Geology 43, 239–242. doi:10.1130/g36336.1
Manga, M., Fauria, K. E., Lin, C., Mitchell, S. J., Jones, M., Conway, C. E., et al. (2018). The pumice raft-forming 2012 havre submarine eruption was effusive. Earth Planet. Sci. Lett. 489, 49–58. doi:10.1016/j.epsl.2018.02.025
McBirney, A. R. (1963). Factors governing the nature of submarine volcanism. Bull. Volcanol. 26, 455–469. doi:10.1007/bf02597304
Moitra, P., Horvath, D. G., and Andrews-Hanna, J. C. (2021). Investigating the roles of magmatic volatiles, ground ice and impact-triggering on a very recent and highly explosive volcanic eruption on Mars. Earth Planet. Sci. Lett. 567, 116986. doi:10.1016/j.epsl.2021.116986
Moitra, P., Sonder, I., and Valentine, G. A. (2018). Effects of size and temperature-dependent thermal conductivity on the cooling of pyroclasts in air. Geochem. Geophys. Geosyst. 19, 3623–3636. doi:10.1029/2018GC007510
Moitra, P., Sonder, I., and Valentine, G. A. (2020). The role of external water on rapid cooling and fragmentation of magma. Earth Planet. Sci. Lett. 537, 116194. doi:10.1016/j.epsl.2020.116194
Moitra, P., and Sonder, I. (2022). Vapor bubbles and velocity control on the cooling rates of lava and pyroclasts during submarine eruptions. JGR. Solid Earth 127, e2022JB024665. doi:10.1029/2022jb024665
Murch, A. P., White, J. D., Barreyre, T., Carey, R. J., Mundana, R., and Ikegami, F. (2020). Volcaniclastic dispersal during submarine lava effusion: the 2012 eruption of havre volcano, kermadec arc, New Zealand. Front. Earth Sci. (Lausanne). 8, 237. doi:10.3389/feart.2020.00237
Németh, K., and Kósik, S. (2020). Review of explosive hydrovolcanism. Geosciences 10, 44. doi:10.3390/geosciences10020044
Schindelin, J., Arganda-Carreras, I., Frise, E., Kaynig, V., Longair, M., Pietzsch, T., et al. (2012). Fiji: An open-source platform for biological-image analysis. Nat. Methods 9, 676–682. doi:10.1038/nmeth.2019
Schipper, C. I., Sonder, I., Schmid, A., White, J. D., Dürig, T., Zimanowski, B., et al. (2013). Vapour dynamics during magma–water interaction experiments: hydromagmatic origins of submarine volcaniclastic particles (limu o pele). Geophys. J. Int. 192, 1109–1115. doi:10.1093/gji/ggs099
Schmid, A., Sonder, I., Seegelken, R., Zimanowski, B., Büttner, R., Gudmundsson, M. T., et al. (2010). Experiments on the heat discharge at the dynamic magma-water-interface. Geophys. Res. Lett. 37, L20311. doi:10.1029/2010GL044963
Skilling, I. P., White, J. D., and McPhie, J. (2002). Peperite: a review of magma–sediment mingling. J. Volcanol. Geotherm. Res. 114, 1–17. doi:10.1016/s0377-0273(01)00278-5
Sonder, I., Harp, A. G., Graettinger, A. H., Moitra, P., Valentine, G. A., Büttner, R., et al. (2018). Meter-scale experiments on magma-water interaction. J. Geophys. Res. Solid Earth 123, 10597–10615. doi:10.1029/2018jb015682
Sonder, I., and Moitra, P. (2022). Vapor film lifetime at magma-water interface. doi:10.5281/ZENODO.6950485
Sonder, I., Schmid, A., Seegelken, R., Zimanowski, B., and Büttner, R. (2011). Heat source or heat sink: What dominates behavior of non-explosive magma-water interaction? J. Geophys. Res. 116, B09203. doi:10.1029/2011jb008280
Soule, S. A., Fornari, D. J., Perfit, M. R., Ridley, W. I., Reed, M. H., and Cann, J. R. (2006). Incorporation of seawater into mid-ocean ridge lava flows during emplacement. Earth Planet. Sci. Lett. 252, 289–307. doi:10.1016/j.epsl.2006.09.043
Strobl, S., Adlmann, F.-A., Supancic, P., Lube, T., Danzer, R., and Schöppl, O. (2018). Fracture toughness of silicon nitride balls via thermal shock. J. Eur. Ceram. Soc. 38, 1278–1287. doi:10.1016/j.jeurceramsoc.2017.11.005
Vakarelski, I. U., Patankar, N. A., Marston, J. O., Chan, D. Y., and Thoroddsen, S. T. (2012). Stabilization of leidenfrost vapour layer by textured superhydrophobic surfaces. Nature 489, 274–277. doi:10.1038/nature11418
Valentine, G. A., and White, J. D. (2012). Revised conceptual model for maar-diatremes: Subsurface processes, energetics, and eruptive products. Geology 40, 1111–1114. doi:10.1130/g33411.1
van Otterloo, J., Cas, R. A., and Scutter, C. R. (2015). The fracture behaviour of volcanic glass and relevance to quench fragmentation during formation of hyaloclastite and phreatomagmatism. Earth-Science Rev. 151, 79–116. doi:10.1016/j.earscirev.2015.10.003
White, J. D., and Ross, P.-S. (2011). Maar-diatreme volcanoes: a review. J. Volcanol. Geotherm. Res. 201, 1–29. doi:10.1016/j.jvolgeores.2011.01.010
White, J. (1996). Impure coolants and interaction dynamics of phreatomagmatic eruptions. J. Volcanol. Geotherm. Res. 74, 155–170. doi:10.1016/s0377-0273(96)00061-3
Wilson, L., and Head, J. W. (2004). Evidence for a massive phreatomagmatic eruption in the initial stages of formation of the mangala valles outflow channel, Mars. Geophys. Res. Lett. 31, L15701. doi:10.1029/2004gl020322
Wohletz, K., Zimanowski, B., and Büttner, R. (2013). Magma-water interactions. Modeling volcanic processes. New York: Cambridge University Press, 230–257.
Zimanowski, B., and Büttner, R. (2003). “Explosive subaqueous volcanism,” in Phreatomagmatic explosions in subaqueous eruptions (USA: American Geophysical Union Geophysical Monograph Series), 140, 51.
Zimanowski, B., Büttner, R., and Lorenz, V. (1997a). Premixing of magma and water in mfci experiments. Bull. Volcanol. 58, 491–495. doi:10.1007/s004450050157
Zimanowski, B., Büttner, R., and Nestler, J. (1997b). Britte reaction of a high-temperature ion melt. Europhys. Lett. 38, 285–290. doi:10.1209/epl/i1997-00239-3
Zimanowski, B., Dellino, P., and Büttner, R. (2015). “Magma-water interaction and phreatomagmatic fragmentation,” in The encyclopedia of volcanoes. Editors H. Sigurdsson, B. Houghton, H. Rymer, J. Stix, and S. McNutt. Second edn (Cambridge: Academic Press), 473–484. chap. 26. doi:10.1016/B978-0-12-385938-9.00026-2
Keywords: magma–water interaction, vapor film, film boiling, Leidenfrost effect, phreatomagmatic, submarine volcanic eruptions, thermohydraulic explosion
Citation: Sonder I and Moitra P (2022) Experimental constraints on the stability and oscillation of water vapor film—a precursor for phreatomagmatic and explosive submarine eruptions. Front. Earth Sci. 10:983112. doi: 10.3389/feart.2022.983112
Received: 30 June 2022; Accepted: 12 September 2022;
Published: 03 October 2022.
Edited by:
Tobias Dürig, University of Iceland, IcelandReviewed by:
Karoly Nemeth, Massey University, New ZealandArran Peter Murch, National Museum of Nature and Science, Japan
Pierfrancesco Dellino, University of Bari Aldo Moro, Italy
Copyright © 2022 Sonder and Moitra. This is an open-access article distributed under the terms of the Creative Commons Attribution License (CC BY). The use, distribution or reproduction in other forums is permitted, provided the original author(s) and the copyright owner(s) are credited and that the original publication in this journal is cited, in accordance with accepted academic practice. No use, distribution or reproduction is permitted which does not comply with these terms.
*Correspondence: Ingo Sonder, aW5nb21hcmtAYnVmZmFsby5lZHU=
 Ingo Sonder
 Pranabendu Moitra