- 1Tunnel and Underground Space Academy, Zhejiang University of Science and Technology, Hangzhou, Zhejiang, China
- 2Institute of Rock Mechanics, Ningbo University, Ningbo, Zhejiang, China
- 3Department of Civil Engineering, Shaoxing University, Shaoxing, Zhejiang, China
The uneven deformation of filled rock joints subjected to ground stress can easily cause instability in engineering rock masses. Fluctuations in morphology and filling are the main factors affecting the normal deformation of filled rock joints. To study the effect of the degree of filling and the degree of morphology fluctuation on the normal deformation of filled rock joints, we conducted a systematic experimental study. First, rock joints with joint roughness coefficients of 1,5, 9, 13, and 17 were selected based on Barton’s typical curves. Then, filled rock joint samples were made using a self-developed filled rock joint sample mold and three-dimensional engraving technology. Lastly, compression tests were carried out to analyze the effect of the degree of filling and the degree of morphology fluctuation on the normal deformation characteristics of filled rock joints. The results show that the degree of filling significantly affects the normal deformation of filled rock joint samples. The normal deformation of filled rock joints has a nonlinear relationship with normal stress. The power function equation can well represent the normal closure deformation behavior of filled rock joints. Additionally, a relationship between the maximum closure deformation of filled rock joints and the degree of filling was established based on Bandis’s empirical formula. The proposed equation takes into account the effect of the degree of filling by replacing the rock joint opening with filling thickness, and the predicted values are in good agreement with the experimental results.
1 Introduction
The normal deformation of rock joints is an important mechanical behavior of rock masses, which can have a major effect on the safe construction and production operation of many engineering projects, such as oil or gas exploitation, enhanced geothermal systems, and the underground disposal of nuclear waste (Muller, 1977). The uneven deformation of rock joints can easily cause instability in engineering rock masses, resulting in engineering accidents. Therefore, it is of great importance to engineering to conduct experimental studies on the normal deformation characteristics of filled rock joints. Scholars have carried out extensive experimental and theoretical studies into the normal closure deformation of jointed rock masses and have obtained some important results.
In laboratory investigations into the normal deformation characteristics of rock joints, Makurat et al. (1995) conducted normal cyclic loading and unloading tests on natural rock joints using a CSFT device and obtained a normal stress-closure deformation curve of rock joints. Qiao and Li. (2016) suggested that the relationship between the normal stress and rock joint closure deformation is typically nonlinear, based on compression test results. Zhao (2017) conducted an experimental study on the loading rate effect of the normal deformation of rock joints and obtained the relationship between normal deformation and loading rate. Yuan (2017) revealed the variation law of maximum normal deformation, initial normal stiffness, and rock joint opening degree with joint roughness coefficient (JRC), by conducting normal compression tests of rock joints with different morphologies. Luo and Jiang (2021) studied the effect of stress on the mechanical properties of rock joints. Huang et al. (2022) analyzed the interaction mechanism between stress and liquid-filled rock joints.
In establishing a constitutive model, Shehata (1971) and Sun (1983) suggested that a power function model and a semi-pair function model could fit well the normal stress-rock joint closure deformation curve, but the power function model was not able to predict the maximum rock joint closure deformation. Then, a hyperbolic equation was proposed by Bandis et al. (1983) and later modified by Bandis and Barton (1985) to improve the prediction performance. Two free parameters, the maximum rock joint closure and initial normal stiffness, were used to shape the hyperbola. Saeb and Amadei (1992) proposed an analytical equation to predict the maximum rock joint closure of an opened rock joint. Additionally, Malama and Kulatilake (2003) established a unified index model based on the deviation between the predicted results of a modified hyperbolic model and test data. Furthermore, Guo and Su (2010) used five different models to fit the normal stress-closure deformation curve. Their results showed that the modified hyperbolic model could well represent the normal deformation behavior of rock joints. Wu and Gao (2015) used a hyperbolic model to fit the normal stress-closure deformation curves obtained from the normal cyclic loading-unloading test and realized for the first time the numerical simulation analysis of cyclic loading-unloading. Zhang and Ding (2017) considered that the power function model can be used to represent the relationship between normal stress and rock joint closure deformation in different load stages under low stress conditions. Li and Cui (2021) analyzed the variation rule of parameters in the power function equation by performing a numerical simulation.
In summary, although scholars have carried out extensive studies into the normal deformation characteristics of rock joints, there have been few studies of filled rock joints. This paper presents the results of a systematic study of the normal deformation characteristics of filled rock joints with different fluctuation morphologies. We propose a new formula that can better represent the relationship between maximum closure deformation of filled rock joints and the degree of filling, based on Bandis’s empirical formula, and its performance was verified using test results.
2 Methodology
2.1 Multifunctional rock-soil contact damage test system
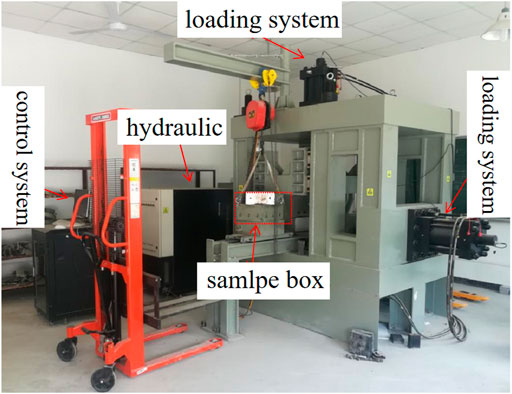
All of the compression tests of rock joints with differing degrees of morphology fluctuation and filling were conducted using a multifunctional rock-soil contact damage test system. The test system was composed of a loading system, sample box system, control system, and hydraulic system, as shown in Figure 1. Loading stress was provided by a MOOG D633 1000 kN hydraulic actuator, and the maximum pressure was 1000 kN. A force sensor and a displacement sensor were fixed on the axial steel columns to monitor the pressure and axial deformation of the samples. The technical parameters of the multifunctional rock-soil contact damage test system are shown in Table 1.
2.2 Test material
2.2.1 Rock samples
For tests, the upper and lower specimens of rock joints usually comprise a similar material or natural rock. To make the mechanical properties of the rock samples the same as the field rock mass, diabase was used in this study.
A uniaxial test of the diabase was carried out using rock triaxial apparatus (MATEST C089-19CR), and the compressive strength was found to be 113.6 MPa.
2.2.2 Typical fluctuation morphology of rock joints
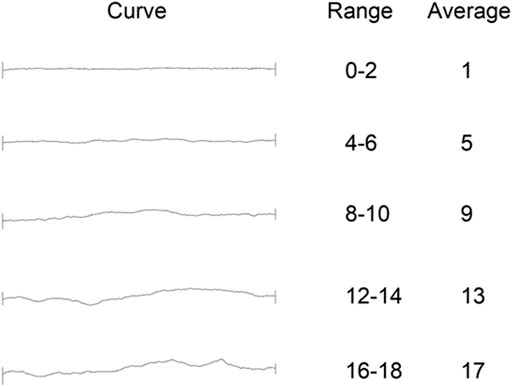
Fluctuation morphology is a major factor that affects the normal deformation of rock joints. To study the effect of the degree of morphology fluctuation on the normal closure deformation of filled rock joint, rock joints with JRCs of 1, 5, 9, 13, and 17 were selected based on a typical Barton curve, as shown in Figure 2.
According to the method for the quantitative description of rock joints recommended by the International Society of Rock Mechanics, the average degree of fluctuation of a rock joint profile is used as a quantitative parameter to describe the degree of fluctuation of rock joint morphology. The average degree of fluctuation of rock joints is defined as:
Where a1 is the left morphology degree of fluctuation, mm; a2 is the right morphology degree of fluctuation, mm.
The average degree of fluctuation of a selected Barton curve is shown in Table 2.
2.2.3 Filling
Rock joints generate interlayer fracture zones under the action of weathering, ground stress, and other factors, and rock is broken, forming fillings. Diabase fragments were used as the filling material in this study, and the filling acquisition process is shown in Figure 3. Diabase fragments were produced using a three-dimensional (3D) numerical control engraving machine. Then, fragments with particle size less than 1 mm were collected after screening. Lastly, a filling with a moisture content of 5% was prepared after adding an appropriate quantity of water to the fragments.

FIGURE 3. Filling production process: (A) diabase fragments produced; (B) fragments with particle size less than 1 mm; and (C) filling with a moisture content of 5%.
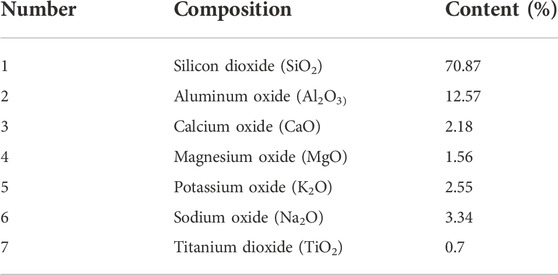
The composition and content of the filling are shown in the Table 3:
2.3 Sample preparation
2.3.1 Engraving of rock joint fluctuation morphology
It is difficult to obtain natural rock joints in the field, and some rock joint conditions can barely meet the test design requirements. Therefore, in this study 3D engraving technology was used to sample rock joints with different fluctuation morphologies. First, a model of rock joint morphology was established using modeling software. Next, a path file was generated using path processing software, which was then imported into the engraving control software. Lastly, rock joints were engraved using the numerical engraving machine, as shown in Figure 4.

FIGURE 4. (A) Engraving machine; (B) the path file generated; (C) the engraving process; and (D) an engraved rock joint sample.
2.3.2 Preparation of filled rock joint samples
The pre-experiment showed that the following relationship between filling mass and thickness exists:
Where
Compression test results showed that the filling thickness was 5.1 mm after preloading on a filled rock joint sample with a filling mass of 200 g. Thus, the coefficient
The preparation of filled rock joint samples is a key process in compression tests. The production process is as follows. First, the lower rock joint specimen is placed in the sample box, and then the prepared filling is added to the lower rock joint specimen in three layers. Finally, the upper rock joint specimen is placed on the filling. The specific process is shown in Figure 5.

FIGURE 5. Sample preparation process: (A) rock joint lower specimen; (B) filling is added; and (C) rock joint upper specimen.
2.4 Test plan
The compression tests were carried out under a lateral limit to prevent filling extrusion. A normal stress of 12.5 MPa was determined, to avoid the occurrence of fractures in the rock joint sample during the loading stage. This experiment was divided into five groups, with each group containing five rock joint samples with filling degrees k of 0, 0.5, 1, 1.5, and 2. The specific test scheme is shown in Table 4.
3 Analysis of test results
3.1 The normal stress-closure deformation curve of unfilled rock joints
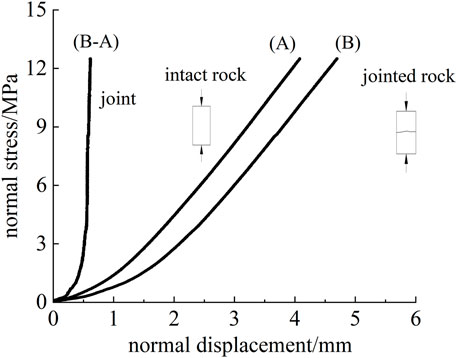
Figure 6 shows the normal stress-closure deformation curve of an intact sample and that of a rock jointed sample. The closure deformation of rock joints was calculated by the normal deformation of the rock jointed sample minus that of the intact sample.
Figure 7 shows the curves of normal stress-closure deformation of unfilled rock joints and initial normal stiffness-JRC of unfilled rock joints. It can be seen from Figure 7A that the closure deformation of rock joints has a nonlinear relationship with normal stress. Closure deformation shows an increasing trend with the increase of normal stress. Additionally, there is a critical value of normal stress in a normal stress-closure deformation curve. Closure deformation of the rock joint increases rapidly with the increase of normal stress, when the normal stress is lower than the critical value. The increasing rate of closure deformation slows down as the normal stress exceeds the critical value. The test results (Figure 7B) indicate that closure deformation of unfilled rock joints decreases and initial normal stiffness increases with the increasing degree of morphology fluctuation.
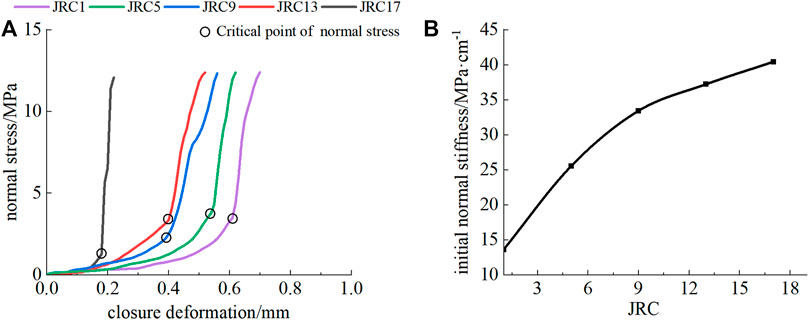
FIGURE 7. (A) Normal stress-closure deformation curve of an unfilled rock joint and (B) initial normal stiffness-JRC curve of an unfilled rock joint.
3.2 The normal stress-closure deformation curve of filled rock joints
Figure 8 shows the curves of normal stress-closure deformation of filled rock joints under different degrees of filling. It can be seen from Figure 8 that closure deformation of filled rock joints increases with the increase of normal stress and that the curve possesses a high degree of nonlinearity. The primary reason is that filling is the main factor affecting the normal closure deformation of filled rock joints, and the deformation of filled rock joints is significantly greater than that of unfilled rock joints.
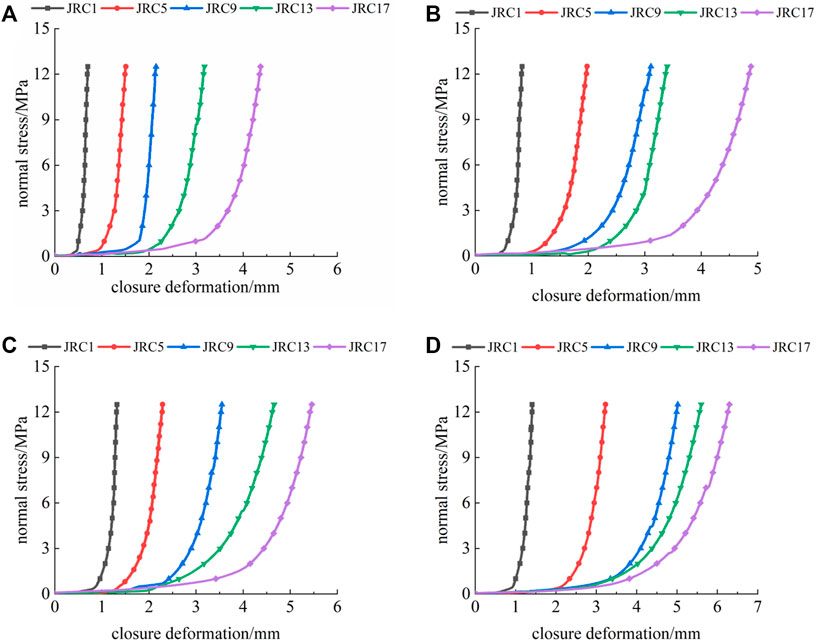
FIGURE 8. Normal stress-closure deformation curve of a filled rock joint under different degrees of filling: (A) k=0.5; (B) k=1.0; (C) k=1.5; and (D) k=2.
Figure 9 shows the curve of normal stress-closure deformation of filled rock joints under same filling thickness. The test results indicate that under same filling thickness, rock joint closure deformation decreases with the increasing degree of morphology fluctuation.
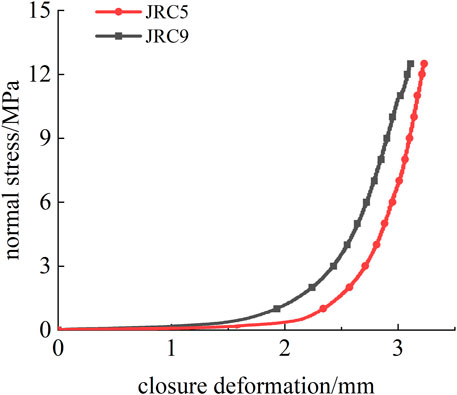
FIGURE 9. Normal stress-closure deformation curve of a filled rock joint under the same filling thickness.
3.3 The normal stress-closure deformation curve of filled rock joints in the loading-unloading stage
Figure 10 shows the curve of normal stress-closure deformation of a filled rock joint sample in the loading-unloading stage. It can be seen from Figure 10 that the filled rock joint sample exhibits a hysteresis loop between the loading and unloading paths. An irreversible deformation is observed after unloading. The irreversible deformation of a high degree of filling (k=2) rock jointed sample is significantly greater than the low degree of filling (k=0.5) rock jointed sample. The main reason is that the degree of filling contributes more to hysteresis and irrecoverable deformation than the degree of morphology fluctuation does.
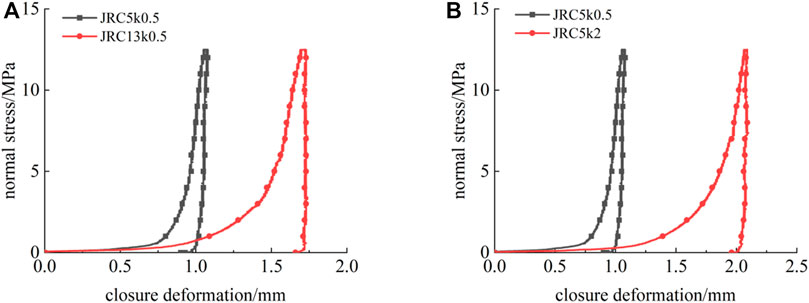
FIGURE 10. Normal stress-closure deformation curve of a filled rock joint sample in the loading-unloading stage: (A) k=0.5 and (B) JRC=5.
4 Normal closure characteristics of filled rock joints
4.1 Normal stress-closure deformation relationship of filled rock joints
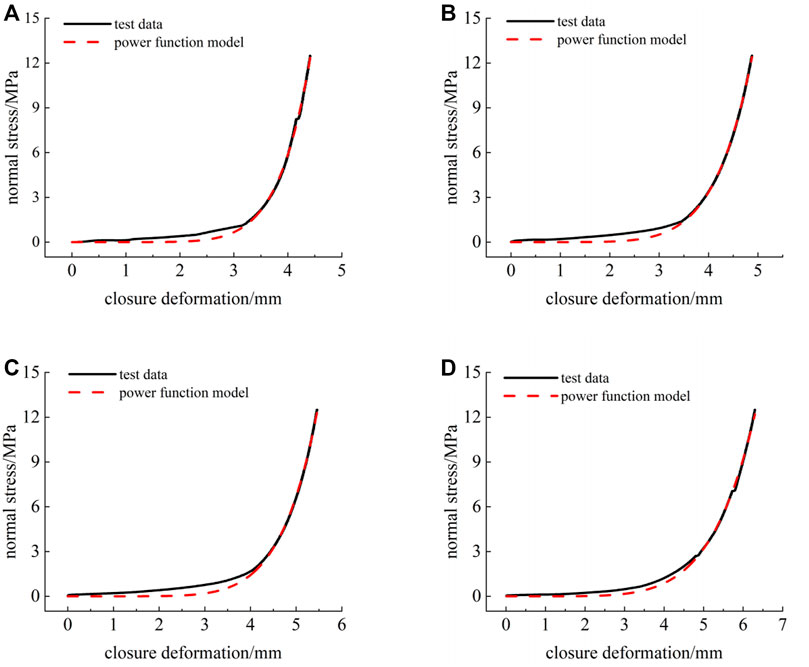
The power function is a commonly used normal constitutive model of rock joints. A test curve of filled rock joints with a JRC of 17 was fitted using a power function model. The results are shown in Figure 11, and the fitting parameters are shown in Table 5. The test results show that the power function equation can well represent the normal deformation behavior of filled rock joints. The fitting correlation coefficients between the power function model and a test curve under different filling degrees are greater than 0.99. Nevertheless, the values predicted by the power function model show deviation from the test results in the early stage of loading, but the degree of agreement between test results and predicted values is high in the later stages of loading. Additionally, the fitting of parameters a and b of the model shows an increasing trend with the increase in the degree of filling. The fitting curve can stably represent the normal deformation behavior of filled rock joints.
4.2 Influence of the degree of morphology fluctuation on the normal closure characteristics of filled rock joints
Existing experimental studies show that the deformation of rock jointed rock changes from rock joint closure to elastic deformation of rock as the normal stress is 1/3
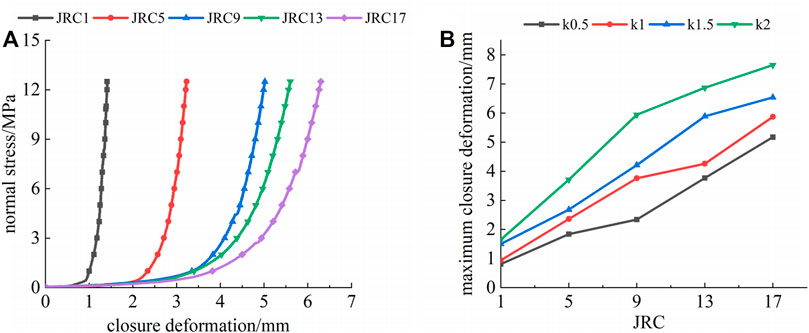
FIGURE 12. Effect of the degree of morphology fluctuation on the normal closure deformation characteristics of filled rock joints: (A) normal stress-closure deformation curve of a filled rock joint (k=2) and (B) maximum closure deformation-JRC curve of a filled rock joint.
Figure 12B shows the curve of the maximum closure deformation-JRC. It can be seen from Figure 12B that under the same degree of morphology fluctuation, the maximum closure deformation of filled rock joints increases as the degree of filling increases. The primary reason is that the closure deformation of filled rock joints is mainly caused by the deformation due to filling. Additionally, under the same degree of filling, the maximum closure deformation of filled rock joints increases with the increase in the degree of morphology fluctuation.
Bandis proposed a formula that can represent the relationship between maximum closure deformation of unfilled rock joints and morphology fluctuation degree, based on a large number of experiments, as shown in Eq. 3.
Where
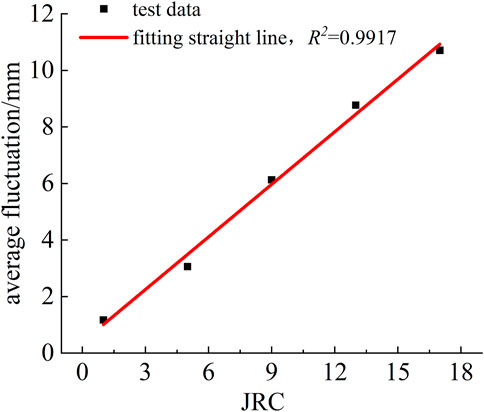
As shown in Figure 13, a high degree of linearity can be possessed by average fluctuation degree-JRC curve. To consider the effect of the degree of filling on the maximum closure deformation of rock joints, the rock joint opening e in Eq. 3 is replaced with filling thickness. The specific equation is shown in Eq. 4.
Where t is the filling thickness, mm; k is the degree of filling; and M and N are fitting parameters.
The parameters M and N obtained by fitting the test curve are 0.6197 and 0.3902, respectively. The relationship between maximum closure deformation of filled rock joints and the degree of filling is as follows:
Eq. 5 is used to fit the maximum closure deformation-JRC curve under different degrees of filling, and the results are shown in Figure 14. It can be seen from Figure 14 that the modified empirical formula of Bandis can well fit the maximum closure deformation of the filled rock joint-JRC curve, with a fitting correlation coefficient that is higher than 0.95. The degree of agreement between test results and predicted values from the modified formula is high.
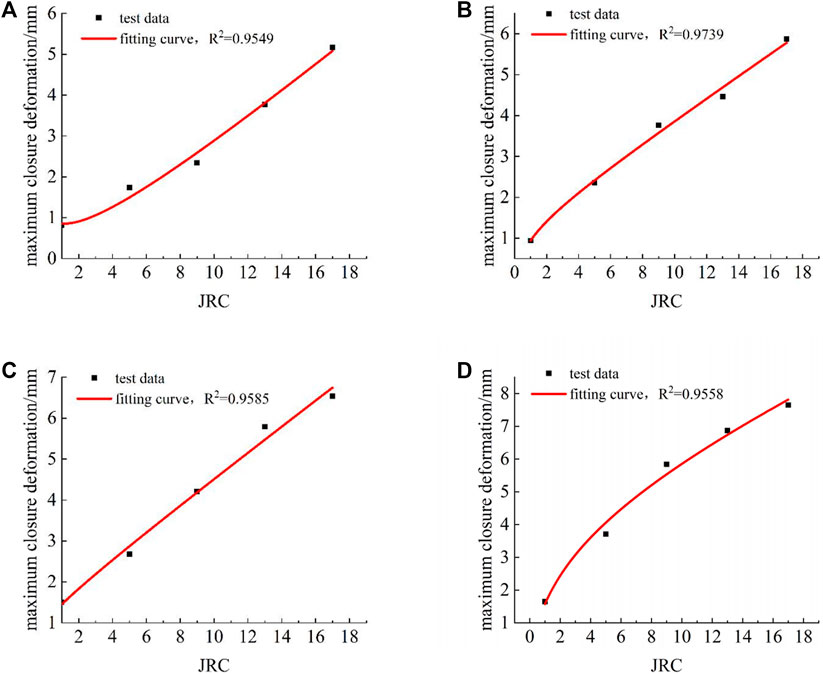
FIGURE 14. Maximum closure deformation-JRC curve under different degrees of filling: (A) k=0.5; (B) k=1.0; (C) k=1.5; and (D) k=2.
4.3 Influence of the degree of filling on the normal closure characteristics of rock joints
Figure 15A shows the normal stress-closure deformation curve of rock joints with different degrees of filling. The test results (Figure 15A) indicate that the variation law of closure deformation of filled rock joints is approximately consistent under different degrees of filling. The closure deformation of filled rock joints increases with the increase in the degree of filling, and the closure deformation of unfilled rock joints is the smallest.
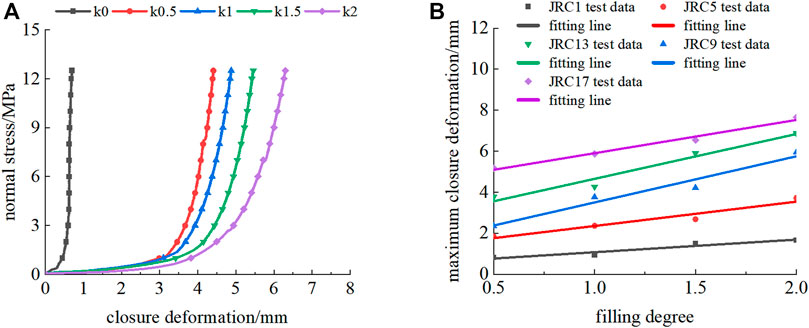
FIGURE 15. Effect of the degree of filling on the normal closure deformation characteristics of a rock joint: (A) normal stress-closure deformation curve of a filled rock joint (JRC=17) and (B) maximum closure deformation-filling degree curve.
The maximum closure deformation-filling degree curve of filled rock joints is fitted by a linear function of
5 Conclusion
Fluctuations in morphology and filling are the main factors affecting the normal deformation of filled rock joints. We conducted a systematic experimental study to investigate the effect of the degree of filling and the degree of morphology fluctuation on the normal deformation of filled rock joints. The main conclusions are as follows:
1) The degree of filling significantly affects the normal deformation of filled rock joint samples. The normal closure deformation of filled rock joints increases with the increase in the degree of filling.
2) Under the same filling thickness, the normal closure deformation of filled rock joints decreases and initial normal stiffness increases with the increase in the degree of morphology fluctuation.
3) A filled rock joint sample exhibits a hysteresis loop between the loading and unloading paths. Irreversible deformation is observed after unloading, and the deformation of a large degree of filling (k=2) of a rock jointed sample is significantly greater than a small degree of filling (k=0.5) rock jointed sample.
4) Under normal stress, the normal deformation behavior of filled rock joints is nonlinear, and the stiffness of rock joints increases with increasing closure deformation. The power function equation can well represent the normal deformation behavior of filled rock joints.
5) A formula that describes the relationship between the maximum closure deformation of filled rock joints and the degree of filling was established based on Bandis’s empirical formula. The formulation takes into account the effect of the degree of filling by replacing the rock joint opening with filling thickness. The degree of agreement between test results and the predicted values from the modified formula is high.
Data availability statement
The raw data supporting the conclusions of this article will be made available by the authors, without undue reservation.
Author contributions
ZL and WZ were responsible for the acquisition and analysis of experimental data and general writing of the manuscript; SD put forward the idea and designed the study; MH was consulted on some issues; CW completed the revision of some figures and improvements in the language.
Funding
This work was supported by the National Natural Science Foundation of China (No. 42277147) and the Special Support Plan for High Level Talents of Zhejiang Province (2020R52028).
Conflict of interest
The authors declare that the research was conducted in the absence of any commercial or financial relationships that could be construed as a potential conflict of interest.
Publisher’s note
All claims expressed in this article are solely those of the authors and do not necessarily represent those of their affiliated organizations, or those of the publisher, the editors and the reviewers. Any product that may be evaluated in this article, or claim that may be made by its manufacturer, is not guaranteed or endorsed by the publisher.
References
Bandis, S. C., Barton, N. R., and Bakhtar, K. (1985). Strength, deformation and conductivity coupling of rock joints. Int. J. Rock Mech. Min. Sci. Geomechanics Abstr. 22 (3), 121–140. doi:10.1016/0148-9062(85)93227-9
Bandis, S. C., Lumsden, A. C., and Barton, N. R. (1983). Fundamentals of rock joint deformation. Int. J. rock Mech. Min. Sci. geomechanics Abstr. 20 (6), 249–268. doi:10.1016/0148-9062(83)90595-8
Guo, B., and Su, C. (2010). Fitting analysis of normal closure curve of coarse-grained marble fractures[C]. Chin. J. Rock Mech. Eng. 20, 105.
Huang, J., Liu, X., Song, D., Zhao, J., Wang, E., and Zhang, J. (2022). Laboratory-scale investigation of response characteristics of liquid-filled rock joints with different joint inclinations under dynamic loading. J. Rock Mech. Geotechnical Eng. 14 (2), 396–406. doi:10.1016/j.jrmge.2021.08.014
Li, B., and Cui, X. (2021). Study on deformation behavior of dislocation fracture in sandstone under normal stress[J]. Rock Soil Mech. 42 (07), 1850–1860. doi:10.16285/j.rsm.2020.1802
Liu, Y., and Tang, H. (1999). Rock Mechanics[M]. Wu Han, China: China University of Geosciences Press, 75–80.
Luo, Z., Jiang, M., Mo, L., Zou, B., and Huang, M. (2021). Stress effect & scale effect on shear properties of double saw-tooth rock joint surface. Appl. Rheol. 31 (1), 39–49. doi:10.1515/arh-2020-0117
Makurat, A., Ahola, M., Khair, K., Noorishad, J., Rosengren, L., and Rutqvist, J. (1995). The DECOVALEX test—case one. Int. J. Rock Mech. Min. Sci. Geomechanics Abstr. 32 (5), 399–408. doi:10.1016/0148-9062(95)00032-C
Malama, B., and Kulatilake, P. H. S. W. (2003). Models for normal fracture deformation under compressive loading. Int. J. Rock Mech. Min. Sci. 40 (6), 893–901. doi:10.1016/S1365-1609(03)00071-6
Muller, L. (1977). The use of deformation measurements in dimensioning the lining of subway tunnels[C]. International symposium on field measurements in rock Mechanics. Zurich 2, 451–471. doi:10.1016/0148-9062(79)90590-4
Qiao, L., and Li, Q. (2016). Normal deformation characteristics of structural plane under rock wall deformation conditions[J]. J. Northeast. Univ. Nat. Sci. 37 (10), 1479–1484. doi:10.3969/j.issn.1005-3026.2016.10.024
Saeb, S., and Amadei, B. (1992). Modelling rock joints under shear and normal loading. Int. J. rock Mech. Min. Sci. geomechanics Abstr. 29 (3), 267–278. doi:10.1016/0148-9062(92)93660-C
Shehata, W. M. (1971). Geohydrology of mount vernon canyon area [D]. Jefferson County, Colorado: Colorado School of Mines. PhD Thesis.
Sun, Z. (1983). Fracture Mechanics and tribology of rocks androck joint. Lulea Univ. Technol. 20 (4), 102. doi:10.1016/0148-9062(83)90977-4
Wu, S., and Gao, Y. (2015). Study on mechanical characteristics of rock joint under normal cyclic loading and unloading[J]. Chin. J. Rock Mech. Eng. 34 (S2), 3683–3693. doi:10.13722/j.cnki.jrme.2015.0610
Yuan, B. (2017). Study on influence of coincidence degree on rock joint normal deformation characteristics[D]. Nan Jing, China: Nan Jing University. doi:10.27235/d.cnki.gnjiu.2017.000383
Zhang, Y., and Ding, X. (2017). Study on normal cyclic loading deformation characteristics of natural structural plane with thickness. [J]. Rock Soil Mech. 38 (10), 2865–2872. doi:10.16285/j.rsm.2017.10.012
Keywords: rock joint, normal deformation, compression test, filling degree, fluctuation morphology
Citation: Luo Z, Zheng W, Du S, Huang M and Wang C (2023) Experimental study on normal deformation characteristics of filled rock joints with typical fluctuation morphology. Front. Earth Sci. 10:982939. doi: 10.3389/feart.2022.982939
Received: 30 June 2022; Accepted: 20 September 2022;
Published: 10 January 2023.
Edited by:
Bo Li, Tongji University, ChinaCopyright © 2023 Luo, Zheng, Du, Huang and Wang. This is an open-access article distributed under the terms of the Creative Commons Attribution License (CC BY). The use, distribution or reproduction in other forums is permitted, provided the original author(s) and the copyright owner(s) are credited and that the original publication in this journal is cited, in accordance with accepted academic practice. No use, distribution or reproduction is permitted which does not comply with these terms.
*Correspondence: Changshuo Wang, wcshuo@126.com; Zhanyou Luo, lzy0395@163.com
 Zhanyou Luo1,2,3*