 Hedi Ma
 Ruili Wang2
 Xing Li
 Hao Yang
95% of researchers rate our articles as excellent or good
Learn more about the work of our research integrity team to safeguard the quality of each article we publish.
Find out more
ORIGINAL RESEARCH article
Front. Earth Sci. , 01 September 2022
Sec. Atmospheric Science
Volume 10 - 2022 | https://doi.org/10.3389/feart.2022.982225
This article is part of the Research Topic AI-Based Prediction of High-Impact Weather and Climate Extremes under Global Warming: A Perspective from The Large-Scale Circulations and Teleconnections View all 21 articles
The boreal winter climate of 2022 was characterized by the occurrence of La Niña, which is one of the most predictable drivers of South China precipitation (SCP) deficit. However, surprisingly, South China (SC) received abnormal high precipitation in January–February (JF) 2022. Possible causes of the deviation of JF 2022 SCP from its historical response to La Niña are explored with observational and reanalysis data. Results suggest that the La Niña event in winter 2022 features an eastern Pacific (EP) type, which corresponds to a weaker zonal sea surface temperature (SST) gradient between the equatorial central and western Pacific than those of the historical La Niña events, leading to a weaker western North Pacific (WNP) cyclone (WNPC) anomaly. Meanwhile, the SST warming over the tropical Indian Ocean (TIO) would also weaken the La Niña-associated WNP circulation anomaly. Therefore, the flavor of La Niña and the TIO warming act in concert to dampen the La Niña-associated WNPC anomaly and the SCP deficit. But these tropical SST anomalies are still insufficient to explain the extremely high SCP. Furthermore, the investigation identifies two extra-tropical circulation patterns over Eurasia that dominate the SCP anomalies in JF 2022. One is the wave train propagating along the South Asian jet that intensifies the India–Burma trough. It enhances the SCP through exciting anomalous strong moisture transport from the Bay of Bengal and ascending motion. The other is the positive geopotential height anomaly over eastern Siberia that prompts southward cold air intrusion and convergence over the SC region. These two dynamical drivers can account for approximately 75% of the observed SCP anomaly in JF 2022. However, they may be largely attributed to the atmospheric internal dynamical processes, which implies limited seasonal predictability of this extreme wet event.
Under the influence of the East Asian winter monsoon (EAWM), extreme winter precipitation events, such as heavy rainfall, snowstorms, and severe freezing rain, occasionally occur over South China (SC), causing a catastrophic impact on agriculture, transportation, and human lives (Wen et al., 2009). Although the winter SC precipitation (SCP) accounts only for approximately 10% of the annual total precipitation, it experiences large year-to-year variability (Wang and Feng, 2011; Ge et al., 2016). Therefore, a deeper understanding and accurate prediction of such events are of great importance. The interannual variation of winter SCP had become a subject of great concern, but the underlying physical mechanisms are still not fully understood and require further investigation.
Many previous studies had revealed that the El Niño–Southern Oscillation (ENSO) and the EAWM are two important factors that affect the SCP (Wang et al., 2000; Huang et al., 2003; Zhou and Wu, 2010; Jia and Ge, 2017). Wet (dry) anomalies tend to appear in SC during the El Niño (La Niña) winters (Wu et al., 2003). The ENSO impacts SCP mainly through modulating the Walker circulation and low-level circulation anomalies over the western North Pacific (WNP) region. In an El Niño winter, the sea surface temperature (SST) warming anomalies in the equatorial central/eastern Pacific (CP/EP) and in the tropical Indian Ocean (TIO), as well as cooling in the equatorial western Pacific (WP), jointly force a WNP anticyclone (WNPAC) anomaly through chains of ocean–atmosphere coupling and atmospheric dynamical processes (Wu et al., 2010; Tim Li et al., 2017). The WNPAC anomaly then induces anomalous southwesterly flow and transports more moisture to the SC, resulting in increased precipitation (Zhang et al., 1996; Wang et al., 2000; Chung et al., 2011). In La Niña, the nearly opposite SST anomalies tend to force a WNP cyclone (WNPC) anomaly and thus cause SCP deficiencies. It had also been noted that different flavors of ENSO may have different types of impact on SCP. The EP El Niño tends to exert a stronger influence on SCP than the CP El Niño (Feng and Li, 2011; Jiang et al., 2019). Recent studies had revealed that the EP and CP types of La Niña would also exert different types of climate impact over SC (Yuan et al., 2014; Yu and Sun, 2018).
The EAWM is another important system that affects winter SCP (e.g., Wang and Feng, 2011; Lee et al., 2013). A weak EAWM is associated with anomalous south-westerlies over the East Asian coast that can induce anomalous moisture transport and upward motion, thus enhancing SCP. It should be pointed out that the EAWM and ENSO are not independent. A weak EAWM is usually accompanied by the mature phase of an El Niño event (Kim et al., 2017). But Zhou and Wu, (2010) noted that the EAWM-associated wet anomaly extends more northward than that of the ENSO, due to the anomalous southerlies penetrating more northward over eastern China. It had also been noted that the ENSO–EAWM relationship is unstable, which can be modulated by the Pacific Decadal Oscillation, the Atlantic Multidecadal Oscillation, and global warming (He and Wang, 2013; Jia et al., 2020). In addition to ENSO and EAWM, some recent studies highlighted that a Rossby wave train propagating along the subtropical jet over South Asia can also significantly impact the winter SCP (Xiuzhen Li et al., 2017; Hu et al., 2018; Ma et al., 2019; Shen et al., 2019; Li et al., 2020). This wave train can be captured as the leading empirical orthogonal function (EOF) mode of the monthly meridional wind (v) over the North Africa–Asia region in the upper troposphere (Hu et al., 2018). It deepens the India–Burma trough (IBT) over the northern Bay of Bengal (BoB), enhancing water vapor transport from the BoB to SC, thus enhancing SCP.
As had been previously discussed , wet winters over SC are most likely to be associated with El Niño and weak EAWM, such as the extreme positive SCP anomalies occurred in winter 1982/1983, 1997/1998, and 2015/2016. Actually, although La Niña tends to increase the probability of dry anomalies and persistent cold, and wet weather occasionally occurred in La Niña winters, for example, winter 2007/2008 and 2017/2018 (Wu et al., 2011; Wang et al., 2020). But these La Niña winters are usually primarily featured by severe snowfall or freezing rain, with the seasonal mean precipitation amounts still near or even below normal (Figure 1B). However, the La Niña winter of 2021/2022 is a unique case. It is surprising to see that SC experienced extreme wet conditions throughout this winter (Figure 1A). The SCP amount in JF 2022 even exceeds that in El Niño winters of 1998 and 2016 (Figure 1D). So far, the underlying mechanisms driving the 2022 wet anomalies over SC remain unclear. In this study, we use observations and re-analysis to investigate which role tropical thermal forcings and extra-tropical circulation anomalies played in the extreme SCP in JF 2022. Particularly, whether the extreme winter precipitation in 2022 could be ascribed to the wave train along the South Asian jet or high latitude circulation patterns is an interesting question. In the following sections, Section 2 describes the data and methods. In Section 3, anomalous SCP in 2022 and its linkages with the atmospheric/oceanic conditions are analyzed. In Section 4, a multiple linear regression (MLR)-based reconstruction of the winter rainfall of JF 2022 is presented, in order to estimate the relative contribution from several identified influence factors. Finally, a summary and discussion of the results are given in Section 5.
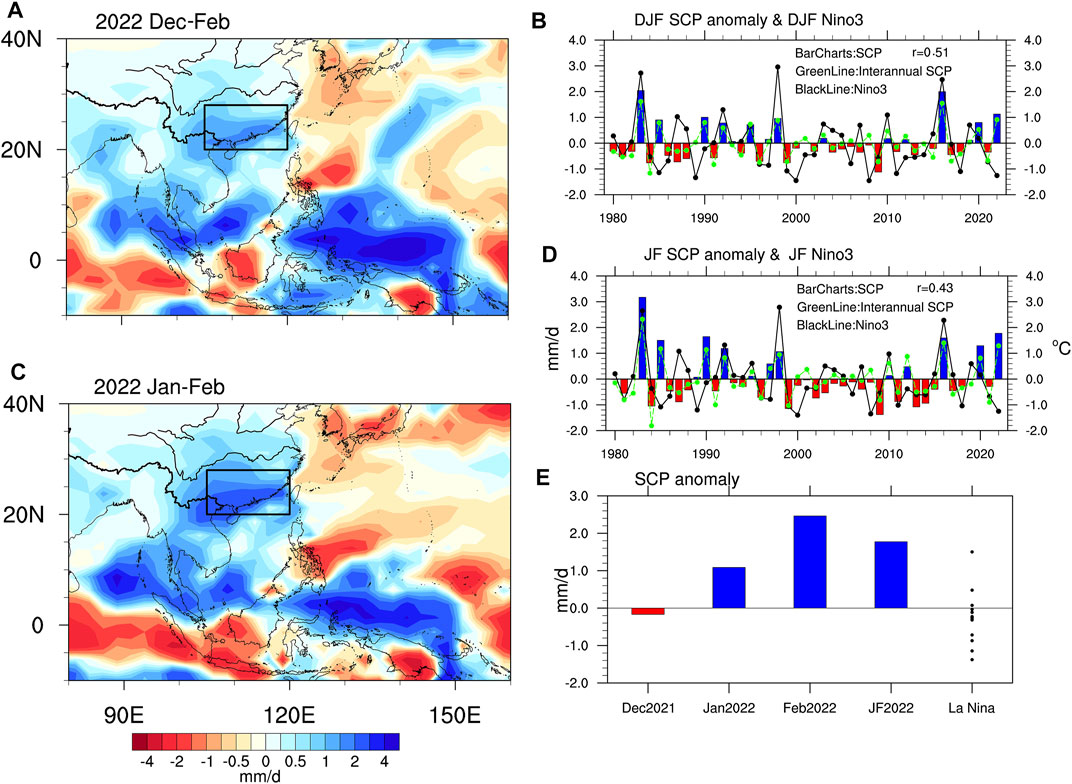
FIGURE 1. (A) and (C) Spatial distributions of anomalous precipitation (units: mm/day) in DJF 2022 and JF 2022, respectively. (B) Time series of DJF mean SCP anomalies (averaged over 105–120°E and 20–28°N, as shown in the black box in (A) and (C)) from 1980 to 2022. (D) Time series of JF mean SCP (bar) and Niño3 (solid line) anomalies from 1980 to 2022. (E) SCP anomalies for December 2021, January 2022, February 2022, JF mean 2022, and JF mean of 13 historical La Niña events excluding 2022 (units: mm/day).
The monthly precipitation dataset from the Global Precipitation Climatology Project (GPCP) with a horizontal resolution of 2.5° × 2.5° is used in this study (Adler et al., 2003). The monthly SST dataset is the Centennial in situ Observation-Based Estimates of SST (COBE SST; Ishii et al., 2005), which has a horizontal resolution of 1.0° × 1.0°. For the circulation variables, we use the National Centers for Environmental Prediction-Department of Energy (NCEP-DOE) atmospheric reanalysis dataset (Kanamitsu et al., 2002), with a horizontal resolution of 2.5° × 2.5°. Considering that the observations and reanalysis before the satellite era (around 1979) exhibit larger uncertainties, the analysis period of the present study ranges from 1979 to 2022. In this article, the anomalies in JF 2022 are computed relative to the climatology of 1991–2020.
The Niño3 (Niño4) index is defined as the area-averaged SST anomaly over 150–90°W, 5°S–5°N (160°E–150°W, 5°S–5°N). The Niño3.4 index is defined as the averaged SST anomaly over 170–120°W, 5°S–5°N. The La Niña events are defined based on a threshold of −0.5°C of the Niño3.4 index for five consecutive months. According to this definition, 14 La Niña winters had been identified, including 1985, 1989, 1996, 1999, 2000, 2001, 2006, 2008, 2009, 2011, 2012, 2018, 2021, and 2022. Similar to the definition of Kug et al. (2009), we further classify these events into EP and CP types according to the absolute ratio of the Niño3 index to the Niño4 index. If the ratio is greater (less) than 1, then an EP (CP) La Niña event is identified. The EP La Niña events include 1985, 1996, 2000, 2006, 2008, 2018, and 2022, while the CP La Niña events include 1989, 1999, 2001, 2009, 2011, 2012, and 2021.
To describe the propagation of Rossby wave energy in the upper troposphere, the phase-independent wave activity flux (WAF; Takaya and Nakamura, 2001; see equation below) was calculated. The phase-independent flux was derived from combined perturbation energy and pseudo-momentum terms. Mathematically, the WAF can be written as follows:
Here,
It is known that La Niña usually tends to be associated with dry rather than normal conditions over the SC in wintertime. However, although a La Niña event occurred in winter 2021/2022, the rainfall was unusually intense over the SC. Positive precipitation anomalies occupy most of the SC and the Yangtze River valley in this winter (December to February averaged, Figure 1A). The wet anomalies were particularly strong during JF of 2022, with the largest anomalies existing over the coastal regions of the SC (Figure 1C). The SCP index (SCPI), defined as the average rainfall anomalies over the region of 20–28°N, 105–120°E, reaches +1.78 mm/day in JF 2022, the second largest value since 1980 (Figure 1D), only next to 1983. There seems to be a prominent decadal change in late winter precipitation anomalies (Figure 1D). Thus, we conduct a 9-year high-pass filtering to see the contribution from an inter-annual timescale. The inter-annual component of SCP in 2022 is 1.26 mm/day, accounting for ∼70% of the total anomaly, ranking as the third highest since 1980, next to 1983 and 2016. This result suggests that the extreme SCP in 2022 is primarily contributed by the inter-annual variability, while the decadal background plays a secondary role. We also note that the JF averaged SCP in 2022 is the largest among the historical La Niña events since 1980 (Figure 1E). Therefore, the extreme SCP in this winter is quite unique, and the physical mechanisms lying behind deserve further investigation.
Many previous studies had emphasized the important role of low-level circulation over the WNP region in wintertime SCP variability (e.g. Zhang et al., 2015). The WNPAC/WNPC is also known to bridge ENSO and SCP anomalies. Therefore, we first analyze the low-level circulation anomalies over the WNP region during JF 2022. As seen from Figure 2A, negative SLP anomalies occupied most of the WNP region during JF 2022. Meanwhile, evident easterly anomalies at 850 hPa prevailed over this region. We note that the La Niña-associated WNPC anomaly was absent, which was unfavorable for the development of dry anomalies over SC. So why was the circulation feature over the WNP region distinct from that in the canonical La Niña events? Whether the patterns of tropical SST anomalies played a role would be further discussed in Section 3.3.
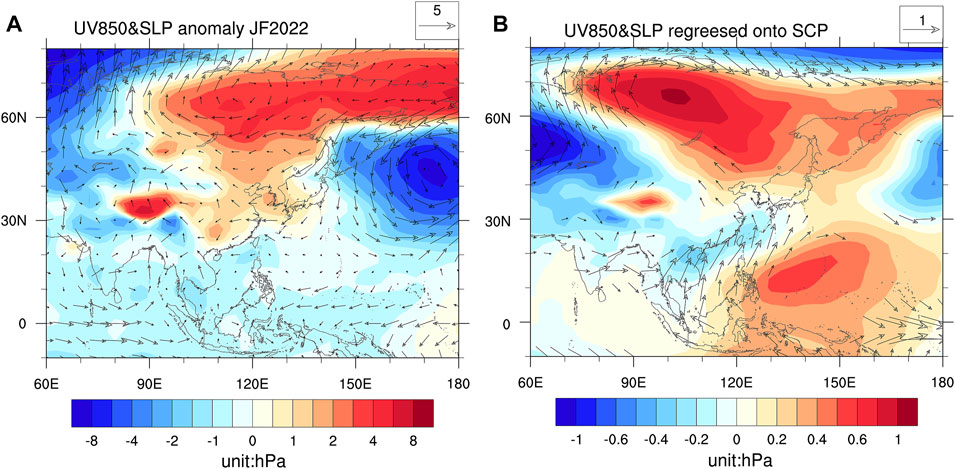
FIGURE 2. (A) Spatial distribution of the sea-level pressure anomalies (shading, unit: hPa) and 850-hPa wind anomalies (vector, unit: m/s) in JF 2022. (B) Regression map of the sea-level pressure anomalies (shading, unit: hPa) and 850-hPa wind anomalies (vector, unit: m/s, only vector with u or v component significant at the 95% confidence level was plotted) against the normalized SCP in JF for the period of 1980–2022.
Historically, high SCP corresponds to the positive SLP anomaly over the WNP region, as well as anomalous low level southerly over SC (Figure 2B). Thus, the circulation pattern over the WNP region in JF 2022 is distinct from that of the historical wet years (Zhang et al., 2015; Ding and Li, 2017; Huang et al., 2019), suggesting other circulation anomalies may contribute to the extreme SCP. We note that positive SLP anomalies dominate the East Asian continent in JF 2022, with a center over eastern Siberia. At 850 hPa, there is a correspondingly giant anticyclonic anomaly centered around 70°N, 120°E. As suggested in Figure 2B, a positive SCP anomaly is also associated with a positive SLP anomaly over eastern Siberia. In addition, Figure 2A and Figure 2B show dramatic similarities over mid-high latitudes of the Eurasian continent and north Pacific, indicating the mid-high latitude circulation anomalies may be responsible for the extreme SCP in JF 2022. The role of extra-tropical circulation patterns would be further discussed in Section 3.4 and Section 3.5.
For the oceanic conditions, SST was below normal across the equatorial central-eastern Pacific during JF 2022 (Figure 3A). According to the definition of Kug et al. (2009), this is an EP-type La Niña as the amplitude of the Niño3 index (−1.24°C) is larger than that of the Niño4 index (−0.38°C). Regression analysis suggests that historical positive SCP anomalies usually correspond to significant warming over the equatorial central-eastern Pacific and the TIO, as well as a significant cooling over the tropical WNP region, resembling the mature phase of El Niño (Figure 3B). These results agree with previous studies that the ENSO and TIO warming play an essential role in winter SCP variability by driving the lower tropospheric WNPAC anomalies (e.g., Wang et al., 2000). We note that the 2022 SST anomalies in most tropical regions are distinct from this regression pattern, except for the TIO. There also appears prominent SST warming in the extra-tropics, such as in the mid-latitudes of the north and south Pacific, especially the northern part (Figure 3A). However, judged from Figure 3B, these SST anomalies are less to play an important role in the extreme SCP of 2022. This is because north Pacific SST has a weak correlation with SCP, while the 2022 SST pattern in the south Pacific is nearly opposite to the regression pattern.
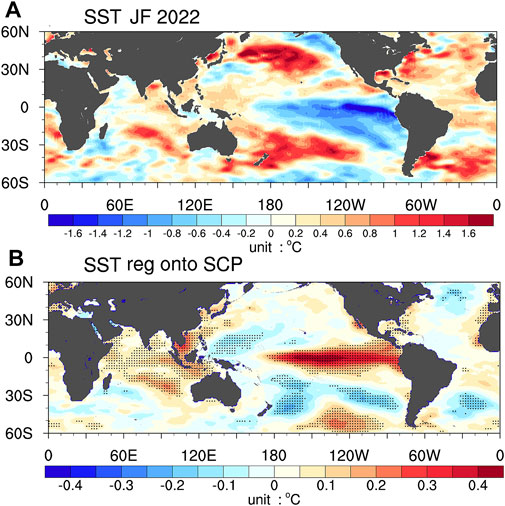
FIGURE 3. (A) SST anomaly pattern (°C) in JF 2022. (B) Regression map of the SST anomaly (shading, unit: °C) against the normalized SCP in JF for the period of 1980–2022. Dotted areas denote the 95% confidence level based on the two-tailed Student’s t-test.
Furthermore, we showed the composite mean of SST, SLP, and precipitation anomalies for 13 historical La Niña events (Figures 4A,D,G). As expected, historical La Niña events feature significant SST cooling over the central-eastern Pacific and the TIO, as well as SST warming over the WNP (Figure 4A). Significant low SLP anomalies occupy vast regions across WP and the TIO, with a center over the WNP (Figure 4D). Correspondingly, significant wet anomalies over the WNP as well as moderate dry anomalies over the SC are also noted, while the La Niña event would have induced a strong WNPC anomaly and notable SCP deficit, but this is not the case for JF 2022, as shown in Figure 1C and Figure 2A. So why were the La Niña signatures in JF 2022 distinct from its historical perspective? For comparison, we further show the difference between 2022 and the composite mean of historical La Niña events (Figures 4B,E,H). The difference between SST over the tropical Pacific and Indian ocean has two prominent features: 1) TIO SST is warmer than its historical counterparts; 2) a zonal dipole structure of SST difference exists in the tropical Pacific (Figure 4B). We pay particular attention to SST in these tropical regions because they are significantly linked with SCP variability (Figure 3B).
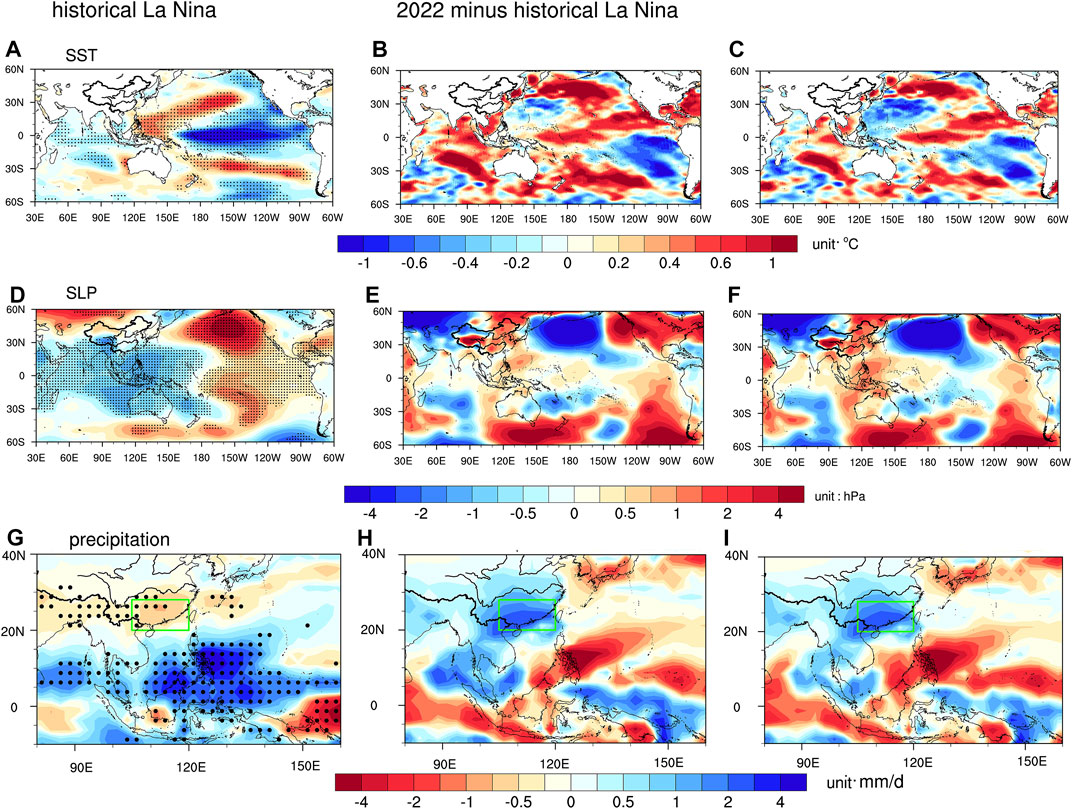
FIGURE 4. (A,D,G) SST (unit: °C), SLP (unit: hPa), and precipitation (unit: mm/day) anomalies of 13 historical La Niña events in JF, respectively. (B,E,H) SST (unit: °C), SLP (unit: hPa), and precipitation (unit: mm/day) difference between 2022 and 13 historical La Niña events in JF, respectively. (C,F,I) Same as (B,E,H) but with all variables detrended. Dotted areas denote the 95% confidence level based on the two-tailed Student’s t-test.
According to the findings from previous studies (e.g., Xie et al., 2009), this anomalous TIO warming relative to the previous La Niña events would trigger a positive SLP difference that acts to weaken the La Niña-associated negative SLP anomaly over the WNP in 2022. Therefore, the positive SLP difference over the WNP region may be partly due to this SST difference in TIO (Figure 4E). On the other hand, the zonal dipole structure of SST difference over the tropical Pacific, comprising a positive anomaly in the equatorial CP while a negative anomaly in the equatorial EP, is a reflection of the EP La Niña (Figure 4B). Compared to the average of historical La Niña events, the warming over the CP slackens the zonal SST gradient between the CP and the WP, which would suppress La Niña-related anomalous Walker circulation and the WNPC anomaly, as had been manifested in the positive (negative) SLP difference over the WNP (CP) shown in Figure 4E. This result indicates that the weak WNPC anomaly in the La Niña winter of 2022 may also be due to its flavor.
To further verify this, Figure 5 displays the composite mean of EP and CP La Niña events, as well as the composite differences between them. SST anomaly patterns over the tropical Pacific display notable differences for EP and CP La Niña events. For EP La Niña events, significant and evident negative SST anomalies cover the equatorial EP, but positive SST anomalies in the equatorial WP are weak and less significant (Figure 5A). In contrast, for CP La Niña events, the negative SST anomaly centers more westward into the equatorial CP. In addition, stronger significant positive SST anomalies are seen in the WNP than those of EP events (Figure 5B). Therefore, the SST contrast between CP and WNP during EP La Niña events is generally weaker than that associated with CP La Niña events (Figure 5C). As a result, the SLP contrast between CP and WNP is weaker for EP La Niña events, with a weaker amplitude of WNP low-pressure anomaly (Figure 5D), thus causing the absence of dry anomaly over SC (Figure 5G). Apparently, the atmospheric and oceanic anomalies in 2022 bear more resemblance to these of the EP flavor (Figures 5A,D,G). By comparing Figures 4B,E,H and Figures 5C, F, I, we also note that the difference between 2022 and the historical La Niña events are very similar to than between the EP and the CP La Niña events, demonstrating the La Niña flavor is also responsible for the anomaly of 2022 relative to the previous La Niña events.
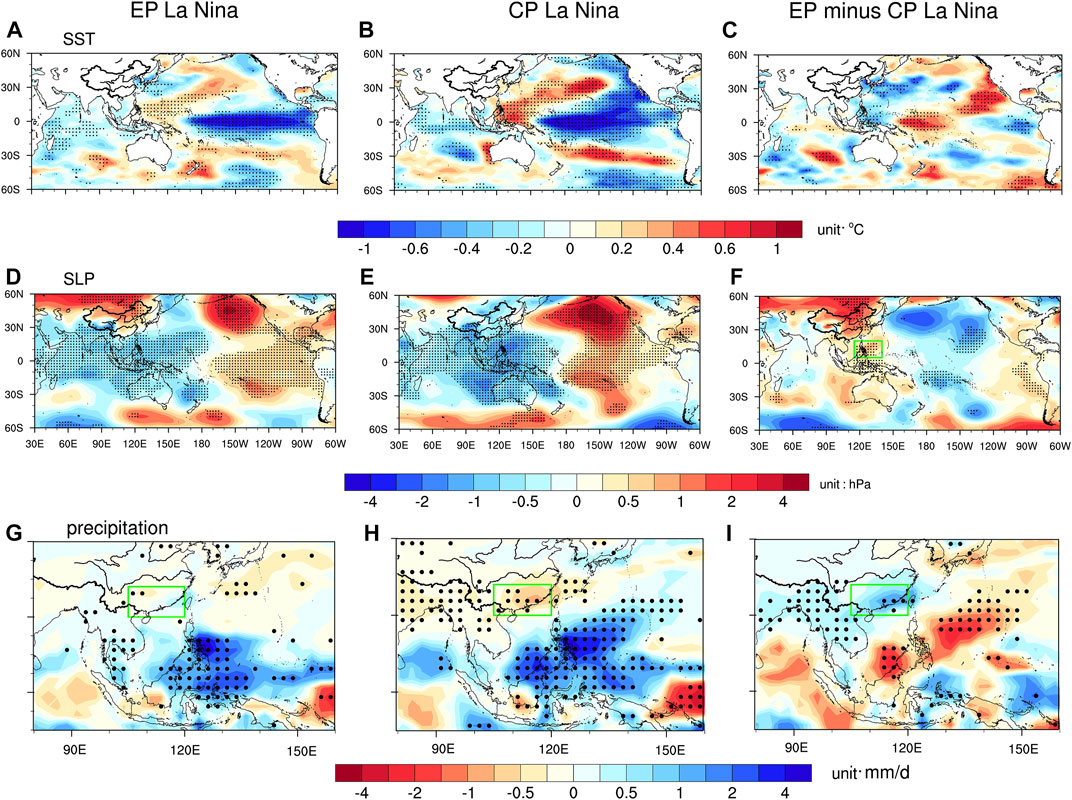
FIGURE 5. (A,D,G) SST (unit: °C), SLP (unit: hPa), and precipitation (unit: mm/day) anomalies of seven EP La Niña events in JF, respectively. (B,E,H) SST (unit: °C), SLP (unit: hPa), and precipitation (unit: mm/day) anomalies of seven CP La Niña events in JF, respectively. (C,F,I) Composite differences between seven EP and seven CP La Niña events (details can be seen in Section 2). Dotted areas denote the 95% confidence level based on the two-tailed Student’s t-test.
Overall, an EP La Niña flavor, as well as an anomalous TIO warming relative to the previous La Niña events, leads to a weaker WNPC anomaly in JF 2022 than its historical counterparts. As a result, a wet difference relative to the previous La Niña events appears over the SC (Figure 4H). This could explain why the drying effect of La Niña on SCP did not work effectively in JF 2022. It should be noted that the oceanic and atmospheric differences in Figures 4B,E,H may also reflect the global warming pattern to some extent. Thus, we repeat the difference analysis with all the datasets de-trended, as shown in Figures 4C,F,I. It is found although the amplitude of SST warming difference weakened in many regions, the overall patterns of SST, circulation, and precipitation differences remain unchanged, which would not substantially impact our conclusions.
The SCP could be affected not only by the low-level WNP circulation anomalies and the tropical SST anomalies but also by the upper-level westerly trough to the upstream. To reveal this, the contemporary mid-to-upper level circulation anomalies in JF 2022 are shown in Figure 6. Figure 6A shows the spatial distribution of 500 hPa GPH anomalies. At subtropical latitudes, the negative GPH anomalies appear over the Tibetan Plateau (TP) region and the northern part of BoB, indicating an intensified IBT. In association with the anomalous trough, a giant cyclonic anomaly encircles the TP, which facilitates the advecting of moist air from BoB to SC (Figure 6C). According to the diagnosis analysis of Hu et al. (2018), the intensified IBT would cause ascending anomalies over SC through the effect of positive vorticity advection and warm temperature advection. Therefore, anomalous IBT can enhance SCP through exciting anomalous moisture transport from BoB and ascending motion. In this study, the IBT index (IBTI) is defined as the normalized 500-hPa vorticity averaged over 20–35°N and 80–110°E (black box in Figure 6A). The correlation coefficient between JF SCP and the IBTI during 1980–2022 reaches 0.72 (Figure 8A). Thus, the activity of the IBT is very crucial to the winter SCP. Its impact is even more effective than that of the ENSO, given the IBT–SCP correlation is higher than the ENSO–SCP correlation. In JF 2022, the IBTI anomaly exceeds +1.2 standard deviation (Figure 8A), and thus the IBT activity is directly responsible for the intense rainfall over the SC.
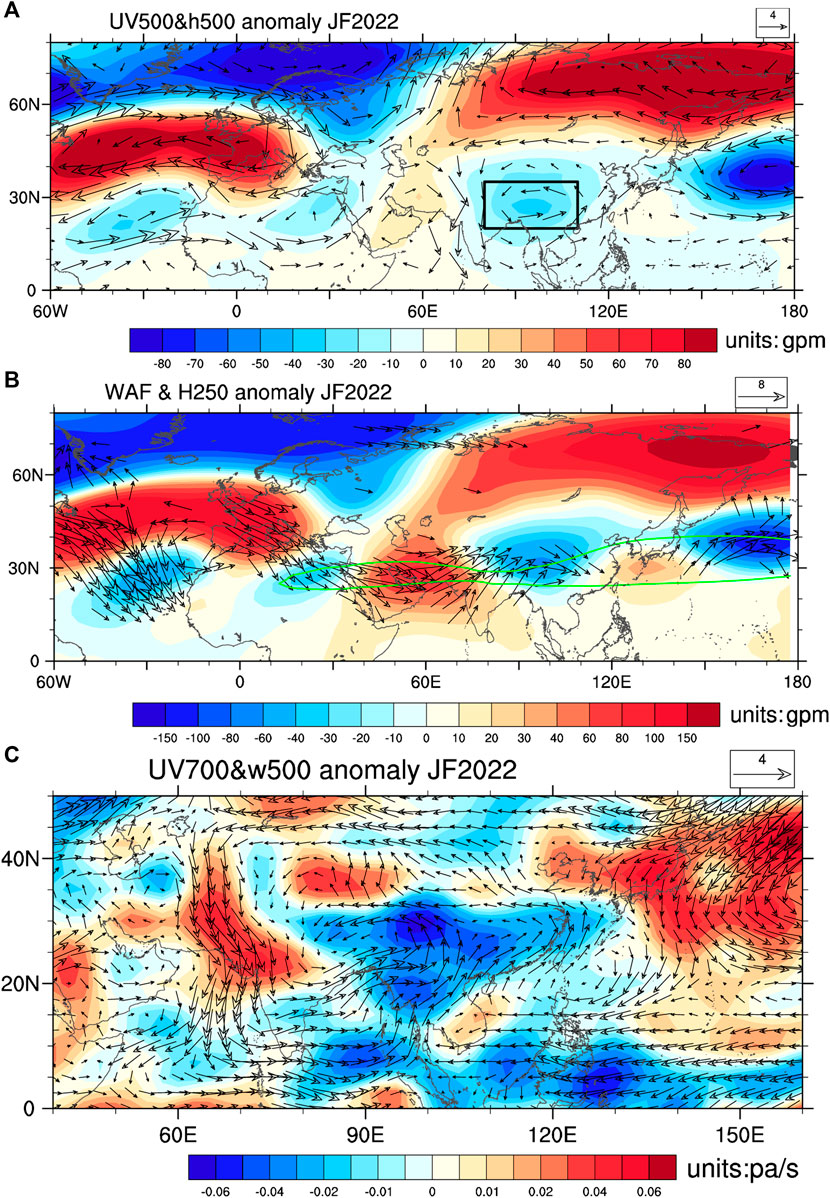
FIGURE 6. (A) Spatial distribution of the 500-hPa geopotential height anomalies (shading, unit: gpm) and wind anomalies (vector, unit: m/s) in JF 2022. (B) 250-hPa geopotential height anomalies and the associated WAF; green line denotes the 45 m/s contours of the climatological Asian westerly jet. (C) Spatial distribution of the 500-hPa vertical velocity anomalies (shading, unit: pa/s) and 700-hPa wind anomalies (vector, unit: m/s) in JF 2022.
This negative GPH anomaly around the TP, in association with the intensified IBT, might be part of the zonally oriented wave train over the subtropical latitudes of the Eurasia continent. As is known, the signal and propagation of the zonal Rossby wave train are usually clearer in the upper troposphere. Thus, we further show the GPH anomalies at 250 hPa and calculate its WAF (Figure 6B). Evident wave-like GPH anomalies extend from western Europe to the north Pacific. The centers of the Rossby wave are located over western Europe, the Arabian Peninsula, and Japan with positive GPH anomalies, but with negative GPH anomalies located over northern Africa, the TP, and the north Pacific. It is seen that this Rossby wave train is mainly constrained within the climatological waveguide of the South Asian jet. The WAFs start from western Europe, pass through north Africa and the Arabian Sea, and then turn northeastward to East Asia, indicating the path of Rossby wave energy propagation. The distribution of 250 hPa v anomalies shows an even more clear wave train pattern, as is shown in Figure 7A. During JF 2022, negative v anomalies emerge over the Mediterranean and India, while positive v anomalies exist over the Arabian Peninsula and eastern China. We performed an EOF analysis upon the monthly 250 hPa v anomalies over the region of 0–45°N and 0–140°E. The leading mode (EOF1), explaining 32.5% of the total variance, also exhibits a wave train pattern along the South Asian jet (Figure 7B). By comparison, it is found that the anomalous v pattern during JF 2022 bears highly resemblance to the EOF1 pattern. Although the January and February value of the standardized PC1 of v anomalies (vPC1) was not extremely high (Figure 7C, 1.68 and 1.26, respectively), the JF mean amplitude in 2022 is 1.47, the second highest since JF 1980, only next to JF 1992 (Figure 8B). The time series of JF mean vPC1 is highly correlated with the IBTI (r = 0.84, p<0.01), further demonstrating the significant influence of the wave train along the South Asian jet on the IBT activity.
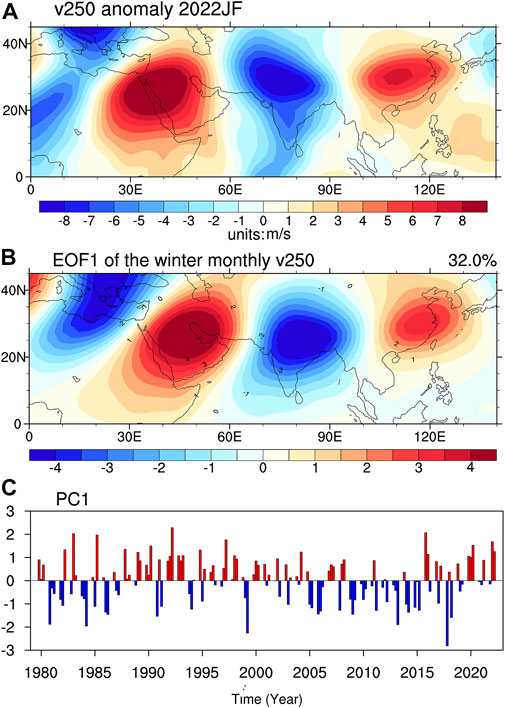
FIGURE 7. (A) Spatial distribution of the 250-hPa meridional wind anomalies (vector, unit: m/s) in JF 2022. (B) First EOF mode of monthly mean meridional wind at 250 hPa of boreal winter from 1979/1980 to 2021/2022 over 0–45°N, 0–140°E, which explains 32% of the total variance. (C) Wintertime monthly PC1 time series of the first EOF mode.
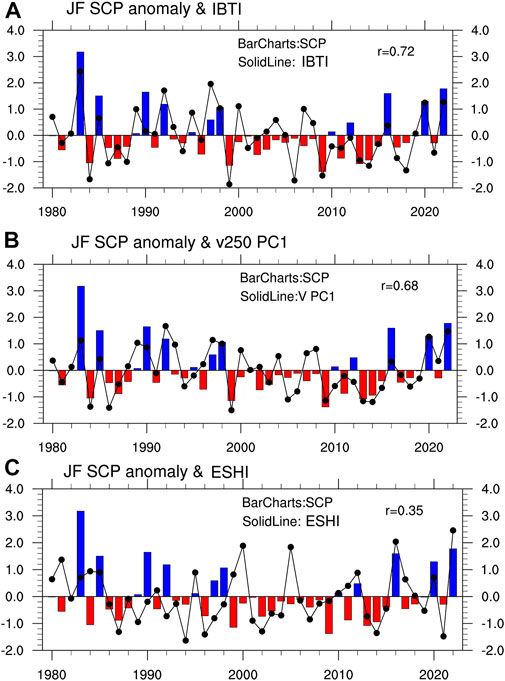
FIGURE 8. Time series of JF SCP with IBT (A), v250 PC1 (B), and ESH (C) index during 1980–2022.
In addition to the disturbances along the subtropical jet, high latitude circulation anomalies may also play a role. Figure 9 shows the regressed 500-hPa GPH upon the SCPI. The significant positive signals in the tropics are manifestations of the ENSO impact. The significant positive or negative GPH anomalies over the mid-to-low latitudes of Eurasia suggest the influences from the wave trains, as had already been discussed in the aforementioned sections. At high latitudes, we also note strong and significant positive GPH anomalies over East Siberia. To characterize its effect, in this study, we define an eastern Siberia GPH index (ESHI) as the normalized 500-hPa GPH averaged over 60–70°N and 100–130°E. The correlation coefficient between JF SCPI and the ESHI during 1980–2022 reaches 0.35 (Figure 8C). Thus the activity of the ESH is another important factor influencing the winter SCP. In JF 2022, the GPH anomalies at high latitudes of Eurasia show a west–east dipole pattern, and negative anomalies center over Scandinavia, while the positive anomalies dominate eastern Siberia. The high-pressure anomaly over eastern Siberia is consistent with the regressed pattern. The ESHI in JF 2022 exceeds +2.4 standard deviation, and thus the high-pressure anomaly over eastern Siberia is another important factor responsible for the intense rainfall over the SC. The circulation anomaly over eastern Siberia usually exhibits a quasi-barotropic structure, which coincides with the anticyclonic anomaly at 850 hPa and positive SLP anomaly at the surface (Figure 2A). The pronounced anomalous cold northeasterly from this anomalous anticyclone encounters warm and moist air over the SC, which would support strong convergence and upward motion and consequently provide a favorable dynamical condition for SCP.
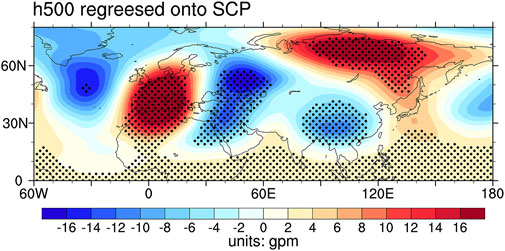
FIGURE 9. Regression map of the 500-hPa geopotential height anomalies (shading, unit: gpm) against the SCP index in JF for the period of 1980–2022. Dotted areas denote the 95% confidence level based on the two-tailed Student’s t-test.
The aforementioned sections discussed several climate drivers that may impact the SCP anomaly in JF 2022. These factors include the ENSO phase, the warming of TIO, the wave train along the South Asian jet, and the GPH anomaly over eastern Siberia. To further identify the relative importance of the aforementioned four factors, the MLR method is employed to reconstruct the precipitation anomaly in JF 2022. First, the MLR analysis is performed using the Niño4 index (quantify ENSO), the SST averaged over 20°S–20°N, 50–100°E (quantify TIO SST), the vPC1 (quantify the South Asian jet wave train activity), and the ESHI (quantify GPH anomaly over East Siberia), based on monthly data from winter 1979/1980 to 2020/2021. Here, considering an EP La Niña occurred in 2022 which exerts a weaker impact on SCP than its CP counterpart, instead of the Niño3 index, we use the Niño4 index as a predictor to avoid overestimating La Niña effects on SCP in 2022. The correlations between the Niño4 index and the ESHI, as well as between vPC1 and ESHI, are near zero, indicating they are nearly independent. However, we note that there is a moderate correlation between Niño4 and vPC1 (r = 0.23) and a strong correlation between Niño4 and TIO (r = 0.55). Therefore, before performing the MLR analysis, we had removed the ENSO-related variability from the vPC1 and TIO SST to obtain an ENSO-independent vPC1 (i.e., vPC1res) and an ENSO-independent TIO SST (i.e., TIOres SST), respectively. These are performed by means of linear regression. After this, the four indices are almost orthogonal to each other, making it more reliable to superimpose their individual climate effects. Then, the MLR coefficients are multiplied by the corresponding values of each index in January and February. The reconstructed JF precipitation anomalies are obtained by adding the reconstructed January and February values. Our examination suggests that this MLR model can well reconstruct the historical SCP variability. The observed JF SCPI has a significant correlation coefficient (r = 0.84) with the MLR-reconstructed SCPI during 1980–2021; thus, over 70% of the total variance of the SCPI can be explained by the selected factors. Therefore, it is reliable to use this MLR model to reconstruct SCP.
Figures 10A–D show the patterns of contributions of each factor to precipitation anomalies in JF 2022; it is found that the signals of different factors show distinct spatial distributions. We primarily focus on the reconstructed precipitation anomalies over the SC. The contributions of each factor to SCP are displayed in Figure 11. The imprint of the Niño4 index, indicative of the impact from the La Niña event, exhibits a weak dry anomaly (−0.16 mm/day). Thus, La Niña exerts a slightly negative contribution to the SCP anomalies in JF 2022. The TIO warming causes a slight increase in SCP (0.29 mm/day) that accounts for 16% of the observed rainfall anomaly, generally consistent with the previous findings (Zhang et al., 2015). In contrast, the signal of vPC1res, representing the effect of the South Asian jet wave train, is featured by stronger wet anomalies over SC. The SCPI response is 0.86 mm/day, accounting for almost 50% of the observed rainfall anomaly. The ESHI also produces an evident positive SCP, with an SCPI response of 0.47 mm/day, accounting for ∼25% of the observed rainfall anomaly. Therefore, the two extra-tropical circulation patterns, characterized by vPC1res and the ESHI, dominated the observed SCP anomalies in JF 2022, with a larger contribution from the former (∼50%). The sum of these two factors accounts for ∼75% of the observed SCP anomaly. On the other hand, the tropical oceanic forcings, including the La Niña and the TIO warming, exert a relatively weak impact on SCP in 2022.
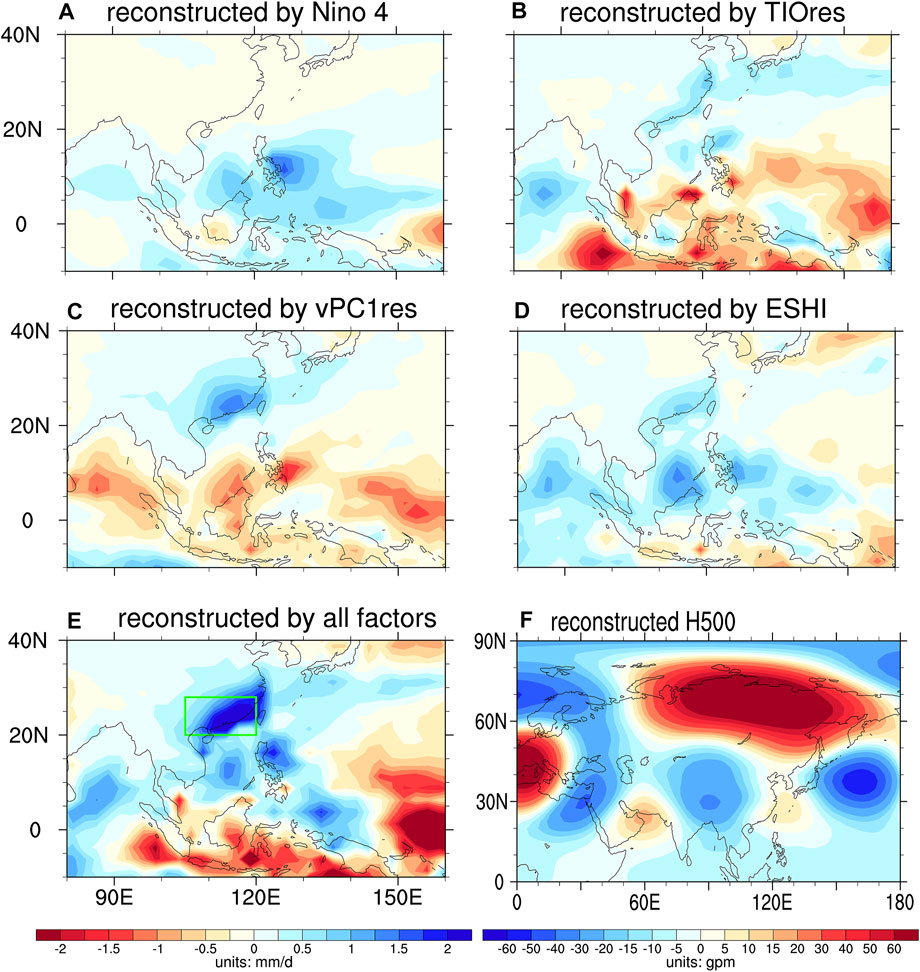
FIGURE 10. Reconstructions of the JF 2022 precipitation anomaly (mm/day) based on the multiple linear regression with (A) Niño3; (B) vPC1res index; (C) ESHI; (D) TIOres; and (E) the sum of (A)–(D). (F) is same as (E), but for reconstructed 500-hPa geopotential height anomalies.
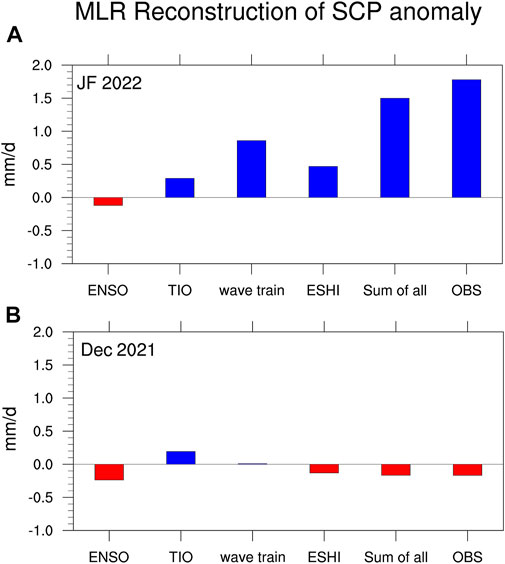
FIGURE 11. Multiple linear regression reconstructions of the area-averaged (green box in Figure 10E) SCP anomaly (mm/day) in JF 2022 (A) and December 2021 (B) using the four factors, as well as the sum of all factors and the observed anomaly.
Next, we examined the spatial pattern of the reconstructed precipitation. Figure 10E depicts the reconstructed 2022 precipitation anomalies using all four factors. It is found that the main features of the rainfall pattern over the Asian–Pacific region are well captured. The wet anomalies over SC, BoB, SCS, and equatorial WP, as well as dry anomalies over Japan and equatorial Indian Ocean, are all consistent with observations. In addition, the reconstructed H500 pattern bears high resemblance with observation (Figure 10F and Figure 6A). The key atmospheric circulation anomalies associated with the 2022 SC wet anomaly are also well reproduced, including the wave train along the South Asian jet and positive GPH anomalies over eastern Siberia. These results indicate that the MLR reconstruction may have captured the main physical drivers of SCP anomaly in JF 2022.
There comes another interesting question: are these four identified factors also responsible for the sub-seasonal change in SCP anomalies from early (December 2021) to late winter (JF 2022)? In order to reveal this, we repeated the MLR reconstruction in Figure 11A for the SCP anomaly in December 2021, as shown in Figure 11B. It is seen that for December 2021, the sum of these four factors, which represent the MLR reconstruction of SCP, is nearly identical to the observed SCP anomaly, demonstrating that the sub-seasonal change in the precipitation anomaly in winter 2021/2022 can be well captured by this MLR reconstruction. It is also found that the contributions from tropical oceanic anomalies, including the La Niña event and the TIO warming, are very close between early and late winter. Therefore, the sub-seasonal change in the precipitation anomaly in this winter mainly arises from the extra-tropical circulation anomalies, including the changes in the South Asian jet wave train pattern and the ESHI anomaly.
The SC region had experienced long-lasting rainy weather throughout the winter of 2021/2022. The wet anomalies were particularly strong during JF 2022. The SCPI reaches +1.78 mm/day, the second largest value since 1980, only next to 1983. At the same time, there was a La Niña event. As suggested by the previous studies, canonical anomalies associated with a mature La Niña would have the WNPC anomaly bring a dry winter to the SC in 2022. But in reality, an extreme wet event occurred instead. This promotes us to ask why was the La Niña winter of 2021/2022 extremely wet over SC? In this study, we use observations and reanalysis to investigate which role tropical SST anomalies and extra-tropical circulation anomalies played in this wet event.
Our analysis suggests the La Niña event had not effectively forced circulation anomalies over the WNP region in JF 2022 as expected. Particularly, the WNPC anomaly at lower levels was not obvious, which is at least unfavorable for SCP deficiencies. The absence of a WNPC anomaly may be related to the SST distributions across the tropical oceans. Over the tropical Pacific, the EP type of a La Niña event shifted the center of the negative SST anomaly more eastward than the average of historical La Niña events. This would slacken the La Niña-associated anomalous zonal SST gradient between CP and WP, thus suppressing the development of anomalous Walker circulation and the WNPC. On the other hand, there was an unexpected SST warming over the TIO, which would favor the anticyclonic anomaly over the WNP region. Thus, the EP type of La Niña and the SST warming in the TIO act in concert to dampen the WNPC anomaly and the SCP deficiencies. However, these tropical SST anomalies, along with the corresponding WNP circulation pattern, could only explain why there was no evident dry anomaly over the SC. They are still unable to explain the observed wet extreme, as the WNPAC anomaly was absent. Thus, the tropical oceanic condition may not be the primary cause for the extreme wet condition over SC in JF 2022.
Furthermore, the investigation identifies two extra-tropical circulation anomalies over Eurasia that play dominant roles in the 2022 SC wet extreme. One is the wave train propagating along the South Asian jet. This wave train pattern results in a strong cyclonic anomaly over TP and the northern BoB region, which intensifies the IBT. In JF 2022, the IBTI anomaly exceeds +1.2 standard deviation. The intensified IBT can enhance SCP through exciting anomalous moisture transport from BoB and ascending motion. A positive GPH anomaly over eastern Siberia is another important factor influencing the winter SCP. In JF 2022, the GPH anomalies at high latitudes show a west–east dipole pattern, and negative anomalies center over Scandinavia, while the positive anomalies dominate eastern Siberia. The circulation anomaly over eastern Siberia usually exhibits a quasi-barotropic structure, which is physically consistent with the anticyclonic anomaly at 850 hPa and positive SLP anomaly at the surface. The pronounced anomalous cold northeasterly from this anomalous anticyclone encounters warm and moist air over the SC, which would support strong convergence and upward motion and consequently provide a favorable dynamical condition for SCP. The MLR reconstruction suggests that the South Asian wave train explained ∼50% of the observed SCP anomaly, while ESHI explained ∼25% of the observed SCP anomaly in JF 2022. Therefore, the unexpected extreme wet condition over the SC in JF 2022 is attributed mainly to the enhanced IBT maintained by the South Asian jet wave train, as well as the high-pressure anomalies over eastern Siberia.
Canonical anomalies associated with a mature La Niña would have the WNPC anomaly bring a dry winter to SC in 2022. In reality, the South Asian jet wave train, as well as the high-pressure anomaly over eastern Siberia, overwhelmed this tendency, bringing an extremely wet winter instead. Particularly, the South Asian jet wave train that intensifies IBT plays the most important role. This promotes us to ask what are the potential causes for this pattern? Previous studies had identified two kinds of forcing factors that may influence the phase of this wave train: the tropical SST anomalies and the North Atlantic Oscillation (NAO). For SST anomalies, previous studies suggested a moderate impact of an El Niño-like SST pattern across the tropics on the South Asian jet wave train. According to Hu et al. (2018), warm SST anomalies and positive rainfall anomalies in the equatorial EP would excite a wave-like pattern from the Northeast Pacific across the North Atlantic through Europe to East Asia, thus projecting onto the positive phase of vPC1. But considering a La Niña event that occurred, the tropical SST pattern is not a plausible cause for the observed wave train pattern in JF 2022.
Some studies had emphasized the role of the NAO in triggering wave trains along the South Asian jet stream, and the positive NAO anomaly tends to cause the positive phase of vPC1 (Branstator, 2002; Watanabe, 2004). In JF 2022, the NAO index reaches +1.1, which may favor the observed South Asian jet wave train anomaly to some extent. However, the impact of NAO on vPC1 is not deterministic, as a comprehensive analysis by Huang et al. (2020) had shown that both positive and negative phases of NAO can excite the same phase of the South Asian wave train, although with different orientations. In fact, the wave train is an atmospheric internal mode, which can be developed without external forcing. Internal atmospheric dynamic processes, such as the conversion between barotropic and baroclinic energy, are also important in maintaining and strengthening the wave train along the westerly jet stream (Li et al., 2020). Therefore, the wave train anomaly in JF 2022 may be largely due to atmospheric internal dynamical processes, which indicates a low predictability season ahead. But the exciting mechanisms of the South Asian jet wave train remain controversial. In addition, although the present study highlights the influence on the SCP anomalies of both tropical SST/circulation anomalies and atmospheric inner dynamic processes in the extra-tropics, other climatic factors, for example, the Arctic sea ice concentration, may also play a role. Previous studies revealed that the reduction in the Arctic sea ice may excite anomalous upward air motion due to strong near-surface thermal forcing, which further triggers a meridional overturning wave-like pattern extending to mid-latitudes of Eurasia, thus, in turn, inducing the zonally oriented Rossby wave train along the mid-latitudes of jet stream (He et al., 2018; He et al., 2020). Whether the sea ice anomaly affects the 2022 extreme SCP should be further investigated in future studies.
Publicly available datasets were analyzed in this study. These data can be found at: the monthly precipitation dataset from the Global Precipitation Climatology Project (GPCP) with a horizontal resolution of 2.5° × 2.5° is used in this study (Adler et al., 2003). The monthly SST dataset is the Centennial in situ Observation-Based Estimates of SST (COBE SST; Ishii et al., 2005), which has a horizontal resolution of 1.0° × 1.0°. For the circulation variables, we use the National Centers for Environmental Prediction-Department of Energy (NCEP-DOE) atmospheric reanalysis dataset (Kanamitsu et al., 2002), with a horizontal resolution of 2.5° × 2.5°. The aforementioned three datasets are available to download at https://psl.noaa.gov/data/gridded/index.html and https://psl.noaa.gov/data/gridded/data.ncep.reanalysis2.html.
HM, RW, and XnL contributed to the conception and design of the study. AL and HY organized the database. XnL and XaL performed the statistical analysis. HM and XnL wrote the first draft of the manuscript. RW, and XaL wrote sections of the manuscript. All authors contributed to manuscript revision, read, and approved the submitted version.
This study was jointly supported by the Central Asia Atmospheric Science Program (CAAS202002), the National Natural Science Foundation of China (41905065 and 41905080), the Shanghai Sailing Program (Grant Number 19YF1443800), and the Scientific Research Foundation of CUIT (KYTZ202124 and KYTZ202123).
The authors declare that the research was conducted in the absence of any commercial or financial relationships that could be construed as a potential conflict of interest.
All claims expressed in this article are solely those of the authors and do not necessarily represent those of their affiliated organizations, or those of the publisher, the editors, and the reviewers. Any product that may be evaluated in this article, or claim that may be made by its manufacturer, is not guaranteed or endorsed by the publisher.
Adler, R., Huffman, G., Chang, A., Ferraro, R., Xie, P., Janowiak, J., et al. (2003). The version-2 global precipitation climatology project (GPCP) monthly precipitation analysis (1979-present). J. Hydrometeorol. 4, 1147–1167. doi:10.1175/1525-7541(2003)004<1147:TVGPCP>2.0.CO;2
Branstator, G. (2002). Circumglobal teleconnections, the jet stream waveguide, and the North Atlantic Oscillation. J. Clim. 15, 1893–1910. doi:10.1175/1520-0442(2002)015<1893:CTTJSW>2.0.CO;2
Chung, P., Sui, C., and Li, T. (2011). Interannual relationships between the tropical sea surface temperature and summertime subtropical anticyclone over the western North Pacific. J. Geophys. Res. 116, D13111. doi:10.1029/2010JD015554
Ding, F., and Li, C. (2017). Subtropical westerly jet waveguide and winter persistent heavy rainfall in South China. J. Geophys. Res. Atmos. 122, 7385–7400. doi:10.1002/2017jd026530
Feng, J., and Li, J. (2011). Influence of El Niño modoki on spring rainfall over South China. J. Geophys. Res. 116, D13102. doi:10.1029/2010JD015160
Ge, J., Jia, X., and Lin, H. (2016). The interdecadal change of the leading mode of the winter precipitation over China. Clim. Dyn. 47, 2397–2411. doi:10.1007/s00382-015-2970-x
He, S., and Wang, H. (2013). Oscillating relationship between the East Asian winter monsoon and ENSO. J. Clim. 26, 9819–9838. doi:10.1175/JCLI-D-13-00174.1
He, S., Gao, Y., Furevik, T., Wang, H., and Li, F. (2018). Teleconnection between sea ice in the barents sea in june and the silk road, pacific-Japan and east asian rainfall patterns in august. Adv. Atmos. Sci. 35, 52–64. doi:10.1007/s00376-017-7029-y
He, S., Xu, X., Furevik, T., and Gao, Y. (2020). Eurasian cooling linked to the vertical distribution of Arctic warming. Geophys. Res. Lett. 47, e2020GL087212. doi:10.1029/2020GL087212
Hu, K., Huang, G., Wu, R., and Wang, L. (2018). Structure and dynamics of a wave train along the wintertime Asian jet and its impact on East Asian climate. Clim. Dyn. 51, 4123–4137. doi:10.1007/s00382-017-3674-1
Huang, R., Zhou, L., and Chen, W. (2003). The progresses of recent studies on the variabilities of the East Asian monsoon and their causes. Adv. Atmos. Sci. 20, 55–69. doi:10.1007/BF03342050
Huang, W., Yang, Z., He, X., Lin, D., Wang, B., Wright, J., et al. (2019). A possible mechanism for the occurrence of wintertime extreme precipitation events over South China. Clim. Dyn. 52, 2367–2384. doi:10.1007/s00382-018-4262-8
Huang, S., Li, X., and Wen, Z. (2020). Characteristics and possible sources of the intraseasonal South Asian jet wave train in boreal winter. J. Clim. 33, 10523–10537. doi:10.1175/JCLI-D-20-0125.1
Ishii, M., Shouji, A., Sugimoto, S., and Matsumoto, T. (2005). Objective analyses of sea surface temperature and marine meteorological variables for the 20th century using ICOADS and the Kobe collection. Int. J. Climatol. 25, 865–879. doi:10.1002/joc.1169
Jia, X., and Ge, J. (2017). Interdecadal changes in the relationship between ENSO, EAWM, and the wintertime precipitation over China at the end of the twentieth century. J. Clim. 30, 1923–1937. doi:10.1175/JCLI-D-16-0422.1
Jia, Z., Bollasina, A., Li, C., Doherty, R., and Wild, O. (2020). Changes in the relationship between ENSO and the East Asian winter monsoon under global warming. Environ. Res. Lett. 15, 124056. doi:10.1088/1748-9326/abca63
Jiang, F., Zhang, W., Geng, X., Stuecker, M. F., and Liu, C. (2019). Impacts of central pacific El Niño on southern China spring precipitation controlled by its longitudinal position. J. Clim. 32, 7823–7836. doi:10.1175/JCLI-D-19-0266.1
Kanamitsu, M., Ebisuzaki, W., Woollen, J., Yang, S., Hnilo, J., Fiorino, M., et al. (2002). Ncep-doe amip-ii reanalysis (r-2). Bull. Am. Meteorol. Soc. 83, 1631–1644. doi:10.1175/BAMS-83-11-1631
Kim, J., An, S., Jun, S., Park, H., and Yeh, S. (2017). ENSO and East Asian winter monsoon relationship modulation associated with the anomalous northwest Pacific anticyclone. Clim. Dyn. 49, 1157–1179. doi:10.1007/s00382-016-3371-5
Kug, J., Jin, F., and An, S. (2009). Two types of El Niño events: Cold tongue El Niño and warm pool El Niño. J. Clim. 22, 1499–1515. doi:10.1175/2008JCLI2624.1
Lee, S., Kim, S., Jhun, J., Ha, K., and Seo, Y. (2013). Robust warming over East Asia during the boreal winter monsoon and its possible causes. Environ. Res. Lett. 8, 034001. doi:10.1088/1748-9326/8/3/034001
Li, X., Wen, Z., and Huang, W. R. (2020). Modulation of south asian jet wave train on the extreme winter precipitation over southeast China: Comparison between 2015/16 and 2018/19. J. Clim. 33, 4065–4081. doi:10.1175/JCLI-D-19-0678.1
Ma, H., Chen, H., Lai, A., Li, X., Wang, R., and Gao, C. (2019). Robust solar signature in late winter precipitation over southern China. Geophys. Res. Lett. 46, 9940–9948. doi:10.1029/2019GL084083
Shen, X., Zhou, N., Yang, S., and Miao, R. (2019). Analysis of two extreme precipitation events and circulation anomalies in Yunnan province in winter of 2015. Torrential Rain Disasters 38, 380–385. (in Chinese). doi:10.3969/j.issn.1004-9045.2019.04.011
Takaya, K., and Nakamura, H. (2001). A formulation of a phase-independent wave-activity flux for stationary and migratory quasigeostrophic eddies on a zonally varying basic flow. J. Atmos. Sci. 58, 608–627. doi:10.1175/1520-0469(2001)058<0608:AFOAPI>2.0.CO;2
Tim Li, T., Wang, B., Wu, B., Zhou, T., Chang, C., and Zhang, R. (2017). Theories on formation of an anomalous anticyclone in western North pacific during El Niño: A review. J. Meteorol. Res. 31, 987–1006. doi:10.1007/s13351-017-7147-6
Wang, L., and Feng, J. (2011). Two major modes of the wintertime precipitation over China Chin. J. Atmos. Sci. 35, 1105–1116. (in Chinese). doi:10.3878/j.issn.1006-9895.2011.06.10
Wang, B., Wu, R., and Fu, X. (2000). Pacific-East Asian teleconnection: How does ENSO affect East Asian climate? J. Clim. 13, 1517–1536. doi:10.1175/1520-0442(2000)013<1517:PEATHD>2.0.CO;2
Wang, Z., Ding, Y., Zhou, B., and Chen, L. (2020). Comparison of two severe low‐temperature snowstorm and ice freezing events in China: Role of Eurasian mid‐high latitude circulation patterns. Int. J. Climatol. 40, 3436–3450. doi:10.1002/joc.6406
Watanabe, M. (2004). Asian jet waveguide and a downstream extension of the north atlantic oscillation. J. Clim. 17, 4674–4691. doi:10.1175/JCLI-3228.1
Wen, M., Yang, S., Kumar, A., and Zhang, P. (2009). An analysis of the large-scale climate anomalies associated with the snowstorms affecting China in January 2008. Mon. Weather Rev. 137, 1111–1131. doi:10.1175/2008MWR2638.1
Wu, R., Hu, Z., and Kirtman, B. (2003). Evolution of ENSO-related rainfall anomalies in East Asia. J. Clim. 16, 3742–3758. doi:10.1175/1520-0442(2003)016<3742:EOERAI>2.0.CO;2
Wu, B., Li, T., and Zhou, T. (2010). Relative contributions of the Indian Ocean and local SST anomalies to the maintenance of the western North Pacific anomalous anticyclone during the El Niño decaying summer. J. Clim. 23, 2974–2986. doi:10.1175/2010JCLI3300.1
Wu, Z., Li, J., Jiang, Z., and He, J. (2011). Predictable climate dynamics of abnormal East Asian winter monsoon: Once-in-a-century snowstorms in 2007/2008 winter. Clim. Dyn. 37, 1661–1669. doi:10.1007/s00382-010-0938-4
Xie, S., Hu, K., Hafner, J., Tokinaga, H., Du, Y., Huang, G., et al. (2009). Indian Ocean capacitor effect on Indo-western Pacific climate during the summer following El Niño. J. Clim. 22, 730–747. doi:10.1175/2008JCLI2544.1
Xiuzhen Li, X., Chen, Y., and Zhou, W. (2017). Response of winter moisture circulation to the India-Burma trough and its modulation by the South Asian waveguide. J. Clim. 30, 1197–1210. doi:10.1175/JCLI-D-16-0111.1
Yu, S., and Sun, J. (2018). Revisiting the relationship between El niño-southern oscillation and the east asian winter monsoon. Int. J. Climatol. 38, 4846–4859. doi:10.1002/joc.5702
Yuan, Y., Li, C., and Yang, S. (2014). Decadal anomalies of winter precipitation over southern China in association with El Niño and La Niña. Acta Meteorol. Sin. 28, 91–110. doi:10.1007/s13351-014-0106-6
Zhang, R., Sumi, A., and Kimoto, M. (1996). Impact of El Niño on the East asian monsoon: A diagnostic study of the 86/87 and 91/92 events. J. Meteorological Soc. Jpn. 74, 49–62. doi:10.2151/jmsj1965.74.1_49
Zhang, L., Sielmann, F., Fraedrich, K., Zhu, X., and Zhi, X. (2015). Variability of winter extreme precipitation in southeast China: Contributions of SST anomalies. Clim. Dyn. 45, 2557–2570. doi:10.1007/s00382-015-2492-6
Keywords: South China precipitation, La Niña, wave train, sea surface temperature (SST), Indian Ocean
Citation: Ma H, Wang R, Li X, Lai A, Yang H and Li X (2022) Why was South China extremely wet during January–February 2022 despite La Niña?. Front. Earth Sci. 10:982225. doi: 10.3389/feart.2022.982225
Received: 30 June 2022; Accepted: 09 August 2022;
Published: 01 September 2022.
Edited by:
Xiefei Zhi, Nanjing University of Information Science and Technology, ChinaReviewed by:
Shengping He, University of Bergen, NorwayCopyright © 2022 Ma, Wang, Li, Lai, Yang and Li. This is an open-access article distributed under the terms of the Creative Commons Attribution License (CC BY). The use, distribution or reproduction in other forums is permitted, provided the original author(s) and the copyright owner(s) are credited and that the original publication in this journal is cited, in accordance with accepted academic practice. No use, distribution or reproduction is permitted which does not comply with these terms.
*Correspondence: Xing Li, bHhfY3VpdEAxNjMuY29t
Disclaimer: All claims expressed in this article are solely those of the authors and do not necessarily represent those of their affiliated organizations, or those of the publisher, the editors and the reviewers. Any product that may be evaluated in this article or claim that may be made by its manufacturer is not guaranteed or endorsed by the publisher.
Research integrity at Frontiers
Learn more about the work of our research integrity team to safeguard the quality of each article we publish.