 Guangsheng Du
 Shijiang Chen1,2*
- 1College of Mining and Coal, Inner Mongolia University of Science and Technology, Baotou, Inner Mongolia, China
- 2Key Laboratory of Mining Engineering of Inner Mongolia, Baotou, Inner Mongolia, China
Enhanced geothermal system (EGS) is the primary means during Dry Hot Rock development. It is necessary to build an underground heat exchange area during its construction, and the temperature of underground rock will change significantly, thus, the mechanical properties of those rocks underground will be affected. In order to judge whether the mechanical properties under temperature are related to the crystal structure of granite, we firstly used the crystalline rock heterogeneity coefficient H to describe the crystal structure of granite. Then, the discrete element software was used to construct the GBM equivalent crystalline model and the thermal temperature field coupling model. Finally, the temperature effect test was carried out to explore the law of heterogeneity coefficient H and damage and fracture development. The results show that: 1) the variation of granite heterogeneity coefficient H and temperature will lead to the decline of mechanical properties of rock samples. 2) At the same temperature, the damage value D increases with the increase of the H value. This phenomenon is more apparent when the temperature is greater than 400°C. 3) The microcracks caused by temperature change are mainly tensile. The H value increases the number of microcracks in the crystal. 4) The damage phenomenon caused by temperature change will be affected by heterogeneity. When the temperature is high, the crystal will denature, and the stress concentration caused by heterogeneity is easier to be reflected.
1 Introduction
In the development of Dry Hot Rock, enhanced geothermal system EGS has become a very promising construction technology, the construction of underground heat exchange system has always been a difficult engineering problem. (Musa and Rosalind, 2021; Cheng et al., 2021; Kang et al., 2021; Pan et al., 2021). In order to effectively solve this problem, it is necessary to deeply study the mechanical property change and fissure development law of thermal storage matrix granite under the action of temperature.
While studying the change of rock mechanical properties under the action of temperature, the damage caused by temperature to rock is considered a very complex process, and it is closely related to the temperature and action of rock microstructure. Yu et al. (2021a) researched the mechanical properties of granite under the influence of temperature through laboratory tests (Dong et al., 2020; Wang et al., 2021; Huang et al., 2022). The results show that the strength of granite decreases obviously with the temperature, and 400°C is an obvious turning point. Gautam et al. (2018) studied temperature induced microdamage (Wong et al., 2021). The results show that the crystal inside the rock expands with the increase of temperature, resulting in various micro-fissures. Clearly, granite’s temperature damage is highly correlated with the micro-crystal. Therefore, the microstructures of granite are the key factors affecting the mechanical properties under temperature.
Numerous studies have shown that (Li et al., 2020; Yin et al., 2021; Ghasemi et al., 2020; Wang et al., 2020; Huang et al., 2020; He et al., 2021), the Micro-Parameters such as crystal content distribution and crystal size of granite will have a great influence on its macro-mechanical properties. Liu et al. (2018) studied the relationship between micro parameters such as crystal size and content of granite and macro mechanical properties. They used laboratory and numerical tests to prove that there is a specific relationship between the microstructures and macro-mechanical properties of granite. They then characterized the micro-effects in granite by combining the grain size inhomogeneity coefficient and content parameters. Chen et al. (2017a) (Nicksiar and Martin, 2014) furtherly to study the mechanical properties of granite and this parameter. The results show that this parameter obviously correlates with rock mechanical properties.
It is challenging to apply Physical testing in the microscopic study of granite because acquiring internal microstructure and preparing quantitative specimens is difficult to achieve. At the same time, the method of the numerical test has gradually become an important means of rock mechanics meso-study due to its convenience and accuracy (Wang and Heinz, 2019; Wu et al., 2021; Huang et al., 2017; Chen et al., 2017b). In terms of the quantification of micro-inhomogeneity of rock in the numerical model, on the one hand, it is the inhomogeneity of mechanical parameters; for example, the mechanical unit of rock is assigned in the form of Weibull (Wong et al., 2006; Tang et al., 2000) function, and Lan et al. (2010) tests with UDEC software show that the inhomogeneity of mechanical parameters has a great influence on the macro-mechanical properties of rock. On the other hand, it is the visible heterogeneity such as distribution structure, Zhou et al. (2019). Various studies on the microstructure have found that the distribution of minerals and the change of crystal particle size cause differences in stress distribution and crack propagation. Therefore, mechanical research on micro-crystals has gradually become an important part.
While analyzing the crystal structure, discrete element software is widely used in constructing numerical models, which can effectively analyze small mechanical changes. Potyondy and Cundall (2004), Potyondy (2010), introduced the equivalent crystalline model (GBM) to construct the crystalline rock model such as granite, marble, etc. Many scholars used this model to study crystalline rocks and found that the model could effectively describe the mechanical behaviour of crystalline rocks and put forward some improvements to the intergranular mechanical characteristics of the model (Yu et al., 2022; Saadat and Taheri, 2020; Tian et al., 2021; Qi et al., 2020). In order to explore the micromechanics test after the coupling of the crystalline model and temperature field model, James et al. (2021) and Xu et al. (2018) constructed GBM and thermal models using different discrete elements models and studied the mechanical properties of crystalline rocks caused by temperature field. The results show that the further development of microcracks caused by the same temperature is caused by the microstructure of crystals, which will further affect the strength characteristics of rocks. However, in these studies, there is no explicit modelling of crystal mesoscopic characterization parameters, which makes it difficult to quantitatively analyze the formation and development of microcracks in crystal structure under the action of temperature.
Therefore, this paper combines the improved GBM and thermal models proposed by Li et al. (2018). A granite crystal model of the temperature field containing the heterogeneity of calculable mesoscopic characterization parameters is established. The mechanical parameters of granite with different heterogeneity after temperature are statistically analyzed, and damage changes and micro-mechanical mechanism of granite microstructure caused by temperature variation were studied. The effect of inhomogeneity parameters on temperature-induced damage changes was revealed. It provides a reference basis for constructing the Enhanced geothermal system.
2 Methods and materials
2.1 Theoretical basis of mechanics
Numerous studies have shown that macroscopic failure of rock is caused by the accumulation of micro-cracks (Liu et al., 2017; Zhong et al., 2019; Zhang et al., 2022), which are generally caused by external loads or temperature fields. For multi-mineral crystalline rocks such as granite, the structure and morphology of crystals are important factors affecting micro-fissures’ development. In addition, there are great differences between the crystal’s mechanical properties and the crystal’s boundary (Gautam et al., 2019; Li et al., 2021). Therefore, considering the crystal distribution and grain boundary strength, a mechanical model of microcrack development under temperature is established. As shown in Figure 1, linear expansion occurs when the crystal is heated. The temperature increased the volume of the crystal, which expanded outwards and squeezed the surrounding crystal to form internal stress σinner. When there exist differences in crystal size and composition within the specimen, the internal stresses under the same temperature will also differ significantly. Micro-cracks occur when the area of partial stress concentration exceeds the critical value.
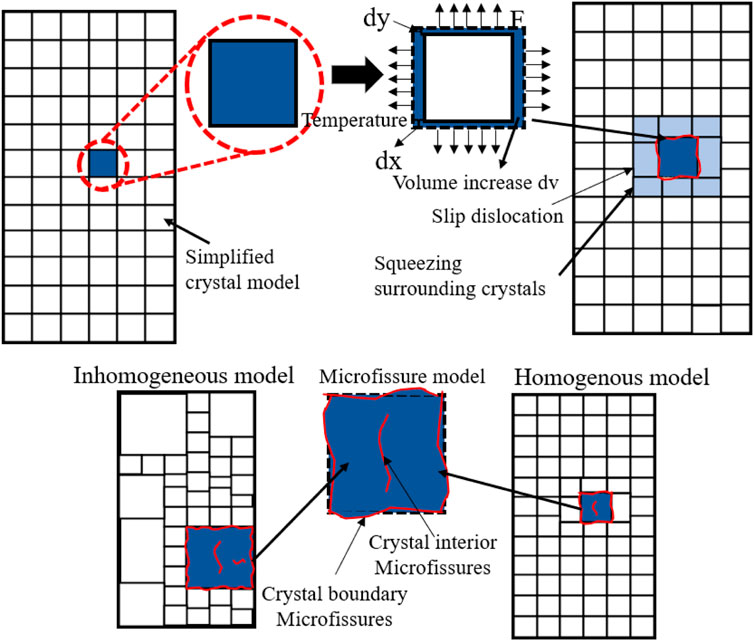
FIGURE 1. Mechanics change of crystal after thermal expansion.
This paper aims at the micro crack damage laws caused by crystal structures under the action of temperature, so it studies the mechanical properties of crystals at a specific temperature, which can be similar to a quasi-static force problem at a specific temperature. For example, micro-cracks caused by internal stress are generated after the temperature of the test piece increases from 20°C to t°C and then decreases to 20°C. Then, the research is carried out based on this already formed microfissure.
According to the thermal expansion characteristics of crystals (Helen and Mega, 1971; Bauzin et al., 2021), the volume of mineral crystals increases with the temperature. The equation of the thermal expansion coefficient of crystals can be expressed.
where α is the coefficient of thermal expansion of crystals; L is the length in one direction of the crystal; dl is the change in length in this direction; dt is the temperature change value.
The variation of temperature and coefficient of expansion of quartz and feldspar in granite under the impact of temperature was studied by Ahrens (1995). The curves of temperature and coefficient of expansion in the range of 25°C–600°C were proposed as shown in Figure 2.
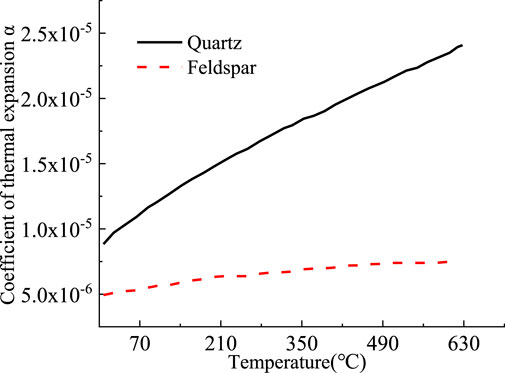
FIGURE 2. Relation curve between expansion coefficient and temperature of quartz and feldspar (Thomas J. Ahrens et al., 1995) 121 αquartz = [0.1417∗10-4+9.6518∗10-8∗(t+273)-1.6973(t+273)-2]/3 122 αfeldspar = [0.1394∗10-4+0.0597∗10-8(t+273)]/3.
(Thomas J. Ahrens et al., 1995)
αquartz = [0.1417∗10-4+9.6518∗10-8∗(t+273)-1.6973(t+273)-2]/3
αfeldspar = [0.1394∗10-4+0.0597∗10-8(t+273)]/3
The temperature changed the volume of the crystal and produced corresponding displacements in all directions. The elasticity of the combined material at this point is expressed in Eq. 2:
where σinner Internal stress of the unit; E is the elastic modulus of the unit; Δd is the strain of the unit.
While calculating the internal stress in a region, there may be more than one crystal contained in the region, which makes the thermal expansion coefficient, elastic modulus and pore-fissure distribution different, and due to different crystal sizes, the strain accumulation values are different. Therefore, a parameter characterizing the size and content of crystals in the region is defined as follows:
Within this region, the stress in a region forms a function of temperature t and the crystal meso-parameter a.
Liu et al. (2018) proposed the inhomogeneity coefficient H to characterize the mesoscale and content of crystals, which can be obtained using Eqs 5, 6:
where
Inhomogeneity factor H for the entire model
where di1 is the smallest particle type; di2 is the average particle size; di3 is the largest particle size.
H is a comprehensive weighted parameter for the size and content of mineral crystals, which is identical to the characteristic mineral parameters represented by parameter a in Eq. 4 and can be used to characterize the inhomogeneity of mineral crystals in rocks.
The mechanical properties within and between crystals vary greatly in granite, so the conditions under which micro-fissures occur when internal stress is concentrated vary. As shown in Eq. 8 and Figure 3, there are three stages during microfissure expansion caused by different internal stresses when the accumulation of internal stresses reaches different critical values and micro-fissures occur:
where σcrystal is the bearing strength of the crystal; σIntergranular is the intergranular bearing strength.
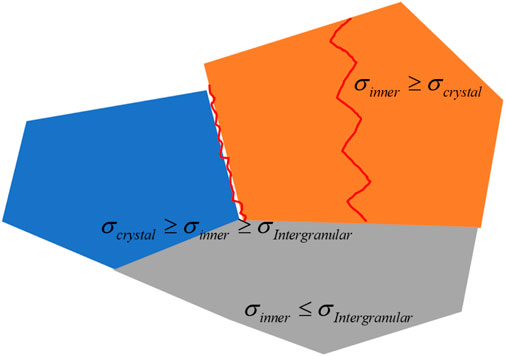
FIGURE 3. Fracture diagram of a crystal model.
2.2 Numerical simulation
In order to study the law of temperature damage induced by meso heterogeneity, a granite numerical model is constructed through PFC particle flow numerical software to model temperature test, in which GBM equivalent crystalline model is combined with thermal temperature field model. The same indoor physical tests are used to calibrate granite’s meso and temperature parameters.
2.2.1 Crystal model
Granite and other crystalline rocks are composed of a variety of crystalline minerals. In the process of rock formation, the mesostructure, including crystal particle size, morphology, crystallization degree etc., will be formed. Figure 4 is a micrograph of granite.
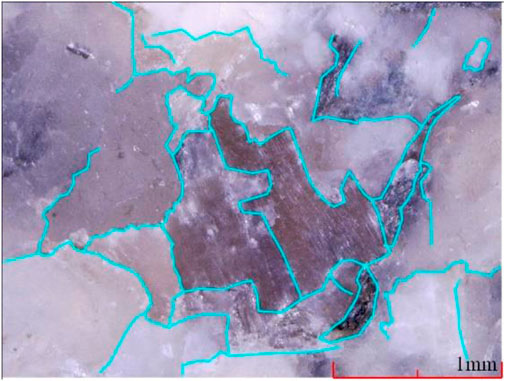
FIGURE 4. Granite micrographs.
Potyondy and Cundall (2004) and Potyondy (2010) proposed a GBM model to simulate the microstructures of crystalline rocks effectively. The GBM model mainly consists of intra-crystalline units and inter-crystalline units, the intra-crystalline units employ a parallel bond (pb) model, and the inter-crystalline units employ a smooth joint (sj) model. Such model construction can show the sliding effect after crystal failure. Li et al. (2018) put forward the nGBM model based on this model and replaced the SJ model of crystal boundary with the PB model with different parameters to better realize the locking effect when crystal boundary slides.
This model construction adopts the nGBM model proposed by Li X. F., and the steps are shown in Figure 5.
1. Build The 100 mm ×50 mm crystal model has the same size as the laboratory test. It contains three minerals, 55% feldspar, 35% quartz, and 10% mica.
2. Characterize the particles in the model as crystals and construct the crystal grid and component division by importing MATLAB software and Rhinoceros software.
3. Import the grid into the PFC software and regenerate the small particles to fill 100 mm×50 mm model space.
4. Re-grouping the particles and contact units to facilitate the generation of different parameters.
5. The Fish function is used to compile the micro-crack identification function, and the micro-crack identification distance is set to 0.25 mm. At the same time, the tension crack and shear crack inside and at the boundary of the crystal is identified.
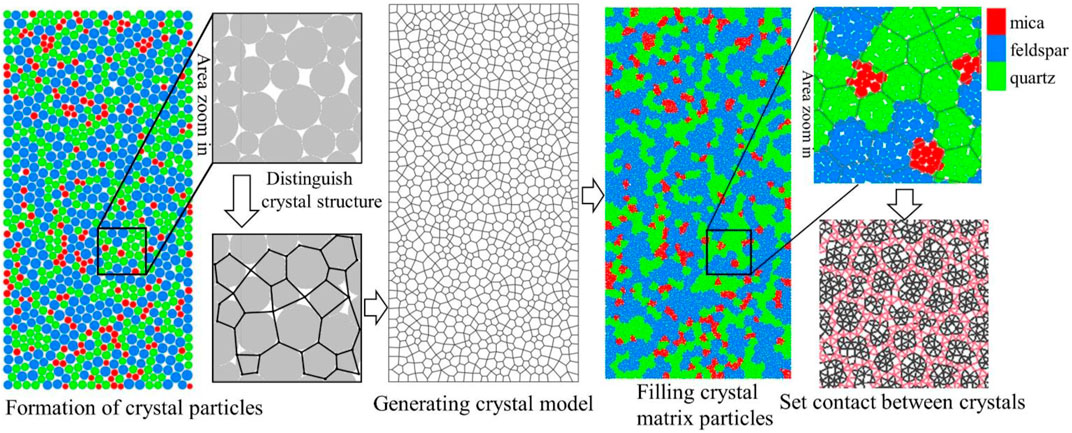
FIGURE 5. GBM model construction.
2.2.2 Temperature model
In the PFC software, the temperature model is shown in Figure 6A, and the mechanical model is shown in Eq. 10. Changes in temperature and coefficient of expansion also change the size of the base particles. Based on the theory of elasticity, the force between particles is formed by the size change of the original particles.
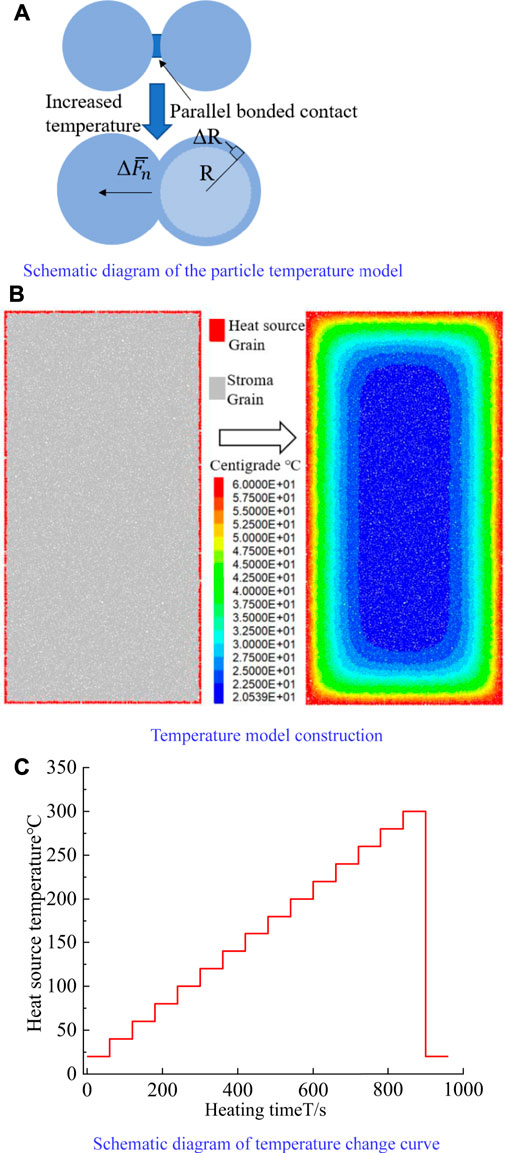
FIGURE 6. Temperature field model construction. (A) Schematic diagram of the particle temperature model. (B) Temperature model construction. (C) Schematic diagram of temperature change curve.
In order to investigate the meso-mechanical behaviour induced by temperature, a thermo-mechanical model has to be built to realize the internal micro-variation under in temperature field. The modelling process is shown in Figure 6B
1. Read the constructed GBM model into the Thermal model.
2. Set the temperature loading boundary and heat source section. Set a 0.5 mm wide heat source layer from the model boundary in this test.
3. Given the temperature curve of the heat source, considering the calculation time and the difference in the laboratory test, the temperature is increased from 20°C as a gradient and maintained for 60 s after the temperature tends to stabilize. After heating for many times, the temperature of the test piece rises to the temperature required for the test. Then the temperature of the specimen is reduced to 20°C as shown in Figure 6C.
4. The experiments at 200, 300, 400, 500, and 600°C were constructed, respectively.
Temperature-dependent particles are modelled as Eq. 9 mechanical model and Eq. 10.
where the standard component of bearing capacity is
2.2.3 Parameter calibration
Meso parameters are essential to ensure whether the numerical model is accurate. Therefore, it is necessary to calibrate the more accurate meso parameters before the test. However, the meso parameters required for PFC2D are difficult to be obtained through the indoor test, mesoscopic parameters can be obtained by “trial and error method” based on the mechanical parameters from the indoor uniaxial test, such as pressure resistance, elastic modulus, Poisson’s ratio and other macro mechanical parameters (Castro-Filgueira et al., 2017; Li et al., 2022). Finally, a numerical model consistent with the laboratory test in strength parameters and failure modes is constructed.
Many scholars used the GBM model to build a granite model and matched the corresponding meso parameters (Hu et al., 2019; Hannes et al., 2015; Liu et al., 2018). In this test, the fine-grained granite produced in Pingjiang Hunan Province was used for the test, and the test results were used as the criteria for parameter matching.
The micro-crack damage caused by temperature is studied in this paper. Therefore, the temperature change of the specimen is an important variable. The whole temperature of the model is monitored in the numerical model. After the internal particle temperature is maintained at the target temperature for 60 s, the next step is carried out. In the numerical experiment, each temperature increase is 20°C to ensure that the temperature changes the crystal volume. In order to ensure that the temperature inside the specimen fully rises to the set temperature during the test. Referring to the temperature test of Yu et al. (2021b), set the heating test piece as 4 h.
A group of granite is placed in the heating furnace, and the heating furnace is raised by 20°C every 5 min until the temperature reaches 200°C, and then the temperature is maintained for 4 h to make the internal and external temperatures of the test pieces consistent. Then the test piece is quickly taken out and placed in 20°C water to cool for 25 min. After that, it is taken out of the water to dry in the laboratory for 8 h.
The tests of 300, 400, 500, and 600°C were also carried out according to the test process of 200°C.
A uniaxial test is performed on the specimens that have completed the temperature test, and unheated control groups are set up with the test results shown in Table 1.
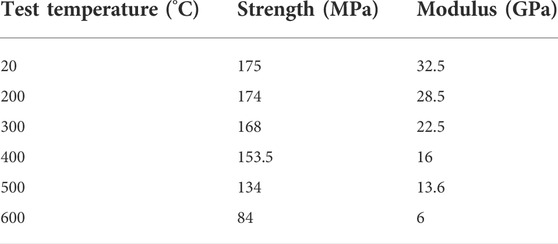
TABLE 1. Test results of granite at different temperatures.
The crystal size of a mineral is an important parameter affecting the modelling results. This test specimen is from a complete granite with small grain changes between different samples. Therefore, some samples are selected for microscopic measurement. Ten measuring points on the specimen section are selected, and the particle sizes of different crystals are determined by electron microscopy, as listed in Table 2.
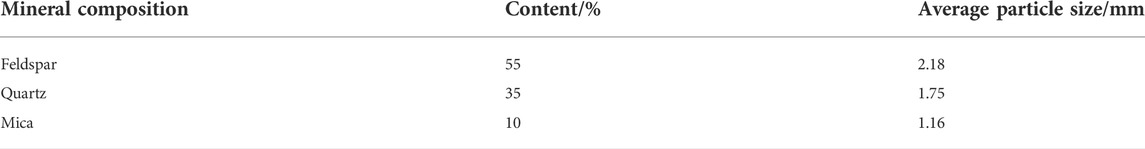
TABLE 2. Calibrated mineral content and grain size of granite.
According to the value of granite crystal parameters in some GBM models, the order of crystal strength was identified as quartz, feldspar and mica, the strength of crystal boundary is much lower than that of crystal interior. The parameters of the GBM model were corrected according to this law.
After the granite strength model was modified, the temperature field was added to the model, and the linear expansion coefficient of the crystal changed with the temperature. Based on the crystal expansion curve established by Ahrens (1995), by comparing with the indoor test parameters, the parameter b is added to the linear expansion coefficient, where b ≈ 0.5. The linear expansion coefficient equation with temperature variation is constructed
The Fish function is used to assign values to the main minerals in granite, including quartz and feldspar. In order to ensure the calculation speed, the thermal conductivity coefficient is improved by 5–10 times. The specific process of parameter calibration is as follows.
Figure 7A is the parameter matching flow chart; Figure 7B is the parameter matching strength result; Figure 7C is the failure pattern matching result. According to the results in Figure 7, it can be seen that the uniaxial strength of the specimen decreased with temperature in the shape of a quadratic curve, while the modulus parameter decreased linearly. The results of the indoor mechanical test and numerical test are consistent, and the difference in parameters of the fitting curve was slight, indicating that this parameter can well reflect the mechanical law under the temperature field. The parameter results are shown in Tables 3, 4.
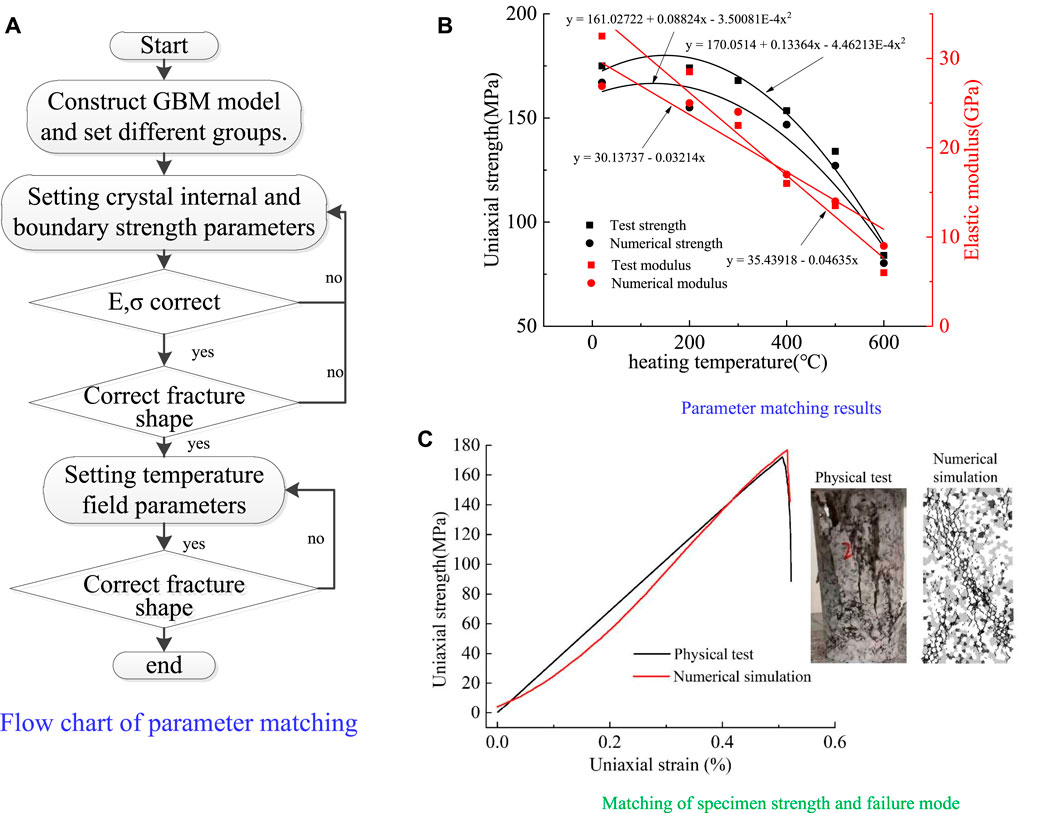
FIGURE 7. (A) Flow chart of parameter matching. (B) Parameter matching results. (C) Matching of specimen strength and failure mode.
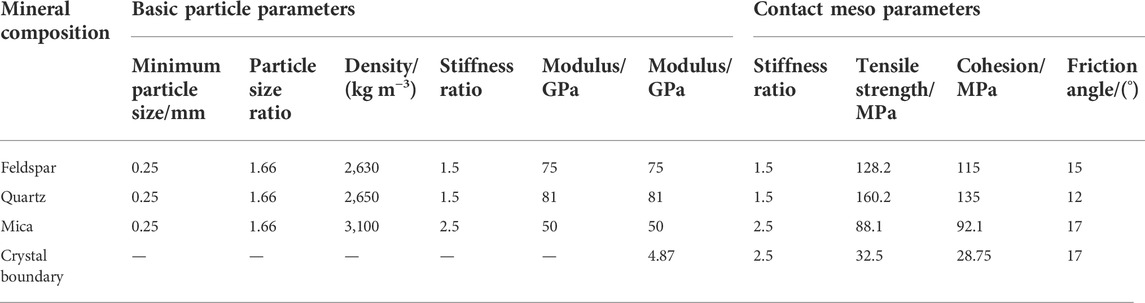
TABLE 3. PFC meso parameters.
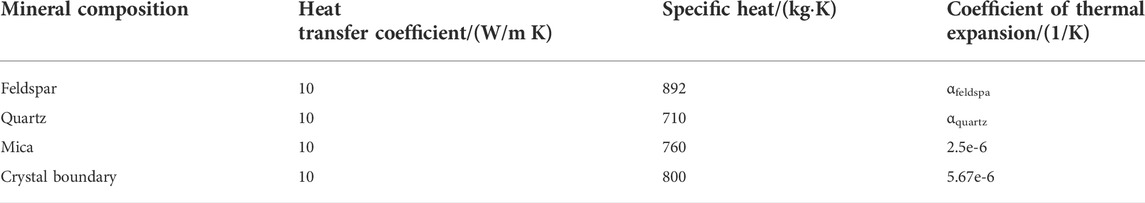
TABLE 4. Temperature meso parameters.
2.2.4 Inhomogeneous crystals
Based on Peng et al. (2017), Liu et al. (2018) proposed the heterogeneity coefficient H, which can more effectively consider rock’s internal crystal size and content distribution. The method comprehensively considers the overall distribution of the minimum, maximum and average particle sizes, as shown in Eqs 5, 6.
Using the same method as GBM model construction, the corresponding crystal model is first built in PFC software according to the particle proportion, and then the coordinate and particle size-related information is derived. Seven models with different heterogeneity coefficients are built using MATLAB and Rhinocero software, from small to large: M1(H=0.154), M2(H=0.214), M3(H=0.293), M4(H=0.355), M5(H=0.432), M6(H=0.524), M7(H=0.154). As shown in Figure 8 and Table 5.
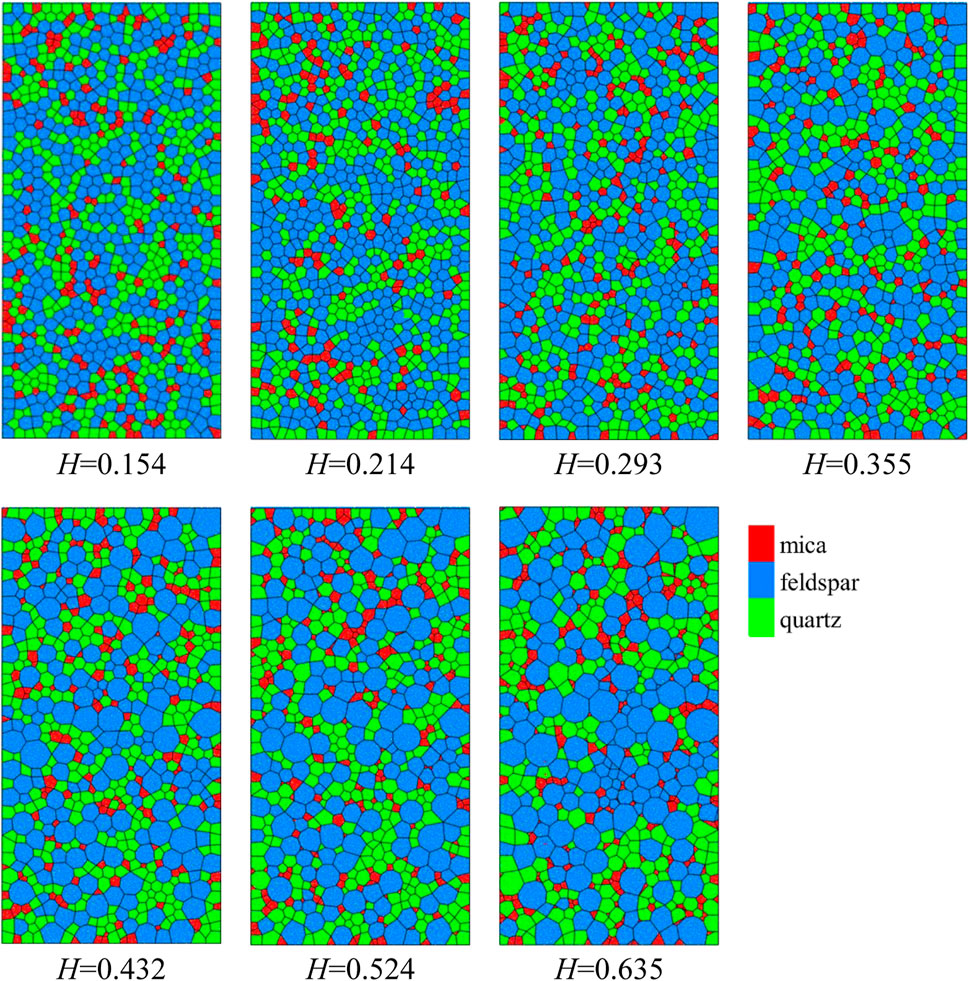
FIGURE 8. Characterization of different inhomogeneity coefficient results.
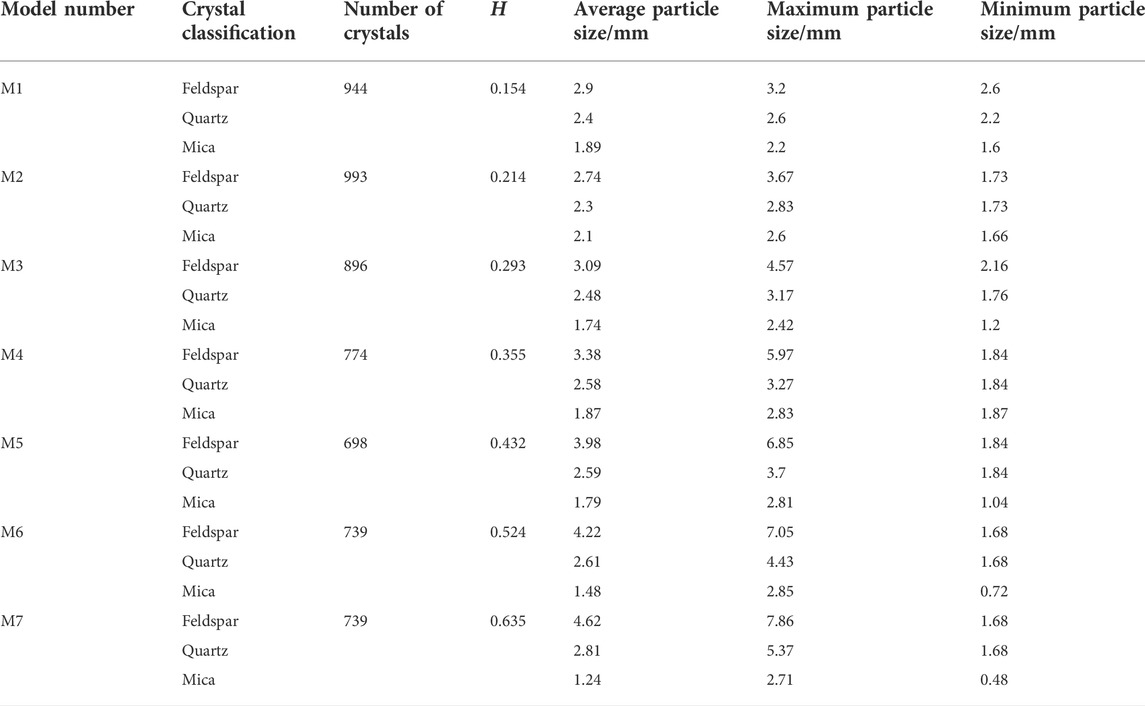
TABLE 5. Grain size distribution of crystals.
3 Results and analysis
In laboratory tests, the mechanical properties of granite have great discreteness. In geology, granite is classified into fine-grained granite, medium-grained granite, coarse-grained granite and pegmatite according to particle size, indicating obvious structural differences in granite. Because of this difference You and Zou (2000) studied the relationship between heterogeneity and rock strength and determined their relationship. In recent years Liu et al. (2018) further explored the characterization of meso heterogeneity of granite and proposed the heterogeneity coefficient H, which can effectively reflect the influence of mineral crystal size and content.
3.1 Strength analysis
Through the GBM model and thermal model, a granite crystalline model that can model the temperature effect is constructed, in which seven models with different heterogeneity coefficients are constructed to distinguish the effects of different structures with the same H value on rock mechanical properties. Three models with different forms are constructed for a certain h-value, and there are 21 models. Then the uniaxial mechanical test under room temperature and the uniaxial mechanical test after temperature damage are carried out, and the results are shown in Figure 9, it can be seen that with the increase in H value, the uniaxial strength of the specimen shows a linear downward trend, and this tend can be fitted as y = 24.35 + 8.53x, R2 = 0.97. At the same time, it can be found that the elastic modulus of the test piece shows an increasing linear trend with the increase of the H value, whose variation can be fitted as y = 180.7 − 121.26x, R2 = 0.94. It can also be seen that the confidence of these two linear laws is high, and the regularity is apparent. Based on the analysis of micromechanics, it can be known that the reason for the decrease in strength is the difference in crystal particle size. This phenomenon tends to cause stress concentration and micro fissures around the crystal. At the same time, a large crystal interface can easily form a crystal slip. The microscopic factor that causes the increase of elastic modulus is the accumulation of internal stress during crystal deformation due to the significant difference in crystal size, which will increase the rate of microfissure accumulation.
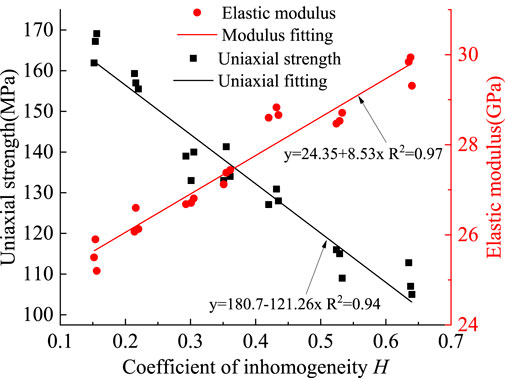
FIGURE 9. H value and granite strength parameters.
3.2 Damage analysis
Damage value D is an essential index for the study of rock properties. From the mesoscopic point of view, the damage is the process of forming new microcracks and reducing the bearing area. This paper studies the formation and development of structure and microcracks. There are apparent differences in the microcracks formed by different mineral crystals under the action of temperature. These differences further affect the mechanical properties of rocks. At the same time, these differences will also be reflected in the change process of damage value.
The granite with different inhomogeneity coefficients H was tested numerically under temperature fields. After the temperature changed, the specimens were tested uniaxially. The damage results were calculated through the basic modulus damage Eq. 11.
Where D is the damage coefficient, ET is the modulus of elasticity of the specimen after temperature action, E0 is the modulus of elasticity before temperature action.
Figure 10 shows the strength change of the test piece after different temperatures. The value of the same gradient H changes slightly. The figure shows the average intensity of the same gradient H. It can be seen that heterogeneity affects the strength of the specimen, but temperature has a greater impact on the strength. When H was 0.154, 0.214, 0.293, 0.355, 0.432, 0.524, and 0.635, respectively, the strength of the 600°C specimens was about 46.63%, 47.43%, 55.08%, 52.01%, 40.10%, 28.02%, and 10.41% of the 20°C specimens, suggesting that the influence of temperature increased nonlinearly with the increase of inhomogeneity.
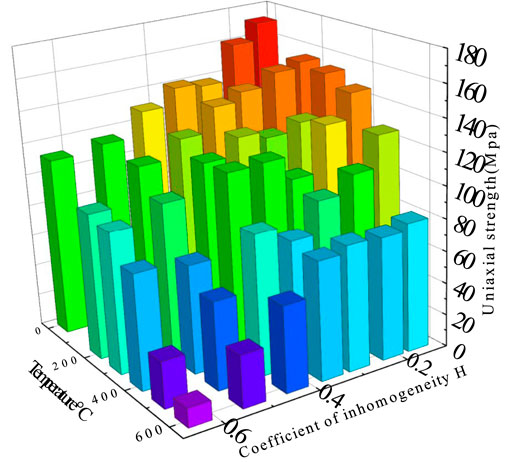
FIGURE 10. Uniaxial strength dependence of inhomogeneity and temperature field.
Damage at different temperatures is calculated using Eq. 11, and the results are shown in Figure 11 and Table 6.
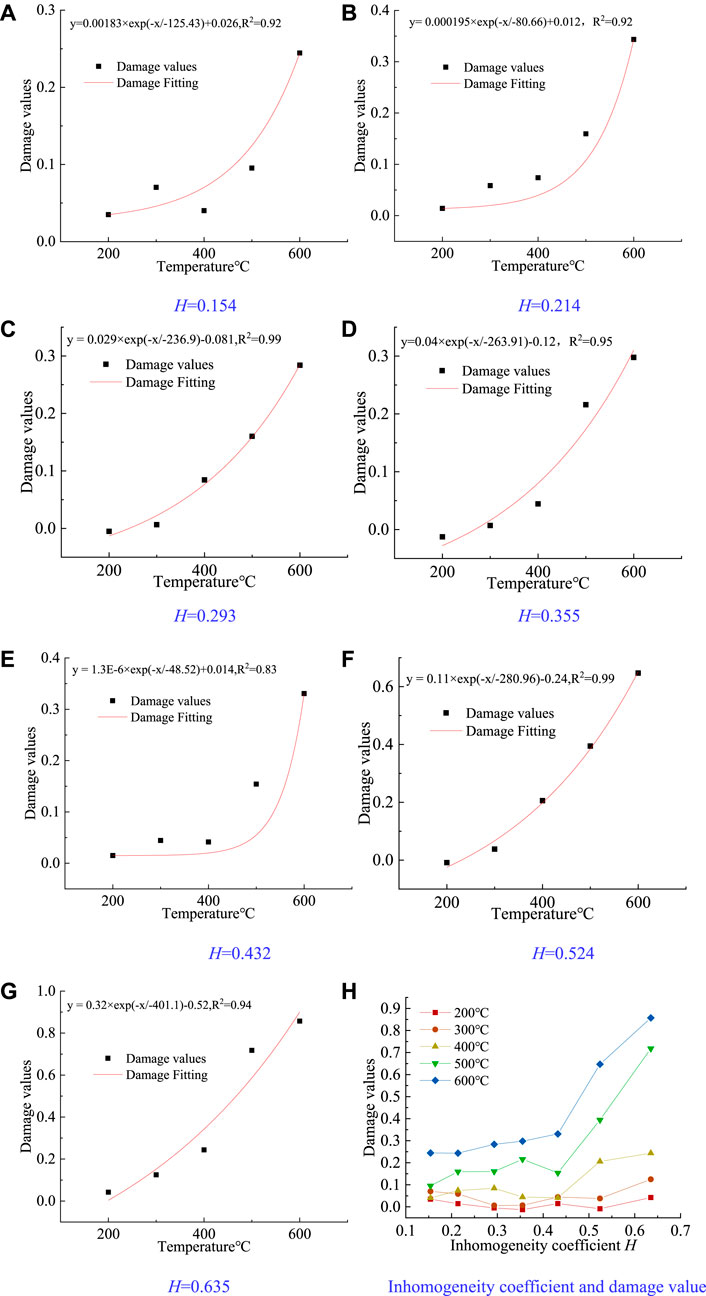
FIGURE 11. Relation between inhomogeneity coefficient and temperature damage value. (A) H = 0.154 damage value curve. (B) H = 0.214 damage value curve. (C) H = 0.293 damage value curve. (D) H = 0.355 damage value curve. (E) H = 0.432 damage value curve. (F) H = 0.524 damage value curve. (G) H = 0.635 damage value curve. (H) Inhomogeneity coefficient and damage value.
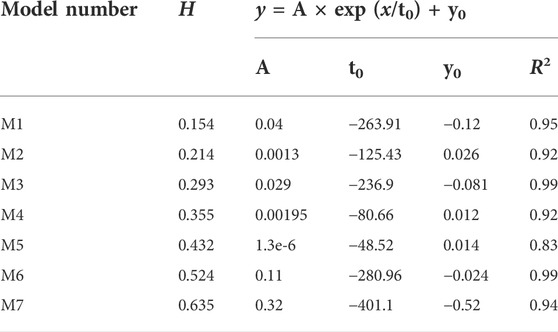
TABLE 6. Damage fitting equation coefficients for different H values.
It can be seen from Figure 11 that the damage value of specimens gradually increased with the inhomogeneity coefficient, but the change in damage value was not obvious when the temperature was less than 400°C. The inhomogeneity coefficient greatly affects specimens’ damage when the temperature is more than 400°C. When H = 0.154, the damage values at 500 and 600°C were only 13.28% and 28.52% of the damage values when H = 0.635. From the microscopic point of view, at 400°C, the volume expansion caused by the temperature change is not large enough, the internal stress concentration is not obvious, and the phenomena of internal stress concentration and crack propagation due to inhomogeneity are not effectively highlighted. When the temperature is higher than 400°C, more microcracks are produced due to internal stress concentration and crystal denaturation. At this time, the stress concentration due to inhomogeneity further accelerated the formation of cracks and led to the rapid decrease of mechanical properties.
3.3 Fracture analysis
During the failure process of rock specimens, the development and accumulation of micro-fissures are important phenomena of rock destabilization. The development of micro-fissures is an important indicator for studying rock micro-mechanical properties. Using fish function to write a program, the generation process of microcracks under the action of temperature can be recorded. The result is shown in Figure 12.
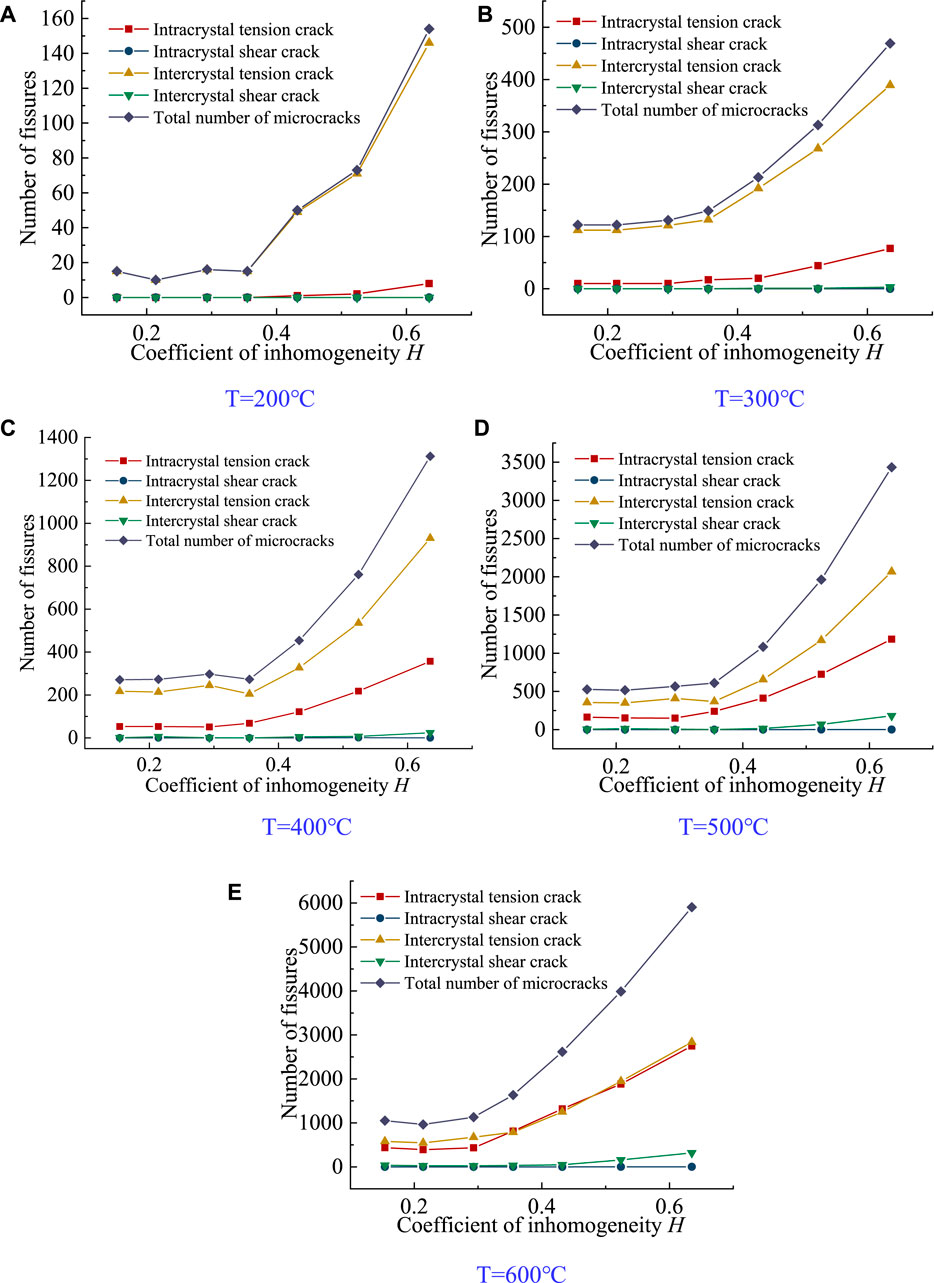
FIGURE 12. Inhomogeneity coefficient H and fissure development. (A) T = 200°C development of microcracks. (B) T = 300 °C development of microcracks. (C) T = 400°C development of microcracks. (D) T = 500°C development of microcracks. (E) T = 600°C development of microcracks.
It can be seen that the total number of micro-cracks in specimens increased with the temperature inhomogeneity coefficient. At the same time, it is also consistent with the damage law of the specimens, which is consistent with the law under its strength. It can also be observed in the experiment that the shear crack in the crystal was always challenging to form. When the temperature is 200, 300, 400, 500, and 600°C, respectively, and the heterogeneity coefficient H = 0.154, the number of tensile cracks in the crystal of the specimen is 0, 10, 53, 164, and 436, while the number of tensile cracks between the crystals is 15, 172, 217, 356, and 779. At this time, it is more difficult to form microcracks in crystals than between crystals. When H = 0.635, the internal tension cracks of the crystal with temperature were 8, 77, 357, 1,184, and 2,749, respectively, while the inter-crystal tension cracks were 146, 389, 931, 2,067, and 2,836. This shows that when the temperature and heterogeneity coefficient are high, a large number of tensile microcracks will also appear in the crystal. This is due to the crystal reconstruction and dislocation under high-temperature conditions, resulting in the formation of microcracks.
It can be seen from Figure 13A that the failure mode of the specimen is different due to the value of H. when H = 0.154, the cracks are distributed on the left and right sides of the specimen, and when H rises, the cracks gradually gather to one side. Moreover, when H = 0.635, there are obvious microcracks in the crystal due to the apparent stress concentration around the large crystal. When the strength exceeds the bearing limit of the crystal, microcracks in the crystal will be formed.
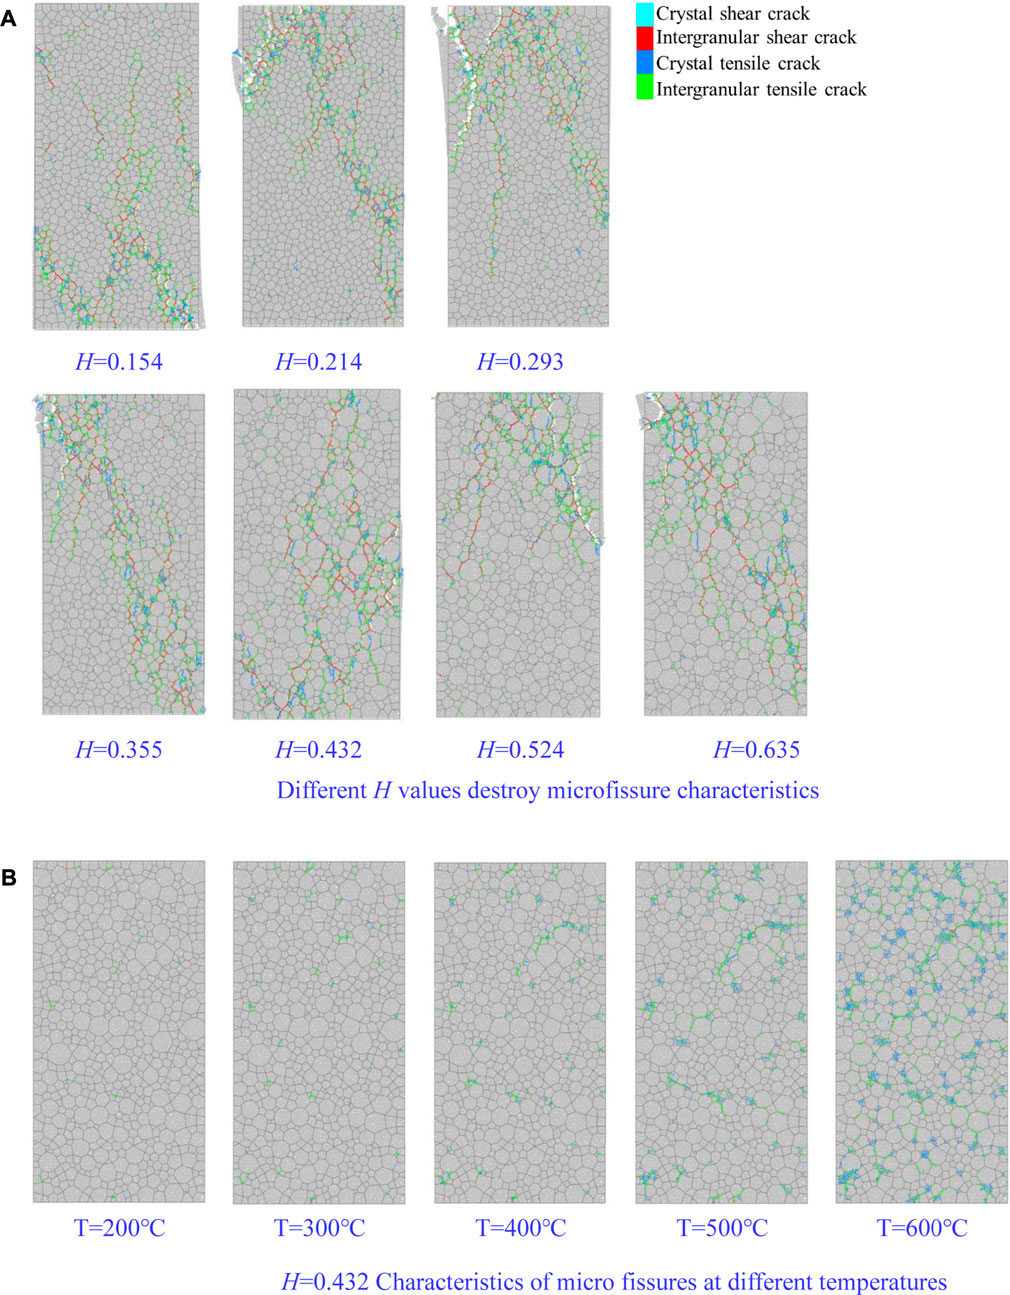
FIGURE 13. (A) Different H values destroy microfissure characteristics. (B) H=0.432 Characteristics of micro fissures at different temperatures.
Figure 13B shows the development of microcracks at different temperatures when H = 0.432. It can be seen that the total number of microcracks increases with the increase in temperature. The cracks caused by temperatures below 400°C are mainly tensile cracks between crystals. When the temperature is higher than 400°C, the temperature causes more tensile cracks inside crystals. There is a critical point near 400°C that makes the specimen change significantly. The mesoscopic reason for this phenomenon is that the denaturation temperature of mica, feldspar and other minerals is usually not higher than 400°C. At this time, the expanded quartz particles accumulated considerable stress and were released, causing crystal dislocation and further development of microcracks.
4 Discussion
The change of rock mechanical properties caused by rock crystals is usually studied from two aspects: geometric heterogeneity and mechanical parameter heterogeneity. This study focuses on geometric heterogeneity. It can be seen from the experimental results that heterogeneity dramatically affects the mechanical properties of rocks. The quantitative study of heterogeneity is essential for studying rock meso damage. By calculating the comprehensive average parameters such as mineral crystal size and content, a quantitative parameter H for heterogeneity is obtained. The numerical test results show that the change of H value greatly affects the mechanical properties of granite. However, this research is difficult to conduct from the perspective of laboratory tests, mainly because the preparation of specimens and the results of mesoscopic changes are difficult to observe. In order to further determine the relationship between the crystal structure and mechanical properties of granite minerals, more detailed experiments or corresponding numerical models should be carried out.
In this study, heterogeneity is the characterization parameter of the mesostructure of rock crystal size and content. During the test, it can be seen that under the same temperature, granites with different structures have obvious different damage. As the characterization parameter of different crystal structures, the H value is an effective quantitative method to study the temperature damage of granite. However, to ensure the correctness of the numerical results, the selection of parameters is particularly important. In this paper, several groups of indoor test results were used to match the numerical tests, and the failure modes of the strength, modulus and temperature effects were matched to achieve a consistent effect. However, during the test, it was found that there was a particular difference in the modulus decreasing speed between the numerical test and the laboratory test, as shown in Figure 7B. The analysis of several parameters may be attributed to the micro-modulus Ecrystal changes at different temperatures, but the selected modulus remains unchanged during the model setting process. The physical test of this parameter is difficult to determine, and further design and experimental study are required.
According to the research on micro-fissures and damage, it is found that the commonly used damage formula refers to the distribution and content of micro-fissures, but the strength of different minerals in granite differs significantly. Therefore, the contribution of micro-fissures appearing in different minerals to damage is different, and a damage contribution value γ is proposed, this parameter is used as the proportion of different mineral damage to the decline of overall mechanical properties.
5 Conclusion
Aiming at the influence of temperature field on mechanical properties of granite, the weakening law of mechanical properties of granite under different non-uniform coefficient H is studied using discrete element numerical simulation, and the following conclusions are drawn.
With the increase of the coefficient of inhomogeneity H, the uniaxial strength of rock shows an obvious downward trend.
At different temperatures, damage value D of rock increases with the increase of the inhomogeneity coefficient, and this phenomenon is obvious when the temperature is higher than 400°C, which is consistent with the sudden change of properties of granite at 400°C.
With the increase in inhomogeneity, the microcracks caused by temperature gradually change from intercrystalline microcracks to intracrystal microcracks. Shear microcracks in crystals, which are rare throughout the temperature test.
When the temperature exceeds 400°C, the stress concentration caused by heterogeneity is more obvious, and the rock strength will be further reduced (Huang et al., 2017).
Data availability statement
The original contributions presented in the study are included in the article/supplementary material, further inquiries can be directed to the corresponding author.
Author contributions
DG carried out the main writing of the article and the content of numerical test. CS revised the structure of the article and provided financial support. CX did some experiments in this article. JZ has sorted out the references and layout of the article.
Funding
This research was completed under the support of the natural science foundation of Inner Mongolia. The project number is (2019ms05011). In addition, part of the funds came from the graduate program of colleges and universities in the Inner Mongolia Autonomous Region.
Conflict of interest
The authors declare that the research was conducted in the absence of any commercial or financial relationships that could be construed as a potential conflict of interest.
Publisher’s note
All claims expressed in this article are solely those of the authors and do not necessarily represent those of their affiliated organizations, or those of the publisher, the editors and the reviewers. Any product that may be evaluated in this article, or claim that may be made by its manufacturer, is not guaranteed or endorsed by the publisher.
References
Ahrens, T. J. (1995). Mineral Physics And Crystallography A Handbook Of Physical Constants Ahrens, 34. American Geophysical Union, 38.
Bauzin, J., Cherikh, M., and Laraqi, N. (2021). Identification of thermal boundary conditions and the thermal expansion coefficient of a solid from deformation measurements. Int. J. Therm. Sci. 164, 106868. doi:10.1016/j.ijthermalsci.2021.106868
Castro-Filgueira, U., Alejano, L. R., Ivars, M., and Arzúa, J. (2017). Sensitivity analysis of the micro-parameters used in a PFC analysis towards the mechanical properties of rocks. Procedia Eng. 191, 488–495. doi:10.1016/j.proeng.2017.05.208
Chen, Y. L., Wang, S. R., Ni, J., Azzam, R., and Fernandez-Steeger, T. M. (2017a). An experimental study of the mechanical properties of granite after high temperature exposure based on mineral characteristics. Eng. Geol. 220, 234–242. doi:10.1016/j.enggeo.2017.02.010
Chen, Z., Chen, G., and Liu, Y. (2017b). Research advance on numerical simulation of thermodynamic process of granite formation. ACTA PETROL. SIN. 33, 1498–1506.
Cheng, Y., Zhang, Y., Yu, Z., and Hu, Z. (2021). Investigation on reservoir stimulation characteristics in hot dry rock geothermal formations of China during hydraulic fracturing. Rock Mech. Rock Eng. 145, 3817–3845. doi:10.1007/s00603-021-02506-y
Dong, Z., Sun, Q., Zhang, W., and Xu, C. (2020). Thermal damage of granite after thermal shock cycle. Géotechnique Lett. 10, 168–173. doi:10.1680/jgele.19.00062
Gautam, P. K., Verma, A. K., Singh, T. N., Hu, W., and Singh, K. H. (2019). Experimental investigations on the thermal properties of Jalore granitic rocks for nuclear waste repository. Thermochim. Acta 681, 178381. doi:10.1016/j.tca.2019.178381
Gautam, P. K., Singh, T. N., Verma, A. K., and Sharma, P. (2018). Evolution of thermal damage threshold of jalore granite. Rock Mech. Rock Eng. 51, 2949–2956. doi:10.1007/s00603-018-1493-2
Ghasemi, S., Khamehchiyan, M., Taheri, A., Nikudel, M. R., and Zalooli, A. (2020). Crack evolution in damage stress thresholds in different minerals of granite rock. Rock Mech. Rock Eng. 53, 1163–1178. doi:10.1007/s00603-019-01964-9
Hannes, H., Babadaglia, T., and Zimmermannb, G. (2015). A grain based modeling study of fracture branching during compression tests in granites. Int. J. ROCK Mech. Min. Sci. 77, 152–162. doi:10.1016/j.ijrmms.2015.04.008
He, M., Zhang, Z., Zhu, J., and Ning, L. (2021). Correlation between the constant mi of hoek–Brown criterion and porosity of intact rock. Rock Mech. Rock Eng. 55, 1–14. doi:10.1007/s00603-021-02718-2
Helen, D., and Mega, W. (1971). Crystal structures and thermal expansion. Mater. Res. Bull. 6, 1007–1018. doi:10.1016/0025-5408(71)90080-8
Hu, X., Biankang, L., Li, B., and Chen, M. (2019). Discrete element simulation study on the influence of microstructure heterogeneity on the creep characteristics of granite. Chin. J. Rock Mech. Eng. 38, 2069–2082. doi:10.13722/j.cnki.jrme.2019.0438
Huang, F., Huang, J., Jiang, S., and Zhou, C. (2017). Landslide displacement prediction based on multivariate chaotic model and extreme learning machine. Eng. Geol. 218, 173–186. doi:10.1016/j.enggeo.2017.01.016
Huang, F., Cao, Z., Jiang, S-H., Zhou, C., Guo, Z., and Guo, Z. (2020). Landslide susceptibility prediction based on a semi-supervised multiple-layer perceptron model. Landslides 17, 2919–2930. doi:10.1007/s10346-020-01473-9
Huang, F., Chen, J., Liu, W., Huang, J., Hong, H., and Chen, W. (2022). Regional rainfall-induced landslide hazard warning based on landslide susceptibility mapping and a critical rainfall threshold. Geomorphology 408, 108236. doi:10.1016/j.geomorph.2022.108236
James, W., Ougier-Simonin, A., Stavrou, A., Vazaios, I., Murphy, W., Thomas, M. E., et al. (2021). Laboratory experiments and grain based discrete element numerical simulations investigating the thermo-mechanical behaviour of sandstone. Geotech. Geol. Eng. (Dordr). 39, 4795–4815. doi:10.1007/s10706-021-01794-z
Kang, F., Li, Y., and Tang, C. (2021). Grain size heterogeneity controls strengthening to weakening of granite over high-temperature treatment. Int. J. Rock Mech. Min. Sci. 145, 104848. doi:10.1016/j.ijrmms.2021.104848
Lan, H., Martin, C. D., and Hu, B. (2010). Effect of heterogeneity of brittle rock on micromechanical extensile behavior during compression loading. J. Geophys. Res. 115, B01202–B01214. doi:10.1029/2009jb006496
Li, X. F., Zhang, Q. B., Li, H. B., and Zhao, J. (2018). Grain-based discrete element method(GB-DEM) modelling of multiscale fracturing in rocks under dynamic loading. Rock Mech. Rock Eng. 51, 3785–3817. doi:10.1007/s00603-018-1566-2
Li, C., Hu, Y., Meng, T., Jin, P., Zhao, Z., and Zhang, C. (2020). Experimental study of the influence of temperature and cooling method on mechanical properties of granite Implication for geothermal mining. Energy Sci. Eng. 8, 1716–1728. doi:10.1002/ese3.627
Li, Q., Li, X., and Yin, T. (2021). Factors affecting pore structure of granite under cyclic heating and cooling A nuclear magnetic resonance investigation. Geothermics 96, 102198. doi:10.1016/j.geothermics.2021.102198
Li, G., Bodahi, F., He, T., Luo, F., Duan, S., and Meng, L. (2022). Sensitivity analysis of macroscopic mechanical behavior to microscopic parameters based on PFC simulation. Geotech. Geol. Eng. (Dordr). 40, 3633–3641. doi:10.1007/s10706-022-02118-5
Liu, C., Wang, L., Zhang, X., Mao-tong, L., and Zhou, T. (2017). Mesoscopic damage mechanism of coal seam and rock mass in deep field under different confining pressures by short period creep tests. Rock Soil Mech. 38, 2584–2588. doi:10.16285/j.rsm.2017.09.015
Liu, G., Cai, M., and Huang, M. (2018). Mechanical properties of brittle rock governed by micro-geometric heterogeneity. Comput. Geotechnics 104, 358–372. doi:10.1016/j.compgeo.2017.11.013
Musa, D. A., and Rosalind, A. A. (2021). A thermo-hydro-mechanical model of a hot dry rock geothermal reservoir. Renew. Energy 176, 475–493. doi:10.1016/j.renene.2021.05.070
Nicksiar, M., and Martin, C. (2014). Factors affecting crack initiation in low porosity crystalline rocks. Rock Mech. Rock Eng. 47, 1165–1181. doi:10.1007/s00603-013-0451-2
Pan, D., Hong, K., Fu, H., Zhou, J., and Zhang, N. (2021). Experimental study of the mechanism of grouting colloidal nano-silica in over-broken coal mass. Q. J. Eng. Geol. Hydrogeo. 54, 161. doi:10.1144/qjegh2020-161
Peng, J., Wong, L. N. Y., and Teh, C. I. (2017). Influence of grain size heterogeneity on strength and microcracking behavior of crystalline rocks. J. Geophys. Res. Solid Earth 122, 1054–1073. doi:10.1002/2016jb013469
Potyondy, D. O. (2010). “A grain-based model for rock: Approaching the true microstructure,” in Proceedings of the Rock Mechanics in the Nordic Countries, Kongsberg, Norway (Kongsberg: Norwegian Group for Rock Mechanics), 225–234.
Potyondy, D. O., and Cundall, P. (2004). A bonded-particle model for rock. Int. J. Rock Mech. Min. Sci. 41, 1329–1364. doi:10.1016/j.ijrmms.2004.09.011
Qi, S., Lan, H., and Huang, X. (2020). Factors controlling the difference in Brazilian and direct tensile strengths of the lac du Bonnet granite. Rock Mech. Rock Eng. 53, 1005–1019. doi:10.1007/s00603-019-01946-x
Saadat, M., and Taheri, A. (2020). Modelling micro-cracking behaviour of granite during direct tensile test using cohesive GBM approach. Eng. Fract. Mech. 239, 107297. doi:10.1016/j.engfracmech.2020.107297
Tang, C. A., Liu, H., Lee, P. K. K., Tsui, Y., and Tham, L. G. (2000). Numerical studies of the influence of microstructure on rock failure in uniaxial compression—Part I:Effect of heterogeneity. Int. J. Rock Mech. Min. Sci. 37, 555–569. doi:10.1016/s1365-1609(99)00121-5
Tian, W-L., Yang, S-Q., and Wang, J-G. (2021). A new method to model the mechanical behavior of granitic basement rock in PFC2D. Arab. J. Geosci. 14, 1538. doi:10.1007/s12517-021-08056-5
Wang, F., and Heinz, K. (2019). Thermo-mechanical properties of granite at elevated temperatures and numerical simulation of thermal cracking. Rock Mech. Rock Eng. 52, 3737–3755. doi:10.1007/s00603-019-01837-1
Wang, F., Frühwirt, T., and Heinz, K. (2020). Influence of repeated heating on physical-mechanical properties and damage evolution of granite. Int. J. Rock Mech. Min. Sci. 136, 104514. doi:10.1016/j.ijrmms.2020.104514
Wang, S., Chen, Y., and Xiong, M. (2021). The Mechanism of Fracture and Damage Evolution of Granite in Thermal Environment. Mater. Basel. Switz. 14, 7234. doi:10.3390/ma14237234
Wong, L. N. Y., Guo, T., Wu, Z., and Xiao, X. (2021). How do thermally induced microcracks alter microcracking mechanisms in Hong Kong granite? Eng. Geol. 292, 106268. doi:10.1016/j.enggeo.2021.106268
Wong, T., Wong, R. H. C., Chau, K. T., and Tang, C. A. (2006). Microcrack statistics Weibull distribution and micromechanical modeling of compressive failure in rock. Mech. Mat. 38, 664–681. doi:10.1016/j.mechmat.2005.12.002
Wu, X., Wang, P., Guo, Q., Zhang, J., and Cai, M. (2021). Numerical simulation of the influence of flow velocity on granite temperature field under thermal shock. Geotech. Geol. Eng. (Dordr). 39, 37–48. doi:10.1007/s10706-020-01305-6
Xu, Z., Li, T., Chen, G., Ma, C., Qiu, S., and Li, Z. (2018). The grain-based model numerical simulation of unconfined compressive strength experiment under thermal-mechanical coupling effect. KSCE J. Civ. Eng. 22, 2764–2775. doi:10.1007/s12205-017-1228-z
Yin, W., Feng, Z., and Zhao, Y. (2021). Effect of grain size on the mechanical behaviour of granite under high temperature and triaxial stresses. Rock Mech. Rock Eng. 54, 745–758. doi:10.1007/s00603-020-02303-z
You, M., and Zou, Y. (2000). Discussion on rock heterogeneity and strength size effect. Chin. J. Rock Mech. Eng. 19, 391–395.
Yu, L., Peng, H-W., Zhang, Y., and Li, G. (2021a). Mechanical test of granite with multiple water–thermal cycles. Geotherm. Energy 9, 2–20. doi:10.1186/s40517-021-00186-z
Yu, L., Peng, H., Li, G., Zhang, Y., Han, Z., and Zhu, H. (2021b). Experimental study on granite under high temperature-water cooling cycle. Rock Soil Mech. 42, 1025–1035. doi:10.16285/j.rsm.2020.1154
Yu, L., Zhang, T., Wu, D., Wu, B., Ma, L., and Wei, J. (2022). Numerical investigation of the effect of grain size-to-particle size ratio on the dynamic fracture toughness of granite by using PFC3D-GBM. Geomech. Geophys. Geo. Energy. Ge. Resour. 8, 72. doi:10.1007/s40948-022-00387-1
Zhang, T., Yu, L., Li, J., Ma, L., Su, H., Zhang, M., et al. (2022). Numerical investigation of the effects of the micro-parameters of the transgranular contact on the mechanical response of granite. Theor. Appl. Fract. Mech. 118, 103259. doi:10.1016/j.tafmec.2022.103259
Zhong, J., Wang, Z., Wang, L., Zhao, J., Ren, W., and Zhou, H. (2019). Characteristics of damage evolution of deep coal based on CT three-dimensional reconstruction. J. China Coal Soc. 44, 1428–1494. doi:10.13225/j.cnki.jccs.2019.6007
Keywords: coefficient of inhomogeneity, temperature field, damage coefficient, discrete element, crystal structure, crystal expansion coefficient
Citation: Du G, Chen S, Chen X and Jiang Z (2022) Temperature damage regularity of granite based on micro-inhomogeneity. Front. Earth Sci. 10:981754. doi: 10.3389/feart.2022.981754
Received: 29 June 2022; Accepted: 16 August 2022;
Published: 21 September 2022.
Edited by:
Faming Huang, Nanchang University, ChinaReviewed by:
Jianxing Liao, Guizhou University, ChinaSho Ogata, Osaka University, Japan
Namrata Bist, Pandit Deendayal Energy University, India
Ivar Stefansson, University of Bergen, Norway
Copyright © 2022 Du, Chen, Chen and Jiang. This is an open-access article distributed under the terms of the Creative Commons Attribution License (CC BY). The use, distribution or reproduction in other forums is permitted, provided the original author(s) and the copyright owner(s) are credited and that the original publication in this journal is cited, in accordance with accepted academic practice. No use, distribution or reproduction is permitted which does not comply with these terms.
*Correspondence: Shijiang Chen, Y2hlbnNoaWppYW5nXzIwMDNAMTYzLmNvbQ==