 Zhihao Jin
 Yuan Li1,2
94% of researchers rate our articles as excellent or good
Learn more about the work of our research integrity team to safeguard the quality of each article we publish.
Find out more
METHODS article
Front. Earth Sci., 14 September 2022
Sec. Geohazards and Georisks
Volume 10 - 2022 | https://doi.org/10.3389/feart.2022.981470
This article is part of the Research TopicRock Landslide Risk Assessment, Stability Analysis and Monitoring for The Development of Early Warning Systems and Reinforcement MeasuresView all 24 articles
The in situ stress measurement technique can be used in long-term monitoring of induced stress to obtain three-dimensional stress states in slope engineering. In the monitoring, the ambient temperature fluctuation, “zero” drift of the logging data, and stable power supply should be considered. A dual temperature compensation circuit and experimental calibration techniques are proposed to increase accuracy based on the principle of the CSIRO method and considering the effect of a long-term disturbance of temperature in slope engineering. In view of the characteristics of the stress field distribution of the slope rock, the strain gauge layout scheme for induced stress monitoring of slope rock is modified to achieve the acquisition of three parallel measurements at one measurement and a stress–strain relationship equation for multilayer elastic layers is derived. An in situ stress logging system with the function of transient logging and data-connection in power cut condition is introduced to achieve a continuous correlation of measurement data under power cut conditions. An online cloud platform is established for the slope engineering of Au Mountain Iron Mine in Maanshan City. The results show that the data deviation of logging system is ±14 με with 24 days’ power off, and errors with amount of 15% were corrected by the dual temperature compensation method. The remotely transmitted data reflect the effect of temperature changes and the evolution of strain (induced stress) in real time to satisfy the demand of long-term monitoring of slope engineering.
In recent years, as the demand for iron resources has increased and the consumption of shallow resources has grown, many iron mines are gradually entering the deep mining state (Li XB. et al., 2017; Xia et al., 2018; Cao et al., 2019; Du et al., 2020a; Liu et al., 2020). When mining open-pit iron, high and steep artificial slopes are frequently generated, of which rock slopes are the most prominent (Han, et al., 2022). The open-pit slope of Au Mountain Iron Mine in Maanshan City, Anhui Province, for example, is as high as 392 m, with an average slope gradient of 50°. Many factors can influence slope stability, such as in situ stress, strong rainfall, and earthquakes (Song et al., 2018b; Du et al., 2020b). In the process of deep open-pit mining, high-stress hard rock is generally subjected to blasting operations, mechanical shock, and other dynamic disturbances, which cause changes in the stress field of the slope and degrades its stability (Guo, et al., 2017; Guo, et al., 2018; Guo, et al., 2019; Song, et al., 2021; Du and Song, 2022).
In situ stress is the fundamental force of rock damage and the measurement of in situ stress is a basic prerequisite for many engineering activities. Excavation activities disturb the original stress state of rock masses in a slope, and the mechanical behavior of rock masses is closely related to the induced stress. Therefore, the effect of both the original stress state and induced stress on the rock mechanics must be considered, and the disturbance caused by engineering activities is combined with the mechanical behavior of the rock mass.
In the design and construction of the excavation of rock masses, two types of in situ stress information are essential: the first is the absolute stress (i.e., the initial original stress state of rock), which is the natural stress existing in the stratum before the excavation of the rock (Hayashi et al., 1997; Xu et al., 2021; Li et al., 2022; Liu et al., 2022); the second is the induced stress of the rock, which is the change in the stress of the surrounding rock during and after excavation (Huang et al., 2014; Lin and Zou, 2021; Chen, 2022; Yuan et al., 2022). At present, the measurement techniques for absolute stress are relatively mature, but there is still a lack of techniques for induced stress. With the development of rock engineering, the long-term monitoring of induced stress related to time-dependent nonlinearity has become an indispensable technique in the field of slope engineering (Xie, 2017).
Long-term monitoring techniques for the induced stress of rock could be developed based on in situ stress measurement techniques. The purpose is to obtain the magnitude and direction of induced stress, which will enable us to master the change in stress in the earth’s crust with time. Regarding the monitoring of induced stress after excavation, Wang et al. (2013) used a nonelectrical KS-type borehole stress gauge to monitor the induced stress of coal body caused by mining and obtained the characteristics of the distribution of induced stress. Zhang et al. (2016) constructed a coupled three-dimensional (3D) poroelastic finite element numerical model to examine the change in stress after a powerful M5.1 earthquake in Badong County, in China’s Hubei Province. Several studies have used monitoring techniques and equipment of induced stress to obtain the stress changes before and after an earthquake (Liao et al., 2003; Cai et al., 2009; Peng et al., 2009). Clark (1982) found that, for at least the duration of several weeks or months prior to an earthquake, signs of activity on deep inception faults can be transmitted into the rock mass at depths greater than 20 m from the surface, thereby causing changes in stress. This suggests that it is possible to record the crustal activity using stress monitoring techniques. However, none of these studies have considered the effect of temperature change in long-term stress monitoring.
Among in situ stress measurement techniques, hydraulic fracturing and CSIRO methods are widely used quantitative methods (Ulusay, 2014; Cai, 1993; Haimson and Fa Irhurst, 1967; Zoback and Harjes, 1997; Wu et al., 2009) that are also recommended by the International Society of Rock Mechanics for measuring the in situ stress (Ulusay, 2014). The hydraulic fracturing method requires continuous injection of high-pressure water and splitting of the rock to determine the direction of stress. Consequently, its use in the real-time monitoring of rock stress can be difficult. The CISRO method can achieve the full 3D stress tensor and direction in a single measurement, which can be used for the long-term monitoring of induced stress of rock. However, due to the use of a resistor and Wheatstone bridge circuit, the drift of temperature mean that this measurement technique is unable to satisfy the requirements for the long-term monitoring of induced stress (Li et al., 2006; Li Y. et al., 2017).
The aim of this paper is to propose a new method for the long-term stress monitoring of slope engineering according to the CSIRO measurement techniques. An optimized layout scheme of strain gauges and the corresponding stress–strain calculation equation was proposed for slope monitoring. The calibration experiment of the temperature compensation method was improved to reduce the effect of temperature change. This paper introduces a new power system that was designed to ensure a stable supply using the temperature compensation method, an in situ data-logging system, and a transmission module. This technique was applied in slope engineering and an online monitoring system for induced stress was established. The application of the dual temperature compensation technique, modification of HI cell structure, and remote transmission platform improved the stability and reliability of the long-term monitoring of induced stress in slope engineering.
Logging systems are very sensitive to temperature; thus, spurious additional strains can be generated by changes in temperature. Compensation or correction measures are essential to reduce the additional strain induced by temperature. However, the conventional compensation resistance is not bonded to the HI cell, which causes it to be unaffected by the deformation of the HI cell. Moreover, the strain gauges that are used for temperature compensation are not arranged at the same location as the strain gauges of a HI cell but are placed at the end of the HI cell or in the external logging system, which cannot feel the real temperature conditions near the strain gauges. Therefore, Cai (1991) of the University of Science and Technology Beijing (USTB) proposed a complete temperature compensation method (Cai, 1993) by replacing the conventional compensation resistance by temperature measurement elements (thermosensors), placing them in the same position as the strain gauges in the HI cell, and cementing them together in the core. The temperature of the thermosensor fully reflects the temperature near the strain gauge in the HI cell. The additional strain caused by temperature changes during in situ stress monitoring is deducted according to the precalibrated temperature strain rate of the strain gauges in the HI cell.
During field monitoring, a HI cell is placed inside the hole and the logging system is placed in the external environment, especially in slope engineering, where the ambient temperature varies greatly. Therefore, the logging system is also affected by temperature variation. Therefore, based on the idea of complete temperature compensation, considering that the HI cell and the logging system are simultaneously affected by the temperature fluctuations in slope engineering, the dual temperature compensation method is proposed to compensate for the temperature effect of the strain gauge in a HI cell and the logging system at the same time; that is, the temperature compensation of the logging system is added on the basis of temperature compensation of the strain gauge in HI cell, which is known as the dual temperature compensation technique. In addition, according to the power supply and data-logging conditions on the site, a new CSIRO method with the function of transient logging and data-connection in power cut condition has been developed. The original circuit of the logging system was improved to ensure the consistency and stability of the thermal output−temperature correspondence of the temperature measurement channel. The improved circuit board of logging system is shown in Figure 1.

FIGURE 1. Circuit board of the logging system of the CSIRO method with dual temperature compensation.
In the dual temperature compensation method, two sensors are used simultaneously: the first is arranged in the HI cell (thermosensor: for temperature measurement of the strain gauge) and the second is located in the circuit of the logging system (resistor: for temperature compensation of the circuit). The thermosensor is highly sensitive to temperature changes and its temperature sensitivity is much higher than that of a conventional resistor. The thermosensor is placed near the strain gauge in the HI cell to detect the temperature change of HI cell in the measurement hole to achieve real-time temperature monitoring. The size of the thermosensor is 2.3 mm × 2.1 mm × 0.9 mm (L × W × H), and it has a wide working temperature range (−50–300°C) and high accuracy (temperature coefficient: TCR-3850 ppm/K). A 2 ppm low temperature coefficient resistor was used in the circuit of logging system as a strain display when the temperature changes; that is, it displays the strain changes caused by temperature changes in the circuit of logging system and eliminates them in the calculation.
In the stress monitoring of a slope rock mass, the stress in the direction perpendicular to the excavation face was released in a certain range. Therefore, the consideration of principal stress in the other two directions can be reserved. The strain gauge layout scheme of the conventional HI cell in the in situ stress measurement was modified. The layout scheme for hole wall strain monitoring on the slope was designed as three groups of circumferential measurement (each group contains three strain gauges along the hoop direction, a total of nine strain gauges) and one group of axial measurement (three strain gauges along the ring direction), as shown in Figure 2. Three groups of strain gauges were used in the circumferential strain measurement, which can be averaged to reduce the error.
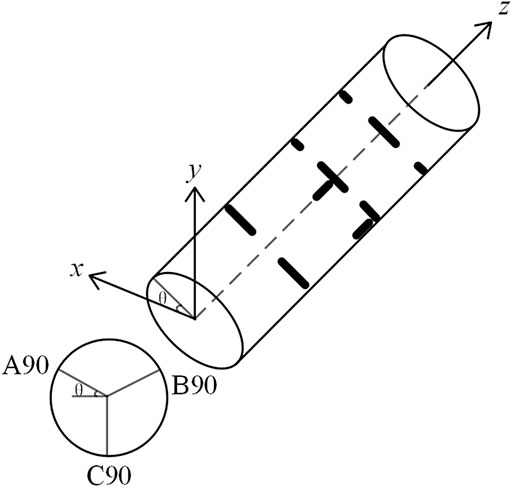
FIGURE 2. Layout scheme of strain gauges for stress monitoring in a slope rock mass.
According to the theory of in situ stress measurement, the relationship between stress and strain in each direction can be expressed as follows (Kim and Franklin, 1987; Cai, 1993):
where
The strains along the circumferential hole at 0°, 120°, and 240° were obtained by averaging the strain on the three measurement rings, as shown in Figure 2. According to Eq. 1, the circumferential stress–strain equation can be obtained as follows:
There are three axial strain gauges along the hole at 0°, 120°, and 240°. According to Eq. 2, the axial stress–strain equation can be expressed as follows:
The axial stress and the sum of circumferential stresses can be obtained from Eqs 3, 4.
Stress calculation by field measured strains requires the determination of elastic parameters (modulus: E; Poisson’s ratio: v) of the rock. The best way to obtain the E and v of the rock at the measurement site is to perform a biaxial pressure test on the core containing the HI cell (Amadei and Stephansson, 1997). In the measurement of absolute stress, biaxial pressure was applied to the core containing the HI cell retrieved from the site, and then E and v of the rock were derived from the measured stress–strain relationship of the core caused by the confining pressure. The elastic parameters of the core taken from the original measurement site can avoid the effect of geological conditions on the measurement results. This method can also be considered if the cores exhibit significant nonlinearity deformation.
A biaxial pressure test was conducted and a biaxial chamber that was developed by our research team was applied as the test apparatus. The maximum confining pressure that can be applied is 120 MPa and the maximum diameter of the core is 110 mm. The core is in the plane stress state. The relationship between the strain and the confining pressure can be deduced by elastic mechanics analysis as follows (Leeman, 1968):
where
Considering the effect of behavior and thickness of glue, Cai. (1993) proposed a modification of Eq. 5, as follows:
In this study, the core was installed in the biaxial chamber cylindrical hole. Then, confining pressure was gradually applied, and data were recorded using the logging system. A loading−unloading path was applied, and the maximum pressure was 120 MPa.
During long-term monitoring, a key problem is to maintain the stability of the power supply. The function of transient logging and data-connection in power cut condition was developed for the logging system, which would ensure the data recoverability if the power is cut off for a certain time. A stability test of the function was conducted. A resistor was connected to the test channel and the test was carried out under constant-temperature conditions; that is, the power was cut for a certain period of time, and the logging was started again. By comparing the data at different times for the same channel with the same temperature, the drift of data before and after can be calculated, and then the stability of the function of logging system can be verified.
In the test, a constant-temperature chamber was used to carry out tests at different temperatures (35°C, 40°C, and 45°C, temperature error +0.5°C). The maximum time of power cut during the test is 24 days. The data collected at different times were compared and the drift was calculated under power cut conditions (see Table 1). The test results show that the maximum drift is 14 με under the same temperature in the longest 24-days power cut test and the range of strain in the stress measurement in slope is generally 2000 με. This error is negligible in engineering applications, which verifies the stability of the function.
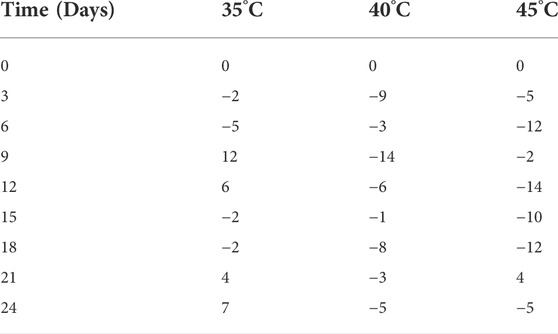
TABLE 1. Strain drift under power cut conditions (με).
The data-logging system is applied during the in situ stress measurement or long-term monitoring of induced stress, especially in the monitoring of induced stress in a slope where the measurement points are buried at a shallow depth and the ambient temperature varies greatly, which can directly affect the accuracy of the logging system and cause measurement (monitoring) errors. In the dual temperature compensation technique, temperature compensation is required for both HI cell and logging system. Therefore, the strain gauges, thermosensor, and logging system need to be calibrated in the laboratory separately.
The strain gauges are embedded in hollow inclusion cylinders, which are also sensitive to temperature changes; therefore, the effect of temperature on the measurement results cannot be ignored. Effective temperature compensation is required to reduce this part of the effect. The relationship between the strain and temperature (temperature strain rate) of the strain gauges is calibrated based on a temperature calibration test of the strain gauges. According to the temperature changes in the strain gauge during the stress monitoring, the additional strain caused by environmental temperature in each strain gauge can be calculated and deducted from the total strain measured during the stress monitoring to obtain the true strain of each strain gauge, thus achieving accurate measurement results.
Two thermostats are used in the calibration: the first is used to provide a constant temperature for the logging system and the second is used to provide a variable temperature for the HI cell with a strain gauge (high- and low-temperature thermostats). To ensure that the temperature near the strain gauge is the same as the thermosensor, the thermosensor is placed near the strain gauge to ensure the same temperature condition (see Figure 3). The calibration test is carried out by placing the logging system into the thermostat and maintaining the temperature at 30°C. The HI cell with strain gauge was then placed in the high- and low-temperature thermostat, and different temperatures were set for the HI cell (i.e., 5°C, 10°C, 15°C, 20°C, 25°C, 30°C, 35°C, and 40°C). The duration of each temperature gradient was 8 h. The experimental results are shown in Figure 4.
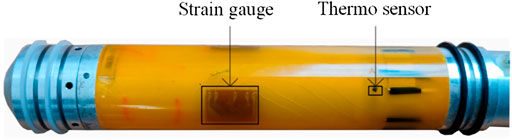
FIGURE 3. Arrangement of a thermosensor in a HI cell.
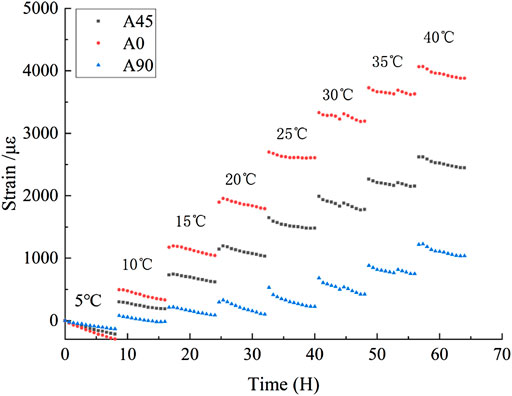
FIGURE 4. Relationship between temperature and strain of a strain gauge in a HI cell.
The strains of the strain gauge in HI cell at each temperature were averaged, and a trend regression analysis was performed on the temperature calibration data to obtain the relationship between the temperature and strain of the strain gauge (as shown in Figure 5). In the range of 5–40°C, the temperature and strain are linearly correlated. Therefore, the calibration equation can be obtained as follows:
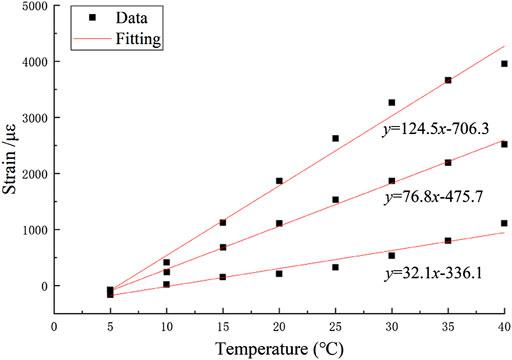
FIGURE 5. Fitting of temperature vs. strain of a strain gauge in a HI cell.
To obtain the actual temperature near the strain gauges, the relationship between the temperature and thermal output of the thermosensor was established by conducting a temperature calibration test on the thermosensor. The temperature near the strain gauge was calculated from the thermal output of thermosensor and used in the temperature compensation of the strain gauge.
The calibration test was carried out by placing the logging system into a thermostat and maintaining the temperature at 30°C. Then, the HI cell with thermosensor was placed in a high- and low-temperature thermostat, and different temperatures (i.e., 10°C, 20°C, 30°C, and 40°C) were set. The duration of each temperature gradient was 3 h. The experimental results are shown in Figure 6.
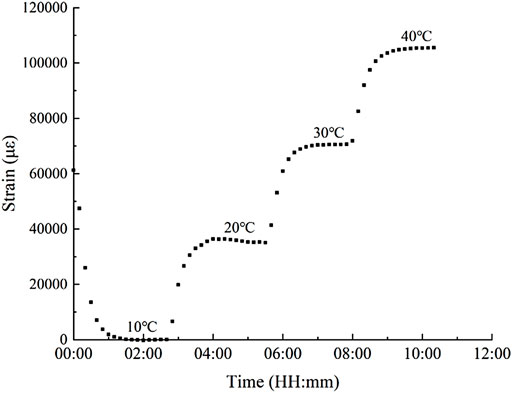
FIGURE 6. Relationship between the temperature and thermal output of a thermosensor.
The thermal output of thermosensor at each temperature was averaged, and a trend regression analysis was performed on the temperature calibration data to obtain the relationship between the temperature and thermal output of the thermosensor (as shown in Figure 7). The temperature is linearly correlated with thermal output in the range of 10–40°C. Therefore, the calibration equation can be obtained as
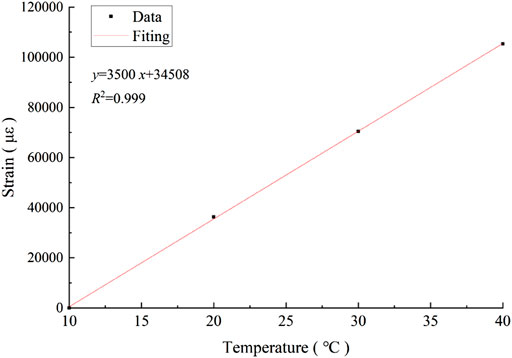
FIGURE 7. Fitting of temperature vs. thermal output of a thermosensor.
To calibrate the effect of temperature on the logging system, a logging system temperature calibration test was carried out to eliminate the logging error caused by the temperature changes in the logging system. In the temperature calibration test of the logging system, a 2 ppm/°C low temperature coefficient resistor obtained from Vishay, Israel was connected to the temperature compensation channel of the logging system. The logging system and resistor were placed in a high- and low-temperature thermostat, and different temperatures (i.e., 20°C, 30°C, 40°C, and 50°C) were set. The duration of each temperature gradient was 3 h. The relationship between the temperature of logging system and the strain of the resistor is shown in Figure 8. The strain variation curve reflects the error caused by the logging system due to the temperature variation.
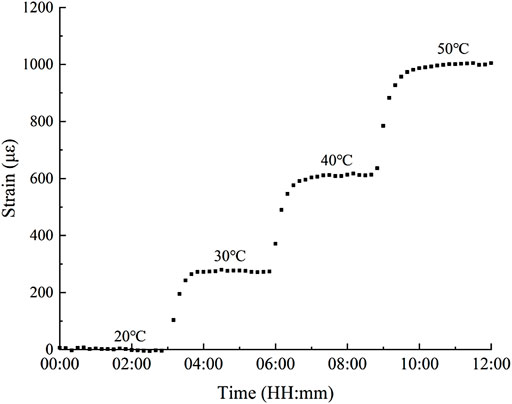
FIGURE 8. Relationship between the temperature of the logging system and the strain of resistor.
The strains at each temperature were averaged, and a trend regression analysis was performed on the temperature calibration data to obtain the relationship between the temperature of the logging system and strain of resistor (as shown in Figure 9). In the range of 20–50°C, the temperature of the logging system is linearly correlated with the strain of the resistor. Therefore, the calibration equation can be obtained as follows:
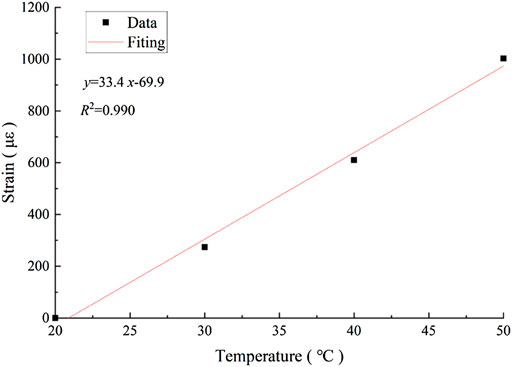
FIGURE 9. Fitting of the temperature of the logging system vs. the strain of the resistor.
The data acquired during on-site monitoring need to be constantly exported, processed, and analyzed for real-time feedback. Therefore, a stable power supply system and transmission system need to be built. An induced stress online monitoring system was developed to overcome the drawbacks of long-term on-site monitoring that requires the establishment of a machine room, provision of dedicated personnel for regular power supply replacement and data logging, operation of cumbersome equipment, and high maintenance costs. The architecture of this system is shown in Figure 10. The monitoring system utilizes solar power and the power grid for equipment power supply, HI cell and logging system for strain monitoring, a network transmission module combined with fiber optic network to transmit the data to the Internet, and a remote server for data logging and storage. The monitoring cloud platform not only has the characteristics of low equipment cost of cloud platform architecture, fast system response, and high stability but it also frees the monitoring system from the limitation of transmission distance, achieves the advantage of unattended equipment in the field monitoring environment, interconnection of multiple measurement points of stress monitoring data, real-time uploading into the network to form a monitoring network, and conveniently performs a comprehensive analysis of the monitoring data through the cloud platform network. It achieves the purpose of long-term and stable monitoring of induced stress of rock masses.
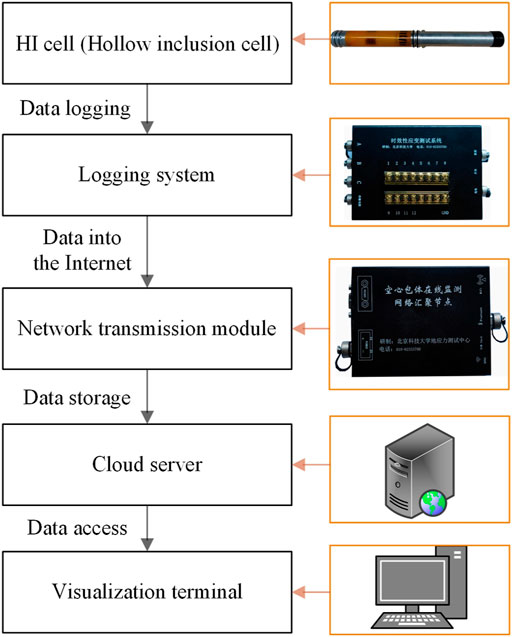
FIGURE 10. Architecture of a cloud platform monitoring system.
The system consists of the following main components:
1) Power supply system. This utilizes solar power and power grid together to provide stable power supply for the HI cell, logging system, and network transmission module.
2) HI cell. This is the core component in this system to monitor the change in a long-term induced stress of rock masses.
3) Logging system. This can record and save the monitoring data, and transfer the data to the network transmission module to access the network.
4) Network transmission module. The WIFI module (or 4G module) is an important transcoding component for transferring the data to the Internet and converting the 485 data format to TTL data format. The 4G module can be used for slope stress monitoring and the WIFI module can be used when there is a wireless network. The WIFI module can also be used for in situ stress monitoring in deep engineering with the downhole fiber optic network.
5) Cloud server. This is used for long-term storage, processing, and display of monitoring data.
6) Visualization terminal. The monitoring data in the cloud server are retrieved for online viewing by the end users.
Given that the slope rock mass is affected by temperature fluctuation, blasting excavation, rain and snow, the environment is more complex than underground engineering and the range of temperature change is obviously large (the daily temperature change in the site in spring is about 20°C). Therefore, in stress monitoring, the impact of significant temperature changes on the monitoring equipment needs to be considered, in addition to long-term stable power supply and data transmission. The double temperature compensation technique developed by this research team (which was introduced earlier) can be used for temperature compensation of the equipment to reduce the effect of temperature and achieve long-term stable monitoring under strong temperature fluctuation.
The monitoring system that is developed in this study was applied to the open-pit of Au Mountain of Maanshan Iron Mine in eastern Anhui Province, where the highest elevation of the exposed iron body is +175 m and extends down to −214 m. At present, the +45 m closed circle has formed a depression pit with an east-west length of 1,200 m, a north-south length of 980 m, and a vertical depth of 255 m. The average annual temperature is about 16°C, with an annual temperature variation range of −15 to 40°C.
A total of three boreholes were set up on the site, with two measurement points in each hole, located at 5 and 10 m depth, for a total of six measurement points. One and two holes were located at an elevation of −30 m, and three holes were located at −45 m, see Figure 11 for site layout.
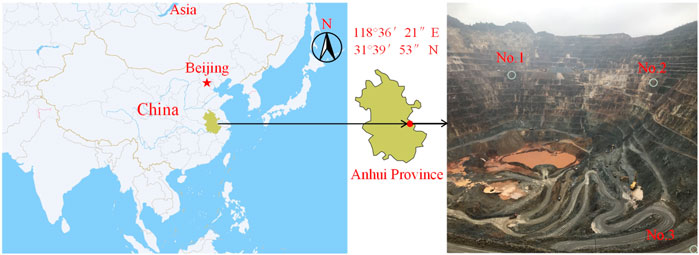
FIGURE 11. Layout of on-site measurement points.
Considering the problems of stable power supply, data transmission, and construction disturbance, a layout scheme of the remote monitoring system for slope rock induced stress was designed (as shown in Figure 12). HI cells are installed in the borehole, and the data-logging mode of the logging system is set for continuous logging with an interval of 30 min. The data can be transmitted to the monitoring cloud platform through the Network transmission module and downloaded at the visualization terminal.
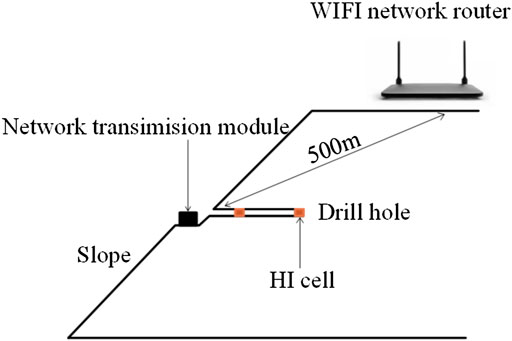
FIGURE 12. Layout scheme of a remote monitoring system.
According to the indoor temperature calibration results, the strain data were processed by the dual temperature compensation algorithm to reduce the effect of temperature, and the strain monitoring data of 5 m hole depth in No. 2 borehole were obtained (as shown in Figure 13). Both the circumferential strain and axial strain at the monitoring point showed a linear growth trend with time. This shows that the displacement of slope rock after excavation has a linear growth trend, and it still has not reached the stable state within 30 days.
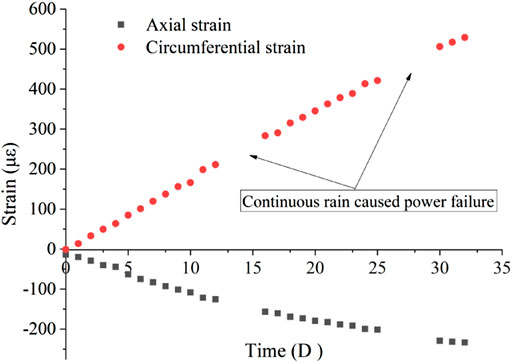
FIGURE 13. The 5 m hole depth strain monitoring data of measurement hole No. 1.
During the monitoring, there were two power cuts in the logging system due to rainy weather. However, the data showed continuity and did not show large fluctuations after the power was restored each time. This reflects the reliability of the logging system with the function of transient data-logging and data-connection in power cut condition; that is, the data can be collected after the power supply is restored and can be shut down when the power supply is insufficient. This fully reflects the superiority of the logging system in the long-term monitoring of induced stress in slope engineering.
The indoor calibration method for confining pressure described in Laboratory Calibration Section was used to calibrate the field retrieved cores with a HI cell in measuring the absolute stress. The variations in circumferential and axial stress were calculated using the stress–strain relationship Eqs 3, 4 as described in the Induced Stress Calculation Method Section (as shown in Figure 14).
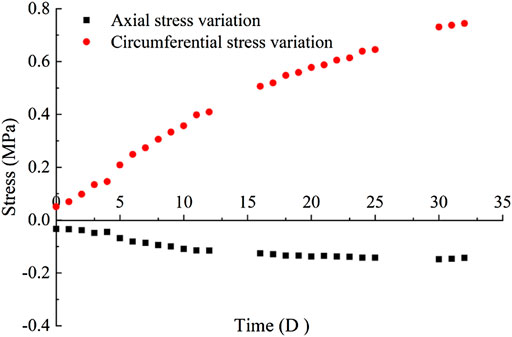
FIGURE 14. The 5 m hole depth stress variation in measurement hole No. 1.
The present study concentrates on the long-term monitoring of the in situ stress field around the excavation surface in slope engineering with a normal ambient temperature rather than underground cavern groups with higher temperatures. However, the high-temperature resistance of the HI cell in the presence of high-temperature conditions in underground engineering needs further study. The measurement of in situ stress using a HI cell requires the strain to be converted into stress, which requires the participation of elastic parameters. Nevertheless, in the slope construction, it is easy to create strong disturbances to the rock of excavation surface and thus affect the rock parameters (i.e., the rock parameters are variable). However, it is difficult to adjust the calculated parameters in real time by conducting only one calibration test of biaxial pressure when acquiring rock parameters, and therefore further research on parameter acquisition methods is needed.
Based on the in situ stress measurement techniques, a new method for long-term stress monitoring of slope engineering using HI cell was proposed by considering the characteristics of long-term stress monitoring environment of slope engineering, and improving the dual temperature compensation method and related testing techniques. The method was applied to long-term monitoring of Au Mountain Iron Mine in Maanshan City. The measurement results satisfy the engineering requirements and the remotely transmitted data reflect the effect of temperature changes:
1) The strain gauge in HI cell layout scheme was improved to achieve the logging of three parallel measurements at one measurement and the stress–strain relationship equation for multilayer elastic layers based on the HI method was derived, according to the stress characteristics in the direction perpendicular to the excavation face of the slope rock.
2) The indoor test results show that the in situ stress logging system with the function of transient logging and data-connection under power cut condition can maintain the data deviation of logging system at ±14 με with 24 days’ power off, which satisfies the requirements of field monitoring accuracy.
3) The dual temperature compensation technique could reduce the additional strain caused by the temperature changes of the HI cell and logging system. An amount of 15% temperature compensation was corrected in the long-term stress monitoring of the slope of Au Mountain Iron Mine according to indoor temperature calibration tests for strain gauges, thermosensor, and logging system.
4) An online monitoring system for induced stress in slope engineering was established. The remotely transmitted data reflect the effect of temperature change and the evolution of strain (induced stress) in real time to satisfy the demand of long-term monitoring of slope engineering. In the 1-month monitoring, the stress changes showed a linear growth trend with small changes and the stress changes were basically stable. After the temperature compensation of each measurement channel, the axial stress remained unchanged and the circumferential stress change was 0.73 MPa.
The original contributions presented in the study are included in the article/Supplementary material, and further inquiries can be directed to the corresponding author.
ZJ, YL, and QL mainly participated in the field work and perceived the idea of the article. ZL organized the database. SW performed the statistical analysis. ZW wrote the first draft of the manuscript. All authors contributed to manuscript revision and read and approved the submitted version.
This work is funded by the Foshan Science and Technology Innovation Special Fund Funding Project (Grant Nos. BK20BE008 and BK21BE014).
The authors declare that the research was conducted in the absence of any commercial or financial relationships that could be construed as a potential conflict of interest.
All claims expressed in this article are solely those of the authors and do not necessarily represent those of their affiliated organizations, or those of the publisher, the editors and the reviewers. Any product that may be evaluated in this article, or claim that may be made by its manufacturer, is not guaranteed or endorsed by the publisher.
Cai, M. F., Peng, H., Ma, X. M., and Jiang, J. (2009). Evolution of the in situ rock strain observed at shandan monitoring station during the M 8.0 earthquake in wenchuan, China. Int. J. Rock Mech. Min. Sci. 46 (5), 952–955. doi:10.1016/j.ijrmms.2008.12.004
Cai, M. F. (1993). Review of principles and methods for rock stress measurement. Chin. J. Rock Mech. Eng. 12 (3), 275–283.
Cai, M. F. (1991). Studies of temperature compensation techniques in rock stress measurements. Chin. J. Rock Mech. Eng. 10 (3), 227–235.
Cao, A. Y., Jing, G. C., Ding, Y. L., and Liu, S. (2019). Mining–induced static and dynamic loading rate effect on rock damage and acoustic emission characteristic under uniaxial compression. Saf. Sci. 116, 86–96. doi:10.1016/j.ssci.2019.03.003
Chen, X. Q. (2022). Influence of fault fracture zone on initial in-situ stress field in tongmai tunnel of the sichuan-tibet railway. Eart. Scie. 47, 2120. doi:10.3799/dqkx.2021.263
Clark, B. R. (1982). Monitoring changes of stress along active faults in southern California. J. Geophys. Res. 86 (B6), 4645–4656. doi:10.1029/JB087iB06p04645
Du, H., Song, D., Chen, Z., and Guo, Z. (2020a). Experimental study of the influence of structural planes on the mechanical properties of sandstone specimens under cyclic dynamic disturbance. Energy Sci. Eng. 8, 4043–4063. doi:10.1002/ese3.794
Du, H., Song, D., Chen, Z., Shu, H., and Guo, Z. (2020b). Prediction model oriented for landslide displacement with step-like curve by applying ensemble empirical mode decomposition and the PSO-elm method. J. Clean. Prod. 270, 122248. doi:10.1016/j.jclepro.2020.122248
Du, H., and Song, D. (2022). Investigation of failure prediction of open-pit coal mine landslides containing complex geological structures using the inverse velocity method. Nat. Hazards (Dordr). 111 (3), 2819–2854. doi:10.1007/s11069-021-05159-w
Guo, Z. Z., Chen, L. X., Gui, L., Du, J., Yin, K., and Do, H. M. (2019). Landslide displacement prediction based on variational mode decomposition and WA-GWO-BP model. Landslides 17 (2), 567–583. doi:10.1007/s10346-019-01314-4
Guo, Z. Z., Yin, K. L., and Huang, F. M. (2018). Landslide displacement prediction based on surface monitoring data and nonlinear time series combination model. Chin. J. Rock Mech. Eng. 37, 1534. doi:10.13722/j.cnki.jrme.2016.1534
Guo, Z. Z., Yin, K. L., Yang, T., and Huang, F. (2017). Stability evaluation and prediction of maliulin landslide under reservoir water level decline and rainfall. Geol. Sci. Technol. Inf. doi:10.19509/j.cnki.dzkp.2017.0435
Haimson, B., and Fa Irhurst, C. (1967). Initiation and extension of hydraulic fractures in rocks. Soc. Petroleum Eng. 7 (3), 310–318. doi:10.2118/1710-PA
Han, Z., JianKang, C., Jian, K. Q., Liang, P., and Huibao, H. (2022). A fast prediction method for stability safety and reliability of reservoir bank rock slopes based on deformation monitoring data. Front. Earth Sci. 10, 944299. doi:10.3389/feart.2022.944299
Hayashi, K., Sato, A., and Ito, T. (1997). In-situ stress measurements by hydraulic fracturing for a rock mass with many planes of weakness. Int. J. Rock Mech. Min. Sci. 34 (1), 45–58. doi:10.1016/S1365-1609(97)80032-9
Huang, M. Q., Wu, A. X., Wang, Y. M., and Han, B. (2014). Geostress measurements near fault areas using borehole stress-relief method. Trans. Nonferrous Metals Soc. China 24 (11), 3660–3665. doi:10.1016/S1003-6326(14)63512-3
Kim, K., and Franklin, J. A. (1987). Suggested methods for rock stress determination. Int. J. Rock Mech. Min. Sci. Geomechanics Abstr. 24 (1), 55–63. doi:10.1016/0148-9062(87)91232-0
Leeman, E. R. (1968). The determination of the complete state of stress in rock in a single borehole—laboratory and underground measurements. Int. J. Rock Mech. Min. Sci. Geomechanics Abstr. 5 (1), 31–38. doi:10.1016/0148-9062(68)90021-1
Li, X. B., Chen, J. Z., Ma, C. D., Huang, L., Li, C., Zhang, J., et al. (2022). A novel in-situ stress measurement method incorporating non-oriented core ground Re-orientation and acoustic emission: A case study of a deep borehole. Int. J. Rock Mech. Min. Sci. 152, 105079. doi:10.1016/j.ijrmms.2022.105079
Li, X. B., Gong, F. Q., Tao, M., Dong, L., Du, K., Ma, C., et al. (2017a). Failure mechanism and coupled static–dynamic loading theory in deep hard rock mining: A review. J. Rock Mech. Geotechnical Eng. 9 (4), 767–782. doi:10.1016/j.jrmge.2017.04.004
Li, Y., Qiao, L., and Sun, X. S. (2006). Analyses of some factors affecting precision in in-situ stress measurement with method of CSIRO cells. Chin. J. Rock Mech. Eng. 25 (10), 2140–2144. doi:10.1016/S1872-1508(06)60035-1
Li, Y., Wang, Z., Qiao, L., Cai, M., and Li, Q. (2017b). Development of CSIRO cell with the compromised application of instantaneous data-logging, No-power data-connection and twin temperature compensation technique. Chin. J. Geotechnical Eng. 36 (06), 1479–1487. doi:10.13722/j.cnki.jrme.2016.1348
Liao, C. T., Zhang, C. S., Wu, M. L., Ma, Y., and Ou, M. (2003). Stress change near the kunlun fault before and after the M S 8.1 kunlun earthquake. Geophys. Res. Lett. 30 (20), 2003GL018106–2031. doi:10.1029/2003GL018106
Lin, C., and Zou, D. (2021). Formulation and verification of 3D in-situ stress estimation based on differential-direction drilling. Int. J. Rock Mech. Min. Sci. 145, 104833. doi:10.1016/j.ijrmms.2021.104833
Liu, G. W., Song, D. Q., Chen, Z., and Yang, J. w. (2020). Dynamic response characteristics and failure mechanism of coal slopes with weak intercalated layers under blasting loads. Adv. Civ. Eng. 1, 18. doi:10.1155/2020/5412795
Liu, X., Chen, J., Liu, B., Luo, Y., Zhu, Y., and Huang, X. (2022). Large deformation disaster mechanism and control technique for deep roadway in faulted zone. Front. Earth Sci. 10, 826661. doi:10.3389/feart.2022.826661
Peng, H., Ma, X. M., and Jiang, J. J. (2009). Process analysis of in-situ strain during the M S 8.0 wenchuan earthquake-data from the stress monitoring station at shandan. Acta Geol. Sin. 83 (4), 754–766. doi:10.1111/j.1755-6724.2009.00099.x
Song, D., Che, A., Zhu, R., and Ge, X. (2018b). Seismic stability of a rock slope with discontinuities under rapid water drawdown and earthquakes in large-scale shaking table tests. Eng. Geol. 245, 153–168. doi:10.1016/j.enggeo.2018.08.011
Song, D., Liu, X., Chen, J., and Cai, J. (2021). Influence of tunnel excavation on the stability of a bedded rock slope: A case study on the mountainous area in southern Anhui, China. KSCE J. Civ. Eng. 25, 114–123. doi:10.1007/s12205-020-0831-6
Ulusay, R. (2014). The ISRM suggested methods for rock characterization, testing and monitoring: 2007-2014. Springer Int. Publ. 15 (1), 47–48. doi:10.1007/978-3-319-07713-0
Wang, N. B., Zhang, N., Cui, F., Cao, J. T., and Lai, X. P. (2013). Characteristics of stope migration and roadway surrounding rock fracture for fully-mechanized top-coal caving face in steeply dipping and extra-thick coal seam. J. China Coal Soc. 38 (08), 1312–1318. doi:10.13225/j.cnki.jccs.2013.08.012
Wu, M. L., Zhang, Y., Liao, C., Chen, Q., Ma, Y., Wu, J., et al. (2009). Preliminary results of in-situ stress measurements along the longmenshan fault zone after the wenchuan ms 8.0 earthquake. Acta Geol. Sin. - Engl. Ed. 83, 746–753. doi:10.1111/j.1755-6724.2009.00098.x
Xia, K. Z., Chen, C. X., Deng, Y. Y., Xiao, G., Zheng, Y., Liu, X., et al. (2018). In situ monitoring and analysis of the mining-induced deep ground movement in a metal mine. Int. J. Rock Mech. Min. Sci. (1997). 109, 32–51. doi:10.1016/j.ijrmms.2018.06.014
Xie, H. P. (2017). Research framework and anticipated results of deep rock mechanics and mining theory. Eng. Sci. Technol. 49 (02), 1–16. doi:10.15961/j.jsuese.201700025
Xu, D. P., Huang, X., Jiang, Q., Li, S., Zheng, H., Qiu, S., et al. (2021). Estimation of the three-dimensional in situ stress field around a large deep underground cavern group near a valley. J. Rock Mech. Geotechnical Eng. doi:10.1016/j.jrmge.2020.11.007
Yuan, D., Zhang, L., Liu, X., Feng, T., Zhang, G., Xu, Z., et al. (2022). Influence of the xianshuihe fault zone on in-situ stress field of a deep tunnel and its engineering effect. Front. Earth Sci. 10, 886876. doi:10.3389/feart.2022.886876
Zhang, H., Cheng, H., Pang, Y., Shi, Y., and Yuen, D. A. (2016). Influence of the impoundment of the three gorges reservoir on the micro-seismicity and the 2013 M5.1 Badong earthquake (yangtze, China). Phys. Earth Planet. Interiors 261, 98–106. doi:10.1016/j.pepi.2016.06.007
Keywords: in situ stress measurement, temperature compensation, long-term stress monitoring, induced stress, strain gauges
Citation: Jin Z, Li Y, Li Q, Liu Z, Wu S and Wang Z (2022) Modification of the CSIRO method in the long-term monitoring of slope-induced stress. Front. Earth Sci. 10:981470. doi: 10.3389/feart.2022.981470
Received: 29 June 2022; Accepted: 15 August 2022;
Published: 14 September 2022.
Edited by:
Bo Li, Tongji University, ChinaReviewed by:
Danqing Song, Tsinghua University, ChinaCopyright © 2022 Jin, Li, Li, Liu, Wu and Wang. This is an open-access article distributed under the terms of the Creative Commons Attribution License (CC BY). The use, distribution or reproduction in other forums is permitted, provided the original author(s) and the copyright owner(s) are credited and that the original publication in this journal is cited, in accordance with accepted academic practice. No use, distribution or reproduction is permitted which does not comply with these terms.
*Correspondence: Qingwen Li, cWluZ3dlbmxpQHVzdGIuZWR1LmNu
Disclaimer: All claims expressed in this article are solely those of the authors and do not necessarily represent those of their affiliated organizations, or those of the publisher, the editors and the reviewers. Any product that may be evaluated in this article or claim that may be made by its manufacturer is not guaranteed or endorsed by the publisher.
Research integrity at Frontiers
Learn more about the work of our research integrity team to safeguard the quality of each article we publish.