
94% of researchers rate our articles as excellent or good
Learn more about the work of our research integrity team to safeguard the quality of each article we publish.
Find out more
ORIGINAL RESEARCH article
Front. Earth Sci., 14 September 2022
Sec. Volcanology
Volume 10 - 2022 | https://doi.org/10.3389/feart.2022.979210
 Olivier Bernard1,2,3*
 Caroline Bouvet de Maisonneuve2,3
 Laurent Arbaret4,5
 Kazuhide Nagashima6
 Jeffrey Oalmann7
 Arief Prabowo8Antonius Ratdomopurbo8
Unlike their silicic counterparts, mafic eruptions are known for being on the low-end of the explosivity spectrum with eruption styles commonly ranging from effusive to Hawaiian fire fountaining. However, there are increasing discoveries of large mafic Plinian eruptions, sometimes generating ignimbrites, suggesting that this phenomenon might not be so uncommon. So, what processes lead a mafic magma to fragment violently enough to generate extensive ignimbrites?
We sampled pumices from ignimbrites and PDCs with a compositional range from basaltic-andesite (Curacautín ignimbrite, Volcàn Llaima, Chile), andesite (Marapi, Indonesia) to trachyte (Gunungkawi ignimbrite, Batur, Indonesia). We use SEM imagery and X-ray Microtomography on pyroclasts from these deposits to characterize phenocryst, microlite and vesicle textures. From vesicle number densities we estimate fragmentation decompression rates in the range of 0.4–1.6 MPa/s for the three deposits. With a combination of EPMA and SIMS analyses we characterise pre-eruptive storage conditions. Based on the bulk and groundmass compositions, the storage temperature (1,050–1,100°C), pressure (50–100 MPa) and phenocryst content (1.0–2.5 vol%), we conclude that the basaltic-andesitic Curacautín magma was at sub-liquidus conditions, which allowed fast and widespread disequilibrium matrix crystallization (0–80 vol%) during ascent to the surface. Combined with the important decompression rate, this intense crystallization led to a magma bulk viscosity jump from 103 up to >107 Pa s and allowed it to fragment brittlely. Conversely, for the Marapi PDC and Gunungkawi ignimbrite, similar decompression rates coupled with larger initial bulk viscosities of 105–106 Pa s were sufficient to fragment the magma brittlely. The fragmentation processes for these latter two deposits were slightly different however, with the Marapi PDC fragmentation being mostly driven by vesicle overpressure, while a combination of bubble overpressure and intense strain-rate were the cause of fragmentation for the Gunungkawi ignimbrite. We conclude that mafic ignimbrites can form due to a combination of peculiar storage conditions that lead to strongly non-linear feedback processes in the conduit, particularly intense microlite crystallization on very short timescales coupled with intense decompression rates. Conversely, the high viscosity determined by pre-eruptive storage conditions, including temperature and volatile-content, are key in controlling the formation of more evolved magmas PDCs'.
Pyroclastic Density Currents (PDCs) are the most hazardous direct consequence of explosive volcanism. They are estimated to be responsible for 28.1% of the casualties of volcanic eruptions documented between 1500 AD and 2017 (Brown et al., 2017) with the last disaster to date being the 3 June 2018 Volcàn Fuego (Guatemala) PDCs that killed between 332 and 2,900 people (Naismith et al., 2020). PDCs can be produced by a wide spectrum of processes from transient mechanisms such as gravitational collapse of a lava dome or of an eruptive column to long-lived sustained mechanisms such as pyroclastic fountaining (Branney and Kokelaar, 2002; Sulpizio et al., 2014; Lube et al., 2020). As such, volumes of PDCs can vary greatly from the commonly produced dome collapses usually << 1 km3 to the large ignimbrite sheets that can be >1,000 km3 (Smith, 1979; Druitt, 1998; Giordano and Cas, 2021). Despite being mostly associated with andesitic to rhyolitic magmas, recent studies have shown that silica-poor magmas can also be prone to producing PDCs of all extents and volumes (Robin et al., 1994, 1995; Miyabuchi et al., 2006; Silva Parejas et al., 2010; Costantini et al., 2011; Vinkler et al., 2012; Calvari et al., 2020; Valdivia et al., 2021). As a consequence, while the conditions causing the emplacement of PDCs from magmas with high silica contents and high viscosities are now mostly understood, the formation of voluminous PDCs from low-viscosity magmas has yet to be fully addressed.
Magma behaviour at fragmentation is controlled by magma viscosity (Dingwell, 1996; Gardner et al., 1996), volatile content (Papale et al., 1998; Papale and Polacci, 1999; Edmonds and Wallace, 2017), ascent rates and storage conditions (Gonnermann, 2015; Cassidy et al., 2018; Bernard et al., 2022). For sustained brittle fragmentation to occur during an explosive eruption, the melt+crystal phases must be coupled with the volatile phase during the full duration of the eruption (Carey et al., 2009; Degruyter et al., 2012). The lower the melt viscosity the harder it is to achieve this process (Gonnermann and Manga, 2007; Gonnermann, 2015), which is why it is highly unexpected to have voluminous ignimbrites of mafic magmatic composition. However, a recent study has pointed out that high ascent rates, coupled with intense melt crystallization in a matter of seconds to minutes due to volatile exsolution, can create a rheological change of the magma and a step-wise increase in viscosity that will promote fragmentation and could generate mafic Plinian eruptions (Arzilli et al., 2019).
In this study we compare the physical processes responsible for the emplacement of ignimbrites and PDCs produced by pyroclast fountaining (Druitt, 1998; Branney and Kokelaar, 2002). For the mafic end-member, we use samples from the basaltic-andesitic Curacautín ignimbrite (CCI) generated by Volcán Llaima (Chile), that consists solely of PDCs with no associated Plinian phase and thus provides an opportunity to test whether the fragmentation mechanisms proposed by Arzilli et al. (2019) for mafic Plinian eruptions also applies to mafic ignimbrites. For our intermediate and silicic end-members we collected samples from two other PDC/ignimbrite deposits at Marapi (Sumatra, Indonesia) and Batur (Bali, Indonesia) that are respectively andesitic and trachytic in composition. These three deposits were selected because they look extremely similar from field observations, and they provide us with an interesting case study to compare PDC generation processes across a range of compositions. In addition, the extensive knowledge on intermediate to silicic PDCs provide us a benchmark to build parallels with mafic PDCs. In that context, we combine petrological, textural and geochemical methods to constrain their pre-eruptive storage conditions (pressure, temperature, volatile content, crystal content, melt viscosity) and syn-eruptive ascent dynamics (vesicle number densities, melt viscosity changes, and magma decompression rates) to unravel the processes leading to their formation.
The three deposits of interest were produced by arc volcanoes and were all emplaced by pyroclast fountaining (Druitt, 1998; Trolese et al., 2019). Volcán Llaima is a stratovolcano located in the Southern Volcanic Zone of the Andes (Figures 1A–C; 38.69°S, 71.73°W) and is one of Chile’s most active volcanoes with 50 eruptions recorded in the last four centuries (Naranjo and Moreno, 1991, 2005; Bouvet de Maisonneuve et al., 2013; Schonwalder-Angel et al., 2018). Magma compositions are dominantly basaltic-andesitic for the most recent deposits (Figure 2A) as well as for the 3.5–4.5 km3 (Dense rock equivalent - DRE) Curacautín ignimbrite (CCI- Marshall et al., 2022). We sampled the CCI in the main outcropping section of the Truful river on the south-eastern flank of the volcano (Figure 1A; 38.78°S, 71.63°W). The 20 m thick section of the deposit is massive and unsorted presenting no easily distinguishable unit (Figure 1B). The base of the CCI is buried and not visible anywhere. It contains cauliflower bombs and lithics in abundance that are embedded in a non-welded but often indurated matrix of coarse ash to lapilli-sized scoriae (Figure 1C). We collected about 10 cauliflower bombs 10–20 cm in diameter across the section for this study. Samples are homogeneous, highly vesicular and contain few plagioclase, olivine and clinopyroxene as phenocrysts as well as rare Fe-Ti oxides. A large quantity of lithics/enclaves have a granitic origin, which means that these lithics were entrained from the basement (granitic outcrops visible on the E side of the volcano) around the old Llaima edifice either due to fragmentation or during the caldera collapse. These are poorly attached to the juvenile part of the sample.
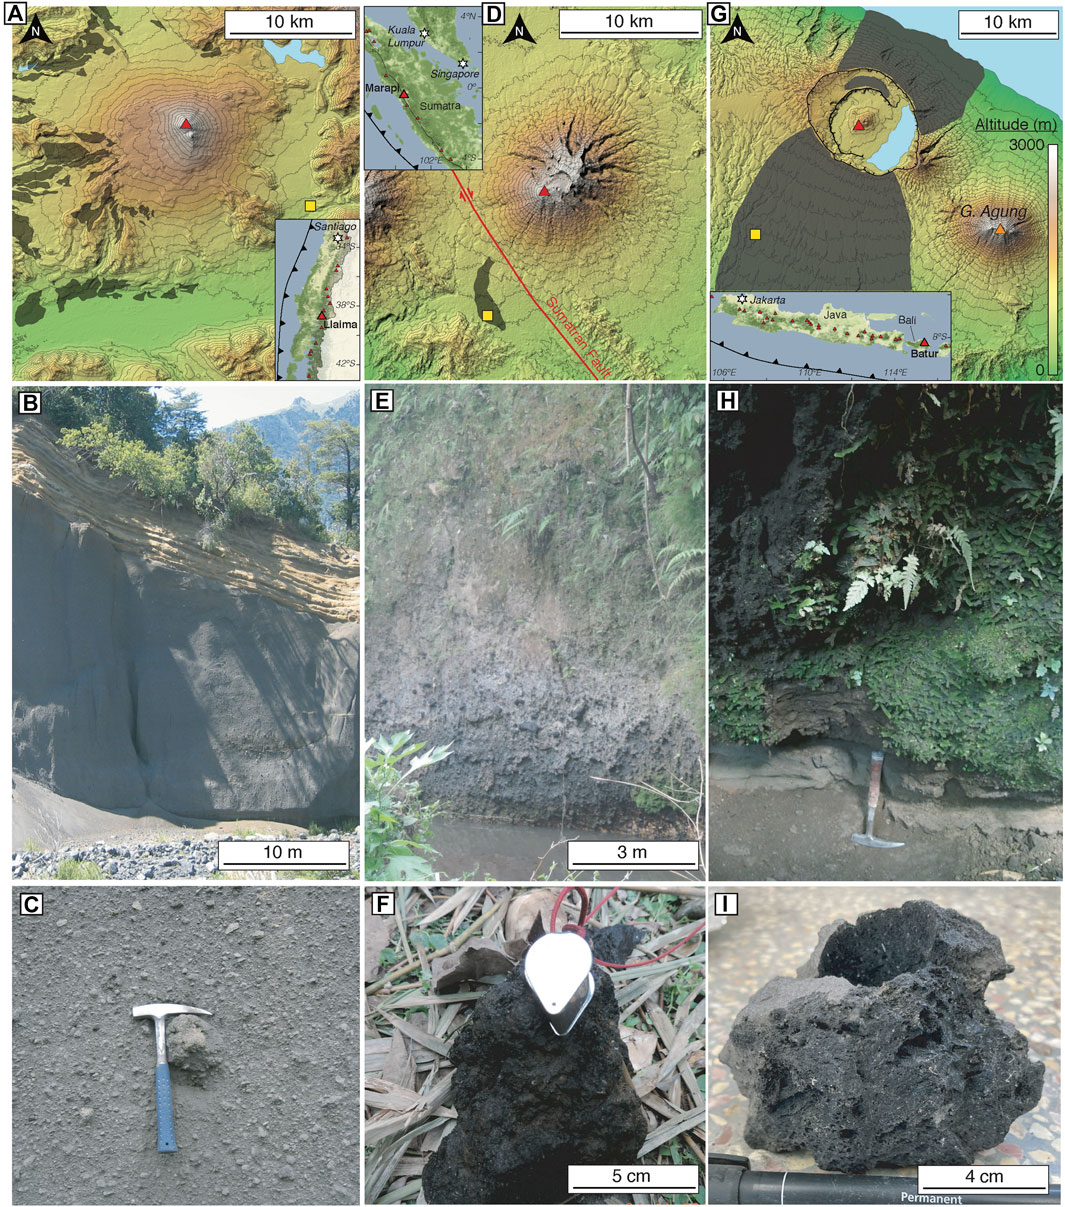
FIGURE 1. Location and maps of the studied volcanoes and deposits. Top row (A–C): SRTM maps of the three volcanoes of interest with, from left to right, Vólcan de Llaima (Chile), Gunung Marapi and Gunung Batur (Indonesia). The insets indicate the location of the volcano in their respective arc. The red triangles indicate the vent active in their last recorded eruption and the yellow square indicate the location where samples were collected. Black shaded areas in Llaima and Marapi’s map indicate the mapped deposit based on existing geological maps (Naranjo and Moreno, 2005; CVGHM). The black shaded area in Batur’s case roughly represents the extent of the Gunungkawi ignimbrite based on Reubi and Nicholls, (2005) but is not well constrained. Middle row (D–F) general view of the outcrops from which samples were extracted, scale is given by the vegetation and the hammer. Bottom row (G–I): close-up views of the different samples.
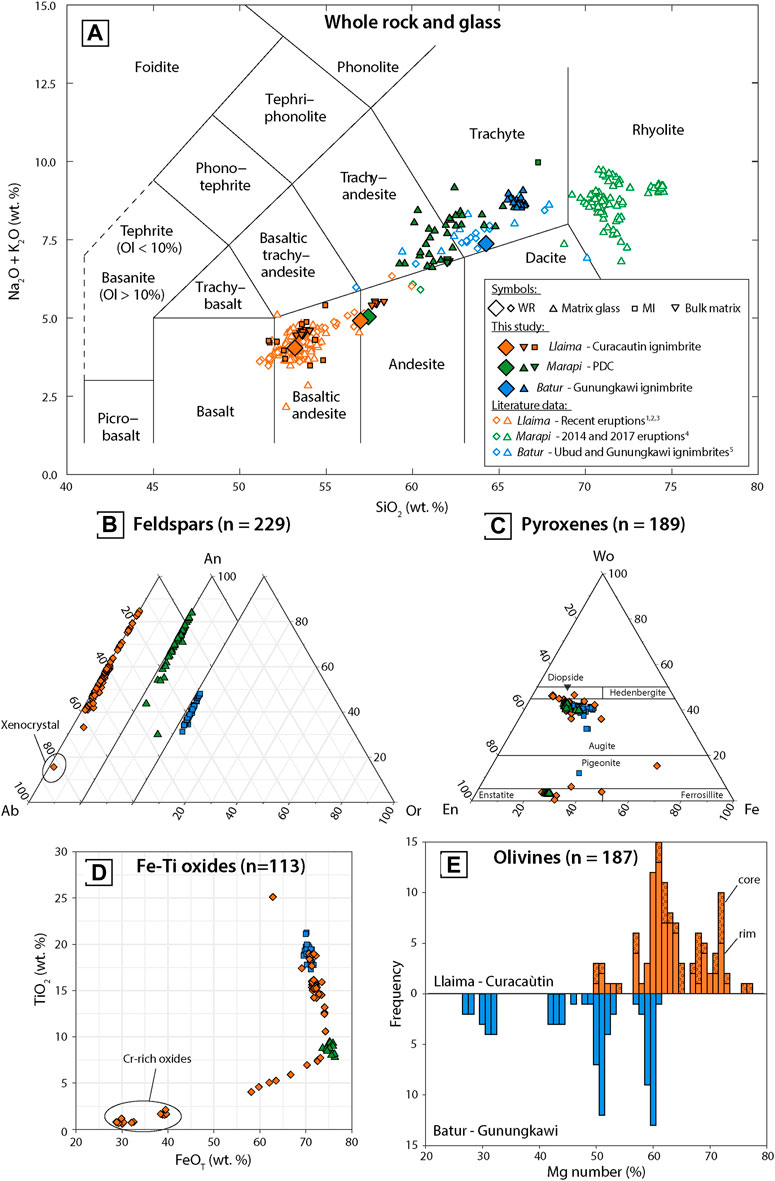
FIGURE 2. Sample petrology and chemistry. For all the plots, orange symbols are the Curacautín ignimbrite, green symbols are Marapi’s PDC and blue symbols are the Gunungkawi ignimbrite. (A) Total alkaline vs. SIO2 (TAS) diagram. All samples plot on a classical arc calc-alkaline series. Large diamonds are whole rock compositions of studied samples, upward triangles are glass analyses and downwards triangles are bulk matrix composition made with EDS. Symbols in shades of grey are bulk rock and matrix glass data from the literature: dark grey are analyses from Llaima’s recent eruptions (Bouvet de Maisonneuve et al., 2012; Ruth et al., 2016; Schonwalder-Angel et al., 2018), intermediate grey from Marapi’s recent eruptions (Nurfiani et al., 2021) and light-grey from Batur’s Ubud and Gunungkawi ignimbrites (5Reubi and Nicholls, 2004a); (B) Ternary Albite-Anorthite-Orthose plot for feldspars; (C) Ternary Enstatite-Wollastonite-Ferrosilite diagram to for pyroxenes; (D) TiO2 vs. total FeO plot for Fe-Ti oxides. Cr-rich oxides located in inclusion in the Curacautín ignimbrite’s olivines have been circled on the plot. (E) Histogram of Mg-numbers (Mg #) for Olivine. There are no olivines in Marapi’s PDC samples. Olivine in the Curacautín ignimbrite are normally zoned so core and rims were distinguished, while it was not the case in Gunungkawi’s ignimbrite’s olivines.
Gunung Marapi is a stratovolcano lying approximately 40 km north of Padang city in the West Sumatra regency, Indonesia (Figures 1D–F; 0.39°S, 100.45°E). It is one of the most active volcanoes in Sumatra with some eruptions reported in 2014, 2017 and 2018 (Nurfiani et al., 2021). Most of the eruptive history of this volcano remains a mystery, however at least four voluminous PDCs were identified and mapped around the volcano. We sampled the most recent one (<4.2 kyr old based on stratigraphic relationships; Figure 1D), which is >10 m thick about 10 km from the current active summit vent of the volcano (Figure 1E; 0.44°S, 100.47°E). It is an unsorted black deposit containing lapilli to bomb sized scoria embedded in a dark-grey unconsolidated, poorly-sorted and scoriaceousmatrix (Figure 1E). We collected three cauliflower bombs 7–10 cm in diameter, texturally representative of the larger fraction of the deposit (Figure 1F). Whole rock compositions are basaltic-andesitic to andesitic and samples contain abundant plagioclase, Fe-Ti oxide, clino- and orthopyroxene as phenocrysts. They are texturally homogeneous and highly vesicular.
Gunung Batur is a stratovolcano located in the North-East of Bali in Indonesia (Figure 1G; 8.24°S, 115.37°E). It is one of the most active volcanoes in Indonesia (24 confirmed eruptions since 1804; Global Volcanism Program) and has historically emitted basaltic to basaltic-andesitic magmas that produced effusive to moderately explosive eruptions (Reubi and Nicholls, 2004a). However, Batur also experienced at least two large caldera-forming eruptions 29,300- and 20,150-years BP, which deposited the trachytic 62 km3 DRE Ubud and 9 km3 DRE Gunungkawi ignimbrites respectively (volumes estimated from the collapsed caldera volume; Marinelli and Tazieff, 1968; Sutawidjaja, 1990; Reubi and Nicholls, 2004a, 2004b, 2005). We sampled the uppermost sequence of the Gunungkawi ignimbrite (GKI), in a location 10 km south-west of the second caldera-rim (8.32°S, 115.28°E). It is a black, massive unsorted and non-welded deposit containing large pumiceous bombs up to 20 cm in diameter that are breadcrusted (Figures 1H,I). The deposit is at least 10 m thick in the location of sampling with the top of the sequence being invisible. The lower part of the GKI, that is not visible at this location and was not sampled, is welded and has a slightly different composition and aspect (Reubi and Nicholls, 2005). We collected 10, 8–15 cm in diameter pumice bombs that were representative of the textural variability of the bombs in the deposit (Figure 1I). Samples contain plagioclase, clinopyroxene, Fe-rich olivine and Fe-Ti oxide as phenocrysts as well as apatite as an accessory mineral. We find also lithics of basaltic lavas probably coming from the old Batur edifice that have likely been entrained during the collapse of the caldera.
We combined textural analyses of the crystals and vesicles with geochemical analyses of the mineral phases to reconstruct pre- and syn-eruptive conditions and mechanisms of PDC emplacement.
Crystal fractions and textures were analysed using backscattered electron (BSE) maps and images of the matrix taken with a JEOL JSM-7800F Field Emission Scanning Electron Microscope (SEM) at the Asian School of the Environment (Nanyang Technological University - NTU). Thin section wide BSE maps were used to estimate vesicle-free phenocryst (crystals >300 µm in length) contents by image thresholding using ImageJ and JMicrovision v1.3.1 (Roduit, 2007). Microphenocrysts and microlite (crystals <300 µm in length) fractions in the matrix were calculated by color thresholding on images using JMicrovision. See more details in Supplementary Material.
Vesicle textures were analysed using a combination of multi-scale X-ray microcomputed tomography scans (μCT) and SEM BSE images. Cylinders of 15 and 5 mm in diameter were cored from samples and imaged using a Nanotom microtomograph manufactured by phoenix|x-ray at l’Institut des Sciences de la Terre d’Orléans (France). Two volumes of 400 pixels per side were processed for each cylinder (4 volumes per sample, 12 in total for the three deposits) using the software VGstudioMax v3.3.4 developed by Volume Graphics. Vesicle shape parameters, number densities per size bin, and size distributions for each volume were extracted and computed. For small vesicles, we analysed 4–20 BSE images taken at two to three different magnifications among×100, ×200 and x500 based on the size distribution of the vesicles in each sample. Images were cleaned and binarized following the method of Shea et al. (2010). We then used the Matlab-run freeware FOAMS v1.0.5 developed by Shea et al. (2010) to perform the stereological correction accounting for the intersection probability and off-center effects that occur when converting 2D objects to 3D (Sahagian and Proussevitch, 1998; Armienti, 2008; Shea et al., 2010).
Whole rock major and trace element compositions were obtained using fusion-ICP-MS at Activation Laboratories (ActLabs), Canada. Major element compositions of interstitial and melt inclusion glass, plagioclase, pyroxene, olivine, Fe-Ti oxide and apatite were analysed using a JEOL JXA-8530F electron probe X-ray microanalyzer (EPMA) equipped with five wavelength-dispersive spectrometers (WDS) at the Facility for Analysis Characterisation Testing and Simulation (FACTS, NTU). In addition, average groundmass compositions were measured using electron dispersive spectroscopy (EDS), using the same SEM described above. Analyses were performed on carbon-coated grain-mounts, polished thick and thin sections under high-vacuum conditions. In addition, olivine and average groundmass trace element compositions for the CCI and the GKI samples were measured by Laser Ablation Inductively Coupled Mass Spectrometry (LA-ICP-MS) at the Earth Observatory of Singapore, NTU. Details on the analytical conditions, standards and procedure used for each phase are provided in Supplementary Material.
Pre-eruptive temperatures were estimated with a range of geothermometers. The plagioclase-liquid and clinopyroxene-liquid geothermometers (Eqs. (24a), (33). In Putirka, 2008) were applied to all deposits using the averaged melt inclusion composition as the liquid for the CCI and Marapi’s PDC and using the averaged matrix glass for the GKI. Additionally, for the CCI and GKI we applied the olivine-liquid geothermometer (Eq. 4 in Putirka et al., 2007) and used Sc/Y partitioning between olivine and liquid (Mallmann and O’Neill, 2013). For Marapi’s PDC, we applied the two-pyroxene geothermometer (Eq. 37 in Putirka, 2008). Melt-H2O was calculated with the plagioclase-liquid hygrometer (Waters and Lange, 2015) that was used iteratively with the plagioclase-liquid thermometer (Putirka, 2008) until both temperature and water content became stable. Further calculations to constrain pre-eruptive melt-water contents were made using apatite and nominally anhydrous minerals (NAMs, pyroxene and olivine). Apatite halogen concentrations and melt-Cl content were measured by EPMA for all three deposits. We used the coupled partitioning of F-Cl-OH between apatite and melt to calculate melt-H2O contents (Li and Costa, 2020), where the OH concentration in apatite was obtained by stoichiometry (Ketcham, 2015). In the case of the GKI, thanks to the high apatite-content and their larger sizes, we could directly measure apatite volatile contents (H2O, CO2, S, F and Cl) with a cameca ims-1280 secondary ion mass spectrometer (SIMS) at the university of Hawai’i at Manoa. Due to the scarce amount of apatite in the CCI and Marapi PDC deposits, we also measured water concentrations in pyroxene and olivine by SIMS. We then calculated melt-water contents using partition coefficients of H2O between NAMs and silicate melt (Aubaud et al., 2004; Kohn and Grant, 2006; Edmonds et al., 2016). Details on the analytical conditions and volatile calculations are provided in Supplementary Material.
We obtained pre-eruptive pressures for the CCI and GKI using the H2O-CO2 saturation model of Papale et al. (2006). Melt-CO2 was calculated from apatite-melt H2O/CO2 partition coefficients (Riker et al., 2018) in the case of the GKI, and derived from melt-CO2 measurements in melt inclusions of recent Llaima deposits (Bouvet de Maisonneuve et al., 2013) as a proxy for the CCI. For Marapi’s PDC we used the two-pyroxene geothermometer and geobarometer iteratively. Precisions on calculations and model applications are detailed in Supplementary Material and the data repository.
Bulk rock and matrix glass compositions of all the samples follow a classical arc calc-alkaline series ranging from a basaltic-andesite with 53–57 wt% SiO2 and 3.5–5.0 wt% alkalis for the CCI to a trachyte with 64–66 wt% SiO2 and 7.0–8.0 wt% alkalis for the GKI (see Figure 2A). In between, the Marapi PDC has a mafic andesitic bulk rock composition of 57 wt% SiO2 and 5.0 wt% Na2O+ K2O, which is quite different from the trachy-andesitic to trachytic interstitial melt composition that spans from 59 to 65 wt% SiO2 and 6.5–8.5 wt% Na2O+ K2O. The CCI composition falls in the same range as recent Llaima deposits that were produced by strombolian and effusive eruptions (Bouvet de Maisonneuve et al., 2012, 2013; Ruth et al., 2016; Schonwalder-Angel et al., 2018). This is not the case for the Marapi PDC that is relatively more mafic in composition than the two most recent eruptions of 2014–2017 for which the glass composition was rhyolitic (Nurfiani et al., 2021). The trachytic composition of the black PDC unit of the GKI is similar to but slightly more mafic than the lower (earlier) units of the same ignimbrite (see Figure 2A) and very different from the current activity of Batur that is mostly basaltic to basaltic-andesitic (Marinelli and Tazieff, 1968; Sutawidjaja, 1990, 2009; Reubi and Nicholls, 2004a, 2004b, 2005).
The crystal-poor CCI contains 0.4–4 vol% plagioclase, 0–1 vol% pyroxene, 0–1 vol% olivine, <0.5 vol% Fe-Ti oxide as phenocrysts with a total phenocryst content of 1–4 vol% on a vesicle-free basis (Table 1; Figure 3A). Plagioclase crystals are euhedral presenting some oscillatory zoning and span a wide range of compositions from An40—An85 (An–Anorthite content = Ca/(Ca+Na+K)*100 in mol%; Figure 2B). Some lower An-content plagioclases were analysed but they were probably from enclaves from the bedrock, as there is a high quantity of granitic lithics inside the deposit. Pyroxene crystals are euhedral and vary in composition with a majority of clinopyroxene (Augite-Diopside) and fewer orthopyroxene (Enstatite; Figure 2C). Fe-Ti oxides also span a wide range of compositions and follow two distinct trends in a TiO2 vs. FeOT diagram (FeOT = Total iron as FeO; Figure 2D): One Fe and Ti-rich group that consists of magnetite to titanomagnetite phenocrysts, and one Cr-rich group that consists of a few chromites included in olivine. Olivine crystals are euhedral with some fast-growing textures at the rim (Figure 3A). They are normally zoned from core to rim and yield a Mg# of 75 to 50 (Mg# = Mg/(Mg+Fe)*100 in mol%; Figure 2E).
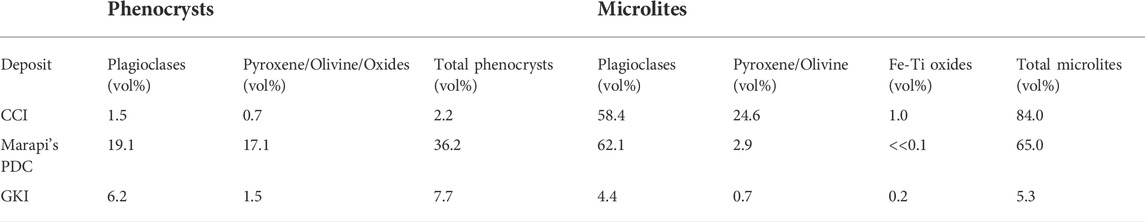
TABLE 1. Phenocryst and microlite content averages for each sample. All calculations have been made vesicle-free.
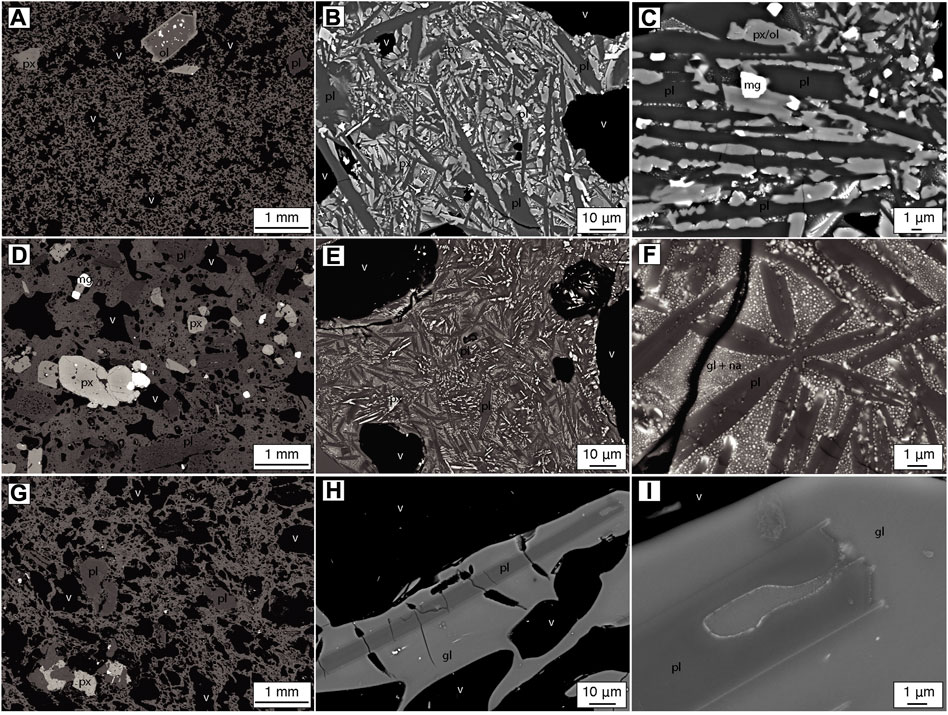
FIGURE 3. Crystal texture BSE images. Each row represents one sample: (A–C) Curacautín; (D–F) Marapi; (G–I) Gunungkawi. Each column represents the same magnification for comparison: (A), (D), (G) BSE maps showing phenocrysts; (B–C), (E–F), (H–I) two magnifications focusing on the groundmass texture. We can see that the Curacautín ignimbrite sample is relatively phenocryst-poor with an almost fully crystallized matrix, Marapi’s PDC is phenocryst-rich with a highly crystallized matrix and the Gunungkawi ignimbrite is phenocryst-poor with few microlite and microphenocrysts in the matrix.
The crystal-rich Marapi PDC contains 15–23 vol% plagioclase, 10–20 vol% clino- and orthopyroxene in relatively similar amounts, and 1–3 vol% Fe-Ti oxide as phenocrysts for a total phenocryst content ranging from 32 to 40 vol% on a vesicle-free basis (—Figure 3). Plagioclase phenocrysts display a wide range of textures with the largest phenocrysts (0.5–1.5 mm) being euhedral to blocky with sieved high-An (An70–85) cores and lower An rims (An50–70) and smaller euhedral phenocrysts (0.25–0.5 mm) that are either An-rich (An > 70) or An poor with a sieved core (An <70). Cpx (Clinopyroxene) and Opx (Orthopyroxene) phenocrysts occur either side by side in clusters or as single phenocrysts in the matrix. Both Cpx and Opx are euhedral and have a narrow compositional range (Figure 2C and Figure 3). Fe-Ti oxides are also euhedral and are all low-Ti magnetite with a very narrow compositional range.
The crystal-poor GKI contains 4–8 vol% plagioclase, 0.5–1.5 vol% Cpx, 0.5–1 vol% olivine and <0.5 vol% titanomagnetite as phenocrysts for a total phenocryst content ranging from 6 to 10 vol% on a vesicle-free basis (Table 1; Figure 3). Plagioclase, Cpx and titanomagnetite are all euhedral and span a narrow compositional range with plagioclase crystals ranging from An30—An50, Cpx being mostly Ca-rich augite, and titanomagnetite containing 17–22 wt% TiO2 and 69–72 wt% FeOT. Olivine crystals are euhedral or present in clusters with Cpx and plagioclase, rarely zoned, and mostly Fe-rich with Mg# ranging from 27 to 62 (Figure 2E).
There are important textural differences between the groundmasses of the three deposits. The groundmass of the CCI is almost entirely crystallized with 80–90 vol% microlites on a vesicle-free basis, that are plagioclase (55–65 vol%), Cpx and olivine (20–30 vol%), and Fe-Ti oxides (0–2 vol%; Table 1 and Figures 3B,C). All microlites display fast-growth textures with clear plagioclase-pyroxene-magnetite intergrowth (Figure 3C) and the presence of occasional dendrites on the plagioclase tips. Crystal sizes vary from <1 µm for magnetite and 1–30 µm for pyroxenes to 10–200 µm for plagioclase. The most elongated plagioclases are often broken perpendicularly to the long axis with vesicles growing in the cracks, showing a “boudinage” structure (see Figure 4). Variations in crystal sizes are visible between samples indicating varying dynamics of crystal nucleation and growth, however, the total vesicle-free microlite content always stays in the 80–90 vol% range.
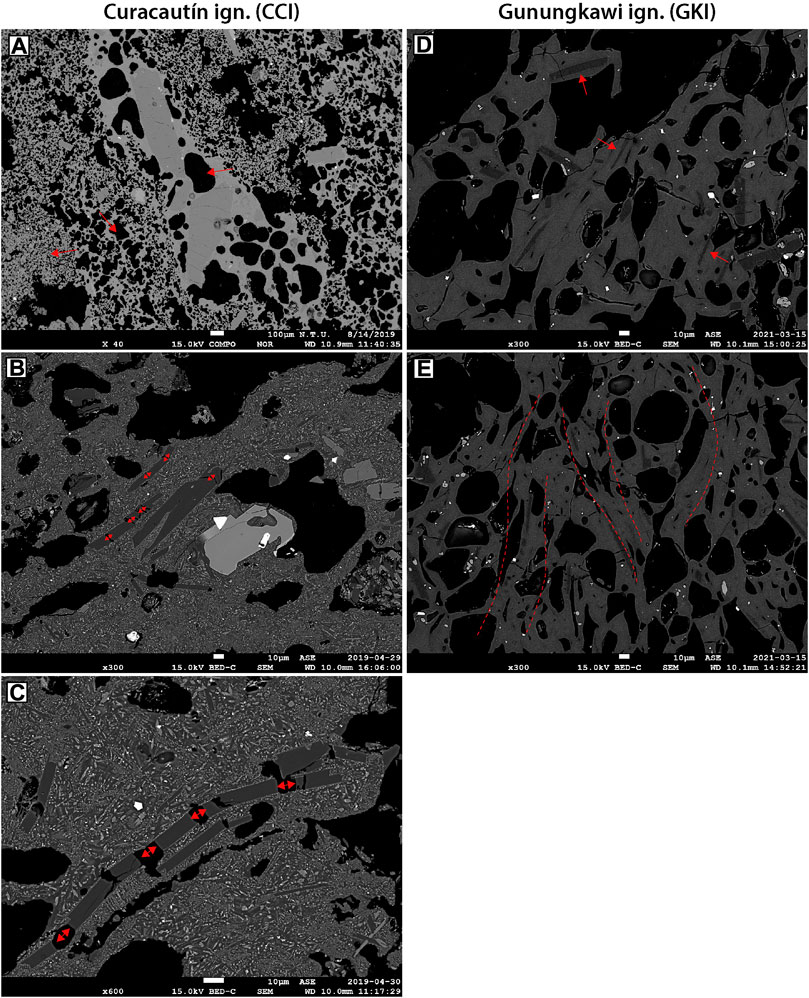
FIGURE 4. Textural deformation in studied ignimbrites. (A), (B,C) Curacautín ignimbrite, (D,E) Gunungkawi ignimbrite. Images are not at the same scale. In (A) we can see varying degrees of bubble nucleation, growth and coalescence due to the large phenocrysts and magmatic enclave in the centre of the image. The different areas with variying bubble sizes are highlighted by red arrows. In (B,C) we can see some “boudinage” (red double arrows) with plagioclase microphenocrysts being broken perpendicularly to their maximum elongation axis and vesicles growing within the cracks to fill the voids. Microlites are also broken and show displacement after “boudinage” due to the intense shearing within the melt+ microlite mixture. (D,E) show microlites bent due to the shearing (red arrows) and reorganization of deformed vesicles and microlites along “flow lines” highlighted in dotted red lines.
The groundmass of Marapi’s PDC is also almost completely crystallized with 50–80 vol% microlites on a vesicle-free basis that are vastly dominated by plagioclase (49–70 vol%) with the occurrence of some pyroxene (<<1 vol%—8 vol%; Table 1 and Figures 3E,F). There are also nanolites whose nature was not characterized in the remaining matrix (Figure 3F). All microlites present fast-growth textures with the presence of dendrites on most plagioclase crystals, plagioclase-pyroxene intergrowths, and radial-crystallization of plagioclase from a central nucleus (Figure 3F). Microlite sizes are relatively smaller than in the CCI with Fe-Ti oxides and pyroxene that are <<1–10 µm and plagioclase that is 1–20 µm in length.
The groundmass of the GKI is microlite-poor with 2–8 vol% crystals on a vesicle-free basis that are plagioclase (2–7 vol%), pyroxene (0.1–1 vol%) and Fe-Ti oxides (<0.5 vol%; Table 1). Plagioclase microlites are usually euhedral/blocky and very elongated (Figure 3H) with skeletal extremities (Figure 3I), while pyroxene and oxide microlites are mostly blocky. Plagioclase sizes range from 10 to 200 μm, while pyroxene and Fe-Ti oxide sizes range from 1 to 10 µm. Some of the most elongated plagioclase crystals are bent (Figure 4).
Observations were made on handsamples in 3D (Figure 5) for the largest vesicles and on thin sections in 2D (Figure 6) for the smallest vesicles to have the best image resolution possible for the whole size range. Despite being of similar appearance, the cauliflower/scoriaceous bombs from all three PDC deposits are very different texturally. The CCI and Marapi samples are relatively homogeneous while the GKI samples are breadcrusted (Figures 1C,F,I).
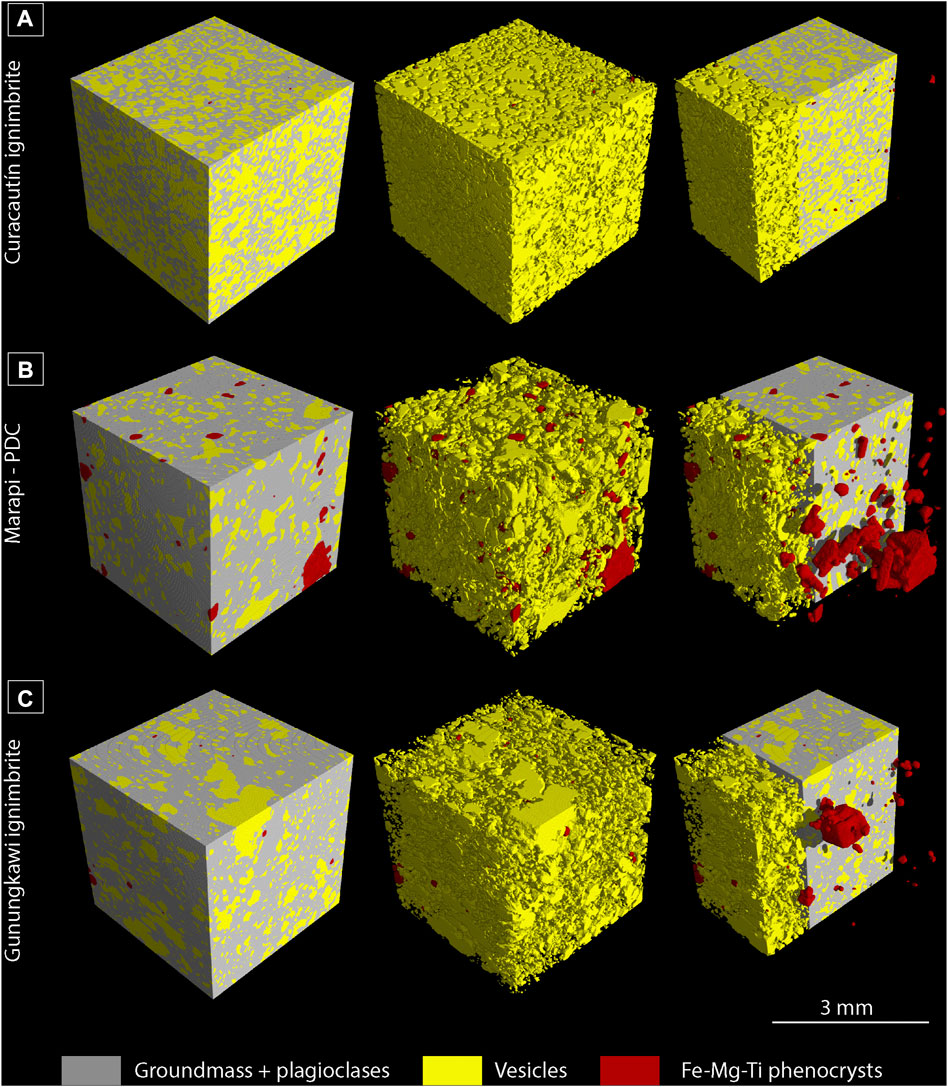
FIGURE 5. Three-dimensional rendering of three image stacks after segmentation of groundmass and plagioclases (grey), vesicles (yellow) and ferromagnesien phenocrysts (red). (A) Curacautín ignimbrite; (B) Marapi’s PDC; (C) Gunungkawi ignimbrite. All volumes are 400 voxels per side, withresolutions of 7.5 µm per voxel. The variation in total phenocryst content between the three deposits is well illustrated by the variation in ferromagnesian phenocrysts displayed here.
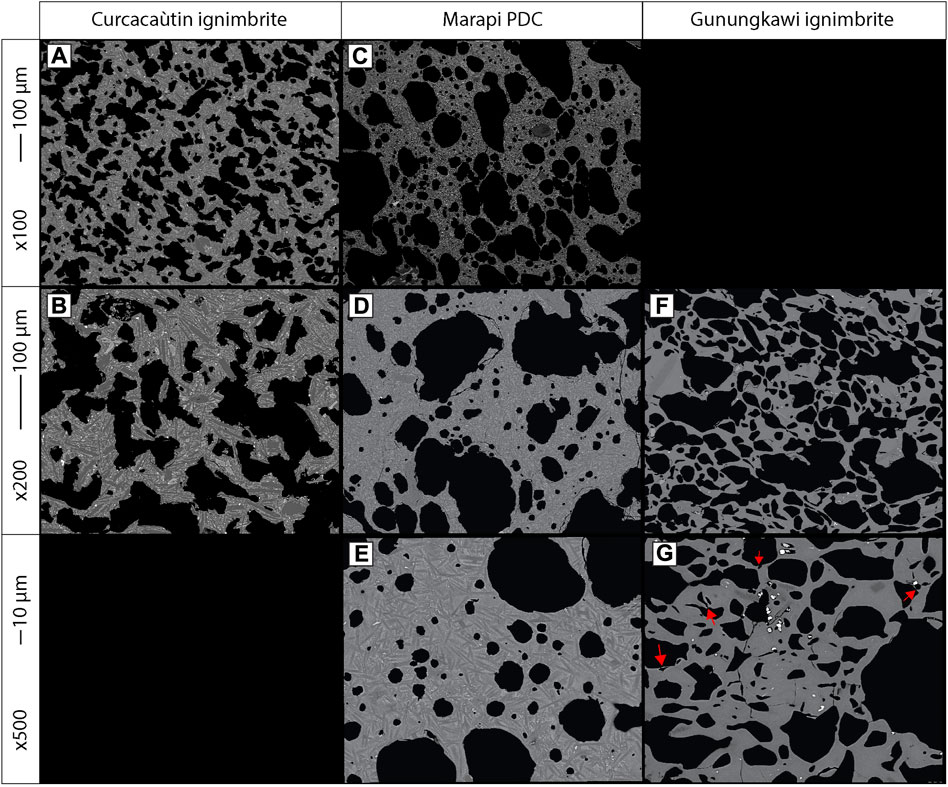
FIGURE 6. Backscattered images of the samples ordered by magnification. (A,B) Curacautín ignimbrite cauliflower bomb containing mostly highly deformed and connected vesicles and a quasi-absence of smaller vesicles which explains why no higher magnification images were processed. (C–E) Marapi’s PDC bomb showing vesicles with high degrees of sphericity in the smaller size-range and connected vesicles for higher size-range that are showing low degrees of deformation. (F,G) The highly vesicular Gunungkawi ignimbrite pumice rind, that contain mostly deformed vesicles even among small size-ranges. Structures of vesicle coalescence and deformation are visible with few un-retracted bubble walls still visible (red arrows) and most vesicles being flattened due to shearing (without any particular orientation).
The CCI samples are relatively vesicular with 45–60 vol% vesicles on a phenocryst-free basis (see Table 2). There is almost an absence of vesicles <10 µm in diameter, with most vesicles being highly deformed and connected (Figure 5A and Figures 6A,B) Vesicle shapes are largely affected by the high-microlite content of the matrix with vesicles possessing square-like shapes with straight edges bound by crystals (Figures 6A,B).
TABLE 2. Quantitative vesicle analysis results for pyroclasts calculated from 2D image and 3D scans analyses. Vesicularity–crystal free was calculated from the bulk vesicularity with the average phenocryst content of 2.5, 36 and 8 vol% for the Curacautín ignimbrite, Marapi-PDC and the Gunungkawi ignimbrite respectively. Hydraulic tortuosity was exctracted from 3D scans.
Marapi’s PDC samples are similar to those of the CCI in terms of vesicularity with vesicle contents of 50–65 vol% on a phenocryst-free basis. However, vesicles are generally more spherical with low degrees of deformation, and small vesicles (<10–20 µm) in particular have high degrees of sphericity (Figures 6C–E). Small and intermediate sized vesicles (few microns to a few hundreds of microns) generally appear isolated in 2D, while in 3D large vesicles are usually well connected (Figure 5B). Although the high microlite content does not appear to alter the geometry of the fine bubble network, the high phenocryst content exerts an important control on large vesicle shapes that is visible in 3D (Figure 5B).
The GKI samples possess the highest vesicularity (55–75 vol% on a phenocryst-free basis) among the three deposits. Unlike Marapi’s PDC and the CCI, most vesicles show a high-degree of deformation with a low-degree of connectivity (Figures 6F,G). Vesicles are highly deformed probably linked to gas-loss that is visible due to the quasi-absence of highly spherical vesicles (Figure 6G). We can see that the melt viscosity plays a major role in the lower degree of connectivity despite the high vesicularity with the presence of very thin bubble walls (<1 µm) and partially retracted walls (red arrows in Figure 6G). These suggest that the largest vesicles formed by coalescence rather than by only bubble growth.
Quantitative textural parameters extracted from the 3D scans and the 2D image analyses are summarized in Table 2 and Figure 7.
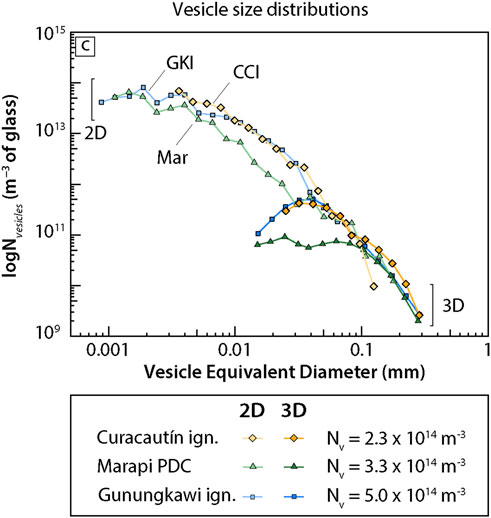
FIGURE 7. Quantitative vesicle analysis. Top row plots show the relative vesicle proportion for extracted from 2D images (light grey) and 3D scans (dark grey with black contours). For each category, vesicle proportion has been normalized to 100% (the sum of each bin is equal to 100% for each category). Bottom row: Glass referenced Vesicle size distributions for 2D image (light grey) and 3D scans (black). The vesicle number density (Nv), calculated based on the cumulative size distribution is indicated for each curve. Due to the fact that vesicles <10–20 µm make >90% of Nv, Nv calculated based on the vesicle size distribution extracted from 3D scans are largely underestimated as it does not account for small size vesicles and tend not to be able to resolve thin vesicle walls.
The vesicle size distributions (VSD) of all three units (Figure 7) were plotted separately for the 2D BSE and 3D microCT image analyses. There is good agreement between the overlapping parts of both curves, which suggests that the parameters chosen for the stereological corrections are reliable. The CCI 2D VSD (orange curve) is slightly shorter as it does not contain any of the smallest-sized vesicles that can be seen for the two other deposits. This is partly the effect of not using any images at ×500 magnification given the quasi-absence of small (<4 um) vesicles. VSDs follow a linear (i.e. power-law) trend in the log-log plots, except for the smallest vesicles in each sample that fall below the power-law relationship due to the intersection probability effect at high magnifications (Armienti, 2008; Brugger and Hammer, 2010a).
The cumulative Vesicle Number Density (Nv) across all size bins is very similar for the three units, with values of 2.30 × 10¹⁴ m−3 for the CCI, 3.33 x10¹⁴ m−3 for Marapi’s PDC, and 4.98 ×1 014 m−3 for the GKI (Table 3; Figure 8A). These numbers were calculated on the total VSD made from combining the 2D and 3D curves. These values are at the high end of the known range for mafic magmas (Rust and Cashman, 2011), comparable with what was found at Etna, 122BC and Tarawera, 1886 for basaltic to basaltic-andesitic products from Plinian eruptions (Sable et al., 2006, 2009), but also with the eruptions of Askja, 1875, Towada and Novarupta, 1912 from more evolved magmas (Figure 8A; Toramaru, 1990; Adams et al., 2006a, b; Carey et al., 2009; 2010).
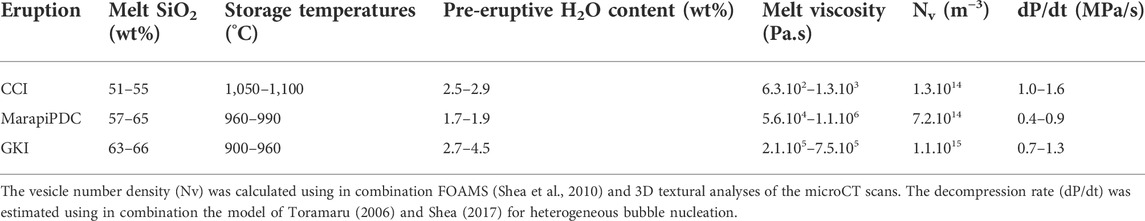
TABLE 3. Summary of the main parameters calculated from petrology, geochemistry and textural analyses. Melt viscosity was estimated using the model of Giordano et al. (2008).
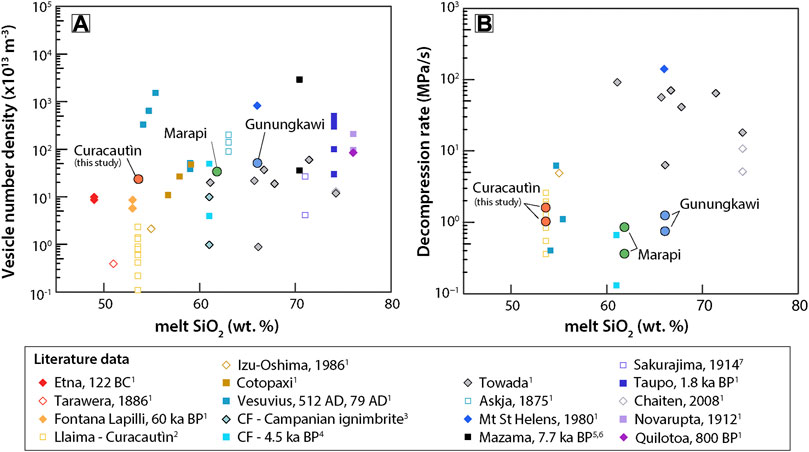
FIGURE 8. Vesicle number density (A) and decompression rates (B) calculated from Plinian and sub-Plinian eruptions pyroclasts plotted against glass SiO2 content. Circles are data from this study. Literature data are squares and diamonds. References: 1Alfano et al. (2012) [Chaiten] and references therein [Etna 122BC; Tarawera 1886; Fontana Lapilli 60 ka BP; Izu-Oshima 1986; Cotopaxi; Vesuvius 512 AD and 79 AD; Towada; Mt St Helens 1980; Taupo 1.8 ka BP; Novarupta 1912; Quilotoa 800 BP], 2Valdivia et al. (2021) [Llaima–Curacautín], 3Polacci et al. (2003) [CF-Campi Flegrei’s Campanian ignimbrite], 4Romano et al. (2020) [CF-Campi Flegrei’s Agnano Monte Spina’s 4.5 ka BP], 5 (Bacon and Druitt, 1988); 6Klug et al. (2002) [Mazama 7.7 ka BP], 7 Nakamura (2006) [Sakurajima 1914 Taisho eruption].
Hydraulic tortuosity was obtained with the VGstudioMax software on the largest volumes that are more representative of the real sample. It is calculated by measuring the average length of connected vesicle pathways found along the medial axis and dividing it by the length between the two end faces of the volume (Degruyter et al., 2010). The tortuosity was measured along the three directions of the volumes. For the CCI, values range between 1.30 and 1.39 (Table 2), for Marapi’s PDC we find a range of values of 1.55–1.73 with some slight variations depending on the direction investigated, and the GKI volumes yield the most variability with values ranging from 1.40 to 1.66. Thus, the CCI cauliflower bombs have less convoluted gas escape pathways while the bombs from the Marapi PDC and the GKI have the most convoluted pathways for permeable gas escape. These values are quite low, implying that gas escape pathways are rather linear and not so convoluted, especially in comparison with the rhyolitic tubular and frothy pumices from the Kos Plateau Tuff which record tortuosities of 1.5–2.8 (Degruyter et al., 2010). However, this could also be an artifact of our volume resolution compared with Degruyter et al. (2010) that used synchroton and were therefore able to see finer details such as fine vesicle walls. In general, when comparing textures in objects (whether in 2D or 3D), it is very important to use the same scales and spatial resolution in order to have a meaningful comparison (Polacci et al., 2003; Martel and Poussineau, 2007; Shea et al., 2010; Giachetti et al., 2011; Preece et al., 2016; Bain et al., 2019; Bernard and Bouvet de Maisonneuve, 2020).
Pre-eruptive magma temperatures were assessed using the variety of analyses performed on plagioclase, pyroxene, and olivine coupled with average groundmass composition (EDS data), average interstitial melt composition or average melt inclusion compositions for each sample (Figure 9A). The variation between samples for the usage of either groundmass/interstitial melt or melt inclusion is function of the equilibrium between the pairs phenocrysts/liquid. We focused on using a maximum number of pairs at the equilibrium. For the basaltic-andesitic CCI, the plagioclase-liquid, the Cpx-liquid and the olivine-liquid geothermometers (Putirka et al., 2007; Putirka, 2008) yield very similar temperatures (within model uncertainties) of 1,068–1,096 ± 36°C, 1,045–1,100 ± 42°C, and 1,047–1,110 ± 29°C, respectively (Figure 9). These values largely overlap with most of the temperatures retrieved using Sc-Y partitioning between olivine and melt, with a comparable average temperature of 1,114 ± 15°C despite higher temperatures (up to 1,240 °C calculated for olivines with a very high Mg-core) having been recorded too. The few pairs of pyroxenes phenocrysts found to be in equilibrium give cooler temperatures of 946–1,013 ± 38°C. All these pre-eruptive magma temperature estimates are approximately 25–50°C cooler than the temperatures calculated for the most recent eruptions of Llaima (Figure 9A; Bouvet de Maisonneuve et al., 2012).
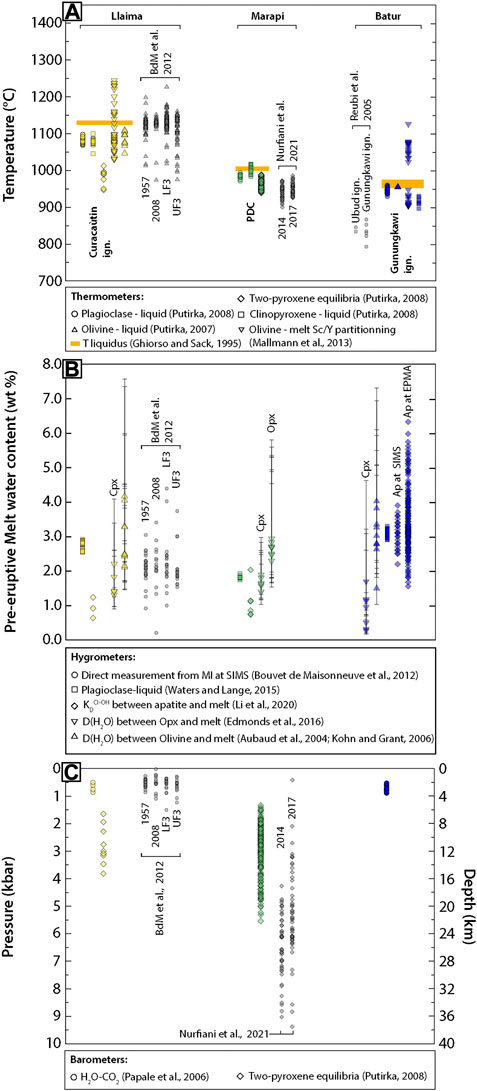
FIGURE 9. (A) Temperature, (B) Water content and (C) Pressure calculation (and corresponding depth assuming an average crustal density of 2,500 kg/m3). For all the figure, coloured symbols are from this study and grey symbols are from the literature (Reubi and Nicholls, 2004a; Bouvet de Maisonneuve et al., 2012; Nurfiani et al., 2021). Details for all the symbols are referred below each plot. Error bars in (B) represent the variability in the partition coefficient D (H2O) between the silicate and the melt. For pyroxenes, the variability of D comes from the 1
From Marapi’s mafic andesitic PDC, calculated pre-eruptive magma temperatures are about 100 °C cooler, ranging from 972 to 994 ± 36°C, 984–1,016 ± 42°C and 901–990 ± 38°C using the plagioclase-liquid, Cpx-liquid, and two-pyroxene geothermometers respectively. The two-pyroxene thermometer gives very similar crystallization temperatures to the ones found for the slightly more evolved 2014 and 2017 eruptions (Nurfiani et al., 2021), with differences being within uncertainties of the model.
For the trachytic GKI, the plagioclase-liquid, Cpx-liquid and olivine-liquid geothermometers give very similar pre-eruptive magma temperatures of 930–960 ± 36°C, 897–931 ± 42°C and 955–956 ± 29°C (N=4) respectively. Temperatures calculated from Sc-Y partitioning between olivine and melt show a bimodal distribution with a lower range of 905–930 ± 15°C, in agreement with the three other methods and given by the most Fe-rich olivine that are in equilibrium with the interstitial melt (Mg#27–40; Figure 2E). The higher temperature range of 1,023–1,079 ± 15°C is recorded by more magnesian olivines (Mg# > 40) that are likely xenocrysts or antecrysts given that they are not in equilibrium with the interstitial melt. Average pre-eruptive temperatures of 900–950°C are higher by 50°C than the temperatures calculated by Reubi and Nicholls (2004a) for the lower part of the sequence of the GKI. They are also 50 and 150°C lower than for the mafic andesitic Marapi PDC and the basaltic-andesitic CCI respectively.
Due to the inherently challenging nature of determining pre-eruptive water contents from phenocryst-poor, melt inclusion-free, and microlite-rich samples, the diversity of methods applied often yields large ranges and uncertainties, and poorly overlaps. The estimated pre-eruptive water contents are summarized in Figure 9B. For the CCI, we estimated 2.54–2.92 wt% H2O in the melt with the plagioclase-liquid equilibria (Waters and Lange, 2015), 0.6–1.23 ± 0.4 wt% H2O with F-Cl-OH partitioning between apatite and melt (Li and Costa, 2020), 1.0–4.1 wt% H2O with water partitioning between Cpx and melt (Edmonds et al., 2016) and 1.4–7.3 wt% H2O with water partitioning between Olivine and melt (Aubaud et al., 2004; Kohn and Grant, 2006). Results given by apatite need to be treated carefully as only three crystals could be measured due to their scarcity, and the apatite measured were small (<20 um on the long axis) and inside the matrix so probably underwent degassing. Water estimates from NAMs come with large error bars due to the big uncertainties on the partition coefficients of H2O between melt and NAMs, especially for olivine where it varies threefold between studies (Aubaud et al., 2004; Kohn and Grant, 2006). Therefore, we will place more trust in the water contents estimated with the plagioclase-liquid hygrometer. These water contents are ∼0.5 wt% greater than for the most recent eruptions of Llaima (Bouvet de Maisonneuve et al., 2012).
For Marapi’s PDC deposit, we estimated 1.74–1.93 wt% H2O with the plagioclase-liquid hygrometer, 0.73–2.03 wt% H2O with apatite, 1.53–5.80 wt% H2O with water partitioning between Opx and melt, and 1.03–2.83 wt% H2O with water partitioning between Cpx and melt. For the same reasons as for the CCI samples, apatite in Marapi’s PDC are likely degassed and might not reflect accurately the magma’s pre-eruptive water content. Nevertheless, the other methods overlap quite well and suggest a pre-eruptive dissolved water content of ∼1.5–2.5 wt%, slightly lower than for the CCI.
For the GKI, we estimated 2.91–3.24 wt% H2O with the plagioclase-liquid equilibria, 2.2–3.9 wt% H2O with apatite measured at the SIMS, 1.6–6.3 wt% H2O with apatite measured at the EPMA, 0.5–4.62 wt% H2O with water partitioning between Cpx and melt, and 1.0–7.3 wt% H2O with water partitioning between olivine and melt. Apatite measured by SIMS and EPMA were large and included in pyroxene or plagioclase phenocrysts and thus record the reservoir’s volatile content before eruption. The average water contents are 3.07 and 3.46 wt% for apatite measured at the SIMS and the EPMA respectively, which is consistent. These averages are also in good agreement with the plagioclase-liquid hygrometer (3.1 wt% in average) and the water contents derived from olivine (3.0 wt% in average), suggesting that the GKI ignimbrite was the most hydrous of the three units studied but only by slightly.
Melt CO2 was also determined for the GKI ignimbrite, where direct CO2 measurements could be done on apatite and melt-CO2 content could be retrieved using the H2O-CO2 partition coefficient between apatite and melt (Riker et al., 2018). We find melt-CO2 contents of 47–62 ppm.
Pre-eruptive storage pressures were estimated using the H2O-CO2 saturation model of Papale et al. (2006) for the CCI and GKI and two-pyroxene equilibria for the CCI and Marapi’s PDC (Figure 9C). For the CCI we obtain pressures of 0.5–0.8 kbar s, which is in the same range as pressures calculated for recent Llaima products using the same H2O-CO2 saturation model (Bouvet de Maisonneuve et al., 2012). However, as we have no independent measurement of CO2 for the CCI, it may be because CO2 values are the same between both studies. The two-pyroxene geobarometer gives pressures of 1.6–3.8 kbar, which is significantly deeper and potentially more likely given the greater magma volume involved in the ignimbrite than in recent strombolian eruptions.
For Marapi’s PDC we obtain the deepest storage pressure range of 1.3–5.5 kbars based on two-pyroxene equilibria. These magma storage pressures are overlapping but slightly lower and narrower in range than the ones obtained by (Nurfiani et al., 2021) for the 2014 and 2017 eruption products. For the GKI, H2O-CO2 saturation pressures range from 0.5 to 0.9 kbar s, similarly to the H2O-CO2 saturation pressures for the CCI.
Despite very similar appearances in the field and quite similar mineral assemblages, the three units studied have substantially different pre-eruptive magma properties and/or storage conditions. The phenocryst-poor CCI and GKI were fed by rather shallow magma reservoirs typical of caldera-forming systems (Cashman and Giordano, 2014; Edmonds et al., 2019—Figure 10). The phenocryst-rich Marapi PDC was fed by a somewhat deeper reservoir, although maybe not as deep as the one feeding current magmatic activity (Nurfiani et al., 2021—Figure 10). As expected, pre-eruptive storage temperatures decrease with increasing magma/groundmass silica content. However, substantial degrees of undercooling are recorded for the CCI magma, while lower degrees of undercooling are recorded for the Marapi PDC and for the GKI magmas (Figure 9A). Pre-eruptive water contents do not vary linearly with melt silica content nor temperature. Instead, the CCI and GKI magmas are quite hydrous (>2.5 wt% H2O), while the Marapi PDC magma is dryer (<2 wt% H2O) despite being stored at greater depths.
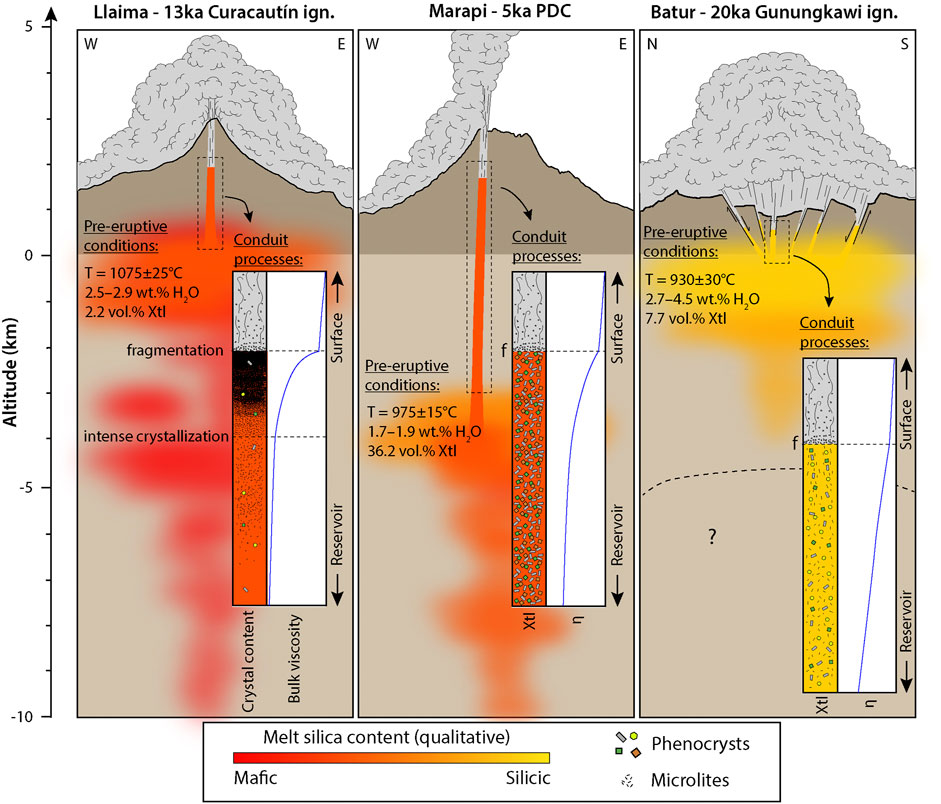
FIGURE 10. Summary sketch of the main processes at play in controlling the generation of the three studied PDCs. The pre-eruptive conditions are indicated next to the inferred position of the last storage zone before eruption. The insets in each sub-figure represents conduit processes and qualitative evolution of the bulk viscosity based on our findings. The question mark on the Batur sub-figure indicate that we have no information on what is happening below the last reservoir before surface.
The CCI magma viscosity is low, as expected for a phenocryst-poor basaltic-andesite (Figure 11). In contrast, the mafic andesitic Marapi PDC magma viscosity is higher by 2–3 orders of magnitude given its higher phenocryst-content, more silicic groundmass, and lower water content. It is of the same order of magnitude as the phenocryst-poor, alkali- and water-rich GKI magma viscosity (Figure 11). These noticeably different initial conditions set in the reservoir will influence the timing and feedbacks between magma ascent rate, volatile exsolution, and microlite nucleation, ultimately determining whether and when fragmentation will occur.
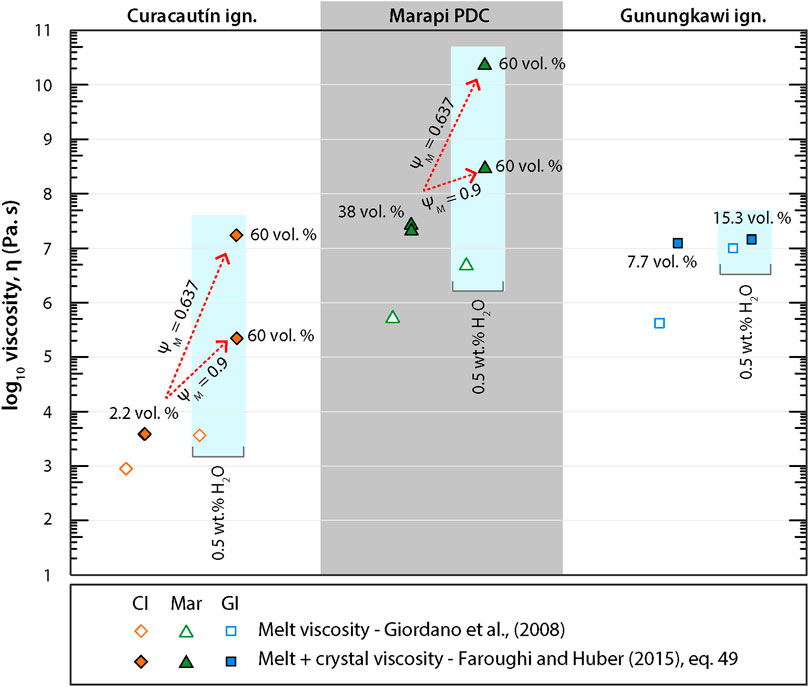
FIGURE 11. Melt and melt + crystals viscosity calculations at various stages of the eruption. The open symbols represent the melt viscosity that was calculated using Giordano et al. (2008) model. The colored-closed symbols represent the melt + crystals viscosity that were calculated combining Giordano et al. (2008) and Faroughi and Huber, (2015)—Eq. 49 models. For the bulk viscosity calculated with the Eq. 49 in Faroughi and Huber, (2015), we use a range of max-packing particle values (
Vesicle number densities (Nv) are similar for all three units and fall within the range of what has been observed for Plinian eruptions of each magma composition (Figure 8A). We find slightly higher numbers of Nv for the CCI than the one found by Valdivia et al. (2021) - (0.1–3.1013 m−3 - Figure 7A) that were computed solely from X-ray microCT using isolated vesicles. The CCI falls in the upper range of Nv for mafic Plinian eruptions (1012–1014 m−3) with the examples of Etna, Tarawera, Fontana Lapilli, and Izu-Oshima that produced Plinian fall deposits but no PDCs (Coltelli et al., 1998; Houghton et al., 2004; Toramaru, 2006; Sable et al., 2006,2009; Costantini et al., 2010). Similarly, for the Marapi and GKI products, we find typical VNDs (1013–1016 m−3) for more evolved Plinian eruptions (both fall and PDC deposits) such as Askja in 1875, Quilotoa or Novarupta (Alfano et al., 2011 and references therein).
Applying heterogeneous vesicle nucleation as the main process (Eq. 14 in Shea, 2017) and applying Toramaru (2006)’s model to our VNDs, we find pre-fragmentation decompression rates in the range of 0.4–1.6 MPa/s (Figure 8B). These estimated decompression rates fall in the middle of the spectrum for large explosive eruptions (Figure 8) and are consistent with decompression rates (0.1–10 MPa/s) calculated using numerical conduit modelling for other Plinian eruptions (Papale and Dobran, 1993; Kaminski and Jaupart, 1997; Papale et al., 1998; Neri et al., 2022). Such large decompression rates would prevent volatiles from escaping by bubbles decoupling from the melt or through the formation of a bubble network, which then further enhances magma ascent rate and strain rate, leading eventually to fragmentation.
Brittle fragmentation occurs when the melt relaxation time is longer than the time necessary for vesicles to expand (Dingwell 1996; Papale et al., 1999; Gonnermann and Manga 2007). Traces of these high strain rates have been observed in the GKI samples, with the presence of bent plagioclase microlites (Figure 4). Similarly, in the CCI samples, varying degrees of “boudinage” are visible on the most elongated and largest plagioclase microlites/microphenocrysts as well as varying dynamics of crystal and vesicle nucleation and growth due to intense shearing (Figure 4). Interestingly in the Marapi PDC samples, no obvious traces of high-strain rates are visible despite the very similar calculated melt viscosities (5.6 × 10⁴–1.1 × 10⁶ for Marapi vs. 2.1.105–7.5.105 for the GKI deposit; Figure 9). Vesicles kept their dominantly spherical shape without any obvious deformation due to shearing in the melt. It is also possible for the Marapi samples analysed in this study to have been issued from the centre of the conduit and as such to not show evidences of intense strain rate as has been suggested in other systems (Polacci et al., 2003; Rosi et al., 2004; Bouvet de Maisonneuve et al., 2009). However, in these other studies, there was a clear macroscopical difference between the types of clasts representing distinct regions of the conduit, which were not seen during sampling for Marapi.
The high pre-fragmentation decompression rates found for the magmas responsible for the three studied deposits are a consequence of very high vesicle number densities. High VNDs reflect the magma’s ability to keep volatiles until fragmentation, thus resulting in strain-rates due to bubble expansion during decompression that are too important for the melt structure to relax (Dingwell and Webb, 1989; Gardner et al., 2000). In the case of the Marapi and GKI magmas, the relatively high magma viscosity has the dual role of resisting fluid flow due to the high relaxation time of its melt structure but also retaining volatiles more efficiently by resisting bubble expansion and coalescence (Dingwell and Webb, 1989).
The CCI magma’s low melt viscosity should not have efficiently kept volatiles coupled with it and should have led to intense lava fountaining at high decompression rates due to the formation of a two-phase (gas + phenocryst-poor melt) flow (Gonnermann and Manga, 2012; Houghton et al., 2016) resulting in inertial-fragmentation (Namiki and Manga, 2008; Namiki et al., 2021). However, the very low initial phenocryst content (<4 vol%), the relatively high-water content for a mafic magma (2.5–3 wt%) and the low silica content of the magma before eruption helped to significantly delay microlite crystallization and growth, despite the melt’s sub-liquidus, supersaturated state (Arzilli et al., 2019; Figure 10). In addition, the high ascent rate promoted intense volatile exsolution, which drove the whole system’s undercooling degree even higher. The large amount of diffusion-controlled crystal textures such as dendrites, spherulites and plagioclase/pyroxene/oxides intergrowth show that very high degrees of undercooling were at play during the ascent of the CCI magma (Lofgren, 1974; Brugger and Hammer, 2010b; Shea and Hammer, 2013; Marshall et al., 2022). In addition, the square-like shapes of vesicles suggest that this crystallization occurred during ascent simultaneously with bubble growth. Therefore, despite part of the volatile budget probably escaping during ascent, the large undercooling of the magma triggered its intense and very rapid crystallization after reaching a critical point of volatile exsolution during magma decompression (Figure 10). The intense strain rate derived from the important decompression rate could have been a deciding factor in the crystallization onset (Tripoli et al., 2019). This mechanism resulted in a major viscosity jump of several orders of magnitude, as is the case for a magma going from 0 to 10 vol% to almost 80–90 vol% rigid particles within minutes (Costa et al., 2009; Faroughi and Huber, 2015; Moitra et al., 2018; Arzilli et al., 2019), resulting in a sudden resistance to fluid flow and causing the magma to be disrupted into particles (Figure 11). At magma ascent rates on the order of what would be expected for hawaiian eruptions, the crystallization of 80 vol% of the melt within minutes would result in magma fragmenting in the same brittle way as more evolved and more viscous magmas that generate Plinian eruptions (Figure 10).
In the Marapi PDC, the observed extensive microlite crystallization, with microlite shapes being essentially dominated by fast-growth textures (Figure 3), are hard to reconcile with the highly-viscous/silicic melts as diffusivities of species are impeded by viscosity (Mungall, 2002). In addition, the absence of any deformed vesicles or microlites does not support a simultaneous growth of bubbles with microlite crystallization. The low undercooling in the reservoir compared to the CCI is also not sufficient to explain such extensive and fast groundmass crystallization. Therefore, it is likely that the high-crystallization rate of the Marapi PDC matrix occurred post-emplacement, due to high-cooling rates. As a result, fragmentation mechanisms for this eruption would solely be the result of bubble overpressure fostered by high melt viscosity (Figure 10).
Overall, conduit processes played a major role with the intense microlite crystallization in the matrix for the CCI magma (80 vol% microlites on a vesicle-free basis) that changed the rheology of the melt, eventually leading to strain-induced fragmentation. On the other hand, the Marapi PDC and the GKI show classical signs of brittle fragmentation driven mostly by bubble overpressure and/or high-strain rates promoted by the melt viscosity that was already high in the reservoir.
In the case of large caldera-forming eruptions, PDCs form usually by pyroclastic-fountaining, which implies that the mixture of gas and pyroclasts formed after fragmentation is not buoyant enough to rise and form an umbrella plume but instead falls to the ground and flows radially around the vent (Druitt, 1998; Branney and Kokelaar, 2002; Sulpizio et al., 2014; Trolese et al., 2019). Both the GKI and the CCI deposits, as they are large volume ignimbrites, fall in this category (Figure 10). Field and textural observations of these deposits indicate the presence of a large quantity of lithics and enclaves that were entrained during the rise of the magma in the conduit and the emplacement of PDCs. As both these deposits are part of the ultimate sequence of their respective ignimbrites, the emplacement processes could be due to the widening of the conduit because of the caldera collapse, causing the eruptive column to become less-buoyant. Texturally, the fact that these deposits both fall on the lower end of observed vesicularities (45–65 vol%) for Plinian deposits could be an indication of their lower buoyancy and another reason for why they were emplaced as PDCs (Colombier et al., 2017).
The Marapi PDC is of clearly lower volume compared to the CCI and the GKI. However, the generally round aspect of the clasts inside the matrix and the general texture of the pyroclasts (high vesicle number density, highly spherical vesicles) suggest a process that is associated with column collapse rather than a dome or flank collapse (Branney and Kokelaar, 2002). It is worth stressing that the clast chemistry, texture, crystal content and volatile content within this PDC are extremely similar to the very recently emplaced deposits of the 2014 and 2017 phreatomagmatic eruptions (Nurfiani et al., 2021), except for the much more primitive matrix glass in the PDC deposit. Therefore, Marapi is likely capable of producing moderate volume PDCs such as the one investigated if/when a larger volume eruption occurs.
PDCs are the most hazardous volcanic phenomena and can occur in a wide variety of settings and for all magma types. Overall, we have a better understanding of the processes that contribute to the formation of intermediate to silicic PDCs compared to rarer mafic PDCs. As such, we proceeded to a detailed petrological, geochemical and textural analysis of pyroclasts sampled in three PDC deposits similar in aspect but different in bulk rock composition. By using the trachytic Gunungkawi ignimbrite of Batur (Indonesia) and the andesitic PDC deposit from Marapi (Sumatra, Indonesia) as a benchmark, we gained insights into the processes that promoted the formation of the basaltic-andesitic Curacautín ignimbrite of Volcàn Llaima (Chile), which we believe are extendable to other mafic PDCs. We found that the Gunungkawi ignimbrite was likely formed in a classical way for silicic magmas, as fragmentation was driven by a combination of bubble overpressure and fast strain-rates due to the melt’s high viscosity and intense decompression rate. In the case of Marapi’s PDC, we found evidence for a similar bubble overpressure process driving magma fragmentation and an emplacement mechanism probably driven by column collapse. For the Curacautín ignimbrite, we come to a similar conclusion as recent studies on mafic Plinian eruptions (Moitra et al., 2018; Arzilli et al., 2019; Bamber et al., 2020; Valdivia et al., 2021; Marshall et al., 2022). An initial, very low phenocryst-content (<4 vol%), high volatile-content (>2.5 vol% H2O) and low storage temperature for this kind of composition (T = 1,050–1,100°C), would have resulted in delayed crystallization despite the melt being sub-liquidus. In addition, the low viscosity of the magma would have allowed high initial ascent rates (decompression rates at fragmentation on the order of 1 MPa/s) and triggered further undercooling of the melt. This resulted in a very intense and very short crystallization window during the ascent of the magma, generating a viscosity step of several orders of magnitude and promoting strain-induced fragmentation of the magma. The density of clasts and the widening of the conduit due to the caldera collapse were the likely causes of PDC formation instead of a sustained eruptive column.
Overall, we conclude that mafic PDCs can form due to the combination of peculiar storage conditions that lead to important controls from the conduit on the process of fragmentation. Investigating phenocryst contents, pre-eruptive volatile contents and differences between storage temperature and theoretical liquidus temperature seems to be effective to unravel the emplacement of low-silica ignimbrites. On the other hand, the storage conditions and initial ascent rates are much more important than conduit processes, especially decompression-induced crystallization, in controlling the formation of PDCs for more evolved magmas. We believe that some focus must be given to understanding the formation of large undercooled mafic magma reservoirs, as in the case of Llaima it was key for switching from a classical Hawaiian/violent strombolian eruption style to a catastrophic ignimbrite generating eruption.
The original contributions presented in the study are included in the article/Supplementary Material, further inquiries can be directed to the corresponding author.
OB: Conceptualization, Methodology, Investigation, Data curation, Validation, Visualization, Writing–Original draft preparation, Revisions CB: Conceptualization, Resources, Writing reviews and editing, Supervision, Funding acquisition LA: Methodology, Data curation, Validation, Writing reviews and editing KN: Methodology, Data curation, Validation, Writing reviews JO: Methodology, Data curation, Validation, Writing reviews AP: Data sharing, Data curation, Writing reviews AR: Data sharing, Data curation, Writing reviews.
This work was supported by the National Research Foundation Singapore and the Singapore Ministry of Education under the Research Centres of Excellence initiative as well as the National Research Foundation of Singapore, grant NRF-NRFF2016-04.
The authors wish to acknowledge the editorial handling of S. Self and the insightful reviews from K. Nemeth and an reviewer. The authors would also like to thank T. Shea for the very constructive comments on the manuscript. We acknowledge the Facility for Analysis, Characterisation, Testing and Simulation, Nanyang Technological University, Singapore, for use of their electron probe microanalyzer and especially J. S. H. for the help during analysis.
The authors declare that the research was conducted in the absence of any commercial or financial relationships that could be construed as a potential conflict of interest.
All claims expressed in this article are solely those of the authors and do not necessarily represent those of their affiliated organizations, or those of the publisher, the editors and the reviewers. Any product that may be evaluated in this article, or claim that may be made by its manufacturer, is not guaranteed or endorsed by the publisher.
The Supplementary Material for this article can be found online at: https://www.frontiersin.org/articles/10.3389/feart.2022.979210/full#supplementary-material
Adams, N. K., Houghton, B. F., Fagents, S. A., and Hildreth, W. (2006a). The transition from explosive to effusive eruptive regime: The example of the 1912 Novarupta eruption, Alaska. GSA Bulletin. doi:10.1130/B25768.1
Alfano, F., Bonadonna, C., and Gurioli, L. (2012). Insights into eruption dynamics from textural analysis: The case of the May, 2008, Chaitén eruption. Bull. Volcanol. 74, 2095–2108. doi:10.1007/s00445-012-0648-3
Armienti, P. (2008). Decryption of igneous rock textures: Crystal size distribution tools. Rev. Mineral. Geochem. 69, 623–649. doi:10.2138/rmg.2008.69.16
Arzilli, F., Spina, G. L., Burton, M. R., Polacci, M., Gall, N. L., Hartley, M. E., et al. (2019). Magma fragmentation in highly explosive basaltic eruptions induced by rapid crystallization. Nat. Geosci. 12, 1023–1028. doi:10.1038/s41561-019-0468-6
Aubaud, C., Hauri, E. H., and Hirschmann, M. M. (2004). Hydrogen partition coefficients between nominally anhydrous minerals and basaltic melts. Geophys. Res. Lett. 31, L20611. doi:10.1029/2004GL021341
Bacon, C. R., and Druitt, T. H. (1988). Compositional evolution of the zoned calcalkaline magma chamber of Mount Mazama, Crater Lake, Oregon. Contrib. Mineral. Pet. 98, 224–256. doi:10.1007/BF00402114
Bain, A. A., Calder, E. S., Cortés, J. A., Cortés, G. P., and Loughlin, S. C. (2019). Textural and geochemical constraints on andesitic plug emplacement prior to the 2004–2010 vulcanian explosions at Galeras volcano, Colombia. Bull. Volcanol. 81, 1. doi:10.1007/s00445-018-1260-y
Bamber, E. C., Arzilli, F., Polacci, M., Hartley, M. E., Fellowes, J., Di Genova, D., et al. (2020). Pre- and syn-eruptive conditions of a basaltic plinian eruption at masaya volcano, Nicaragua: The masaya triple layer (2.1 ka). J. Volcanol. Geotherm. Res. 392, 106761. doi:10.1016/j.jvolgeores.2019.106761
Bernard, O., and Bouvet de Maisonneuve, C. (2020). Controls on eruption style at Rabaul, Papua New Guinea – insights from microlites, porosity and permeability measurements. J. Volcanol. Geotherm. Res. 406, 107068. doi:10.1016/j.jvolgeores.2020.107068
Bernard, O., Li, W., Costa, F., Saunders, S., Itikarai, I., Sindang, M., et al. (2022). Explosive-effusive-explosive: The role of magma ascent rates and paths in modulating caldera eruptions. Geology. doi:10.1130/G50023.1
Bouvet de Maisonneuve, C., Bachmann, O., and Burgisser, A. (2009). Characterization of juvenile pyroclasts from the Kos Plateau Tuff (Aegean Arc): Insights into the eruptive dynamics of a large rhyolitic eruption. Bull. Volcanol. 71, 643–658. doi:10.1007/s00445-008-0250-x
Bouvet de Maisonneuve, C., Dungan, M. A., Bachmann, O., and Burgisser, A. (2012). Insights into shallow magma storage and crystallization at Volcán Llaima (andean southern volcanic zone, Chile). J. Volcanol. Geotherm. Res. 211–212, 76–91. doi:10.1016/j.jvolgeores.2011.09.010
Bouvet de Maisonneuve, C., Dungan, M. A., Bachmann, O., and Burgisser, A. (2013). Petrological insights into shifts in eruptive styles at Volcán Llaima (Chile). J. Pet. 54, 393–420. doi:10.1093/petrology/egs073
Branney, M. J., and Kokelaar, P. (2002). Pyroclastic density currents and the sedimentation of ignimbrites. Geol. Soc. Lond. Mem. 27.
Brown, S. K., Jenkins, S. F., Sparks, R. S. J., Odbert, H., and Auker, M. R. (2017). Volcanic fatalities database: Analysis of volcanic threat with distance and victim classification. J. Appl. Volcanol. 6, 15. doi:10.1186/s13617-017-0067-4
Brugger, C. R., and Hammer, J. E. (2010a). Crystal size distribution analysis of plagioclase in experimentally decompressed hydrous rhyodacite magma. Earth Planet. Sci. Lett. 300, 246–254. doi:10.1016/j.epsl.2010.09.046
Brugger, C. R., and Hammer, J. E. (2010b). Crystallization kinetics in continuous decompression experiments: Implications for interpreting natural magma ascent processes. J. Pet. 51, 1941–1965. doi:10.1093/petrology/egq044
Calvari, S., Di Traglia, F., Ganci, G., Giudicepietro, F., Macedonio, G., Cappello, A., et al. (2020). Overflows and pyroclastic density currents in march-april 2020 at stromboli volcano detected by remote sensing and seismic monitoring data. Remote Sens. (Basel). 12, 3010. doi:10.3390/rs12183010
Carey, R. J., Houghton, B. F., and Thordarson, T. (2009). Abrupt shifts between wet and dry phases of the 1875 eruption of Askja Volcano: Microscopic evidence for macroscopic dynamics. J. Volcanol. Geotherm. Res. 184, 256–270. doi:10.1016/j.jvolgeores.2009.04.003
Cashman, K. V., and Giordano, G. (2014). Calderas and magma reservoirs. J. Volcanol. Geotherm. Res. 288, 28–45. doi:10.1016/j.jvolgeores.2014.09.007
Cassidy, M., Manga, M., Cashman, K., and Bachmann, O. (2018). Controls on explosive-effusive volcanic eruption styles. Nat. Commun. 9, 2839. doi:10.1038/s41467-018-05293-3
Colombier, M., Wadsworth, F. B., Gurioli, L., Scheu, B., Kueppers, U., Di Muro, A., et al. (2017). The evolution of pore connectivity in volcanic rocks. Earth Planet. Sci. Lett. 462, 99–109. doi:10.1016/j.epsl.2017.01.011
Coltelli, M., Del Carlo, P., and Vezzoli, L. (1998). Discovery of a plinian basaltic eruption of Roman age at etna volcano, Italy. Geology. doi:10.1130/0091-7613(1998)026<1095:DOAPBE>2.3.CO;2
Costa, A., Caricchi, L., and Bagdassarov, N. (2009). A model for the rheology of particle-bearing suspensions and partially molten rocks. Geochem. Geophys. Geosyst. 10, 1–13. doi:10.1029/2008GC002138
Costantini, L., Pioli, L., Bonadonna, C., Clavero, J., and Longchamp, C. (2011). A late holocene explosive mafic eruption of villarrica volcano, southern Andes: The chaimilla deposit. J. Volcanol. Geotherm. Res. 200, 143–158. doi:10.1016/j.jvolgeores.2010.12.010
Costantini, L., Houghton, B. F., and Bonadonna, C. (2010). Constraints on eruption dynamics of basaltic explosive activity derived from chemical and microtextural study: The example of the Fontana Lapilli Plinian eruption, Nicaragua. Journal of Volcanology and Geothermal Research. doi:10.1016/j.jvolgeores.2009.11.008
Degruyter, W., Bachmann, O., and Burgisser, A. (2010). Controls on magma permeability in the volcanic conduit during the climactic phase of the Kos Plateau Tuff eruption (Aegean Arc). Bull. Volcanol. 72, 63–74. doi:10.1007/s00445-009-0302-x
Degruyter, W., Bachmann, O., Burgisser, A., and Manga, M. (2012). The effects of outgassing on the transition between effusive and explosive silicic eruptions. Earth Planet. Sci. Lett. 349350, 161–170. doi:10.1016/j.epsl.2012.06.056–
Dingwell, D. B., 1996. Volcanic dilemma : Flow or blow ? Science 273, 1054–1055. doi:10.1126/science.273.5278.1054
Dingwell, D. B., and Webb, S. L. 1989. Structural relaxation in silicate melts and non-Newtonian melt rheology in geologic processes Physics and Chemistry of Minerals. doi:10.1007/BF00197020
Druitt, T. H. (1998). Pyroclastic density currents. Geol. Soc. Lond. Spec. Publ., 145–182. doi:10.1144/GSL.SP.1996.145.01.08
Edmonds, M., Cashman, K. V., Holness, M., and Jackson, M. (2019). Architecture and dynamics of magma reservoirs. Phil. Trans. R. Soc. A 377, 20180298. doi:10.1098/rsta.2018.0298
Edmonds, M., Kohn, S. C., Hauri, E. H., Humphreys, M. C. S., and Cassidy, M. (2016). Extensive, water-rich magma reservoir beneath southern Montserrat. Lithos 252–253, 216–233. doi:10.1016/j.lithos.2016.02.026
Edmonds, M., and Wallace, P. J. (2017). Volatiles and exsolved vapor in volcanic systems. Elements 13, 29–34. doi:10.2113/gselements.13.1.29
Faroughi, S., and Huber, C. (2015). A generalized equation for rheology of emulsions and suspensions of deformable particles subjected to simple shear at low Reynolds number. Rheol. Acta 54, 85–108. doi:10.1007/s00397-014-0825-8
Gardner, J. E., Thomas, R. M. E., Jaupart, C., and Tait, S. (1996). Fragmentation of magma during Plinian volcanic eruptions. Bull. Volcanol. 58, 144–162. doi:10.1007/s004450050132
Giachetti, T., Burgisser, A., Arbaret, L., Druitt, T. H., and Kelfoun, K. (2011). Quantitative textural analysis of vulcanian pyroclasts (Montserrat) using multi-scale X-ray computed microtomography: Comparison with results from 2D image analysis. Bull. Volcanol. 73, 1295–1309. doi:10.1007/s00445-011-0472-1
Giordano, D., Russell, J. K., and Dingwell, D. B. (2008). Viscosity of magmatic liquids: A model. Earth Planet. Sci. Lett. 271, 123–134. doi:10.1016/j.epsl.2008.03.038
Giordano, G., and Cas, R. A. F. (2021). Classification of ignimbrites and their eruptions. Earth. Sci. Rev. 220, 103697. doi:10.1016/j.earscirev.2021.103697
Gonnermann, H. M. (2015). Magma fragmentation. Annu. Rev. Earth Planet. Sci. 43, 431–458. doi:10.1146/annurev-earth-060614-105206
Gonnermann, H. M., and Manga, M. (2007). The fluid mechanics inside a volcano. Annu. Rev. Fluid Mech. 39, 321–356. doi:10.1146/annurev.fluid.39.050905.110207
Kaminski, É., and Jaupart, C. (1997). Expansion and quenching of vesicular magma fragments in Plinian eruptions. J. Geophys. Res. 102, 12187–12203. doi:10.1029/97JB00622
Ketcham, R. A. (2015). Technical Note: Calculation of stoichiometry from EMP data for apatite and other phases with mixing on monovalent anion sites. Am. Mineral. 100, 1620–1623. doi:10.2138/am-2015-5171
Klug, C., Cashman, K., and Bacon, C. (2002). Structure and physical characteristics of pumice from the climactic eruption of Mount Mazama (Crater Lake), Oregon. Bull. Volcanol. 64, 486–501. doi:10.1007/s00445-002-0230-5
Kohn, S. C., and Grant, K. J. (2006). The partitioning of water between nominally anhydrous minerals and silicate melts. Rev. Mineral. Geochem. 62, 231–241. doi:10.2138/rmg.2006.62.10
Li, W., and Costa, F. (2020). A thermodynamic model for F-Cl-OH partitioning between silicate melts and apatite including non-ideal mixing with application to constraining melt volatile budgets. Geochim. Cosmochim. Acta 269, 203–222. doi:10.1016/j.gca.2019.10.035
Lofgren, G. (1974). An experimental study of plagioclase crystal morphology: Isothermal crystallization. Am. J. Sci. 274, 243–273. doi:10.2475/ajs.274.3.243
Lube, G., Breard, E. C. P., Esposti-Ongaro, T., Dufek, J., and Brand, B. (2020). Multiphase flow behaviour and hazard prediction of pyroclastic density currents. Nat. Rev. Earth Environ. 1, 348–365. doi:10.1038/s43017-020-0064-8
Mallmann, G., and O’Neill, H. St.C. (2013). Calibration of an empirical thermometer and oxybarometer based on the partitioning of Sc, Y and V between olivine and silicate melt. J. Pet. 54, 933–949. doi:10.1093/petrology/egt001
Marinelli, G., and Tazieff, H. (1968). L’Ignimbrite et la Caldera de Batur (Bali, Indonesie). Bull. Volcanol. 32, 89–120. doi:10.1007/BF02596587
Marshall, A. A., Brand, B. D., Martínez, V., Bowers, J. M., Walker, M., Wanless, V. D., et al. (2022). The mafic Curacautín ignimbrite of Llaima volcano, Chile. J. Volcanol. Geotherm. Res. 421, 107418. doi:10.1016/j.jvolgeores.2021.107418
Martel, C., and Poussineau, S. (2007). Diversity of eruptive styles inferred from the microlites of Mt Pelée andesite (Martinique, Lesser Antilles). J. Volcanol. Geotherm. Res. 166, 233–254. doi:10.1016/j.jvolgeores.2007.08.003
Miyabuchi, Y., Watanabe, K., and Egawa, Y. (2006). Bomb-rich basaltic pyroclastic flow deposit from Nakadake, Aso Volcano, southwestern Japan. J. Volcanol. Geotherm. Res. 155, 90–103. doi:10.1016/j.jvolgeores.2006.02.007
Moitra, P., Gonnermann, H. M., Houghton, B. F., and Tiwary, C. S. (2018). Fragmentation and Plinian eruption of crystallizing basaltic magma. Earth Planet. Sci. Lett. 500, 97–104. doi:10.1016/j.epsl.2018.08.003
Mungall, J. E. (2002). Empirical models relating viscosity and tracer diffusion in magmatic silicate melts. Geochim. Cosmochim. Acta 66, 125–143. doi:10.1016/S0016-7037(01)00736-0
Naismith, A., Armijos, M. T., Escobar, E. A. B., Chigna, W., and Watson, I. M. (2020). Fireside tales: Understanding experiences of previous eruptions among other factors that influence the decision to evacuate from eruptive activity of Volcán de Fuego. Volcanica 3, 205–226. doi:10.30909/vol.03.02.205226
Nakamura, K. (2006). Textures of plagioclase microlite and vesicles within volcanic products of the 1914-1915 eruption of Sakurajima Volcano, Kyushu, Japan. J. Mineralogical Petrological Sci. 101, 178–198. doi:10.2465/jmps.101.178
Namiki, A., and Manga, M. (2008). Transition between fragmentation and permeable outgassing of low viscosity magmas. J. Volcanol. Geotherm. Res. 169, 48–60. doi:10.1016/j.jvolgeores.2007.07.020
Namiki, A., Patrick, M. R., Manga, M., and Houghton, B. F. (2021). Brittle fragmentation by rapid gas separation in a Hawaiian fountain. Nat. Geosci. 14, 242–247. doi:10.1038/s41561-021-00709-0
Naranjo, J., and Moreno, H. (1991). Actividad explosive postglacial en el Volcán Llaima, Andes del Sur (38°45′S). Rev. Geol. Chile 18. doi:10.5027/andgeoV18n1-a06
Naranjo, J., and Moreno, H., 2005. Geología del Volcán Llaima, Región de la Araucanía. Serv. Nac. Geol. Min. Carta Geológica Chile Santiago Chile.
Neri, A., Esposti Ongaro, T., de’ Michieli Vitturi, M., and Cerminara, M. (2022). Multiphase flow modeling of explosive volcanic eruptions. Transp. Phenom. Multiph. Syst., 243–281. doi:10.1007/978-3-030-68578-2_10
Nurfiani, D., Wang, X., Gunawan, H., Triastuty, H., Hidayat, D., Wei, S. J., et al. (2021). Combining petrology and seismology to unravel the plumbing system of a typical arc volcano: An example from Marapi, West Sumatra, Indonesia. Geochem. Geophys. Geosyst. 22. doi:10.1029/2020GC009524
Papale, P., and Dobran, F. (1993). Modeling of the ascent of magma during the plinian eruption of Vesuvius in A.D. 79. J. Volcanol. Geotherm. Res. 58, 101–132. doi:10.1016/0377-0273(93)90104-Y
Papale, P., Moretti, R., and Barbato, D. (2006). The compositional dependence of the saturation surface of H2O+CO2 fluids in silicate melts. Chem. Geol. 229, 78–95. doi:10.1016/j.chemgeo.2006.01.013
Papale, P., Neri, A., and Macedonio, G. (1998). The role of magma composition and water content in explosive eruptions: 1. Conduit ascent dynamics. J. Volcanol. Geotherm. Res. 87, 75–93. doi:10.1016/S0377-0273(98)00101-2
Papale, P., and Polacci, M. (1999). Role of carbon dioxide in the dynamics of magma ascent in explosive eruptions. Bull. Volcanol. 60, 583–594. doi:10.1007/s004450050253
Polacci, M., Pioli, L., and Rosi, M. (2003). The Plinian phase of the Campanian Ignimbrite eruption (phlegrean fields, Italy): Evidence from density measurements and textural characterization of pumice. Bull. Volcanol. 65, 418–432. doi:10.1007/s00445-002-0268-4
Preece, K., Gertisser, R., Barclay, J., Charbonnier, S. J., Komorowski, J. C., and Herd, R. A. (2016). Transitions between explosive and effusive phases during the cataclysmic 2010 eruption of Merapi volcano, Java, Indonesia. Bull. Volcanol. 78, 54. doi:10.1007/s00445-016-1046-z
Putirka, K. D., Perfit, M., Ryerson, F. J., and Jackson, M. G. (2007). Ambient and excess mantle temperatures, olivine thermometry, and active vs. passive upwelling. Chem. Geol. 241, 177–206. doi:10.1016/j.chemgeo.2007.01.014
Putirka, K. D. (2008). Thermometers and barometers for volcanic systems. Rev. Mineral. Geochem. 69, 61–120. doi:10.2138/rmg.2008.69.3
Reubi, O., and Nicholls, I. A. (2004a). Magmatic evolution at Batur volcanic field, Bali, Indonesia: Petrological evidence for polybaric fractional crystallization and implications for caldera-forming eruptions. J. Volcanol. Geotherm. Res. 138, 345–369. doi:10.1016/j.jvolgeores.2004.07.009
Reubi, O., and Nicholls, I. A. (2005). Structure and dynamics of a silicic magmatic system Associated with caldera-forming eruptions at Batur volcanic field, Bali, Indonesia. J. Pet. 46, 1367–1391. doi:10.1093/petrology/egi019
Reubi, O., and Nicholls, I. A. (2004b). Variability in eruptive dynamics associated with caldera collapse: An example from two successive eruptions at Batur volcanic field, Bali, Indonesia. Bull. Volcanol. 66, 134–148. doi:10.1007/s00445-003-0298-6
Riker, J., Humphreys, M. C. S., Brooker, R. A., and De Hoog, J. C. (2018). First measurements of OH-C exchange and temperature-dependent partitioning of OH and halogens in the system apatite–silicate melt. Am. Mineral. 103, 260–270. doi:10.2138/am-2018-6187CCBY
Robin, C., Eissen, J.-P., and Monzier, M. (1994). Ignimbrites of basaltic andesite and andesite compositions from tanna, New hebrides arc. Bull. Volcanol. 56, 10–22. doi:10.1007/BF00279725
Robin, C., Eissen, J.-P., and Monzier, M. (1995). Mafic pyroclastic flows at santa maria (gaua) volcano, Vanuatu: The caldera formation problem in mainly mafic island arc volcanoes. Terra nova. 7, 436–443. doi:10.1111/j.1365-3121.1995.tb00539.x
Romano, C., Vona, A., Campagnola, S., Giordano, G., Arienzo, I., and Isaia, R. (2020). Modelling and physico-chemical constraints to the 4.5 ka agnano-monte Spina plinian eruption (campi Flegrei, Italy). Chem. Geol. 532, 119301. doi:10.1016/j.chemgeo.2019.119301
Rosi, M., Landi, P., Polacci, M., Muro, A. D., and Zandomeneghi, D. (2004). Role of conduit shear on ascent of the crystal-rich magma feeding the 800-year-b.p. Plinian eruption of Quilotoa Volcano (Ecuador). Bull. Volcanol. 66, 307–321. doi:10.1007/s00445-003-0312-z
Rust, A., and Cashman, K. V. (2011). Permeability controls on expansion and size distribution of pyroclasts. Solid Earth. doi:10.1029/2011JB008494
Ruth, D. C. S., Cottrel, E., Cortés, J. A., Kelley, K. A., and Calder, E. S. (2016). From passive degassing to violent strombolian eruption: The case of the 2008 eruption of Llaima volcano, Chile. J. Pet. doi:10.1093/petrology/egw063
Sable, J. E., Houghton, B. F., Del Carlo, P., and Coltelli, M. (2006). Changing conditions of magma ascent and fragmentation during the Etna 122BC basaltic plinian eruption: Evidence from clasts microtextures. Journal of Volcanology and Geothermal Research. doi:10.1016/j.jvolgeores.2006.07.006
Sahagian, D. L., and Proussevitch, A. A. (1998). 3D particle size distributions from 2D observations: Stereology for natural applications. J. Volcanol. Geotherm. Res. 84, 173–196. doi:10.1016/S0377-0273(98)00043-2
Schonwalder-Angel, D., Cortés, J. A., and Calder, E. S. (2018). The interplay of magmatism and tectonics: An example based on the satellite scoria cones at Llaima volcano, Chile. J. Volcanol. Geotherm. Res. 15.
Shea, T. (2017). Bubble nucleation in magmas: A dominantly heterogeneous process? J. Volcanol. Geotherm. Res. 343, 155–170. doi:10.1016/j.jvolgeores.2017.06.025
Shea, T., and Hammer, J. E. (2013). Kinetics of cooling- and decompression-induced crystallization in hydrous mafic-intermediate magmas. J. Volcanol. Geotherm. Res. 260, 127–145. doi:10.1016/j.jvolgeores.2013.04.018
Shea, T., Houghton, B. F., Gurioli, L., Cashman, K. V., Hammer, J. E., and Hobden, B. J. (2010). Textural studies of vesicles in volcanic rocks: An integrated methodology. J. Volcanol. Geotherm. Res. 190, 271–289. doi:10.1016/j.jvolgeores.2009.12.003
Silva Parejas, C., Druitt, T. H., Robin, C., Moreno, H., and Naranjo, J.-A. (2010). The holocene pucón eruption of Volcán villarrica, Chile: Deposit architecture and eruption chronology. Bull. Volcanol. 72, 677–692. doi:10.1007/s00445-010-0348-9
Smith, R. L. (1979). “Ash-flow magmatism,” in Ash-flow tuffs. Editors Chapin, C. E. doi:10.1130/SPE180-p5
Sulpizio, R., Dellino, P., Doronzo, D. M., and Sarocchi, D. (2014). Pyroclastic density currents: State of the art and perspectives. J. Volcanol. Geotherm. Res. 283, 36–65. doi:10.1016/j.jvolgeores.2014.06.014
Sutawidjaja, I. S. (2009). Ignimbrite analyses of Batur caldera, Bali, based on 14C dating. J. Geol. Indones. 4, 189–202. doi:10.17014/ijog.vol4no3.20094
Toramaru, A. (2006). BND (bubble number density) decompression rate meter for explosive volcanic eruptions. J. Volcanol. Geotherm. Res. 154, 303–316. doi:10.1016/j.jvolgeores.2006.03.027
Toramaru, A. (1990). Measurement of bubble size distributions in vesiculated rocks with implications for quantitative estimation of eruptive processes. Journal of Volcanology and Geothermal Research. doi:10.1016/0377-0273(90)90045-H
Tripoli, B., Manga, M., Mayeux, J., and Barnard, H. (2019). The effects of deformation on the early crystallization kinetics of basaltic magmas. Front. Earth Sci. 7. doi:10.3389/feart.2019.00250
Trolese, M., Cerminara, M., Esposti Ongaro, T., and Giordano, G. (2019). The footprint of column collapse regimes on pyroclastic flow temperatures and plume heights. Nat. Commun. 10, 2476. doi:10.1038/s41467-019-10337-3
Valdivia, P., Marshall, A. A., Brand, B. D., Manga, M., and Huber, C. (2021). Mafic explosive volcanism at Llaima volcano: 3D x-ray microtomography reconstruction of pyroclasts to constrain shallow conduit processes. Bull. Volcanol. 84, 2. doi:10.1007/s00445-021-01514-8
Vinkler, A. P., Cashman, K., Giordano, G., and Groppelli, G. (2012). Evolution of the mafic Villa Senni caldera-forming eruption at Colli Albani volcano, Italy, indicated by textural analysis of juvenile fragments. J. Volcanol. Geotherm. Res. 235236, 37–54. doi:10.1016/j.jvolgeores.2012.03.006–
Keywords: pyroclastic density currents, fragmentation, mafic ignimbrite, petrology, textural analyses, geothermobarometry, syn-eruption processes, magma decompression rates
Citation: Bernard O, Bouvet de Maisonneuve C, Arbaret L, Nagashima K, Oalmann J, Prabowo A and Ratdomopurbo A (2022) Varying processes, similar results: How composition influences fragmentation and subsequent feeding of large pyroclastic density currents. Front. Earth Sci. 10:979210. doi: 10.3389/feart.2022.979210
Received: 27 June 2022; Accepted: 22 August 2022;
Published: 14 September 2022.
Edited by:
Stephen Self, University of California, Berkeley, United StatesReviewed by:
Karoly Nemeth, Massey University, New ZealandCopyright © 2022 Bernard, Bouvet de Maisonneuve, Arbaret, Nagashima, Oalmann, Prabowo and Ratdomopurbo. This is an open-access article distributed under the terms of the Creative Commons Attribution License (CC BY). The use, distribution or reproduction in other forums is permitted, provided the original author(s) and the copyright owner(s) are credited and that the original publication in this journal is cited, in accordance with accepted academic practice. No use, distribution or reproduction is permitted which does not comply with these terms.
*Correspondence: Olivier Bernard, b2Jlcm5hcmRAaXBncC5mcg==
Disclaimer: All claims expressed in this article are solely those of the authors and do not necessarily represent those of their affiliated organizations, or those of the publisher, the editors and the reviewers. Any product that may be evaluated in this article or claim that may be made by its manufacturer is not guaranteed or endorsed by the publisher.
Research integrity at Frontiers
Learn more about the work of our research integrity team to safeguard the quality of each article we publish.