 Yongli Zhang
 Hongchao Zuo
 Xiaoqing Gao
 Guangzhou Fan
 Shihua Lv
 Wei Hua
 Longxiang Dong
95% of researchers rate our articles as excellent or good
Learn more about the work of our research integrity team to safeguard the quality of each article we publish.
Find out more
ORIGINAL RESEARCH article
Front. Earth Sci. , 30 September 2022
Sec. Atmospheric Science
Volume 10 - 2022 | https://doi.org/10.3389/feart.2022.978995
This article is part of the Research Topic AI-Based Prediction of High-Impact Weather and Climate Extremes under Global Warming: A Perspective from The Large-Scale Circulations and Teleconnections View all 21 articles
During the winter half-year (previous October–April), the mid-latitude westerlies flows around the Tibetan Plateau (TP) and generate a dynamic low-pressure trough on its south side and a high-pressure ridge on its north side. In this study, we define the vorticity perturbation as the difference between local vorticity and the meridionally-averaged vorticity. Then, the difference of averaged vorticity perturbation at 600 hPa in the two key areas where the trough and ridge are located is used to represent the intensity of the flows around the Tibetan Plateau (FAT). The evolution characteristics of FAT in the winter half-year, as well as in autumn, winter and spring, are analyzed. Moreover, under global warming, in winter the relationship of FAT to the precipitation and temperature in China are discussed. The results show that FAT steadily exists on both sides of TP during the winter half-year. With the north-south migration of the mid-latitude westerlies, the FAT gradually strengthens in autumn, with the strongest intensity and the widest range in winter, and begins to weaken in spring. The intensity of FAT (IFAT) has a decreasing trend and a quasi-4a period variation on the interannual scale in all the time, both of which are closely related to the mid-latitude westerlies upstream of TP. Represented by the winter when IFAT is strongest, the IFAT is significantly correlated to the change of precipitation and temperature in most parts of China under global warming, especially in the convergence area over central-eastern China. There is also a significant correlation between IFAT and the precipitation and temperature anomalies in Northwest China, TP, and Northeast China. This relationship between the FAT anomaly and the climate anomaly in China in winter can be well explained by analyzing the anomalies of large-scale circulation, outgoing longwave radiation and water vapor flux divergence. The FAT anomaly maybe one of the reasons for the climate extreme events in China in winter.
The Tibetan Plateau (TP), known as “the roof of the world” and “the third pole of the Earth”, has an average altitude of more than 4 km. It is a huge barrier standing in the atmospheric circulation (Gu, 1951). In the winter half-year, when the strong mid-latitude westerlies approach the TP, they branch in the southwest of the TP (32°N, 75°E) (Li et al., 2012). The circulations at the southern and northern parts of the TP are cyclonic and anticyclonic in the downstream of TP branch point (Yeh, 1950; Ramaswamy, 1956; Wu et al., 2007), respectively, corresponding to the steady positive and negative vorticity zones (Murakami, 1981). The northern branch westerlies guides the strong cold air from the polar region to the south. The southern branch westerlies transport a large amount of warm-humid air to the south of China (Li and Luo, 1986;Liang et al., 2005; Zhang et al., 2014;Zhang et al., 2018). The cold and warm airflows converge to the east of TP and form a strong East Asian jet (Bolin, 1950; Gu, 1951; Wu et al., 2015), which has an important impact on the downstream weather and climate (Yang, 1960; Zhu and Yang, 1990; Fan et al., 2015; Li et al., 2021). Such flows around TP (FAT) mainly occur in the middle and lower troposphere, and can also reach above the tropopause sometimes (Yeh and Gu, 1955; Wang and Wang, 1985).
Wu et al. (2007) named the cyclonic circulation on the south side and anticyclonic circulation on the north side of TP as TP “dipole” (TPD) circulation figuratively. They used the divergence difference between the east and west sides of TP to evaluate the dynamic effect of TP, which can affect the drought in India, the early spring rain in South China, and the onset time of Asian summer monsoon in the Bay of Bengal. Using the mean vorticity difference between the positive and negative vortex pairs on the east side of TP, (Jiang et al., 2009),defined the FAT index and concluded that strong FAT index is conducive to the transportation of cold air in the middle-high latitudes to North China, and thus more precipitation can occur in the Yangtze-Huaihe region. When using the zero line of meridional wind speed to discuss the seasonal variation of FAT, Li and Zhang (2012) found that the winter precipitation mainly occurs in the convergence area of FAT in Eastern China, where the southerly prevails in the south of the zero line. Qiao et al. (2014) found that the intensity of FAT varies with height and season. It mainly occurs in the middle and lower troposphere, and its dynamic effect is stronger in winter and spring. Jiang et al. (2021) defined the southern and northern branches of FAT by using the averaged wind speed in the four regions of FAT, and discussed their impacts on the weather and climate in China separately. Moreover, the “north ridge and south trough” circulation is the main weather pattern causing the snow disasters in the eastern pastoral areas of TP in winter and the freezing rain and snow disasters in South China (Liang et al., 2002; Wang et al., 2011).
Under the background of global warming, there is still a lack of systematic analysis on the interannual variation and seasonal evolution of the FAT in the winter half-year. There are few studies on its relationship with precipitation and temperature anomalies in China in winter, and there are also few studies on its possible impacts on the high impact weather and extreme events in China. Therefore, in this study the northern branch ridge (NBR) and the southern branch trough (SBT) are used to represent the FAT visually. Then, the intra-seasonal and interannual evolution characteristics of FAT in the winter half-year are analyzed. Furthermore, the relationships of FAT to the precipitation and temperature in China in winter are investigated. Finally, the possible reasons for this relationship are explored by analyzing the anomalies of the atmospheric circulation and physical quantities at different levels. This study has important implications for understanding the TP dynamic effect on high-impact weather and climate extreme events in China and could favor the short-term climate prediction.
The European Centre for Medium-Range Weather Forecasts reanalysis data set (ERA-interim) with a spatial resolution of 1° × 1° is used in this study, including the monthly mean sea level pressure, geopotential height, horizontal meridional wind and zonal wind, and the 6 h interval horizontal meridional wind and zonal wind (Dee et al., 2011; Bao and Zhang, 2013). The 2.5° × 2.5° monthly average outgoing longwave radiation (OLR) data observed by the United States (US) polar-orbiting operational meteorological satellite is used. Besides, the high-resolution 1°×1°grid data from the Climatic Research Unit of the United Kingdom (United Kingdom) is also used (Wen et al., 2006). All the data are from 1979 to 2019, totaling 41 years. The winter half-year is from previous October to current April. autumn, winter, and spring are represented by October, January, and April in this study. The situations in these months are similar to the seasonal average. The rest months are the transition period of seasons.
To obtain FAT more clearly in the flow and vorticity field in the Northeast hemisphere, the article uses the zonal deviation algorithm same as the paper (Wu et al., 2007). Use
The linear tendency estimation, empirical orthogonal function (EOF) analysis, wavelet analysis, correlation analysis, and composite analysis are adopted in this study (Torrence and compo, 1998).
Based on the conservation law of energy and angular momentum of large-scale motion, Wu (1984) proposed a theoretical terrain critical height (Hc), that is, when the mountain height is higher than this value, the air will flows around rather than over the mountain. He showed that the Hc value is only a few hundred meters to 1 km. Trenberth and Chen (1988) thought the value is 1.5 km. Through numerical simulations, Zhang and Qian (1999) showed that the value of Hc is between 1.5 and 2 km. Li and Zhang (2012) concluded a simulation result of 2 km. The annual mean intensities of flows around and over the TP all increase with increasing altitude, the flows around prevails in terms of the regional distribution (Li et al., 2012).
Comparing the zonal deviation flow and vorticity fields at 850 hPa, 700 hPa, 600 hPa and 500 hPa averaged in the winter half-year of the northeast hemisphere, we find that the absolute values of the zonal deviation flow and vorticity at 600 hPa are the strongest, which can be considered that the FAT is the most significant at 600 hPa in the winter half-year.
Figure 1 shows the zonal deviation flow and vorticity field at 600 hPa averaged in the winter half-year, autumn, winter and spring. In the winter half-year (Figure 1A), the deviation flow field in middle and high latitudes in Eurasia is characterized by “two troughs and two ridges”. The ridge in Western Europe and the trough in Eastern Europe are weak. The ridge in northern TP and the East Asian trough are both strong, which can be seen from the obvious anticyclonic circulation and negative vorticity center in the north of TP, and the cyclonic deviation circulation and positive vorticity centers along the coast of East Asia. There are cyclonic circulation and positive vorticity center on the south side of TP in mid-low latitudes and strong anticyclone circulation in the northwest Pacific. It indicates that there is a significant FAT phenomenon. On the west side of TP, the airflow diverges and flows around TP, and then two air flows converge on the east side of TP, forming an anticyclone deviation circulation on the north side of TP and a cyclone deviation circulation on the south side of TP. These appear as an asymmetric TPD circulation on the north and south sides of TP (Wu et al., 2007), accompanied by constant negative and positive vorticity bands (Murakami, 1981), respectively. The circulation in the northeast hemisphere in autumn is similar to that in the winter half-year (Figure 1B). The deviation circulation and vorticity field are weak, indicating that the long-wave trough and ridge are weak. This means it is in the transition period from the summer circulation pattern to the winter circulation pattern. The TPD is also weak by this time, and the position of the western Pacific subtropical high is farther north. With the southward movement of the westerlies, the deviation circulation characterized by “two troughs and one ridge” in middle-high latitudes reaches the strongest in winter (Figure 1C). The East Asian trough, the deviation circulation center and vorticity center of TDP also reach the strongest. The center of the cyclonic circulation on the south side of TP moves eastward, while the western Pacific subtropical high is the weakest and farther south. In spring (Figure 1D), the long-wave trough and ridge in the middle-high latitudes weaken and begin to adjust to the summer circulation pattern gradually. The deviation circulation and vorticity of the TPD are also weakened. Weak cyclonic circulation appears in the southwest of India and the south of the South China Sea, indicating that the cross-equatorial southerly in the low latitudes begin to increase, which is conducive to the outbreak of the Asian summer monsoon (Wu and Zhang, 1998).
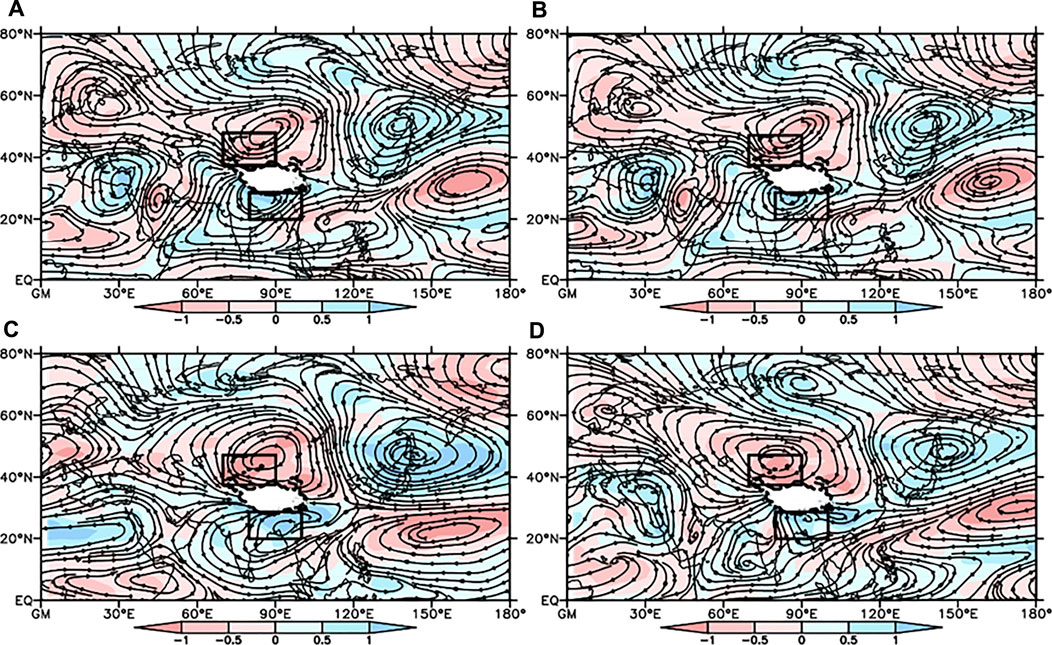
FIGURE 1. The mean zonal deviation circulation (unit: m s−1; contours) and vorticity (unit: 10−5s−1; shaded) field in (A) winter half-year, (B) autumn, (C) winter, (D) spring at 600 hPa. The boxes to the north and south of the TP represent the average positions of northern branch ridge and southern branch trough, respectively.
It can be further seen from Figure 1 that there is a pair of cyclonic and anticyclonic zonal deviation circulations in the north (35–45°N, 70–90°E) and south (20–28°N, 80–100°E) sides of TP at each period in winter half-year at 600 hPa, respectively corresponding to strong positive and negative zonal deviation vorticity centers. These two regions can be considered as the key regions of FAT activity. The intensity indexes of SBT (ISBT) and NBR (INBR) can be expressed by the average zonal deviation vorticity in the northern and southern regions, and the calculation method of these are formula 2 and 3, respectively. The difference between ISBT and INBR can be used as the intensity index of FAT (IFAT) to represent FAT visually. It is shown in formula 4.
The correlation coefficients between IFAT and the TPO index that uses divergence difference between the east and west sides of TP (Wu et al., 2007), the FAT index defined by (Jiang et al., 2009)that uses the average vorticity difference of positive and negative vortex pairs on the east side of TP, and the meridional wind divergence line used by Li and Zhang (2012) are 0.89, 0.87 and 0.78, respectively. All the correlations have passed the confidence test at 0.001 confidence level.
In order to understand the vertical structure of FAT, the vertical profiles of zonal circulation and vorticity averaged in the main longitude of FAT (80–90°E) in the winter half-year, autumn, winter, and spring are shown in Figure 2. In the winter half-year (Figure 2A), the updraft near the equator is strong and deflects northward at 200 hPa. The updraft at 60°N is weaker than that at the equator and deflects southward at 300 hPa. The two airflows converge and descend at 30°N. The intensity difference between the two updrafts indicates that the Hadley circulation in the low latitudes to the south of TP is stronger than the Ferrel circulation in the middle latitudes to the north of TP. The negative vorticity to the south of 25°N is the strongest near 200 hPa, indicating that the South Asian high in the upper level to the south of TP is strong. There is a positive center and a negative vorticity center between 24 and 45°N on the south and north sides of TP, respectively. The positive vorticity extends upward from the ground to the tropopause, and the negative vorticity from the ground to 300 hPa. Both of them reach the strongest near 600 hPa. This indicates that FAT is the strongest at 600 hPa on the north and south sides of TP, as indicated by the vorticity of each level in all periods. There is still a negative vorticity zone to the north of 45°N, corresponding to the high-pressure area around Lake Baikal (Chen et al., 2013). The center of the upper westerly jet with zonal wind speed greater than 40 m s−1 is located at the intersection of two circulations of 200 hPa above 28°N, and also at the zero vorticity line in the upper levels.
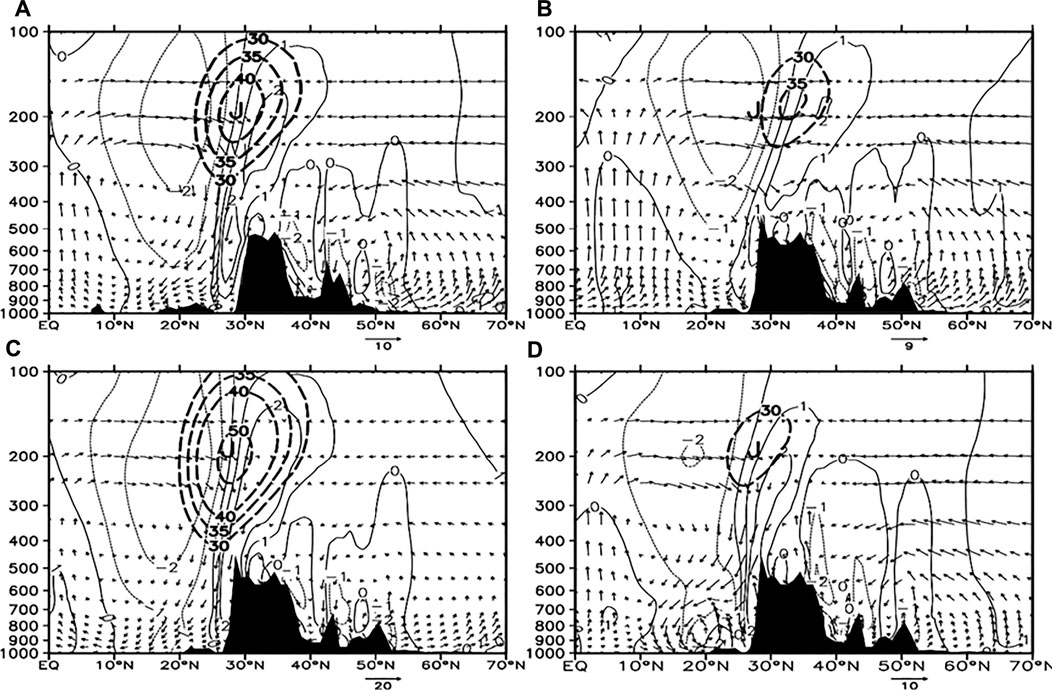
FIGURE 2. Latitude-altitude cross-sections of meridional (unit: m s−1; vector) circulation, vorticity (unit: 10−5s−1; contour) and upper-level jet (u≥30 m s−1; long dashed) averaged in 80–90°E in (A) winter half-year, (B) autumn, (C) winter, (D) spring. (J) the jet center; shadow: the topography.
In autumn (Figure 2B), both the Hadley circulation and the Ferrel circulation are northward. The low latitude strong ascending is accompanied by obvious positive vorticity at 10°N, indicating that the Intertropical Convergence Zone (ITCZ) is stronger and farther north. The South Asian high is also farther north. There are respectively weak positive and negative vorticity centers on the south and north sides of TP, which reach the strongest at 500–600 hPa and have obvious ascending and descending motions. These centers correspond to the SBT and NBR formed by FAT on the south and north sides of TP. The upper-level westerly jet moves northward to about 35°N over the TP, with weak intensity.
The Hadley circulation and the Ferrel circulation move southward in winter (Figure 2C), when their intensity and range reach the maximum. The descending branches of both circulations are enhanced by the descending motion of the TP cold high, resulting in the strongest downdraft over TP (Lu et al., 2007). The ITCZ at low latitudes moves back to the equator, making the positive vorticity near the equator extends from the surface to 200 hPa. The negative vorticity in middle-low latitudes appears from bottom to top in the troposphere, and thus the cold high is a deep high-pressure system. The positive and negative vorticity on the south and north sides of TP increases. Especially, the positive vorticity reaches the strongest and largest in winter, indicating that the SBT reaches the strongest and largest in winter, and extends upward over the TP (Suo and Ding 2009). The westerly jet with wind speed greater than 50 m s−1, which is still centered at 200 hPa, also moves southward and reaches the strongest in winter.
In spring (Figure 2D), both the Hadley circulation and the Ferrel circulation weaken, and the anti-Hadley circulation becomes obvious on the south side of TP, that is, the “pre monsoon circulation” (Luo et al., 1984). The ITCZ and the deep subtropical high move slightly northward. The positive and negative vorticity on the south and north sides of TP is still strong. Especially, the negative vorticity reaches the strongest, indicating that the NBR is the strongest in spring, and so is FAT. But, obvious ascending motion occurs at both sides of TP. It is possibly because the TP starts to change from a cold source to a heat source, which strengthens the ascending motion and weakens the descending branch of Hadley circulation (Freitas, et al., 2017). The South Asian high in the upper level is weakened. The westerly jet is also weakened to 30 m s−1, and moves slowly northward.
From the analysis of the above vertical circulation structure characteristics, it can be concluded that the FAT exists in each time periods. In the winter half-year, the intensity of FAT is stronger, the Hadley and Ferrel circulations are stronger, and the upper westerly jet is stronger. In autumn, the FAT is weak, the Hadley and Ferrel circulations are weak, including the upper westerly jet. It is noted that not only the FAT is the strongest in winter, but also the Hadley and Ferrel circulations are also the strongest, and even the upper westerly jet is the strongest, but its location is northerly. Finally, the FAT weakened in spring, and the upper westerly jet is the weakest.
Figure 3 shows the spatial distribution of the first eigenvector of the zonal deviation vorticity obtained by EOF decomposition in the main area of FAT in recent 40 years. In the winter half-year (Figure 3A), there is mainly negative zonal deviation vorticity around the TP and weak positive zonal deviation vorticity away from the TP. It indicates that the NBR is enhanced from north to south, and the SBT weakens from south to north. There is an overall weakening trend of FAT. In autumn (Figure 3B), zonal deviation vorticity is positive in the NBR area and negative in the SBT area, indicating both NBR and SBT are weakened. Meanwhile, there is a consistent weakening trend of FAT from north to south. Weak negative zonal deviation vorticity in the NBR area in winter indicates the enhanced NBR (Figure 3C). The obvious positive zonal deviation vorticity on the south side of TP shows the enhancement of SBT from south to north. FAT in winter is continuously enhanced from south to north. Zonal deviation vorticity in the NBR area is consistently positive and decreases from west to east in spring (Figure 3D). On the other hand, there is large positive zonal deviation vorticity on the south side of TP and negative vorticity in low latitudes, which means SBT enhances from south to north. The FAT shows a weakening trend as a whole. Therefore, the NBR tends to weaken in all periods, while the SBT weakens from south to north in the winter half-year and autumn, but enhances from south to north in winter and spring. The spatial variation trends of FAT and SBT are almost the same.
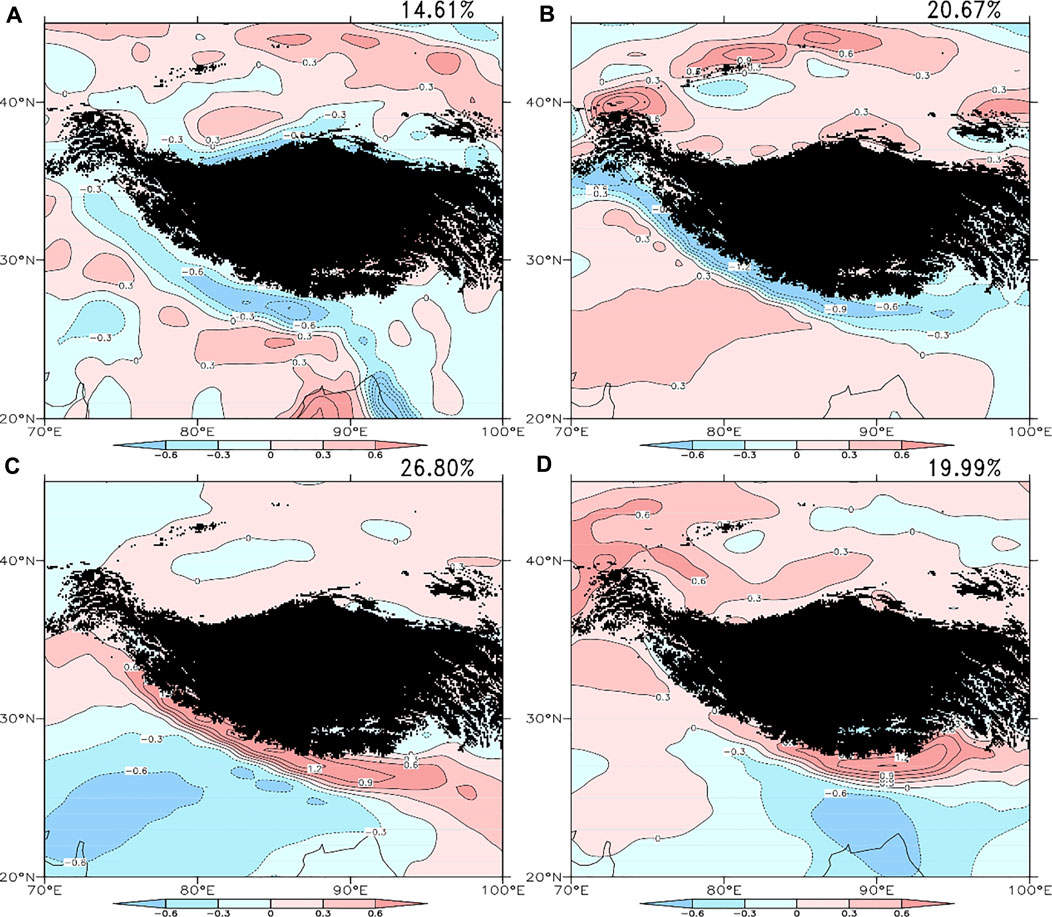
FIGURE 3. Spatial distributions of the first eigenvector of the mean zonal deviation vorticity obtained by the decomposition of the empirical orthogonal function in (A) winter half-year, (B) autumn, (C) winter, (D) spring. The number in the upper right represents the variance contribution of the first eigenvector. Shadow: the topography.
It can be seen from the pentad evolutions of the vorticity in 70–100°E at 600 hPa (Figure 4A) that, the ITCZ maintains near the equator from January to April, then moves northward substantially in May, reaches 20°N in July, begins to move southward in September gradually, and stabilizes near the equator at the end of October. The subtropical high stabilizes in 8–23°N from January to April. In the first 10 days of May, with the onset of the Asian monsoon in the Bay of Bengal (He and McGinnisSong., 1987; Wu and Zhang, 1998), and the enhancement of the thermal effect of TP, the subtropical high begins to weaken and contract northward (Yanai et al., 1992). In summer, due to the obvious thermal effect of TP, the subtropical high weakens and breaks into pieces over the TP, and moves northward to around 28°N. In autumn, the subtropical high slowly intensifies and expands, and moves back to low latitudes gradually. The SBT between 24°N and 28°N is stronger from January to April, and then weakens with the weakening and northward moving of the westerlies. From June to early September, affected by a weak subtropical high, the SBT moves southward with the westerlies. The SBT reappears in mid-September and gradually intensifies, reaching the strongest from previous November to April. The NBR exists all year round at 35–45°N. With the migration of the westerlies, it is stronger in the winter half-year and weaker from May to August. With the north-south shift of ITCZ, subtropical high and westerlies, as well as the conversion of TP between cold and heat sources, the seasonal variation of FAT is obvious, and it is stronger from November to the next April.
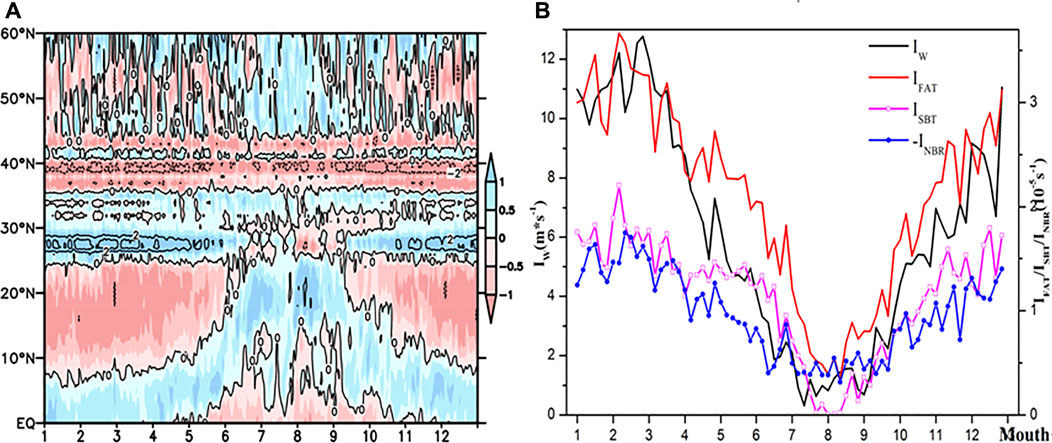
FIGURE 4. The pentad evolution of climatic mean of (A) vorticity (unit: 10−5s-1) in 70–100°E at 600 hPa and (B) IW (unit: m s-1), IFAT (unit: 10−5s-1), ISBT (unit: 10−5s-1) and INBR (unit: 10−5s-1).
The FAT, NBR and SBT are formed when the subtropical westerlies pass through the TP in the winter half-year. In this study, the average zonal wind speed in the upstream of TP at the mid-latitudes (20–45°N, 55–70°E) is selected to represent the index of westerlies intensity (IW) upstream of TP, and the relationships between the westerlies and the intensities of FAT, NBR and SBT are discussed (Figure 4B). It can be seen that all the indexes have significant seasonal variations.
From January to February, the IW shows an obvious increasing trend. It reaches the strongest in the 12th pentad, then decreases remarkably, and reaches the weakest in the 39th pentad in July with a value close to zero. The westerlies in July and August are weak, and increase rapidly in September. The standardized anomalies of IW from the 26th to 60th pentad are lower than zero, indicating that the mid-latitude westerlies upstream of TP are stronger in the winter half-year from previous November to current April and reach the strongest at the end of February. During the weakening and northward moving of the westerlies at mid-latitudes from the end of April to October, the westerly wind upstream of TP is gradually replaced by a stronger easterly wind, which is the strongest in July. When the westerlies at mid-latitudes begin to move southward, the intensity of westerly wind upstream of TP enhances again.
The NBR exists all year around and changes with the north-south shift of the westerlies. It is stronger in the winter half-year from previous November to current April, strongest in the ninth pentad, and weaker in summer from June to August, especially in the 43rd pentad in August. It begins to enhance with the slow southward movement of the mid-latitude westerlies.
The ISBT is also stronger in the winter half-year. It reaches the strongest in the eighth pentad, weakens from April to June, and reaches the weakest in the 53rd pentad. It is weaker from July to August, and starts to strengthen slowly in September. The standardized anomalies of ISBT in the 22nd–65th pentad are less than zero. It means that the SBT changes with the north-south shift of the westerlies. It is the strongest in winter at the beginning of February (Suo and Ding, 2009), and then starts to weaken. With the onset of the Bay of Bengal monsoon from April to June, the SBT weakens slowly and reaches the weakest rapidly from July to August in mid-summer, with the intensity close to zero. When the westerlies at mid-latitudes slowly move southward, the SBT slowly intensifies from September.
The FAT has the common evolution characteristics of SBT and NBR. It is stronger in the winter half-year from October to the next April, and reaches the strongest in the eighth pentad in February when the IW has the second-largest value. Then, the FAT gradually weakens with the northward movement of the westerlies at mid-latitudes, and is the weakest in the 45th pentad in August. The standardized anomalies of IFAT in the 30th–60th pentad are less than 0. The weakening of FAT is caused by the simultaneous weakening of SBT and NBR after the weakening and northward moving of mid-latitude westerlies.
The correlation coefficients between IW, IFAT, ISBT and INBR are shown in Table 1, which all pass the significance test at the 0.001 significance level. They indicate that FAT, NBR, and SBT are closely related to the changes of the subtropical westerlies in upstream areas. The correlation coefficient between INBR and ISBT is 0.85, which has also passed the significance test of 0.001, indicating a significant positive correlation between the NBR and SBT.
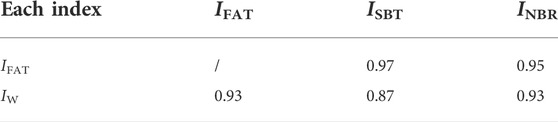
TABLE 1. The correlation coefficients of IFAT, ISBT, INBR, and IW.
From the annual average of IFAT and IW and the wavelet analysis of IFAT (Figure 5), it can be seen that the IFAT and IW have obvious interannual variation and periodic characteristics in the winter half-year, autumn, winter and spring.
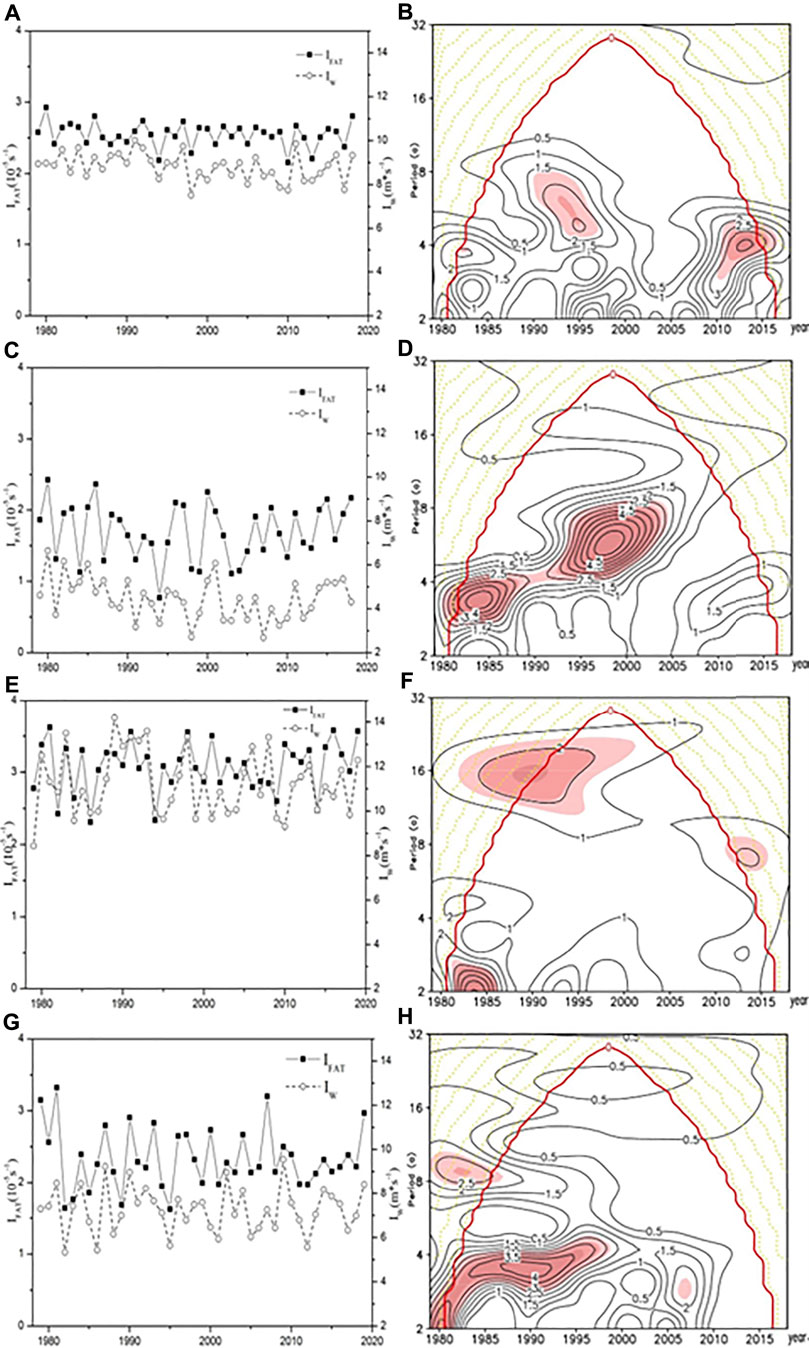
FIGURE 5. The time series of IFAT(solid line and square), and IW(dashed line and circle) in (A) winter half-year, (C) autumn, (E) winter, (G) spring. The wavelet power spectrum for IFAT in (B) winter half-year, (D) autumn, (F) winter, (H) spring. The shaded areas in B, D, F and H indicate statistical significance 0.05 level, and dotted line areas indicate the cone of the wavelet influence by the boundary.
There are the best positive correlation for IFAT and IW in the winter half-year, passing the significance test at the 0.001 significance level. They are decreasing trends year by year. The trend of IW has passed the significance test at the 0.05 significance level. Both of them are stronger before 1997 and then weaker (Figure 5A). The IFAT of the winter half-year has a 4–8a period in the 1990s and a quasi-4a period in the 2010s (Figure 5B).
In autumn, the mid-latitude westerlies move from north to south with a weak intensity, which shows a decreasing trend that has passed the significance test of 0.05. It is the strongest in 1980 and then continually weakens until 1998 (Figure 5C). The average intensity of FAT in autumn is weaker than that in the winter half-year. It also reaches the strongest in 1980 and the weakest in 1994. After that, it intensifies slowly. The correlation between IFAT and IW has passed the significance test of 0.001. The IFAT in autumn has a 2–4a period in the 1980s, and a 4–8a period in 1990s–2000s (Figure 5D).
The intensity of mid-latitude westerlies and FAT reaches the strongest in winter, with large interannual variation. But the positive correlation between them has only passed the significance test at the 0.02 significance level. The IW shows a slight weakening trend. It reaches the weakest in 1979, then slowly intensifies until 1989, maintains a strong state in the early 1990s, and then slowly weakens. However, the IFAT shows a slight strengthening trend. Both of them maintain a strong state around 1990 (Figure 5E). The IFAT in winter has a quasi-2a period in the 1980s, and a 16a period in the 1990s (Figure 5F).
In spring, as the mid-latitude westerlies start to move northward, IFAT and IW weaken, showing a weak weakening trend. The positive correlation between them has also passed the significance test at the 0.001 significance level (Figure 5G). The IFAT in spring has a 3–4a period from the 1980s to the 1990s, and a quasi-3a period at the end of the 2000s (Figure 5H).
Overall, it can be concluded that the interannual evolution of IFAT is closely related to IW in the upstream of TP, both of which are the strongest in winter and have obvious periodic changes.
According to the above analysis, the FAT is the strongest in winter. The year when a standardized anomaly of IFAT in winter is greater than one or less than −1 is taken as the strong and weak winter FAT year, respectively. The results are shown in Table 2. In the following sections, the winter is used as the representative period. After the t-test, the composite difference of physical quantities between strong and weak winter FAT years is used to explore the relationship between winter FAT anomaly and the precipitation and temperature in China, as well as the characteristics of atmospheric circulation under anomalous winter FAT.
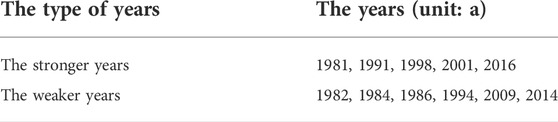
TABLE 2. The stronger/weaker years of IFAT in winter.
The NBR and SBT in winter are closely related to the precipitation and temperature in China (Fan et al., 2015; Li et al., 2021). This relationship under the background of global warming can be seen in Figure 6. There are significantly positive precipitation anomalies in most parts of China (Figure 6A), indicating that there will be more precipitation when winter FAT is stronger and vice versa. Especially in the central part of Xinjiang and TP, the southern part of Southwest China, North China, the Yangtze-Huaihe River, the middle and lower reaches of the Yangtze River and South China, the positive precipitation anomalies are significant and have passed the significance test. Only the northern part of Northeast China has weak negative precipitation anomalies, indicating less precipitation when winter FAT is stronger and vice versa.
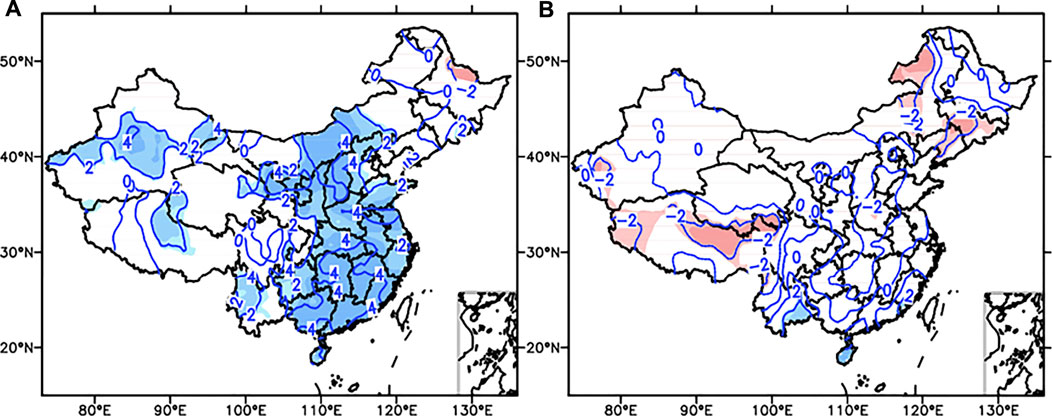
FIGURE 6. The t-test results of the (A) precipitation and (B) temperature difference in China between the stronger and weaker winter FAT years. (Solid lines and dashed lines represent positive and negative values respectively; correlation significant at the 0.01, 0.05 and 0.1confidence level are shaded with dark and light grey, contour interval: 2)
The relationship between temperature in China and winter FAT is almost opposite. Figure 6B shows negative temperature anomalies in most parts of China, especially in the TP, North China and the middle of Northeast China. Only the southern parts of Southwest and South China have positive anomalies that have passed the significance test, while some weak positive anomalies occur in local areas of Northwest China, Southwest China, South China and East China. It means that when the winter FAT is stronger, the temperature in most parts of China is lower, especially over the TP and in the middle of Northeast China, and the temperature in the south of Southwest China and South China is higher, and vice versa. All the conclusions have passed the significance test at the 0.1 significance level.
It can be concluded that with the change of IFAT, the precipitation changes in most parts of China are very significant, especially in most parts of Northwest, and central-eastern parts of China under global warming. The anomalies of precipitation and temperature in TP and Northeast China are also obvious. Extreme weather such as blizzards and cold waves may occur in some areas of Northwest China, TP and North China. Low temperature and continuous rainy weather may occur in the Yangtze-Huaihe River and the middle and lower reaches of the Yangtze River, causing road icing. These relationships can be discussed from the perspective of abnormal atmospheric circulation in stronger and weaker winter FAT years.
Under the background of global warming, the abnormal FAT in winter causes the abnormal precipitation and temperature in China, which reflects the abnormal large-scale atmospheric circulation and physical quantities. The abnormal change of large-scale circulation may affect the occurrence of extreme events (You et al., 2011).
The difference of sea-level pressure and OLR between the stronger and weaker winter FAT years is shown in Figure 7A. There is strong positive pressure anomaly centered over the Central Siberian Plateau and Northeast China. It indicates that the Asian cold high is stronger, and results in lower temperature in most parts of Asia, especially in Northeast and North China. From South China to the Indochina Peninsula and eastward to the Aleutian Islands, there is a weak negative pressure anomaly which can cause higher temperature. There are negative OLR anomalies in most parts of Asia, especially in Northwest China, TP, the central-eastern China, and most coastal areas of China. It indicates that there are more clouds and convective activities (Brant et al., 1998; Liu and Li, 2007), which is in favor of more precipitation and lower temperature in these eraes. The OLR anomaly in the TP area in winter has good spatial consistency and persistence, which can affect the 500 hPa circulation in the current month and the next 1–2 months (Li et al., 1996).
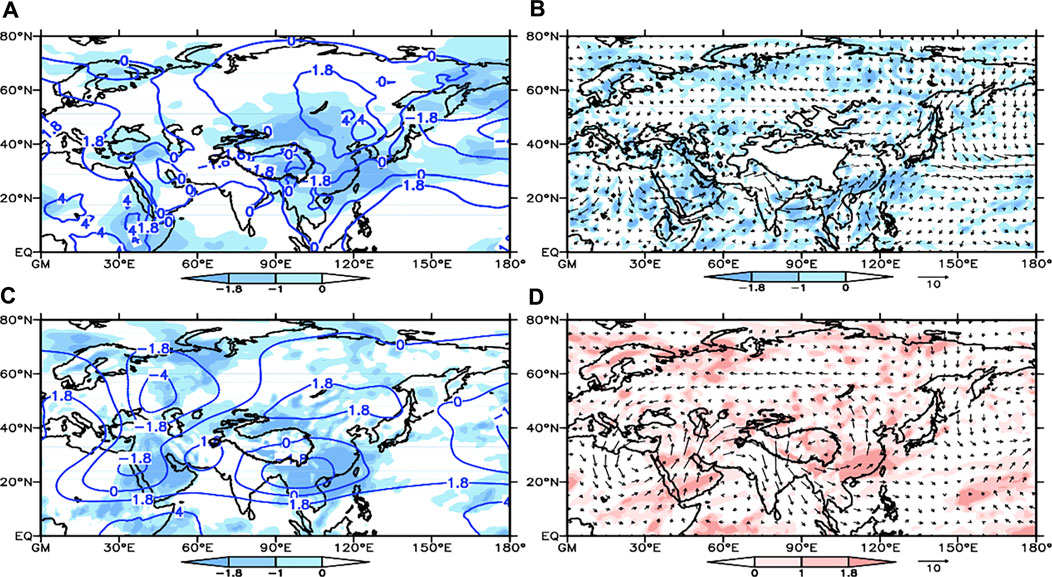
FIGURE 7. The t-test results of the difference of (A) sea level pressure (unit: hPa; contours) and OLR (unit: W/m2; shadows), (B) wind (unit: m s−1; vectors) and water vapor flux divergence (unit: 10–6 g·s-1·cm-2·hPa-1; shadows) at 850 hPa, (C) geopotential height (unit: gpm; contours) and vertical velocity (unit: hPa/s; shadows) at 500 hPa, and (D) wind (unit: m s−1; vectors) and divergence (unit: s−1; shadows) at 200 hPa between the stronger and weaker winter FAT years. The values larger than 1.8 have passed the significance test at the 0.1 significance level.
The t-test results of the difference of wind and water vapor flux divergence at 850 hPa between the stronger and weaker winter FAT years are shown in (Figure 7B). As can be seen, the mid-high latitudes of Eurasia are dominated by anticyclonic abnormal circulation, and there is significant northerly wind anomaly in Northeast Asia, which can guide the cold air in the polar region to the south along the Central Siberian Plateau through the easterly path and cause low temperatures in most parts of northern-eastern China in strong winter FAT years. In the middle and low latitudes, there is an abnormal cyclonic circulation centered on the TP, with the strongest part located in the area from the Indian peninsula to the middle and lower reaches of the Yangtze River in China. It indicates that the SBT and the southwesterly low-level jet are relatively strong when winter FAT is strong. The western Pacific subtropical high is farther north and west. There is easterly wind anomaly in the north of the Yangtze River, and strong southerly wind anomaly in the south. Obvious wind shear is formed in the Yangtze River basin, where the cold air and warm air converge. The abnormally strong southwesterly low-level jet between the SBT and the western Pacific subtropical high continuously transports the warm-humid air from the Bay of Bengal, the South China Sea and the East China Sea to the mainland of China. There is a significant water vapor flux convergence anomaly in the south of the Yangtze River. Combined with the cold air moving southward, it is easy to cause precipitation and low-temperature weather in most parts of central-eastern China during the strong winter FAT years, while the temperature in the southwest and southern China is abnormally high.
In Figure 7C, the t-test is conducted based on the difference of geopotential height and vertical velocity at 500 hPa between the stronger and weaker winter FAT years. As can be seen, there are positive geopotential height anomalies in the middle-high latitudes of Asia and near the equator, and negative anomalies in southern China. It shows that in stronger winter FAT years the Ural high-pressure ridge and the East Asian trough are weak, the northern part of Asia is controlled by the abnormally strong high pressure ridge, and the southern part is an abnormal low-pressure trough. The NBR in the north side of TP is stronger when winter FAT is stronger, which guides the cold air from the polar region to the south by the eastern path, resulting in abnormally low temperatures in northern and eastern China. The SBT and the western Pacific subtropical high are relatively stronger. The southwesterly airflow transports more water vapor from the Bay of Bengal, the South China Sea, the East China Sea and the western Pacific to the mainland of China. Most parts of China from northwest to southeast show obvious ascending motion anomaly in strong FAT winter, especially in the northwest and south of the Yangtze River, which is conducive to more precipitation in most parts of Northwest and South China. In Northeast China, there is a weak positive anomaly, indicating the descending motion which is unfavorable for precipitation.
Figure 7D shows the t-test results of the difference of divergence and wind at 200 hPa between the stronger and weaker winter FAT years. In the mid-high latitudes of Eurasia, there is an abnormal cyclonic circulation. The polar front jet in northern Asia is weak, which is an abnormal easterly. In the subtropical region, an abnormal westerly flow indicates a stronger westerly jet in strong winter FAT years. In China there is an abnormal cyclonic circulation centered on the east side of TP. The subtropical westerly jet on the south side of TP is relatively strong, and the jet axis is located from the Iranian Plateau to Indochina Peninsula. The Northwest China, TP and most areas in eastern China are abnormal high-level divergent areas, which is conducive to the formation of precipitation. Such distribution of upper-level jet stream will lead to strong East Asian winter monsoon and large-scale land surface cooling in China (Mao, et al., 2007; Yao and Li, 2013).
In summary, the baroclinic characteristics from bottom to top in most parts of Asia in strong winter FAT years are very significant. The positive surface pressure anomaly and negative OLR anomaly are significant. At low levels, there is obvious cold air moving southward by the easterly path in the north of the Yangtze River. In contrast, the strong low-level jet in the south of the Yangtze River transports abundant water vapor from the source areas. The cold air and warm air converge and form a shear line in the Yangtze River basin. The FAT in middle levels and the ascending motion in most parts of Northwest and East China are stronger. The divergence at high levels is stronger in most parts of Northwest and South China. Meanwhile, the subtropical upper-level jet is also stronger. These abnormal distributions are consistent with the precipitation and temperature anomalies shown in Figure 6, which can well explain the precipitation and temperature anomalies in China, including the possible causes of the extreme weather such as cold waves and blizzards in most areas of the North China and TP in winter, the low-temperature freezing disasters in the middle and lower reaches of the Yangtze Rive.
Investigating the characteristics of precursory and anomalous circulation in the northern hemisphere during the anomaly of FAT in winter is conducive to understanding the possible reasons for the formation and change of its relationship with precipitation and temperature. From 500 hPa geopotential height anomaly field of the FAT anomaly in January and the previous in October, November, and December in the northern hemisphere (Figure 8), the Rossby wave is the main feature.
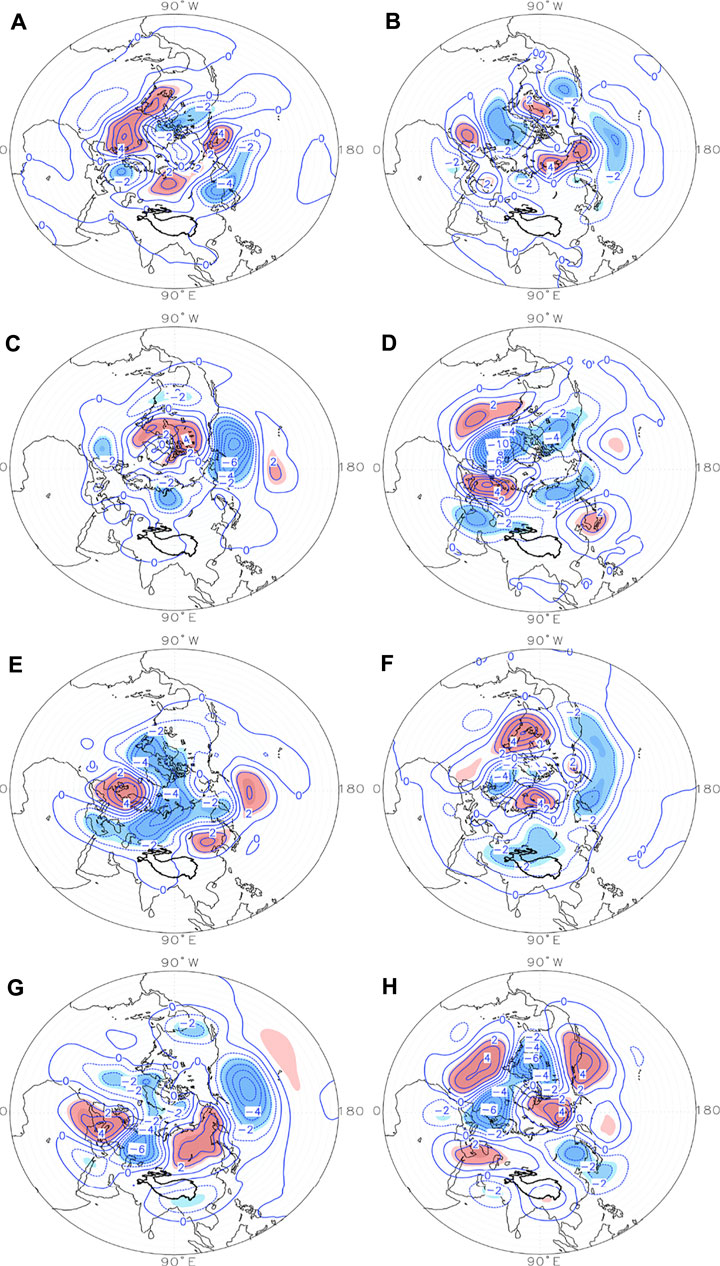
FIGURE 8. The composite 500 hPa geopotential height anomaly of winter FAT in previous October (A,B), November (C,D), December (E,F) and anomalous January (G,H) in the northern hemisphere. A, C, E and G are the stronger FAT years, and B, D, F and H are the weaker FAT years. The shadow is the same as Figure 6.
Firstly, the anomalous field of precursory circulation in stronger years of FAT is analyzed. The polar vortex is located at the North American in October (Figure 8A). The North Atlantic Oscillation (NAO) is strong. The Rossby wave originating from the North Atlantic propagates eastward, passes through Europe to Siberia and the Aleutian Islands, which is a strong positive anomaly. The East Asian Trough is stronger, and the North Pacific Oscillation (NPO) is also strong. The positive anomaly in the north of TP is stronger, and negative anomaly in the south is weaker, indicating the FAT is stronger. In November (Figure 8C), the polar vortex moves to the eastern hemisphere, and the NPO is stronger. The trough and ridge on the south and north sides of TP are weaker, so the FAT is weaker, too. While the NAO in December (Figure 8E) is significant. The polar vortex distributed in the North America, the polar regions and the Ural Mountains are abnormally stronger. The Rossby wave from the east of the Atlantic Ocean, through the Ural Mountains to the east of Asia, shows abnormally high pressure. The East Asian Trough is weaker. Moreover, the trough and ridge on the south and north sides of TP are still weaker, and the FAT is also weaker. The propagation of the Rossby wave originating in the North Atlantic is very evident by January (Figure 8G). Western Europe and northern Asia are positive anomalies, the stronger polar vortex is near the Ural Mountains, forming an “inverted Ω pattern” circulation in the eastern hemisphere, which is conducive to guiding the cold air from the stronger polar vortex southward to affect China. At the same time, the NBR and SBT are stronger, and the FAT is also stronger. The SBT can transport water vapor from the bay of Bengal and the South China Sea to China, which is prone to precipitation. It can be seen that the precursor circulation signal is the strongest in October.
The precursory circulation anomalous field in weaker years of FAT is not in the opposite phase to the anomalous in stronger years completely. The NAO and NPO are stronger in October (Figure 8B). The SBT and NBR in the south and north of TP are weaker, and the FAT is weaker. In November (Figure 8D), the stronger polar vortex is biased towards the Western Hemisphere, and the weaker polar vortex is biased towards northern Asia. The NAO is exceptionally strong. The propagation of Rossby wave originating from the North Atlantic region is unusually pronounced. The negative anomaly in the north of TP is weak, and the FAT is weaker. The polar high pressure in December is stronger (Figure 8F). There is a “multipolar” circulation in the middle and high latitudes. The abnormal low pressure in north of TP increases, the NBR is weaker, and the FAT is also weaker. The polar region is still controlled by the polar high pressure in January (Figure 8H). The stronger polar vortex moves southward to the Western Hemisphere. The NAO is significant. There is a weak high-pressure circulation around the TP, the NBR is stronger, and the East Asia Trough is stronger and eastward, which are not conducive to the southward movement of cold air to affect China. At the same time, the SBT is weaker, which can’t be conducive to the transportation of water vapor. The precursory circulation in December is similar to the abnormal circulation in January.
The analysis in the previous chapter shows that the changes of FAT at different time scales are closely related to the changes of the westerly flow upstream of the TP. The anomaly of the FAT circulation in winter must be related to the anomaly of the westerly airflow upstream of the TP. Figure 9 is obtained by taking a vertical section of the 20–45°N mean zonal westerly wind upstream of the TP when the FAT is abnormal. When the FAT is stronger (Figure 9A), the westerly airflow upstream of the TP is around 65°E, showing a bottom-up enhancement centered at 200 hPa, and the upper-altitude westerly jet is stronger. When the westerly airflow passes through the TP, it is blocked by the TP and forms a north-south branch, and its intensity is weakened. After the two westerlies converge to the east of the TP, the intensity increases from bottom to top and from west to east, forming a stronger subtropical westerly jet stream. The anomalous characteristics of westerly winds (Figure 9B) are almost opposite when FAT is weaker or stronger. The westerly airflow is centered at 200 hPa near 65°E, weakening from bottom to top, and the high-altitude westerly jet is weaker. After the two westerly airflows intensifies confluence east of the TP, and the subtropical westerly jet also intensified, but the westerly weakens east of 135°E and moved eastward, and the westerly jet also weakens.
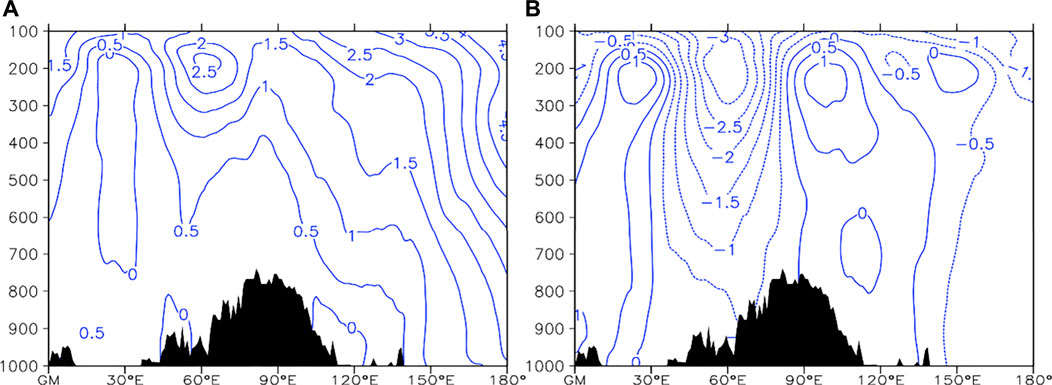
FIGURE 9. Longitude-altitude cross-sections of the average zonal westerly (unit: m s−1; vector) anomaly of 20–45°N in (A) the stronger, (B) the weaker of FAT years. Shadow is the 4 km topography.
It can be concluded that, according to the upstream and downstream effects, the strength of the zonal westerly wind upstream of the TP leads to the abnormality of FAT, and the change of the subtropical westerly jet stream in the downstream, which may also be another important trigger mechanism for the formation of the abnormal relationship between FAT and precipitation and temperature in China.
In this study, we define the vorticity perturbation as the difference between local vorticity and the meridionally-averaged vorticity. Then, the difference of averaged vorticity perturbation at 600 hPa in the two key areas where the trough and ridge are located is used to represent the intensity of the flows around the Tibetan Plateau (IFAT) visually. Then, we analyze the vertical structure and spatial distribution of FAT in the winter half-year, autumn, winter and spring, as well as the intraseasonal and interannual evolution characteristics of FAT. Taking winter as a representative, this study discusses the relationship of FAT with precipitation, temperature and large-scale circulation in China under global warming. The main conclusions are as follows.
The asymmetric TPD circulation is steady on the north and south sides of TP in the winter half-year. With the movement of the westerlies, the FAT begins to strengthen gradually in autumn. In winter, the mid-latitude westerlies and FAT in the upstream of TP reach the strongest and the widest. In spring, they begin to weaken and change to the summer circulation pattern. The NBR shows a weakening trend in all periods, while the variation trends of FAT and SBT are the same. The interannual variation of FAT in each period is mainly a weakening trend year by year, and has a quasi-4a period.
Under the background of global warming, taking winter which has the strongest FAT as an example, the relationships of IFAT with the precipitation and temperature in China are analyzed. It is found that the relationships in most parts of China are very significant, especially in most parts of central and eastern China, as well as in Northwest China, TP and Northeast China. In addition, extreme weather such as blizzards and cold waves may occur in parts of Northwest China, TP and North China, and the low temperature and freezing events in the Yangtze-Huaihe River region and the middle and lower reaches of the Yangtze River.
When the FAT is abnormal in winter, the abnormal fields of large-scale atmospheric circulation, OLR, water vapor flux divergence and vertical velocity at all levels are discussed. Results show that the baroclinic characteristics in most parts of China are significant in the troposphere from bottom to top. When FAT is stronger, the positive pressure anomalies on the ground and the negative OLR anomalies are obvious. There is significant convergence caused by cold and warm humid air in low levels, and the FAT and ascending motion in the middle levels are stronger. Meanwhile, the westerlies jet in the south and the divergence at high levels are relatively strong. Rossby wave is the main feature of the circulation anomalies and precursor signals in the northern hemisphere. The precursory signals in stronger and weaker years of FAT appears in previous October and December respectively. When the FAT is stronger in winter, the westerly jet in the upstream of the TP is strengthened from bottom to top significantly, and it is the opposite in weaker years. These abnormal distributions can well explain the relationships between the FAT and the precipitation and temperature in China. In addition, the FAT anomaly may also be one of the reasons for the climate extreme events in China, such as cold waves and blizzards in the north and in most areas of TP in winter, the low-temperature freezing disasters in the middle and lower reaches of the Yangtze River.
Research on the dynamic effect of TP started in the 1950s (Yeh, 1950; Bolin, 1950; Ramaswamy, 1956). In recent years, the research on TP mainly focused on the characteristics of its thermal effect and its impact on Asian weather and climate (He et al., 1987; Liu et al., 2012). This study only discussed the influence of the mid-latitude westerlies on the evolution of FAT, but the relationship between TP thermal status and FAT is still unclear. Duan et al.,2008, and Liu et al. (2012) found that the change of wind speed over the TP is the key factor affecting the thermal condition of TP. Besides the influence of the westerlies, what else is the driving mechanism of TP wind speed change? From the perspective of large-scale circulation, this study has already concluded that the FAT may be one of the reasons for the high impact winter weather events in China. What is the effect of FAT on climate extreme weather under the background of global warming? These are the issues that need to be studied in the future.
The original contributions presented in the study are included in the article/supplementary material, further inquiries can be directed to the corresponding authors.
YZ contributed to the formal analysis, investigation and Writing original draft. HZ, XG, GF and SL contributed to the supervision and funding acquisition. And HZ, XG, GF, SL, WH and LD contributed to the review of the original draft. All authors contributed to manuscript revision and read and approved the submitted version.
This research was funded by the Second Tibetan Plateau Scientific 563 Expedition and Research Program (STEP) (Grant Nos. 2019QZKK0103, 2019QZKK010203), the National Natural Science Foundation of China (42075019, 41775072).
The author is grateful to all reviewers and editors for valuable comments and edits.
The authors declare that the research was conducted in the absence of any commercial or financial relationships that could be construed as a potential conflict of interest.
All claims expressed in this article are solely those of the authors and do not necessarily represent those of their affiliated organizations, or those of the publisher, the editors and the reviewers. Any product that may be evaluated in this article, or claim that may be made by its manufacturer, is not guaranteed or endorsed by the publisher.
Bao, X. H., and Zhang, F. Q. (2013). Evaluation of NCEP–CFSR, NCEP–NCAR, ERA-interim, and ERA-40 reanalysis datasets against independent sounding observations over the Tibetan plateau. J. Clim. 26 (1), 206–214. doi:10.1175/JCLI-D-12-00056.1
Bolin, B. (1950). On the influence of the earth's orography on the general character of the westerlies. Tellus 2 (3), 184–195. doi:10.1111/j.2153-3490.1950.tb00330.x
Brant, L., Jose, A. M., John, D. G., Kousky, V. E., Wainer, I. C., and Massambani, O. (1998). A comparison of rainfall, outgoing longwave radiation, and divergence over the Amazon basin. J. Clim. 11, 2898–2909. doi:10.1175/1520-0442(1998)011<2898:acorol>2.0.co;2
Chen, D., Bueh, C. L., and Zhu, K. Y. (2013). Interannual and interdecadal variabilities of circulation over LakeBaikal region in late spring and their association with temperature and precipitation over China (in Chinese). Chin. J. Atmos. Sci. 37 (6), 1199–1209. doi:10.3878/j.issn.1006-9895.2012.12155
Dee, D. P., Uppala, S. M., Simmons, A. J., Berrisford, P., Poli, P., Kobayashi, S., et al. (2011). The ERA-Interim reanalysis: Configuration and performance of the data assimilation system. Q. J. R. Meteorol. Soc. 137 (656), 553–597. doi:10.1002/qj.828
Duan, A. M., Wu, G. X., and Liang, X. Y. (2008). Influence of the Tibetan Plateau on the summer climate patterns over Asia in the IAP/LASG SAMIL model. Adv. Atmos. Sci. 25 (4), 518–528. doi:10.1007/s00376-008-0518-2
Fan, G. Z., Zhang, Y. L., Wang, B. Y., and Hua, W. (2015). Interannual variability of the wintertime northern branch high ridge in the subtropical westerlies and its relationship with winter climate in China. J. Meteorol. Res. 29 (5), 703–719. doi:10.1007/s13351-015-4178-8
Freitas, A. C. V., Frederiksen, J. S., O'Kane, T. J ., and Ambrizzi, T. (2017). Simulated austral winter response of the Hadley circulation and stationary Rossby wave propagation to a warming climate. Clim. Dyn. 49, 521–545. doi:10.1007/s00382-016-3356-4
Gu, Z. C. (1951). The dynamical effects of Xizang Plateau on the atmospheric circulation over East Asia and it's importance (in Chinese). Sci. China 2, 283–303.
He, H. Y., McGinnis, J. W., Song, Z. S., and Yanai, M. (1987). Onset of the Asian summer monsoon in 1979 and the effect of the Tibetan Plateau. Mon. Weather Rev. 115, 1966–1995. doi:10.1175/1520-0493
Jiang, R., Gong, Y. F., Yuan, Y., et al. (2021). Variation characteristics of the westerly flow around the Tibetan plateau in january and its impact on climate in China (in Chinese). Chin. J. Atmos. Sci. 45 (6), 1313–1326. doi:10.3878/j.issn.1006-9895.2103.20244
Jiang, Y. R., He, J. H., Wen, M., et al. (2009). Characteristic of a couple of vortexes on the east side of Tibetan Plateau from winter to spring and their impact on the weather and climate in China (in Chinese). Plateau Meteorol. 28 (5), 945.
Li, D. L., Zhang, J. J., and Wu, H. B. (1996). A Study on the effects of climatic feature of OLR over the Qinghai-Xizang Plateau on general circulation in northern hemisphere (in Chinese). Plateau Meteorol. 15 (3), 259–268. doi:10.1007/s00376-997-0061-6
Li, F., Li, J. P., Li, Y. J., et al. (2012). Climatological characteristics of flow around and flow over the Tibetan Plateau. Chin. J. Atmos. Sci. 36 (6), 1236–1252. doi:10.3878/j.issn.1006-9895.2012.11214
Li, K., Zhou, S. W., Shi, X., Chen, S., and Song, Q. (2021). A synthetic study of the position difference of the southern branch trough of the qinghai-tibet plateau based on objective identification. J. Geoscience Environ. Prot. 3 (9), 182–194. doi:10.4236/gep.2021.93011
Li, Q., and Zhang, R. H. (2012). Seasonal variation of climatological bypassing flows around the tibetan plateau. Adv. Atmos. Sci. 29 (5), 1100–1110. doi:10.1007/s00376-012-1154-4
Li, W. J., and Luo, S. W. (1986). An numerical experiment of the effect of tibetan plateau on a synoptic system in its neighbourhood (in Chinese). Plateau Meteorol. 5 (3), 245–255.
Liang, X. Y., Liu, Y. M., and Wu, G. X. (2005). The impact of qinghai-xizang plateau uplift on asian general circulation in spring and summer (in Chinese). Plateau Meteorol. 24 (6), 837–845.
Liang, X. Y., Qian, Z. A., and Li, W. Y. (2002). Analyses on circulation patterns and water vapor fields of snow disaster weather in eastern pasture areas of qinghai-xizang plateau (in Chinese). Plateau Meteorol. 4, 21359–21367. doi:10.3321/j.issn:1000-0534.2002.04.004
Liu, M., and Li, D. L. (2007). Change characteristic and correlation of OLR and precipitation over east qinghai- xizang plateau in rainy season (in Chinese). Plateau Meteorol. 26 (2), 249–256. doi:10.3321/j.issn:1000-0534.2007.02.005
Liu, Y. M., Wu, G. X., Hong, J. L., Dong, B., Duan, A., Bao, Q., et al. (2012). Revisiting asian monsoon formation and change associated with Tibetan plateau forcing: II. Change. Clim. Dyn. 39 (5), 1183–1195. doi:10.1007/s00382-012-1335-y
Lu, J., Vecchi, G. A., and Reichler, T. (2007). Expansion of the Hadley cell under global warming. Geophys. Res. Lett. 34 (14), L06805.
Luo, S. W., Lv, S. H., and Sun, L. Y. (1984). The effects of land-sea distributions and tibetan plateau of the mean meridional circulations in January and July and their seasonal variations (in Chinese). Plateau Meteorol. 3 (4), 1–13.
Mao, R., Gong, D. Y., and Fang, Q. M. (2007). Influences of the East Asian jet stream on winter climate in China. J. Appl. Meteorological Sci. 18 (2), 137–146. doi:10.3969/j.issn.1001-7313.2007.02.002
Murakami, T. (1981). Orographic influence of the Tibetan Plateau on the asiatic winter monsoon circulation Part L large-scale aspects1. J. Meteorological Soc. Jpn. 59, 40–65. doi:10.2151/jmsj1965.59.1_40
Qiao, Y., Zhou, S. W., and Ma, Y. (2014). Dynamic effect of Tibetan Plateau and its impact on weather and climate in China (in Chinese). Meteorological Sci. Technol. 42 (6), 1039–1046. doi:10.3969/j.issn.1671
Ramaswamy, C. (1956). On the sub-tropical jet stream and its role in the development of large-scale convection. Tellus 8 (1), 26–60. doi:10.1111/j.2153-3490.1956.tb01194.x
Suo, M. Q., and Ding, Y. H. (2009). The structures and evolutions of the wintertime southern branch trough in the subtropical westerlie (in Chinese). Chin. J. Atmos. Sci. 33 (3), 425–442.
Torrence, C., and Compo, G. P. (1998). A practical guide to wavelet analysis. Bull. Am. Meteorol. Soc. 79 (1), 61–78. doi:10.1175/1520-0477(1998)079<0061:apgtwa>2.0.co;2
Trenberth, K. E., and Chen, S. C. (1988). Planetary waves kinematically forced by Himalayan orography. J. Atmos. Sci. 45 (20), 2934–2948. doi:10.1175/1520-0469(1988)045<2934:pwkfbh>2.0.co;2
Wang, A. Y., and Wang, Q. Q. (1985). The effects of the Qinghai-Xizang Plateau on the mean general circulation in East Asia in winter (in Chinese). Plateau Meteorol. 4 (2), 109–120.
Wang, L., Qin, J., and Chen, Z. H. (2011). Statistics on circulation and meteorological elements anomalies during extreme freezing rain and snow disasters in southern China (in Chinese). Resour. Environ. Yangtze Basin 20 (Z1), 173–180. cjly.0.2011-s1-029
Wen, X. Y., Wang, S. W., and Zhu, J. H. (2006). An overview of China climate change over the 20th century using UK UEA/CRU high resolution grid data (in Chinese). Chin. J. Atmos. Sci. 5 (30), 894–904. doi:10.3878/j.issn.1006-9895.2006.05.18
Wu, G. X., Duan, A. M., Liu, Y. M., Mao, J., Ren, R., Bao, Q., et al. (2015). Tibetan plateau climate dynamics: Recent research progress and outlook. Natl. Sci. Rev. 2, 100–116. doi:10.1093/nsr/nwu045
Wu, G. X., Liu, Y. M., Wang, T. M., Duan, A., and Wan, R. (2007). The influence of mechanical and thermal forcing by the Tibetan Plateau on Asian climate. J. Hydrometeorol. 8 (4), 770–789. doi:10.1175/JHM609.1
Wu, G. X. (1984). The Nonlinear response of the atmosphere to large-scale mechanical and thermal forcing. J. Atmos. Sci. 41 (16), 2456–2476. doi:10.1175/1520-0469(1984)041<2456:tnrota>2.0.co;2
Wu, G. X., and Zhang, Y. S. (1998). Tibetan plateau forcing and the timing of the monsoon onset over South Asia and the South China Sea. Mon. Weather Rev. 126 (4), 913–927. doi:10.1175/1520-0493(1998)126<0913:tpfatt>2.0.co;2
Yanai, M., Li, C. F., and Song, Z. S. (1992). Seasonal heating of the tibetan plateau and its effects on the evolution of the asian summer monsoon. J. Meteorological Soc. Jpn. 70, 319–351. doi:10.2151/jmsj1965.70.1b_319
Yao, H. R., and Li, D. L. (2013). Spatial structure of East Asia subtropical jet stream and its relation with winter air temperature in China (in Chinese). Chin. J. Atmos. Sci. 37 (4), 881–890. doi:10.3878/j.issn.1006-9895.2012.12072
Yeh, T. C (1950). The Circulation of the High Troposphere over China in the Winter of 1945-46. Tellus 2, 173–183. doi:10.1111/j.2153-3490.1950.tb00329.x
Yeh, T. C., and Gu, Z. C. (1955). The impact of the Tibet Plateau on the East Asian atmospheric circulation and the weather of China (in Chinese). Chin. Sci. Bull. 6 (6), 29–33. doi:10.1360/csb1955-0-6-29
You, Q. L., Kang, S. C., Aguilar, E., Pepin, N., Flugel, W. A., Yan, Y., et al. (2011). Changes in daily climate extremes in China and their connection to the large scale atmospheric circulation during 1961–2003. Clim. Dyn. 36 (11-12), 2399–2417. doi:10.1007/s00382-009-0735-0
Zhang, Y. C., and Qian, Y. F. (1999). Numerical studies in the effects of the critical height of Qinghai-Xizang Plateau uplift on the atmosphere. Acta Meteorol. Sin. 57 (2), 157–167. doi:10.11676/qxxb1999.014
Zhang, Y. L., Fan, G. Z., and Wang, J. N. (2018). Variation of springtime northern branch ridge and its impact on climate in China (in Chinese). J. Nat. Resour. 33 (1), 114–126. doi:10.11849/zrzyxb.20161067
Zhang, Y. L., Fan, G. Z., and Zhou, D. W. (2014). Variation of springtime southern branch trough and its relationship with precipitation and atmospheric circulation (in Chinese). Plateau Meteorol. 33 (1), 97–105. doi:10.7522/j.issn.1000-0534.2012.00179
Keywords: the flows around the Tibetan Plateau, the mid-latitude westerlies, under global warming, the anomalies of precipitation and temperature, large-scale circulation, the climate extreme events
Citation: Zhang Y, Zuo H, Gao X, Fan G, Lv S, Hua W and Dong L (2022) Evolution Characteristics of the Flows Around the Tibetan Plateau and the Relationship with the Climate in China in Winter. Front. Earth Sci. 10:978995. doi: 10.3389/feart.2022.978995
Received: 27 June 2022; Accepted: 25 July 2022;
Published: 30 September 2022.
Edited by:
Jingyu Wang, Nanyang Technological University, SingaporeReviewed by:
Weiqiang Ma, Institute of Tibetan Plateau Research (CAS), ChinaCopyright © 2022 Zhang, Zuo, Gao, Fan, Lv, Hua and Dong. This is an open-access article distributed under the terms of the Creative Commons Attribution License (CC BY). The use, distribution or reproduction in other forums is permitted, provided the original author(s) and the copyright owner(s) are credited and that the original publication in this journal is cited, in accordance with accepted academic practice. No use, distribution or reproduction is permitted which does not comply with these terms.
*Correspondence: Hongchao Zuo, enVvaGNoQGx6dS5lZHUuY24mI3gwMjAwYTs=; Xiaoqing Gao, eHFnYW9AbHpiLmFjLmNu
Disclaimer: All claims expressed in this article are solely those of the authors and do not necessarily represent those of their affiliated organizations, or those of the publisher, the editors and the reviewers. Any product that may be evaluated in this article or claim that may be made by its manufacturer is not guaranteed or endorsed by the publisher.
Research integrity at Frontiers
Learn more about the work of our research integrity team to safeguard the quality of each article we publish.