- 1State Key Laboratory of Lithospheric Evolution, Institute of Geology and Geophysics, Chinese Academy of Sciences, Beijing, China
- 2College of Earth and Planetary Sciences, University of Chinese Academy of Science, Beijing, China
- 3Department of Earth and Planetary Science, University of California, Berkeley, Berkeley, CA, United States
The hybrid simulation method is developed for simulating wave propagation only in a localized heterogeneous media with hybrid inputs obtained once for all from a known reference model. Despite the fact that the hybrid simulation method has a wide range of applications in computational seismology, the associated error control of this method has received relatively little attention in previous research works. We quantitatively discuss the error of the two-step hybrid method in acoustic wave cases and propose a spatial refinement scheme to compute hybrid inputs based on the multi-elements spline interpolation, which is preferable to traditional Lagrange interpolation since it uses more polydirectional interpolated points. This method can also be used for local refinement of wavefield in more general applications, such as saving smooth wavefield in the full-waveform inversion framework. Furthermore, to save memory requirements, hybrid inputs are proposed to be sparsely stored with a high upsampling ratio during the global simulation, and the Fourier interpolation method is introduced to recover them to their original time series. To demonstrate the effect of the proposed methods, we perform several 2D and 3D hybrid wave numerical simulations using the spectral element method. We find that when the global and local meshing differs, the proposed spatial interpolation method can appreciably reduce the error of the hybrid waveforms caused by inaccurate hybrid inputs. We also point out that the Fourier interpolation can efficiently recover the original waveform, allowing hybrid inputs to be stored with time steps toward the Nyquist limit. Our method is expected to become a standard method to reduce the error of hybrid waveforms and save the memory requirements during hybrid simulations and has potential implications for further improving the accuracy of the so-called box tomography.
1 Introduction
High-resolution seismic images of Earth’s structure play a key role in improving our understanding of the dynamic evolution mechanism and material cycling process of the Earth’s interior (Replumaz et al., 2004; Zhao et al., 2012; Van Der Meer et al., 2014). In recent years, with the development of computer technology and numerical simulation method, full-waveform inversion (FWI) (Tarantola, 1984; Virieux and Operto, 2009; Fichtner, 2010; Capdeville and Métivier, 2018; Tromp, 2020; Lyu et al., 2021) has emerged as a significant imaging technique. In contrast to ray tomography, FWI uses more information about the waveform (e.g., body and surface waves) to capture the full physics of seismic wave propagation through numerical simulation methods such as the finite-difference method (FDM) (Kelly et al., 1976; Robertsson et al., 1994) and spectral element method (SEM) (Seriani and Priolo, 1994; Komatitsch and Tromp, 1999; Komatitsch et al., 2000; Lyu et al., 2020), and the Earth model is iteratively updated using the adjoint technique (Tarantola, 1988; Tromp et al., 2005) until a convergent fit between synthetic seismograms and observations is achieved. In the past decades, there has been an increasing number of adjoint tomography models at the regional (Tape et al., 2009; Zhu et al., 2012; Chen et al., 2017) and global scales (French and Romanowicz, 2015; Bozdağ et al., 2016; Lei et al., 2020). However, producing detailed structures of interest in the global tomography model or utilizing the information from remote sources and stations in regional inversion requires too many computing resources. Because it is necessary to recalculate the synthetic waveforms, at each iteration, in the global domain, including the sources and receivers, while the model is only updated in a small region. This leads to significant computational costs, especially when shorter periods are included. The so-called “box tomography” (Masson and Romanowicz, 2017a) that relies on the hybrid simulation method can effectively overcome this problem because almost all the forward and backward numerical simulations of wave propagation are confined to the smallest computational domain. Clouzet et al. (2018) applied this method to image the upper-mantle shear velocity and radial anisotropy structures beneath the North American continent. In their study, based on the 3D reference model SEMUCB (French and Romanowicz, 2015), besides data from 155 events with sources located within the study region, the data set includes data (down to 40s) from 122 remote events with sources located outside of the study region, which allows better azimuthal coverage of the study region than the traditional regional dataset with all the events inside the box. Similarly, Wang et al. (2016) image the 3D velocity structures beneath the western Pyrenees revealed by teleseismic P waves using the SEM-DSM hybrid method (Monteiller et al., 2015) in a higher frequency (down to 5s) for the 1D background model.
Hybrid simulation methods can be classified into real-time methods (Capdeville et al., 2003) and two-step methods (Wen and Helmberger, 1998; Robertsson and Chapman, 2000; Wen, 2002; Bielak et al., 2003; Zhao et al., 2008; Masson et al., 2014). In this study, we only focus on the two-step method. The computational domain of the hybrid method is often subdivided into two parts in which wave propagation is simulated separately (Figure 1). The main advantage of the two-step method, also known as the domain reduction method (Bielak et al., 2003; Yoshimura et al., 2003), is that the computation can be limited to a subregion containing the local structural perturbations, avoiding repeated expensive simulations in the global model. First, wave propagation is simulated in a global reference model, and the hybrid inputs (including different physical quantities used to construct the equivalent forces, see below for detailed benchmark of different hybrid methods, and the physical quantities used in this study are illustrated in Section 2.3) are synchronously computed and stored versus time. Then, the equivalent forces are imposed onto the hybrid interface of the local target volume to perform the local simulation. The core of the two-step method is the calculation of the hybrid inputs. This divides into the physical, numerical, and combined three different categories, the multiple point sources method, where the surface integral(s) of the representation theorem are physically discretized to express the hybrid inputs containing the physical traction and/or displacement (Monteiller et al., 2013; Zhao et al., 2016; Lin et al., 2019), and the direct discrete differentiation methods, where the hybrid inputs are the displacement term, which can be selected by discrete window function and the wave equation (Bielak et al., 2003; Masson et al., 2014). A recent review (Lyu et al., 2022) compared and analyzed the physical and numerical categories and proposed a combined way to calculate the combined hybrid inputs with the traction, displacement, and acceleration terms.
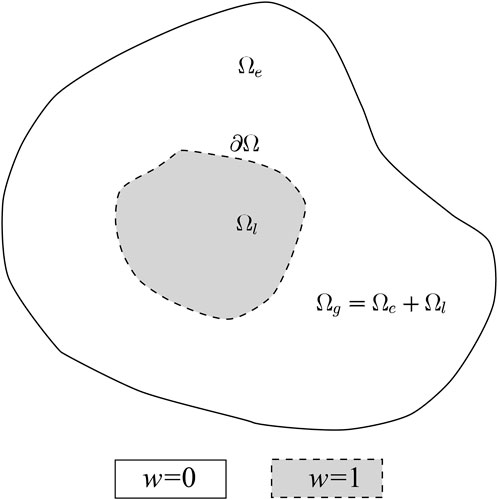
FIGURE 1. Schematic illustration of the computational domain of the hybrid method. The global computational domain is subdivided into two parts: the local domain
In the research on the two-step hybrid method, the accurate calculation of the equivalent forces is crucial. The accuracy of the resultant waveform in the hybrid numerical simulation is affected by the spatial and temporal dispersion errors, simulated duration, and the error of the hybrid inputs. It should be noted that the errors of the hybrid inputs are synchronously affected by the spatial interpolation when calculating the hybrid inputs with different meshing and are also affected by the temporal interpolation when one sparsely saves the hybrid inputs but recovers them in a much smaller time step. Despite the widespread application of hybrid simulation methods in computational seismology, studies on quantitatively investigating and controlling these errors are relatively lacking.
As far as spatial interpolation is concerned, it is known that in the realistic application, the first global simulation is performed in a background reference model without complicated local small-scale geological features, and the grid size of the first global simulation is generally larger than that of the subsequent local simulations. Therefore, during the first global simulation, people usually use spatial interpolation methods to obtain displacements (or potentials in the acoustic case) of some coordinates determined by the local meshing for subsequent hybrid simulation. Previous studies (Clouzet et al., 2018; Lyu et al., 2022) adopted the Lagrange interpolation method, in which the interpolation gird is only made up of the Gauss–Lobatto–Legendre (GLL) points from one element (Figure 2). This introduces spatial error and affects the results of the local simulation, but no quantitative investigation has been conducted.
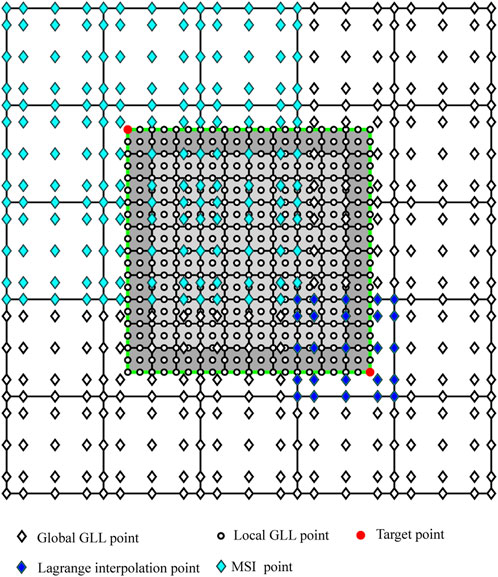
FIGURE 2. Illustration of interpolation grid used in the 2D hybrid simulations. The coarse and fine grids bordered by the black lines represent the quadrilateral SEM elements used for global and local simulations, respectively. The diamond symbols and the circle symbols represent their corresponding GLL points. The green line is the hybrid interface, and the dark grey elements represent the hybrid elements. The red solid circles are two examples at which the wavefield values need to be known by using the different interpolation methods. The grid nodes required when using the traditional Lagrange interpolation method are represented by blue solid diamonds, whereas the grid nodes required when using the suggested MSI method are represented by cyan solid diamonds.
In terms of temporal interpolation, according to the Courant–Friedrichs–Lewy (CFL) stability condition, the time step of the SEM is proportional to the ratio between the shortest distance between two neighboring GLL points and the maximum velocity. Usually, due to the existence of the small-scale structures in the hybrid simulation, the time step of the global simulation is much larger than that of the local simulation and, thus, the time series of hybrid inputs (displacements or potentials) would require upsampling to perform the local simulation. Furthermore, to save memory, the hybrid inputs are often sparsely stored in the global simulation and then interpolated/recovered to a suitable time interval constrained by the local small-scale structures during the local simulation. Thus, temporal interpolation is also essential for calculating the hybrid inputs. Monteiller et al. (2021) proposed that the cubic B-spline interpolation is efficient for upsampling the hybrid inputs because it only requires two additions and two multiplications per sample point. However, this method would fail to recover the original hybrid inputs at a very high upsampling ratio (Zhang et al., 2017).
In this study, we focus on the error propagation of the two-step hybrid method in acoustic wave case, while the hybrid inputs are calculated using a slightly modified direct discrete differentiation method of Masson et al. (2014). In the spatial interpolation, the multi-elements spline spatial interpolation in 2D cases and globally spline spatial interpolation in 3D cases are proposed to calculate the hybrid inputs during the global simulation. In the temporal interpolation, the Fourier temporal interpolation method is introduced to record and recover the sparsely stored hybrid inputs during the global and local simulations. The article is arranged as follows. First, we present the theory of the two-step hybrid method and the proposed spatial- and temporal-refinement schemes in the methodology section. Then, we verify our methods through several 2-D and 3-D hybrid numerical simulations of the acoustic wave using SEM in the numerical experiments section.
2 Methodology
In this section, we start with a brief description of the acoustic wave equation and the fundamental concept of SEM. The principle of the two-step hybrid method and the expression of the equivalent forces of the direct discrete differentiation method are then introduced. Whereafter, we introduce the Fourier temporal interpolation method into the hybrid simulation to recover the sparsely stored hybrid inputs. Finally, we propose a different spatial interpolation method, the multi-elements spline interpolation method, which is suitable for the case that the meshing of the global and local simulations differs.
2.1 Acoustic wave equation
In this study, we only discuss the error propagation of the hybrid numerical simulation of the acoustic wave equation. We consider a velocity potential field
where
2.2 Fundamental concept of SEM
In both regional and global seismology, SEM is one of the most extensively used numerical methods to calculate seismograms in realistic Earth models (Tape et al., 2009; French and Romanowicz, 2014; Chen et al., 2015; He et al., 2015; Chen et al., 2017; Lei et al., 2020). Compared with the traditional numerical simulation methods such as FDM, which directly solves the strong form of the wave equation, SEM is implemented to solve the weak form of the wave equation. The weak form of the wave equation can be obtained by multiplying an arbitrary test function on both sides of the equation and by integrating parts over the entire domain
where
The numerical integration rule of SEM in each element is the GLL quadrature, with the GLL points serving as integral points. Let us take an example to demonstrate this integration rule. For an arbitrary continuous function
with
where
The next step is to assemble the global solution after we have specified the solution at an elemental level, and Equation (1) was converted to an ordinary differential equation (ODE), which can be expressed as
where
2.3 Principle of the two-step hybrid method
The key superiority of the two-step hybrid method is that wave propagation simulation is implemented inside the local region of interest rather than the global region that encompasses the sources and receivers. For the sake of clarity, we first specify the decomposition of the computational domain. As shown in Figure 1, the global computational domain
The global waveform tomography is in pursuit for a real 3-D Earth model across the observable frequency band, the computation cost is proportional to the minimum wavelength to the fourth power, and is still computationally prohibitive nowadays because of its large computational domain. However, in the framework of the hybrid simulation, this global simulation only needs to be run a few times if the velocity structure in the external domain is assumed to be unperturbed during the iterative box tomography. The first step is to perform a forward simulation to solve and record the global wavefield
The key process in the two-step hybrid method is the algorithm for determining the hybrid inputs, namely, equivalent forces described earlier, which are imposed into the local model to perform the local simulation. We adopted the conceptual framework proposed by Masson et al. (2014) to construct the equivalent forces. This method was proposed by introducing a spatial window function on a discrete wave equation. When we obtained the origin wavefield
where
or
We note that
and Equation (8) becomes
Here,
where
2.4 Fourier interpolation in time domain
In order to save the memory requirements, the hybrid inputs obtained during the global simulation are usually stored on disk at a relatively large time interval because the stable time steps used in numerical simulation generally are much smaller than the Nyquist sampling limit. As the time step of the local simulation, in the best case, is completely independent of the global time step. In the local simulation, the hybrid inputs are then interpolated/recovered to a suitable time step for a local target structure. However, the traditional spline interpolation method (Monteiller et al., 2021) would fail at high upsampling ratios, as shown by Zhang et al. (2017). In this section, we introduce a new scheme for sampling and saving the hybrid inputs in the time domain using the Fourier interpolation method (Schafer and Rabiner, 1973).
For a discrete time series
where
Assuming that the time step of the simulation is
A new time series
For the convenience of subsequent discussion, here, we introduce and define the meaning of a special superscript
Since the sequence
and the other half can be easily obtained from the first half because the amplitude spectrum of a signal is symmetrical at the Nyquist frequency. Once we have the amplitude spectrum
The requirement for the Fourier interpolation is that the waveform generated by numerical simulation is band-limited, which has no abrupt jump or discontinuity, and the rough sampling series
In practice, the workflow of the Fourier interpolation method for recovering hybrid inputs in the time domain consists of the following four main steps: (a) Applying a smooth window tapering window function (Hanning window used in this study) to the time series of the hybrid inputs; (b) performing a forward Fourier transform; (c) inserting (M-1)
2.5 Multi-elements spline interpolation method
In the process of box tomography, the global simulation is implemented in a 3D reference model with long wavelength (large-scale) structures. The grid size is only decided by the long wavelength. In subsequent local simulations, the model alterations at each iteration are confined within the local domain with the small-scale structures. To improve imaging resolution in the local domain, it is advisable to reduce the grid size in the local domain during the local simulations. In general, two different solvers are used for the global and local simulations, and their corresponding spatial meshing is usually inconsistent. A recent study by Clouzet et al. (2018) showed that the Lagrange interpolation method can be used to determine the hybrid inputs at the GLL nodes of a local meshing different from the global meshing. However, this method introduces spatial-interpolation error into the hybrid inputs used to regenerate the hybrid wavefield. In this subsection, we propose an improved spatial interpolation method that can effectively suppress this spatial-interpolation error.
Considering the case where the meshing of the global and local simulations differs, as pictured in Figure 2. According to Equation (10), to obtain the equivalent forces to perform the local simulation, we need to know the wavefield values
In SEM, it is natural to use the Lagrange interpolation since the interpolation weights at the GLL points of each global element are already known during the first global simulation. For example, as pictured in Figure 2, if we wish to interpolate the wavefield at the red point in the bottom right corner of the local domain, we need to find the values of the wavefield and weights at the GLL points within its corresponding global element (the blue solid diamonds), similar to computing the displacement for the station with any location. A problem with the Lagrange interpolation method is that only several GLL points within the single global element are used as interpolation points. This will affect the accuracy of the hybrid inputs, especially for the lower polynomial degree SEM, and these inaccurate hybrid inputs will lead to the hybrid waveform with large errors after accumulation in the local simulation because we need to repeatedly impose the hybrid inputs in each global forward simulation during the iterative box tomography, and finally, this error will be transferred to the inverted velocity structures.
We find that using more elements as the interpolated grid for calculating hybrid inputs can efficiently reduce this spatial error. For example, as shown in Figure 2, for a red point in the top left corner to be solved, we construct an interpolation grid that consists of GLL points from its corresponding global element and the neighboring elements (the cyan solid diamonds), and the spline interpolation method is used to calculate the wavefield values.
The cubic Bi-cubic spline interpolation is useful to solve a surface fitting problem for 2D data, which is consist of third-order polynomial pieces in grid squares. The intuitive explicit form of a third-order polynomial function can be written as (Hayes and Halliday, 1974)
with 16 unknown coefficients
where
where
This can be written in the linear matrix system as
where
where
Our new method has the advantage of having more polydirectional interpolation points in the interpolation grid, which allows the wavefield values at local GLL points to be better constrained in each direction, resulting in more accurate hybrid inputs for local simulations. To distinguish it from the traditional Lagrange interpolation method, we refer to this new method as the multi-elements spline interpolation (MSI) method.
In practice, if we solve the spline coefficients point by point over the hybrid elements, the computational cost is exceedingly large because we must repeatedly reconstruct the interpolation grid and compute the spline coefficients for each point and time step, especially in the 3D case. Another alternative method used in this study is to solve all of the points in the hybrid elements at once. The interpolation grid of this method consists of the total elements in the local domain and an additional layer of elements that encompass the local domain. This interpolation grid can be used to compute all the GLL points associated with the hybrid inputs, and, thus, the spline coefficients only need to be computed once in the global simulation. In this study, the spline coefficients are computed using the MATLAB built-in function griddedInterpolant, which can be used for N-D gridded data sets and has double precision.
3 Numerical experiments
To verify the accuracy of the proposed interpolation methods in spatial and time domains on the saving and recovery of the hybrid inputs, we conduct a series of hybrid numerical simulations using SEM in both 2D homogeneous and heterogeneous models, as well as 3D PREM model. In all numerical experiments, both the initial velocity potential
where
In the temporal interpolation experiment, we keep the same meshing and time step in the global and local simulations, while the hybrid inputs are sparsely stored in disk and then recovered to the same time step as the local simulation using the temporal interpolation method. The temporal interpolation experiment is mainly carried out in two steps. First, we calculate and store the hybrid inputs with the same time step as the local simulation and take the result of this hybrid simulation as a reference. In the second step, we calculate and store the hybrid inputs with a large time interval during the global simulation. Then, we use the different temporal interpolation methods (spline and Fourier interpolation methods) to recover them during the local simulation and compare the results to the reference result. As we use the same meshing and time step in the global and local simulations, the temporal and spatial dispersion errors of the hybrid simulation will cancel out (see a detailed demonstration in Section 3.1.1). There are no additional spatial errors because the hybrid inputs can be directly obtained without the need for spatial interpolation. Therefore, the errors of the hybrid simulation are only caused by inaccurate hybrid inputs due to temporal interpolation.
In the spatial interpolation experiment, we keep the same time step in both the hybrid simulation and stored hybrid inputs to eliminate temporal error and dispersion. We use different meshing in the global and local simulations, and the hybrid inputs in the local GLL points are calculated using the traditional Lagrange interpolation and proposed MSI method, respectively. Therefore, there are two sources of errors: different spatial dispersions in the global and local simulations and inaccurate hybrid inputs calculated using spatial interpolation.
3.1 2D hybrid numerical simulations in the homogeneous model
In the 2D homogeneous model, we set a constant P wave velocity
3.1.1 Accuracy of the two-step hybrid method
To validate the accuracy of the two-step hybrid method of Masson et al. (2014) in the presence of spatial- and temporal-dispersion errors, which are inherent characteristics generated by numerical approximation (Igel, 2017), we perform three hybrid numerical simulations with different spatial grids and time steps. We keep the same meshing between the global and the local domains, which means that the GLL points of the local domain are exactly overlapped with the global ones.
First, we perform a global simulation with meshing

FIGURE 3. Waveforms comparison between the global and local simulations and the errors with the existence of the spatial and temporal dispersions in the 2D homogeneous model. The solid black and dashed blue lines represent the waveforms of the global and local simulations, respectively. The dashed red line represents the residual waveform enlarged
We can see that although the spatial and temporal dispersion existed in the numerical simulation, the residual waveforms of the hybrid simulation are constantly zeros even if they are enlarged by the factor of
3.1.2 Validation and comparison of the Fourier interpolation method with a traditional method
We verified the accuracy of the Fourier interpolation in the time domain and compared it with the traditional spline interpolation to illustrate the improvement that can be achieved. To avoid the effect of the spatial errors caused by different meshing, we set the global and local domains with the same grid size of
First, we store the hybrid inputs with a time interval of
Figure 4 shows the resultant waveforms of different interpolation methods at upsampling ratio

FIGURE 4. Waveforms and errors of the hybrid simulations with different temporal interpolation methods in the 2D homogeneous model. The solid black line represents the waveform of the benchmark that the stored interval of the hybrid inputs equates to the time step
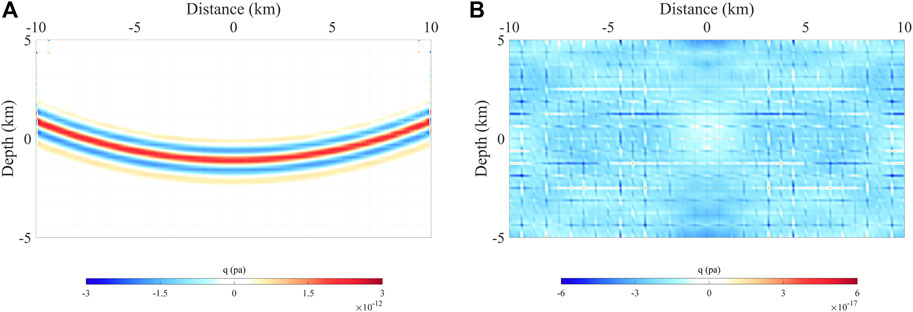
FIGURE 5. Error wavefields of the hybrid simulation with different temporal interpolation methods at the time
We based on the error ratio, the ratio of maximum error of the spline interpolation method to the Fourier interpolation method, as a proxy of the improvement of the Fourier interpolation method. We also test the error of these two interpolation methods at different upsampling ratio of
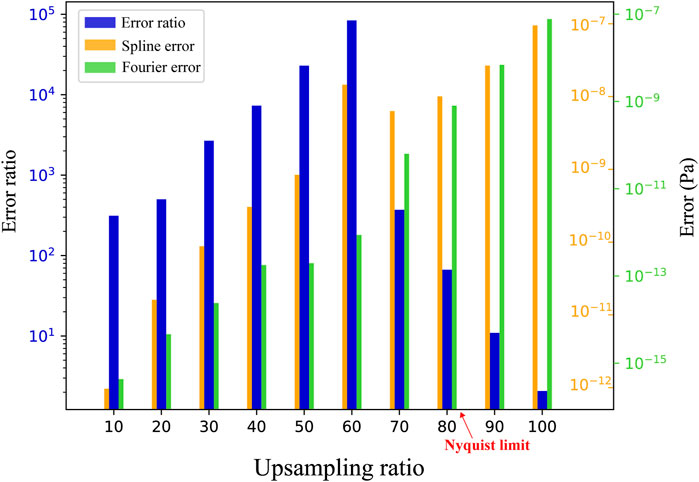
FIGURE 6. Bar chart showing the error of the spline and Fourier interpolation methods and their error ratio at different upsampling ratios of
3.1.3 Validation and comparison of the MSI method with a traditional method
For the case that the meshing of the global simulation differs from the local simulation, we run two hybrid numerical simulations in which the hybrid inputs are calculated by using the traditional Lagrange interpolation and proposed MSI method, respectively. For the MSI method, to test the influence of the number of interpolation grid points on the error, we consider two end-member models: (a) the interpolation grid consists of all of the elements in the local domain as well as an additional layer of elements that encompass the local domain; (b) the interpolation grid consists of all of the elements in the global domain. The meshing of the global domain is
Figure 7 shows the resultant waveforms of these two hybrid simulations and the corresponding residual waveforms. We can see that the resultant waveforms of the local simulation are not fully correct when the meshing of the global and local domains differs. According to Equation (25), the total error of the traditional Lagrange interpolation method is E=5.3%, while the total error of the MSI method is E=0.9%. This error is caused by spatial dispersion and inaccurate hybrid inputs. Though spatial dispersion is inevitable due to different meshing, the proposed MSI method can effectively reduce the spatial error by improving the calculation accuracy of hybrid inputs. Furthermore, the nearly identical errors of the two interpolation grids for the MSI method imply that the accuracy of the hybrid inputs is mainly constrained by its neighboring elements. Thus, it is not necessary to use more elements to improve the accuracy of the MSI method, which would increase the computational cost. Figure 8A shows the resultant wavefield of the global simulation at

FIGURE 7. Waveform comparison of the two different spatial interpolation methods in the 2D homogenous model. The solid black and dashed blue lines represent the waveforms of the global and local simulations, respectively. The dashed red line represents their enlarged residual waveform. (A) Results of the Lagrange interpolation method. (B) Results of the multi-elements spline interpolation (MSI) method. Residual1 presents the error of the MSI method that the interpolation grid consists of all of the elements in the local domain and an additional layer of elements that encompass the local domain. Residual2 presents the error of the MSI method that the interpolation grid consists of all of the elements in the global domain.
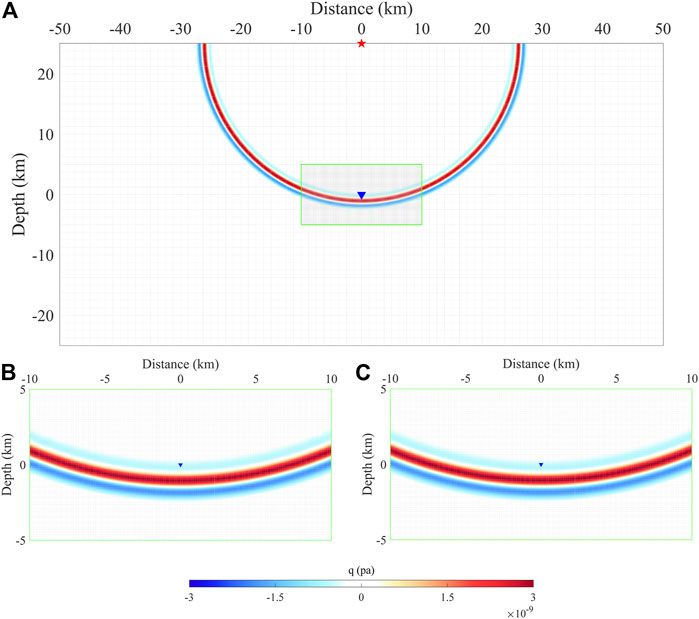
FIGURE 8. Wavefields of the global and local simulations in the 2D homogeneous model with different meshing. (A) Wavefield of the global simulation at
3.1.4 The combination of the spatial- and temporal-interpolation methods
We applied the two temporal interpolation methods when the global and local meshing differs, which also necessitates the use of spatial interpolation methods to calculate the hybrid inputs. To test the overlapped effect of the spatial errors on temporal interpolation methods, we set two models with different global meshing. In the first model, the meshing of the global domain is
In each model, the workflow is the same. In the first global simulation, we calculated the hybrid inputs using spatial Lagrange and MSI methods, respectively, and sparsely stored them with the time interval of
Figures 9A and B show the error waveforms of these local simulations relative to the first global simulation in the first model (relatively small spatial errors). The errors of traditional spline interpolation in the time domain (Figure 9A) are relatively large, and there is no discernible difference between the spatial Lagrange and MSI methods, implying that the temporal errors are dominant. In contrast, using the Fourier interpolation method in the time domain produces relatively small errors (Figure 9B), and the proposed spatial MSI method can further reduce the errors. However, in the second model, for the case that the spatial errors are too large, the results of different temporal interpolation methods are almost the same (Figures 9C and D); this means that the spatial errors are dominant, and the errors induced by time interpolation can be negligible. Thus, because the temporal interpolation method cannot reduce spatial errors, we must ensure that the stored hybrid inputs calculated using spatial interpolation methods are as accurate as possible.
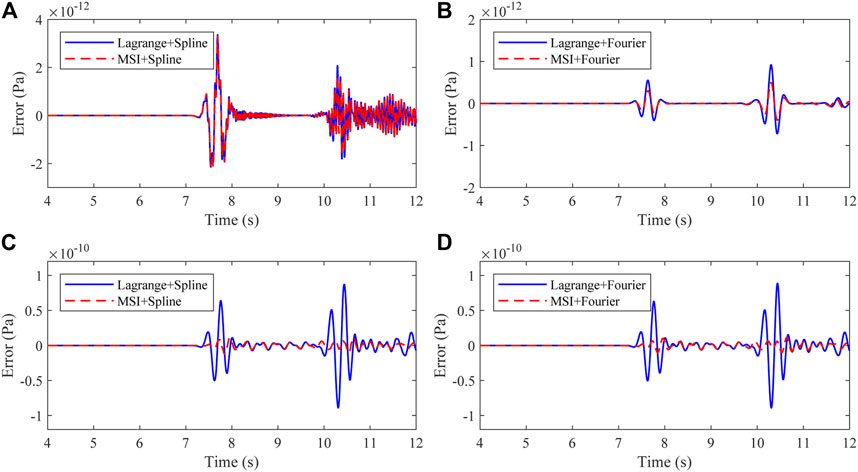
FIGURE 9. Error waveforms of hybrid simulations with different spatial- and temporal-interpolation methods. (A and B) The results in the model with eight GLL points per direction. (C and D) The results in the model with five GLL points per direction.
3.2 Validation of the MSI method in heterogeneous model
To test the stability of the proposed spatial interpolation method, the MSI method, in a complex medium, we keep a constant density
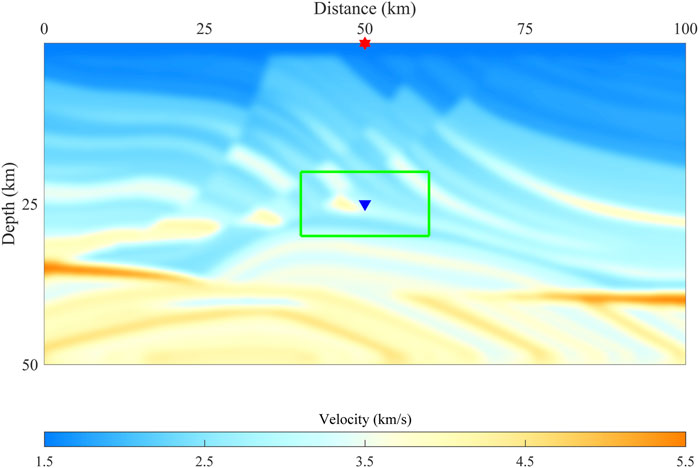
FIGURE 10. Marmousi velocity model. The red star indicates the source, the blue triangle indicates the receiver, and the green box indicates the boundary of the local model.
The workflow for this experiment is the same as it was for the previous 2D homogeneous model. First, we perform a global simulation and calculate the hybrid inputs for the local simulations by using the Lagrange interpolation and the proposed MSI methods, respectively. Next, these two hybrid inputs are imposed on the hybrid interface to serve as the sources of the local simulation.
Figures 11A shows the wavefield of the global simulation at
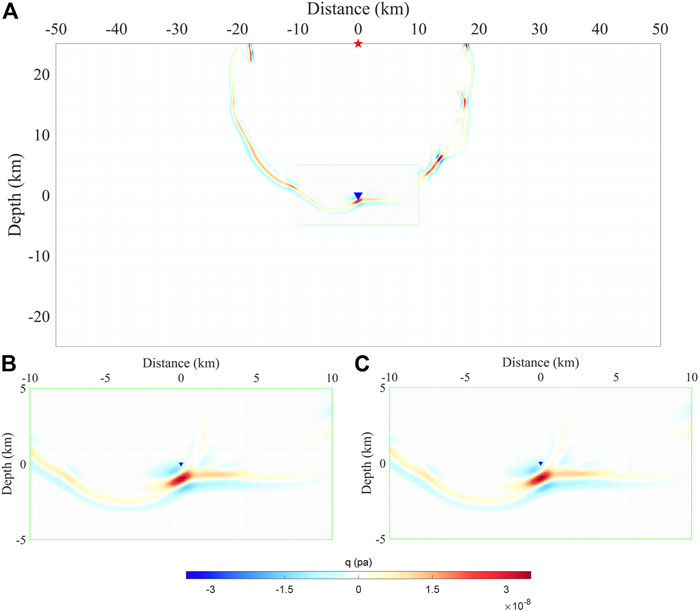
FIGURE 11. Wavefields of the global and local simulations in the 2D Marmousi model with different meshing at

FIGURE 12. Waveform comparison of the two different spatial interpolation methods in the 2D Marmousi model. The solid black and dashed blue lines represent the waveforms of the global and local simulations, respectively. The dashed red line represents their enlarged residual waveform. (A) Results of the Lagrange interpolation method. (B) Results of the MSI method.
3.3 3D hybrid numerical simulations in the PREM model
To verify the feasibility of the proposed methods, we consider a realistic 3D Earth model with the size of 200×200×100 km. The P wave velocity and density are stratified in z direction based on the PREM model section above 100 km (Figures 13A, B). In the PREM model, we removed the water layer and extended the crust layer to the surface. The local model, with the size of 50×50×40 km, is placed at the center of the global model. We set the dominant frequency of the Ricker wavelet to 0.5 Hz, which is close to the realistic frequency range in the lithosphere imaging of remote P waves. The source is in the center of the model surface, and the receiver is in the center of the entire model. To reduce the spatial dispersion in both the global and local simulations, the mesh is constructed according to the wave velocity of 3750 km/s, which is denser than the mesh according to the minimum wave velocity of 5,800 km/s in our PREM model.
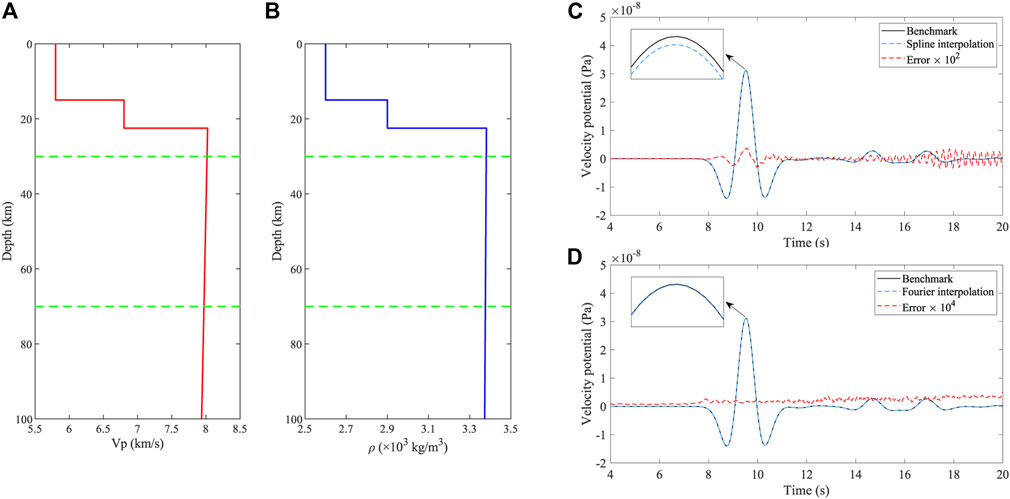
FIGURE 13. Waveforms and errors of the hybrid simulations with different temporal interpolation methods in the3D PREM model. (A) Profile of P wave velocity in the PREM model section above 100 km. (B) Profile of density in the PREM model section above 100 km. (C) Results of the spline interpolation method. The solid black line represents the waveform of the benchmark. The dashed blue line represents the resultant waveform of the temporal interpolation, and the dashed red line represents the error waveform between the blue and the black ones. (D) Results of the Fourier interpolation method.
3.3.1 Validation and comparison of the Fourier interpolation method with a traditional method
Similar to the case in the 2D homogeneous model mentioned previously, we design an experiment with different temporal interpolation methods. We set the same grid size of
Figures 13C and D show the resultant waveforms of these two methods. It is of note that the error waveform of the spline interpolation is enlarged by
3.3.2 Validation and comparison of MSI with a traditional method
We adopt different meshing between the global and local domains to test the accuracy of the proposed spatial interpolation method in the 3D realistic model. The meshing of the global domain is
Figure 14 displays the results of the traditional Lagrange interpolation and the proposed MSI methods. The total error of the Lagrange interpolation is E=0.18%, while the total error of the MSI method is E=0.03%. Because we use denser grid in the 3D model, the spatial dispersion in the 3D model is relatively small compared to the 2D cases. However, there are still large errors in the hybrid simulation, indicating that this error is primarily due to inaccurate hybrid inputs caused by spatial interpolation. The great improvement of waveform agreement validates the effectiveness of the MSI method in the 3D realistic model. Figures 15A and B show the wavefields of the global and local simulations at the time

FIGURE 14. Waveform comparison of the two different spatial interpolation methods in the 3D PREM model. The solid black and dashed blue lines represent the waveforms of the global and local simulations, respectively. The dashed red line represents their enlarged residual waveform. (A) Results of the Lagrange interpolation method. (B) Results of the MSI method.
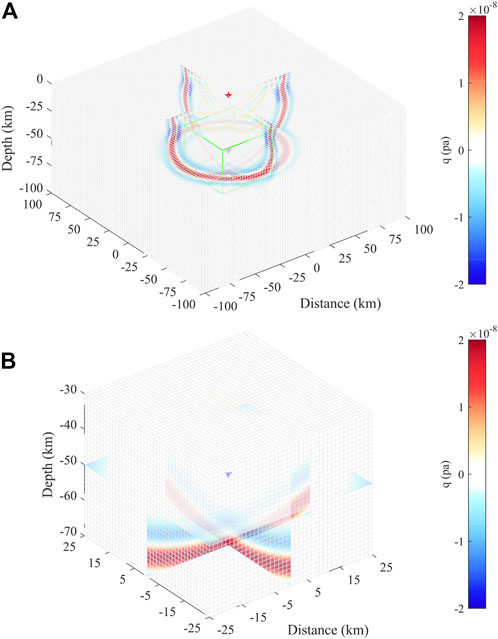
FIGURE 15. Wavefields of the hybrid simulations in the 3D PREM model at the time
4 Discussion
4.1 Error of the hybrid simulation
In this article, we first introduced the Fourier interpolation into the hybrid simulation method, which outperforms the traditional spline interpolation method at high upsampling ratios (Figure 6). The requirement for the Fourier interpolation is that the data must be band-limited below the Nyquist limit (Zhang et al., 2017). This requirement can be readily fulfilled by introducing a smooth tapering window function. In our experiments, the accuracy of the Fourier interpolation method is improved by approximately three orders of magnitude than the traditional spline method in both 2D and 3D models (Figures 4 and 13). The statistical tests also show that the Fourier interpolation method is superior to the traditional Spline interpolation method below the Nyquist limit, especially at high upsampling ratios (Figure 6). Since the Fourier interpolation is theoretically exact, the extra errors may result from the window function altering the stored hybrid inputs. In addition, the distribution of the Fourier interpolation errors (Figures 4B and 13B) is similar to random noise.
When the meshing of the global and local domains is the same, the discrete differentiation method proposed by Masson et al. (2014) is an exact hybrid numerical simulation method (Figure 3). The hybrid simulation method, in fact, is related more closely to the scattering problem, that is, the small-scale perturbation in the local model concerning the global reference model. To better imagine the local small-scale structures, we must refine the local meshing with a smaller size. For the different meshing, there are errors between the global and local simulations introduced by the inaccurate hybrid inputs due to spatial interpolation.
In the spatial experiments, the errors of the hybrid simulation result from different spatial dispersions in the global and local simulations and inaccurate hybrid inputs. The spatial dispersion is an intrinsic and inevitable property of numerical simulations, but the accuracy of the hybrid inputs can be further improved by the proposed MSI method. In the 2D homogeneous model (Figure 7), the total error of the MSI method (E=0.9%) is lower than the total error of the traditional Lagrange interpolation method (E=5.3%). In addition, we test the accuracy of the MSI method in the heterogeneous and 3D PREM models and obtain similar results (Figures 12 and 14) as in the 2D homogeneous model. This implies that our method has great potential to be applied in the realistic Earth model.
Though we use structural meshes in the simulations, the interpolation grid of the MSI method is uneven because it is built from GLL points rather than elements. Thus, this method can be naturally applied to non-structural meshes.
Importantly, in the case where the spatial and temporal errors are coupled, inaccurate spline interpolation in the time domain may further enlarge the spatial errors such that the Fourier interpolation method is necessary to minimize the errors of the hybrid simulation (Figures 9A and B). The prerequisite for both spline and Fourier interpolation methods is that the original hybrid inputs should be as accurate as possible. If the errors introduced by spatial-interpolation (Lagrange or MSI) methods are too large, there has no distinct discrepancy between the spline and Fourier interpolations in the time domain (Figures 9C and D). In other words, the spatial errors are dominant, and the temporal errors can be negligible.
Although the error of the hybrid simulation is discussed in this study, the proposed MSI method has potential applications in other fields. In many practical applications of SEM, the wavefields are not stored at all GLL points, but only the wavefields with a low sampling ratio are stored. Using the MSI method, the wavefield values at the existing GLL points can be used to construct more accurate global mean wavefields because the wavefield at each point has at least one element in each direction to constrain it. This has potential application value in the full waveform inversion. Because in the full waveform inversion, we do not need to record all the wavefields in the GLL points of unstructural meshes. Thus, based on the MSI method, we can construct an interpolation grid that encompasses the region to be interpolated and use the least squares method to invert the spline coefficients of the piecewise spline function in the entire interpolation grid. Then, we can repeatedly compute and store the wavefield at any position. In addition, for unstructural grid modeling, the MSI is also an effective local refinement scheme for interpolating wavefields from the coarse grid to the fine grid because the wavefield are always relatively smooth.
4.2 Numerical cost
The hybrid method is proposed to reduce the numerical cost by limiting the computation domain to a box region. In the forward simulation with SEM, the computational efficiency depends on the number of elements and time steps, and, thus, the efficiency ratio between the global and local simulations is approximately expressed as follows:
where
According to Equations (9) and (10), to use the hybrid method, we must know the velocity potentials exactly on the GLL points within the hybrid elements, which are used to calculated the equivalent forces in the local simulation. For a 3D local targe model buried in the deep Earth with
where
Although the spatial MSI method will increase computational complexity as more elements are used to compute the hybrid inputs, the extra computational cost can be negligible compared with the process of globally solving wave propagation. We only need to calculate and save the hybrid inputs by the MSI spatial-interpolation at a very large time interval due to the preciseness of the introduction of Fourier temporal interpolation.
It is of note that this study did not include the case that receivers are located outside the local domain. In this case, the seismic response is handled through the wavefield extrapolation method (Masson and Romanowicz, 2017b), and the associated error propagation must be discussed. Another limitation of the study is that we only consider the error propagation of hybrid numerical simulation in the acoustic case using SEM. Considerably more work, such as the elastic wave, solid-fluid coupling cases, and other numerical methods, will need to be carried out in the future.
5 Conclusion
The aim of the present research was to control the error of the two-step hybrid method while the hybrid inputs are obtained by the direct discrete differentiation method. We find that the errors exist only when the meshing of the global and local simulations differs, and we propose a new spatial interpolation method, the multi-elements spline interpolation method, that outperforms the traditional Lagrange interpolation method. In addition, to save memory requirements, we introduce the Fourier interpolation method to the hybrid method, which allows us to store hybrid inputs with a large time interval. We also tested our methods in various models, and the results indicate that our methods not only improve the accuracy of the hybrid simulation but also significantly lower the memory demand, which has a high potential for application in probing the multi-scale structures of the Earth.
Data availability statement
The raw data supporting the conclusions of this article will be made available by the authors, without undue reservation.
Author contributions
HS, XT, CL, and LZ contributed to the conception of the study. HS performed the numerical simulations and wrote the first draft. CL and XT contributed significantly to analysis and manuscript preparation. LZ helped perform the analysis with constructive discussions.
Funding
This study is supported by the National Natural Science Foundation of China (Grant nos. 41625016, 42004045, and 41888101) and the China Scholarship Council (File no. 201804910289).
Conflict of interest
The authors declare that the research was conducted in the absence of any commercial or financial relationships that could be construed as a potential conflict of interest.
Publisher’s note
All claims expressed in this article are solely those of the authors and do not necessarily represent those of their affiliated organizations, or those of the publisher, the editors, and the reviewers. Any product that may be evaluated in this article, or claim that may be made by its manufacturer, is not guaranteed or endorsed by the publisher.
References
Bielak, J., Loukakis, K., Hisada, Y., and Yoshimura, C. (2003). Domain reduction method for three-dimensional earthquake modeling in localized regions, Part I: Theory. Bull. Seismol. Soc. Am. 93 (2), 817–824. doi:10.1785/0120010251
Bozdağ, E., Peter, D., Lefebvre, M., Komatitsch, D., Tromp, J., Hill, J., et al. (2016). Global adjoint tomography: First-generation model. Geophys. J. Int. 207 (3), 1739–1766. doi:10.1093/gji/ggw356
Capdeville, Y., Chaljub, E., Vilotte, J. P., and Montagner, J. P. (2003). Coupling the spectral element method with a modal solution for elastic wave propagation in global Earth models. Geophys. J. Int. 152(1), 34–67. doi:10.1046/j.1365-246X.2003.01808.x
Capdeville, Y., and Métivier, L. (2018). Elastic full waveform inversion based on the homogenization method: Theoretical framework and 2-D numerical illustrations. Geophys. J. Int. 213 (2), 1093–1112. doi:10.1093/gji/ggy039
Chen, M., Niu, F., Liu, Q., and Tromp, J. (2015). Mantle‐driven uplift of Hangai Dome: New seismic constraints from adjoint tomography. Geophys. Res. Lett. 42 (17), 6967–6974. doi:10.1002/2015gl065018
Chen, M., Niu, F., Tromp, J., Lenardic, A., Lee, C.-T. A., Cao, W., et al. (2017). Lithospheric foundering and underthrusting imaged beneath Tibet. Nat. Commun. 8 (1), 15659–15710. doi:10.1038/ncomms15659
Clouzet, P., Masson, Y., and Romanowicz, B. (2018). Box tomography: First application to the imaging of upper-mantle shear velocity and radial anisotropy structure beneath the North American continent. Geophys. J. Int. 213 (3), 1849–1875. doi:10.1093/gji/ggy078
Cox, M. G. (1972). The numerical evaluation of B-splines. IMA J. Appl. Math. 10 (2), 134–149. doi:10.1093/imamat/10.2.134
Fichtner, A. (2010). Full seismic waveform modelling and inversion. Springer Science & Business Media.
Frankel, A. (1993). Three-dimensional simulations of ground motions in the San Bernardino Valley, California, for hypothetical earthquakes on the San Andreas fault. Bull. Seismol. Soc. Am. 83 (4), 1020–1041. doi:10.1785/bssa0830041020
Fraser, D. (1989). Interpolation by the FFT revisited-an experimental investigation. IEEE Trans. Acoust. 37 (5), 665–675. doi:10.1109/29.17559
French, S., and Romanowicz, B. A. (2014). Whole-mantle radially anisotropic shear velocity structure from spectral-element waveform tomography. Geophys. J. Int. 199 (3), 1303–1327. doi:10.1093/gji/ggu334
French, S. W., and Romanowicz, B. (2015). Broad plumes rooted at the base of the Earth's mantle beneath major hotspots. Nature 525 (7567), 95–99. doi:10.1038/nature14876
Hayes, J. G., and Halliday, J. (1974). The least-squares fitting of cubic spline surfaces to general data sets. Teach. Math. Appl. 14 (1), 89–103. doi:10.1093/teamat/14.1.89
He, Y., Wen, L., Capdeville, Y., and Zhao, L. (2015). Seismic evidence for an Iceland thermo-chemical plume in the Earth's lowermost mantle. Earth Planet. Sci. Lett. 417, 19–27. doi:10.1016/j.epsl.2015.02.028
Kelly, K. R., Ward, R. W., Treitel, S., and Alford, R. M. (1976). Synthetic seismograms: A finite-difference approach. Geophysics 41 (1), 2–27. doi:10.1190/1.1440605
Koene, E. F., Robertsson, J. O., Broggini, F., and Andersson, F. (2018). Eliminating time dispersion from seismic wave modeling. Geophys. J. Int. 213 (1), 169–180. doi:10.1093/gji/ggx563
Komatitsch, D., Barnes, C., and Tromp, J. (2000). Simulation of anisotropic wave propagation based upon a spectral element method. Geophysics 65 (4), 1251–1260. doi:10.1190/1.1444816
Komatitsch, D., and Tromp, J. (1999). Introduction to the spectral element method for three-dimensional seismic wave propagation. Geophys. J. Int. 139 (3), 806–822. doi:10.1046/j.1365-246x.1999.00967.x
Komatitsch, D., and Vilotte, J.-P. (1998). The spectral element method: An efficient tool to simulate the seismic response of 2D and 3D geological structures. Bull. Seismol. Soc. Am. 88 (2), 368–392.
Lei, W., Ruan, Y., Bozdağ, E., Peter, D., Lefebvre, M., Komatitsch, D., et al. (2020). Global adjoint tomography—Model GLAD-M25. Geophys. J. Int. 223 (1), 1–21. doi:10.1093/gji/ggaa253
Levander, A. R. (1988). Fourth-order finite-difference P-SV seismograms. Geophysics 53 (11), 1425–1436. doi:10.1190/1.1442422
Lin, C., Monteiller, V., Wang, K., Liu, T., Tong, P., and Liu, Q. (2019). High-frequency seismic wave modelling of the deep earth based on hybrid methods and spectral-element simulations: A conceptual study. Geophys. J. Int. 219 (3), 1948–1969. doi:10.1093/gji/ggz413
Lyu, C., Capdeville, Y., Al-Attar, D., and Zhao, L. (2021). Intrinsic non-uniqueness of the acoustic full waveform inverse problem. Geophys. J. Int. 226 (2), 795–802. doi:10.1093/gji/ggab134
Lyu, C., Capdeville, Y., and Zhao, L. (2020). Efficiency of the spectral element method with very high polynomial degree to solve the elastic wave equation. Geophysics 85 (1), T33–T43. doi:10.1190/geo2019-0087.1
Lyu, C., Zhao, L., and Capdeville, Y. (2022). Novel hybrid numerical simulation of the wave equation by combining physical and numerical representation theorems and a review of hybrid methodologies. JGR. Solid Earth 127, e2021JB022368. doi:10.1029/2021jb022368
Masson, Y., Cupillard, P., Capdeville, Y., and Romanowicz, B. (2014). On the numerical implementation of time-reversal mirrors for tomographic imaging. Geophys. J. Int. 196 (3), 1580–1599. doi:10.1093/gji/ggt459
Masson, Y., and Romanowicz, B. (2017a). Box tomography: Localized imaging of remote targets buried in an unknown medium, a step forward for understanding key structures in the deep earth. Geophys. J. Int. 211 (1), 141–163. doi:10.1093/gji/ggx141
Masson, Y., and Romanowicz, B. (2017b). Fast computation of synthetic seismograms within a medium containing remote localized perturbations: A numerical solution to the scattering problem. Geophys. J. Int. 208 (2), 674–692. doi:10.1093/gji/ggw412
Monteiller, V., Beller, S., Plazolles, B., and Chevrot, S. (2021). On the validity of the planar wave approximation to compute synthetic seismograms of teleseismic body waves in a 3-D regional model. Geophys. J. Int. 224 (3), 2060–2076. doi:10.1093/gji/ggaa570
Monteiller, V., Chevrot, S., Komatitsch, D., and Fuji, N. (2013). A hybrid method to compute short-period synthetic seismograms of teleseismic body waves in a 3-D regional model. Geophys. J. Int. 192 (1), 230–247. doi:10.1093/gji/ggs006
Monteiller, V., Chevrot, S., Komatitsch, D., and Wang, Y. (2015). Three-dimensional full waveform inversion of short-period teleseismic wavefields based upon the SEM–DSM hybrid method. Geophys. J. Int. 202 (2), 811–827. doi:10.1093/gji/ggv189
Oppenheim, A. V., Schafer, R. W., and Buck, J. R. (1999). Discrete-Time Signal Processing, 2nd Edition. New York: Prentice-Hall.
Replumaz, A., Kárason, H., van der Hilst, R. D., Besse, J., and Tapponnier, P. (2004). 4-D evolution of SE Asia’s mantle from geological reconstructions and seismic tomography. Earth Planet. Sci. Lett. 221 (1-4), 103–115. doi:10.1016/s0012-821x(04)00070-6
Robertsson, J. O., Blanch, J. O., and Symes, W. W. (1994). Viscoelastic finite-difference modeling. Geophysics 59 (9), 1444–1456. doi:10.1190/1.1443701
Robertsson, J. O., and Chapman, C. H. (2000). An efficient method for calculating finite-difference seismograms after model alterations. Geophysics 65 (3), 907–918. doi:10.1190/1.1444787
Sacchi, M. D., Ulrych, T. J., and Walker, C. J. (1998). Interpolation and extrapolation using a high-resolution discrete Fourier transform. IEEE Trans. Signal Process. 46 (1), 31–38. doi:10.1109/78.651165
Schafer, R. W., and Rabiner, L. R. (1973). A digital signal processing approach to interpolation. Proc. IEEE 61 (6), 692–702. doi:10.1109/proc.1973.9150
Seriani, G., and Priolo, E. (1994). Spectral element method for acoustic wave simulation in heterogeneous media. Finite Elem. analysis Des. 16 (3-4), 337–348. doi:10.1016/0168-874x(94)90076-0
Tape, C., Liu, Q., Maggi, A., and Tromp, J. (2009). Adjoint tomography of the southern California crust. Science 325 (5943), 988–992. doi:10.1126/science.1175298
Tarantola, A. (1984). Inversion of seismic reflection data in the acoustic approximation. Geophysics 49 (8), 1259–1266. doi:10.1190/1.1441754
Tarantola, A. (1988). “Theoretical background for the inversion of seismic waveforms, including elasticity and attenuation,” in Scattering and attenuations of seismic waves, part i (Springer), 365–399.
Tromp, J. (2020). Seismic wavefield imaging of Earth’s interior across scales. Nat. Rev. Earth Environ. 1 (1), 40–53. doi:10.1038/s43017-019-0003-8
Tromp, J., Tape, C., and Liu, Q. (2005). Seismic tomography, adjoint methods, time reversal and banana-doughnut kernels. Geophys. J. Int. 160 (1), 195–216. doi:10.1111/j.1365-246x.2004.02453.x
Van Der Meer, D. G., Zeebe, R. E., van Hinsbergen, D. J., Sluijs, A., Spakman, W., and Torsvik, T. H. (2014). Plate tectonic controls on atmospheric CO2 levels since the Triassic. Proc. Natl. Acad. Sci. U. S. A. 111 (12), 4380–4385. doi:10.1073/pnas.1315657111
Virieux, J., and Operto, S. (2009). An overview of full-waveform inversion in exploration geophysics. Geophysics 74 (6), WCC1–WCC26. doi:10.1190/1.3238367
Wang, Y., Chevrot, S., Monteiller, V., Komatitsch, D., Mouthereau, F., Manatschal, G., et al. (2016). The deep roots of the Western Pyrenees revealed by full waveform inversion of teleseismic P waves. Geology 44 (6), 475–478. doi:10.1130/g37812.1
Wen, L. (2002). An SH hybrid method and shear velocity structures in the lowermost mantle beneath the central Pacific and South Atlantic Oceans. J. Geophys. Res. 107 (B3), 2055–2120. doi:10.1029/2001jb000499
Wen, L., and Helmberger, D. V. (1998). A two dimensional P SV hybrid method and its application to modeling localized structures near the core mantle boundary. J. Geophys. Res. 103 (B8), 17901–17918. doi:10.1029/98jb01276
Yoshimura, C., Bielak, J., Hisada, Y., and Fernández, A. (2003). Domain reduction method for three-dimensional earthquake modeling in localized regions, part II: Verification and applications. Bull. Seismol. Soc. Am. 93 (2), 825–841. doi:10.1785/0120010252
Zhang, J., Yao, Z. J. E., and Physics, P. (2017). Exact local refinement using Fourier interpolation for nonuniform‐grid modeling. Earth Planet. Phys. 1 (1), 58–62. doi:10.26464/epp2017008
Zhang, L., and Zhang, J. (2022). Local wavefield refinement using Fourier interpolation and boundary extrapolation for finite-element method based on domain reduction method. Geophysics 87 (3), T251–T263. doi:10.1190/geo2021-0503.1
Zhao, L., Allen, R. M., Zheng, T., and Zhu, R. (2012). High‐resolution body wave tomography models of the upper mantle beneath eastern China and the adjacent areas. Geochem. Geophys. Geosyst. 13 (6). doi:10.1029/2012gc004119
Zhao, L., Wen, L., Chen, L., and Zheng, T. (2008). A two‐dimensional hybrid method for modeling seismic wave propagation in anisotropic media. J. Geophys. Res. 113 (B12), B12307. doi:10.1029/2008jb005733
Zhao, M., Capdeville, Y., and Zhang, H. (2016). Direct numerical modeling of time-reversal acoustic subwavelength focusing. Wave Motion 67, 102–115. doi:10.1016/j.wavemoti.2016.07.010
Keywords: wave propagation, hybrid simulation, full-wave inversion, acoustic wave, Fourier, interpolation, spectral element method (SEM)
Citation: Shen H, Tang X, Lyu C and Zhao L (2022) Spatial- and temporal-interpolations for efficient hybrid wave numerical simulations. Front. Earth Sci. 10:977063. doi: 10.3389/feart.2022.977063
Received: 24 June 2022; Accepted: 17 August 2022;
Published: 12 September 2022.
Edited by:
Paul Cupillard, Université de Lorraine, FranceReviewed by:
Vladimir Tcheverda, Institute of Petroleum Geology and Geophysics (RAS), RussiaVadim Monteiller, UPR7051 Laboratoire de mécanique et d’acoustique (LMA), France
Copyright © 2022 Shen, Tang, Lyu and Zhao. This is an open-access article distributed under the terms of the Creative Commons Attribution License (CC BY). The use, distribution or reproduction in other forums is permitted, provided the original author(s) and the copyright owner(s) are credited and that the original publication in this journal is cited, in accordance with accepted academic practice. No use, distribution or reproduction is permitted which does not comply with these terms.
*Correspondence: Chao Lyu, bHl1Y2hhbzE5ODhAZ21haWwuY29t
 Hao Shen
 Xiaotian Tang
 Chao Lyu
 Liang Zhao