 S. A. Carn
 N. A. Krotkov
 B. L. Fisher
 C. Li
C. Li- 1Department of Geological and Mining Engineering and Sciences, Michigan Technological University, Houghton, MI, United States
- 2Atmospheric Chemistry and Dynamics Laboratory, NASA Goddard Space Flight Center, Greenbelt, MD, United States
- 3Science Systems and Applications, Inc (SSAI), Lanham, MD, United States
- 4Earth System Science Interdisciplinary Center, University of Maryland, College Park, MD, United States
Most volcanism on Earth is submarine, but volcanic gas emissions by submarine eruptions are rarely observed and hence largely unquantified. On 15 January 2022 a submarine eruption of Hunga Tonga-Hunga Ha’apai (HTHH) volcano (Tonga) generated an explosion of historic magnitude, and was preceded by ∼1 month of Surtseyan eruptive activity and two precursory explosive eruptions. We present an analysis of ultraviolet (UV) satellite measurements of volcanic sulfur dioxide (SO2) between December 2021 and the climactic 15 January 2022 eruption, comprising an unprecedented record of Surtseyan eruptive emissions. UV measurements from the Ozone Monitoring Instrument (OMI) on NASA’s Aura satellite, the Ozone Mapping and Profiler Suite (OMPS) on Suomi-NPP, the Tropospheric Monitoring Instrument (TROPOMI) on ESA’s Sentinel-5P, and the Earth Polychromatic Imaging Camera (EPIC) aboard the Deep Space Climate Observatory (DSCOVR) are combined to yield a consistent multi-sensor record of eruptive degassing. We estimate SO2 emissions during the eruption’s key phases: the initial 19 December 2021 eruption (∼0.01 Tg SO2); continuous SO2 emissions from 20 December 2021—early January 2022 (∼0.12 Tg SO2); the 13 January 2022 stratospheric eruption (0.06 Tg SO2); and the paroxysmal 15 January 2022 eruption (∼0.4–0.5 Tg SO2); yielding a total SO2 emission of ∼0.6–0.7 Tg SO2 for the eruptive episode. We interpret the vigorous SO2 emissions observed prior to the January 2022 eruptions, which were significantly higher than measured in the 2009 and 2014 HTHH eruptions, as strong evidence for a rejuvenated magmatic system. High cadence DSCOVR/EPIC SO2 imagery permits the first UV-based analysis of umbrella cloud spreading and volume flux in the 13 January 2022 eruption, and also tracks early dispersion of the stratospheric SO2 cloud injected on January 15. The ∼0.4–0.5 Tg SO2 discharged by the paroxysmal 15 January 2022 HTHH eruption is low relative to other eruptions of similar magnitude, and a review of other submarine eruptions in the satellite era indicates that modest SO2 yields may be characteristic of submarine volcanism, with the emissions and atmospheric impacts likely dominated by water vapor. The origin of the low SO2 loading awaits further investigation but scrubbing of SO2 in the water-rich eruption plumes and rapid conversion to sulfate aerosol are plausible, given the exceptional water emission by the 15 January 2022 HTHH eruption.
1 Introduction
The majority of active volcanism on Earth (∼70%) is submarine; a realm where the eruption products are inaccessible to remote sensing techniques that use electromagnetic radiation (Schmincke, 2006). Submarine volcanic emissions thus remain largely undetected or unquantified, except in the relatively rare cases when submarine eruptions generate surface manifestations of activity such as pumice rafts or volcanic plumes that breach the ocean surface and rise into the atmosphere (e.g., Martí et al., 2013; Green et al., 2013; Jutzeler et al., 2014, 2020; Carey et al., 2018). The latter occurred in dramatic fashion during the 15 January 2022 eruption of Hunga Tonga—Hunga Ha'apai (HTHH), a submarine volcano in Tonga. The 15 January 2022 HTHH eruption, which was the culmination of an eruptive sequence that began in December 2021, produced an eruption column with overshooting tops that rose to lower mesospheric altitudes (∼55 km) (Carr et al., 2022), an umbrella cloud that rivalled the 1991 Pinatubo eruption in horizontal extent (Gupta et al., 2022), a plethora of atmospheric waves that propagated globally (Matoza et al., 2022; Wright et al., 2022), vigorous lightning, and local and distal tsunamis (Kubota et al., 2022). The highly explosive nature of the 2022 HTHH eruption was driven by violent magma-seawater interaction, and the event drew comparisons with the 1883 eruption of Krakatau (Indonesia), which produced some analogous atmospheric wave phenomena (Symons, 1888). However, the extent of magma-seawater interaction in the 1883 Krakatau eruption is still debated and may have been limited during most of the eruption sequence (e.g., Self, 1992; Madden-Nadeau et al., 2022), whereas the 2022 HTHH eruption vent was clearly submarine at the onset of the eruption on 15 January 2022. Analysis of the 2022 HTHH eruption therefore provides an unprecedented opportunity to gain insight into violent, shallow submarine eruptions, and into the potential hazards and atmospheric impacts of explosive submarine volcanism.
Here, we present an analysis of sulfur dioxide (SO2) measurements collected by ultraviolet (UV) satellite instruments during the 2021–2022 eruptive sequence at HTHH, culminating in the paroxysmal 15 January 2022 event. Our goals are to analyze SO2 emissions prior to the paroxysmal January 15 eruption, to estimate total SO2 emissions during the HTHH eruptions and aid assessment of potential impacts on the atmosphere and climate, and to gain insight into the fate of volcanic SO2 emissions during water-rich, explosive submarine eruptions. Whilst the potential for scavenging of volcanic SO2 by hydrometeors (derived from water of magmatic and atmospheric origin) and volcanic ash particles in subaerial volcanic eruption plumes is well known (e.g., Rose et al., 1995; Textor et al., 2003; Zhu et al., 2020), recent modeling work suggests that such scavenging is enhanced in submarine eruptions involving external surface water (Rowell et al., 2022). As the largest submarine explosive eruption to date in the era of UV satellite observations (since 1978), the 2022 HTHH eruption provides some unique observational constraints on these processes. We also provide a new analysis of SO2 emissions associated with other submarine volcanic eruptions in the UV satellite era to place the HTHH eruption in context.
2 2021–2022 HTHH eruption
The islands of Hunga Tonga and Hunga Ha'apai (20.536°S, 175.382°W; elevation 114 m) are the subaerial fragments of the massive, submarine Hunga volcano that rises more than 2000 m from the surrounding seafloor in the Tofua volcanic arc (Cronin et al., 2017). Prior to 2021–22, confirmed eruptions of HTHH occurred in June 1988 March 2009, and December 2014–15 (Global Volcanism Program, 2013), with the latter two eruptions including periods of island growth and erosion (Vaughan and Webley, 2010; Garvin et al., 2018). The typical eruption style of HTHH is the rarely observed Surtseyan style of activity, involving magma-seawater interaction, ephemeral island growth, and emission of volcanic plumes rich in water vapor, condensed water and fine volcanic ash, with the potential for significant scrubbing of SO2 emissions via chemical scavenging and ash sedimentation (e.g., Rowell et al., 2022).
In the intervening years between the 2014–2015 and 2021–2022 HTHH eruptions, high-resolution satellite imagery (e.g., Planet Labs, https://www.planet.com/; Planet Team, 2017) shows persistent seawater discoloration around HTHH, indicative of ongoing submarine hydrothermal activity or degassing as observed at other active submarine volcanoes (e.g., Yeo et al., 2022). However, we have not attempted to track or quantify this inter-eruptive activity here. The 2021–2022 HTHH eruption sequence began abruptly on 20 December 2021 at 09:35 local time in Tonga (20:35 UTC on December 19) with what was (at the time) a significant explosive eruption for HTHH, though this event was much smaller than the subsequent explosive eruptions in January 2022. As we document below, the December 2021 eruption was followed by a period of near-continuous Surtseyan eruptive activity and SO2 emissions that continued until early January 2022. After a 7–10 days lull in significant subaerial activity, another major explosive eruption occurred on 13 January 2022 at 15:20 UTC, followed by the paroxysmal event at 04:00 UTC on January 15.
3 Satellite data
The satellite SO2 data used here are derived from four operational UV satellite sensors: the Ozone Monitoring Instrument (OMI), operating on NASA’s Aura satellite since 2004 (Levelt et al., 2018); the Ozone Mapping and Profiler Suite (OMPS), operating on the NASA/NOAA Suomi-NPP satellite since 2012 (Carn et al., 2015); the Earth Polychromatic Imaging Camera (EPIC), observing Earth from the Deep Space Climate Observatory (DSCOVR) at the L1 Earth-Sun Lagrange point (1,000,000 miles from Earth) since 2015 (Marshak et al., 2018); and the Tropospheric Monitoring Instrument (TROPOMI), operating on ESA’s Sentinel-5 Precursor (S5P) satellite since 2017 (Veefkind et al., 2012). Some key characteristics of these instruments are given in Table 1. OMI, OMPS and TROPOMI are aboard polar-orbiting satellites and hence have daily temporal resolution at the tropical latitudes of Tonga, whereas DSCOVR/EPIC collects high cadence UV imagery and, as we demonstrate here, provides novel insight into the HTHH eruptions. During the 2021–2022 HTHH eruptions, DSCOVR was in ‘winter cadence’ mode, providing UV images every ∼110 min (Herman et al., 2018).
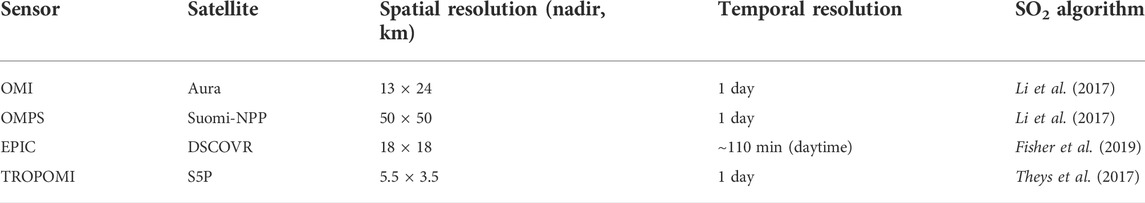
TABLE 1. UV satellite instruments.
Whilst all the UV instruments used here use backscattered UV radiation to retrieve vertical column densities (VCDs) of volcanic SO2, differences in SO2 sensitivity arise from variable spectral and spatial resolution and retrieval algorithms (Table 1). OMI, OMPS and TROPOMI are hyperspectral UV sensors capable of detecting VCDs of less than one Dobson Unit (DU; 1 DU = 2.69 × 10¹⁶ molecules cm−2) in a single pixel (Li et al., 2017; Theys et al., 2017); hence the relative sensitivity of these sensors to SO2 mass is governed mainly by pixel size. TROPOMI provides the highest spatial resolution (5.5 km × 3.5 km), followed by OMI (13 km × 24 km) and OMPS (50 km × 50 km; Table 1). DSCOVR/EPIC is a multi-spectral instrument with lower sensitivity to SO2 (∼5–10 DU per pixel; Fisher et al., 2019) but with the advantage of higher temporal resolution (Table 1). All UV SO2 retrievals require an assumption of SO2 plume altitude; current operational Level 2 (L2) SO2 products from OMI, OMPS and TROPOMI provide volcanic SO2 VCDs assuming center of mass altitudes (CMAs) of 8 km (mid-troposphere) and 18 km (lower stratosphere), the latter being most applicable to the explosive HTHH eruptions on 19 December 2021 and January 13–15, 2022 (Table 2). OMI and OMPS SO2 data also include a lower tropospheric SO2 product (CMA = 3 km), which we have used in conjunction with the mid-tropospheric products as an additional constraint on SO2 emissions from the HTHH activity in December 2021—early January 2022, which produced lower tropospheric plumes (Table 2). All DSCOVR/EPIC SO2 retrievals assume an upper tropospheric SO2 CMA of 13 km (Fisher et al., 2019). In addition to the SO2 products, we also use the EPIC UV Aerosol Index (UVAI; Carn et al., 2018) to map volcanic aerosols in the HTHH eruption clouds, where a positive UVAI indicates the presence of absorbing aerosols (e.g., volcanic ash) and a near-zero or negative UVAI indicates non-absorbing aerosols (e.g., sulfate aerosol or water/ice clouds).
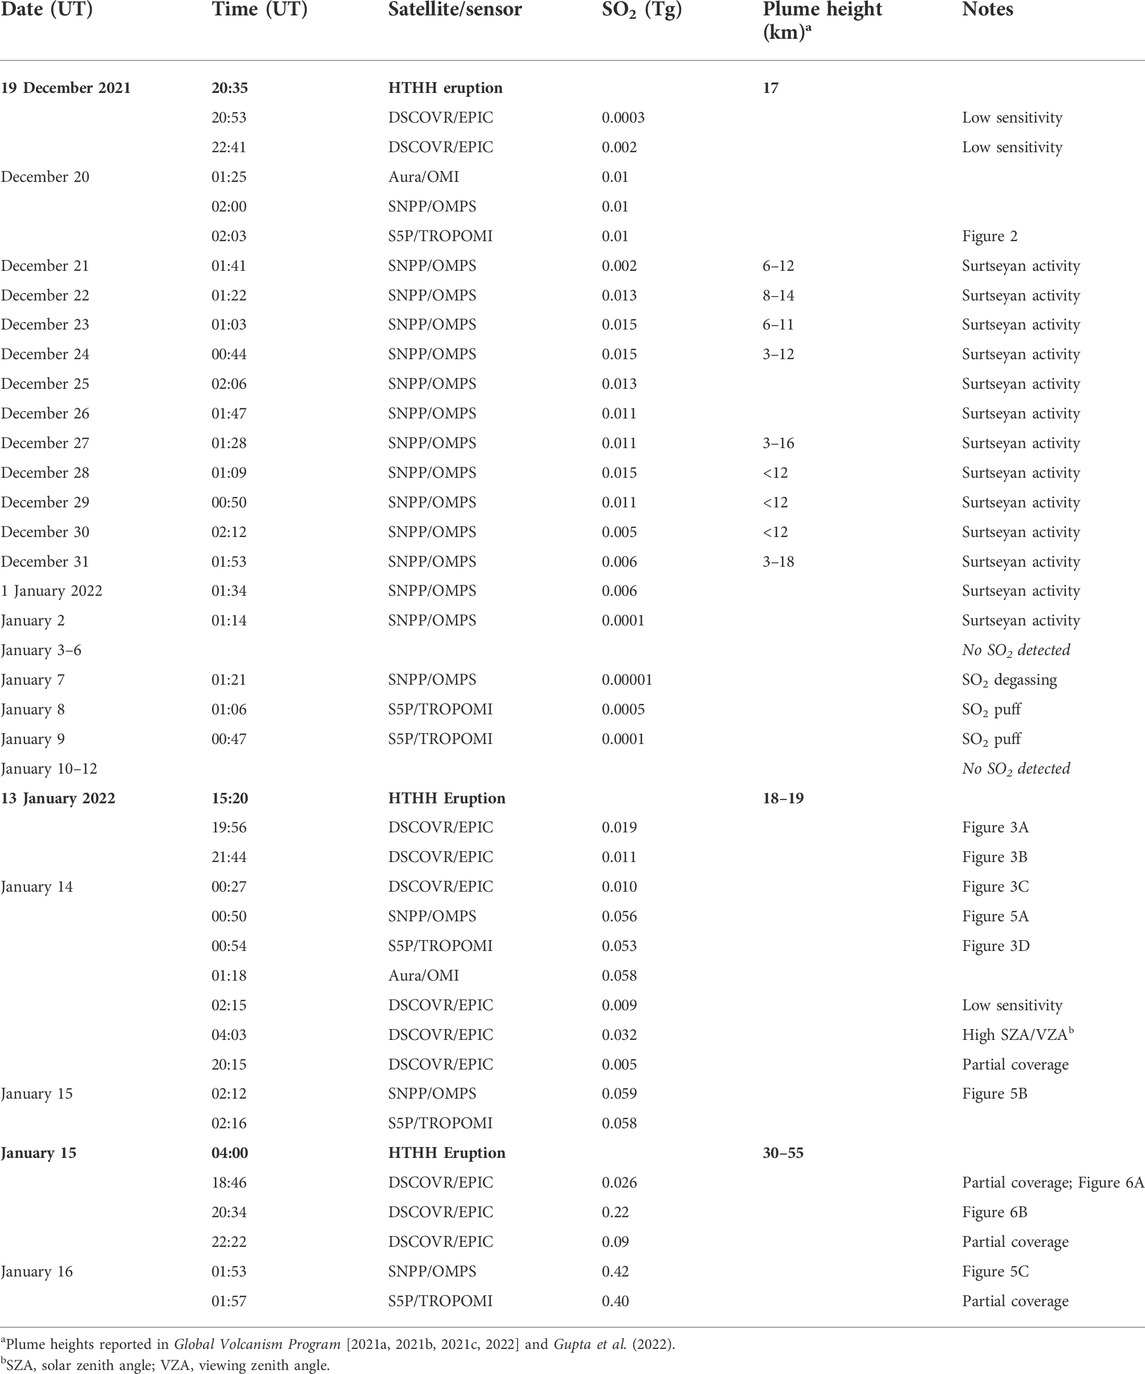
TABLE 2. Satellite measurements of SO2 emissions from HTHH during the December 2021—January 2022 eruption sequence.
The error budget for OMPS satellite SO2 measurements in the stratospheric HTHH volcanic plumes includes contributions from spectral fitting uncertainty (∼15%), differences between the assumed SO2 CMA and the actual SO2 vertical profile (∼15%), and errors associated with the omission of aerosols from the SO2 retrieval schemes (∼30%). Here, we assume a relatively large contribution from the latter based on the water-rich plume and large stratospheric aerosol loading observed soon after the 15 January 2022 HTHH eruption (e.g., Sellitto et al., 2022). Despite the significant difference between the a priori lower stratospheric CMA (18 km) and the ∼30–55 km plume height reported for the January 15 HTHH eruption (Carr et al., 2022; Gupta et al., 2022), the uncertainty related to plume height is relatively small for stratospheric SO2 clouds regardless of altitude. Based on this error budget, combining the errors in quadrature yields a total uncertainty of ∼35% on the OMPS stratospheric SO2 measurements and we assume similar errors for OMI and TROPOMI. The EPIC SO2 measurement uncertainty is larger due to the upper tropospheric CMA used in the retrievals; assuming a ∼30% error related to plume height yields a total uncertainty of ∼45%. Errors on lower tropospheric OMPS SO2 retrievals also differ due to a larger contribution from plume height uncertainty at these altitudes (potentially ∼50%), but smaller errors related to aerosols (∼15%) due to lower aerosol loading. Assuming the same contributions from spectral fitting errors (∼15%), the total uncertainty on lower tropospheric OMPS SO2 measurements is ∼54%. Finally, as mentioned earlier, we stress that all SO2 data for the HTHH eruption plumes must be evaluated in the context of potentially significant SO2 removal by hydrometeors and volcanic ash (Rowell et al., 2022), and rapid conversion of volcanic SO2 to sulfate aerosol in the water-rich plumes (Sellitto et al., 2022). A complete appraisal of the sulfur budget of the HTHH eruptions will require consideration of the sulfate aerosol component not measured by the UV satellite instruments.
All SO2 products used here are publicly available via the NASA Earthdata portal (https://search.earthdata.nasa.gov/search). We use the Version 003 OMI L2 SO2 product (OMSO2_003), the Version two OMPS Principal Component Analysis (PCA) SO2 product (OMPS_NPP_NMSO2_PCA_L2_2) and the Version two DSCOVR/EPIC SO2 product (DSCOVR_EPIC_L2_SO2_02). TROPOMI SO2 data are derived from the Offline L2 SO2 product (S5P_OFFL_L2__SO2), available from NASA Earthdata or the Sentinel-5P Pre-Operations Data Hub (https://s5phub.copernicus.eu/dhus/#/home). Measurements of SO2 emissions for other volcanic eruptions of the satellite era are derived from Version four of the NASA MEaSUREs Multi-Satellite Volcanic SO2 Level 4 Long-Term Global database (MSVOLSO2L4; Carn, 2022).
4 Results
Here, we summarize the UV satellite SO2 measurements in chronological order of the 2021–2022 HTHH eruption sequence (local time in Tonga is 13 h ahead of UTC). The SO2 measurements from OMI, OMPS, TROPOMI, and DSCOVR/EPIC analyzed here are provided in Table 2, and a subset of these SO2 data are plotted as a time-series in Figure 1.
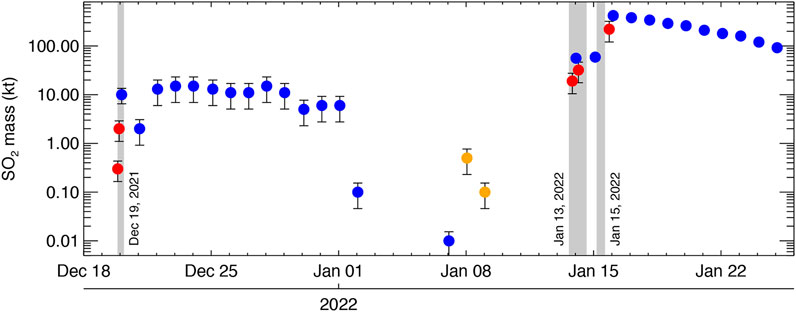
FIGURE 1. Time-series of SO2 mass [in kilotons (kt) where 1 kt = 1,000 metric tons] measured by DSCOVR/EPIC (red symbols), SNPP/OMPS (blue symbols) and S5P/TROPOMI (orange symbols) during the December 2021—January 2022 HTHH eruption sequence. For clarity, only selected data from Table 2 are plotted here. SNPP/OMPS SO2 data for January 16–26, 2022 are also included, showing the initial dispersion of the stratospheric SO2 cloud emitted by HTHH on January 15. Error bars (see Section 3) are only shown where they are larger than the symbol size. Gray shading shows the approximate durations of the HTHH eruptions on 19 December 2021, 13 January 2022, and 15 January 2022, as reported by Gupta et al. (2022).
4.1 The 20 December 2021 eruption
At the time, the eruption of HTHH at 20:35 UTC on 19 December 2021 (09:35 local time on December 20), was a significant event for the volcano, generating a steam-rich eruption plume that rose to the tropopause or lower stratosphere (∼17 km altitude; Gupta et al., 2022), accompanied by lightning, ash emissions and audible explosions (Global Volcanism Program, 2021a). Due to its high temporal resolution, DSCOVR/EPIC detected SO2 in the eruption plume as early as 20:53 UT on December 19 (∼20 min after the eruption onset; Figure 1 and Table 2), although SO2 columns were close to the detection limit. Later OMI, OMPS and TROPOMI overpasses at 01:25–02:03 UTC measured ∼0.01 Tg SO2 in the volcanic plume (Figure 2; Table 2), and the SO2 emitted by this eruption continued to be detected for several days. This confirms the upper tropospheric or lower stratospheric injection height, since SO2 lifetimes longer than ∼3 days in the tropics are characteristic of volcanic plumes at these altitudes (e.g., Carn et al., 2016).
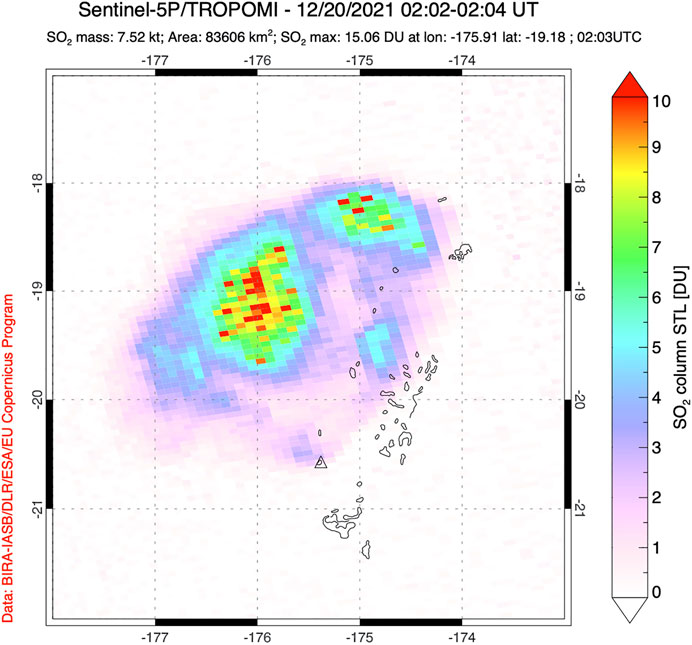
FIGURE 2. Lower stratospheric (STL) SO2 columns measured by S5P/TROPOMI in the volcanic cloud produced by the eruption of HTHH at 20:35 UTC on 19 December 2021. The S5P/TROPOMI overpass was ∼5.5 h after the eruption at 02:03 UTC on December 20. The retrieved SO2 columns (<10 DU) and the total SO2 mass (8 kilotons; ∼0.01 Tg) are both relatively low for a fresh, upper tropospheric volcanic cloud. Scale: 1° in latitude/longitude corresponds to a distance of ∼100 km.
4.2 Continuous emissions: December 2021—January 2022
Following the December 19 eruption, HTHH began a phase of continuous Surtseyan eruptive activity (Global Volcanism Program, 2021b; 2021c), accompanied by SO2 emissions, that continued until 2 January 2022 (Figure 1; Table 2). In Table 2, we report daily SO2 loadings measured in the HTHH eruption plumes by SNPP/OMPS, though similar SO2 amounts were also measured by OMI and TROPOMI. Reported plume heights during this period of activity were highly variable, ranging from lower-to upper-tropospheric altitudes (Table 2; Gupta et al., 2022). To constrain SO2 emissions during this period, we have used the lower- and mid-tropospheric OMPS SO2 products to calculate SO2 amounts, based on an assessment of bulk SO2 plume altitude derived from inspection of SO2 plume maps and winds from regional radiosondes (e.g., from Pago, American Samoa; available from http://weather.uwyo.edu/upperair/sounding.html). This analysis suggests that the peak plume altitudes reported in Table 2 were produced by transient explosions, with most of the SO2 residing at lower altitudes in the lower-to mid-troposphere.
The cumulative SO2 mass measured by OMPS in this period (21 December 2021—2 January 2022) is ∼0.12 Tg SO2, and given the water-rich, Surtseyan style of activity (with substantial scrubbing of SO2 likely) we consider this a minimum estimate of actual SO2 emissions. No SO2 emissions were detected by OMI, OMPS or TROPOMI from January 3–6, 2022, though it is possible that heavy cloud cover over Tonga at this time obscured any plumes. Weak emissions of SO2 resumed temporarily on January 7, and a few discrete ‘puffs’ of SO2 were detected by TROPOMI on January 8–9 (Figure 1; Table 2). Although the latter contribute negligible amounts to the total SO2 measured in this period, we interpret them as evidence of an at least partly ‘open’ volcanic system at this time, which may be significant in the context of the subsequent major explosive eruptions. After January 9, no further SO2 emissions were detected until the major explosive eruption on January 13. Our observations are consistent with those of Gupta et al. (2022), who found no evidence for eruption plumes rising above the meteorological cloud deck from January 1–12, 2022.
We note that the satellite SO2 observations (Figure 1) are broadly consistent with infrasound and hydrophone data reported by Matoza et al. (2022). Infrasound generated by the HTHH activity was recorded continuously from December 19–31, 2021, coincident with the strongest SO2 emissions (Figure 1; Table 2), and regular hydrophone detections of activity show a lull from January 4–13, 2022, which is also consistent with the observed decline in SO2 discharge (Figure 1), suggesting that this is genuine. Overall, we find the SO2 emissions measured in the 21 December 2021—9 January 2022 period, which were significantly higher than emissions measured at HTHH during prior eruptions in 2009 and 2014–2015 (see Section 5.1 for discussion), to be strong evidence for a significant rejuvenation of the magmatic system at HTHH prior to the January 13–15 eruptions. This period of activity also involved substantial subaerial growth of the HTHH edifice, as seen in high resolution satellite imagery (e.g., Harrison, 2022).
4.3 The 13 January 2022 eruption
The HTHH eruption at 15:20 UTC on 13 January 2022 (04:20 local time in Tonga on January 14) was larger than the 19 December 2021 event. It produced a lower stratospheric, water/ice-rich umbrella cloud that expanded to 240 km in diameter at 20 km altitude (Global Volcanism Program, 2022; Gupta et al., 2022). Geostationary satellite observations of the umbrella cloud from Himawari-8 suggest that the eruption continued for nearly 24 h (Gupta et al., 2022). Based on umbrella cloud radius alone (∼120 km), this eruption would rank as a Volcanic Explosivity Index (VEI) of 4 (Newhall and Self, 1982), and it exceeds the cloud radii observed in many VEI four magmatic eruptions of recent years (Constantinescu et al., 2021). SO2 emitted by the eruption was detected by all the UV satellite instruments, with a consistent peak total SO2 mass of ∼0.06 Tg measured by OMI, OMPS and TROPOMI (Table 2; Figure 3). Due to its lower SO2 sensitivity, DSCOVR/EPIC measured a lower total SO2 mass (∼0.03 Tg; Figure 1), but we focus here on the unique high cadence UV EPIC observations of the umbrella cloud.
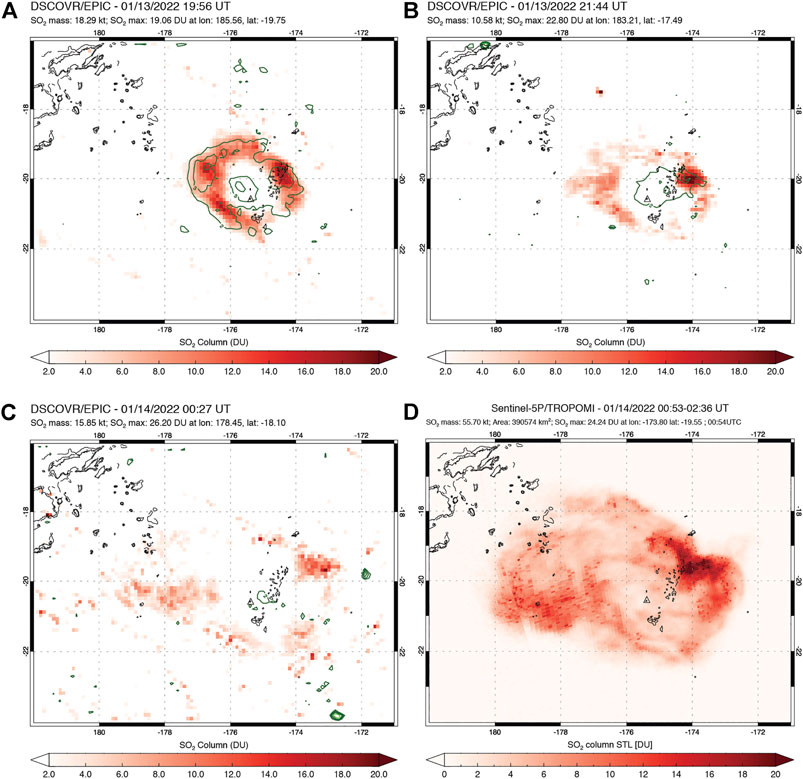
FIGURE 3. UV satellite observations of the 13 January 2022 HTHH volcanic SO2 cloud by DSCOVR/EPIC and TROPOMI. Green contours in (A–C) show the EPIC UV Aerosol Index (UVAI), where positive values indicate absorbing aerosols such as volcanic ash (note the low UVAI values in this case; UVAI ≤3). (A) DSCOVR/EPIC SO2 data at 19:56 UTC; (B) DSCOVR/EPIC SO2 data at 21:44 UTC; (C) DSCOVR/EPIC SO2 data at 00:27 UTC on January 14; (D) S5P/TROPOMI SO2 data at 00:53 UTC on January 14. Scale: 1° in latitude/longitude corresponds to a distance of ∼100 km.
DSCOVR/EPIC first detected SO2 in the January 13 eruption cloud at 19:56 UTC on January 13 (06:56 local time on January 14), ∼4.3 h after the eruption onset (Figure 3A). This first EPIC SO2 image (the first UV satellite measurement of the eruption by any sensor) shows a distinctive ring-shaped feature with SO2 only detected towards the margins of the expanding umbrella cloud, and SO2 absent or below the EPIC detection limits (∼5 DU) in the cloud core. Such an observation is highly unusual for a fresh eruption cloud, in which UV satellite measurements usually show high SO2 columns, even in prior submarine eruptions such as at Bogoslof (Alaska, United States) in 2016–2017 (Carn et al., 2018). Furthermore, the retrieved EPIC UVAI values in the volcanic cloud are relatively low (maximum UVAI = ∼3; Figure 3), suggesting that UV-absorbing volcanic ash was not dominant in the umbrella cloud. SO2 amounts in explosive eruption clouds may be underestimated in the presence of high volcanic ash loading (e.g., UVAI >10), but we reject this as a cause of the low EPIC SO2 columns in this case due to the low observed UVAI.
There are at least two plausible interpretations of the EPIC SO2 data (Figure 3). The observed SO2 distribution may be diagnostic of the water-rich, phreatomagmatic HTHH eruption in which SO2 in the plume core was significantly scrubbed or entirely stripped from the plume by co-emitted water (derived from the magma, seawater and/or entrained atmosphere), as modeled by Rowell et al. (2022). Alternatively, the EPIC SO2 observations may reflect temporally variable magmatic SO2 emissions during the eruption, e.g., due to pre-eruptive accumulation of magmatic gases (including SO2) at the top of the magma reservoir supplying the eruption. Either of these processes could also explain the spatial variation in SO2 in the umbrella cloud, with higher SO2 columns observed north-east of HTHH (Figure 3); e.g., if SO2 scrubbing was spatially variable, or if the eruption involved multiple discrete explosions releasing variable amounts of SO2. We are not able to distinguish these hypotheses with the available observations. The novel contribution of the EPIC SO2 measurements, which show radial spreading of the SO2 signal, is to confirm the presence of SO2 in the umbrella cloud (Figures 3B,C). At the time of the eruption, the closest available radiosonde soundings, from Pago (American Samoa), show easterly winds in the lower stratosphere at 20 km altitude (Supplementary Figure S1); hence the EPIC SO2 observation of SO2 spreading east (i.e., upwind) is key. The EPIC measurements of umbrella cloud expansion with no concomitant increase in SO2 mass loading (Table 2; Figure 3) strongly suggests that most of the mass added to the umbrella during the eruption was highly water-rich (and/or SO2-poor). However, the early detection of SO2 by EPIC also confirms some magmatic gas input, perhaps concentrated in the first few hours of the ∼24-h eruption via the emission of a volatile-rich cap.
Using the EPIC SO2 measurements (Table 3) it is possible to estimate the bulk volumetric flow rate (VFR) of gas, ash and entrained atmosphere (V; m3 s−1) into the eruption plume using the Woods and Kienle (1994) gravity current model of an expanding umbrella cloud at the neutral buoyancy height:
where R is the radius of the plume (estimated here as an equivalent radius
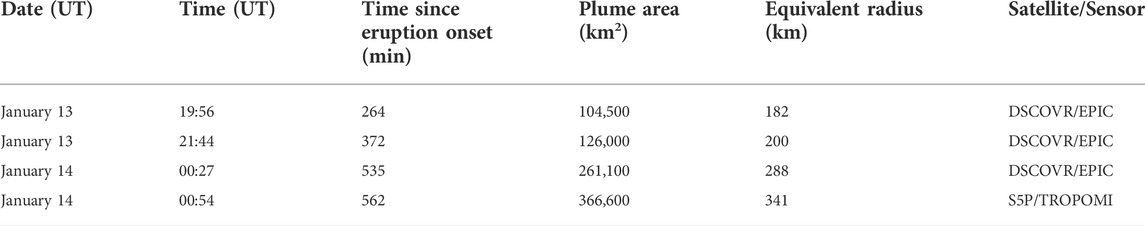
TABLE 3. Growth of the 13 January 2022 HTHH volcanic SO2 cloud observed by DSCOVR/EPIC and TROPOMI.
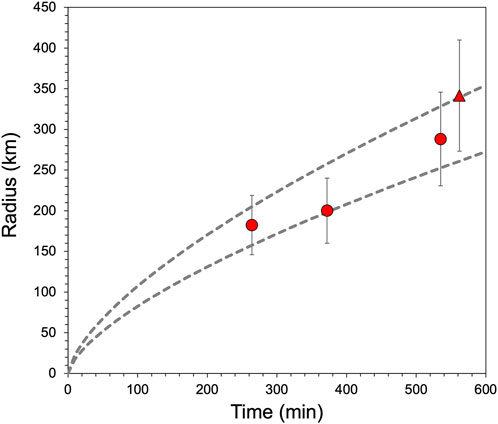
FIGURE 4. Equivalent radius of the January 13–14, 2022 HTHH umbrella cloud as observed in DSCOVR/EPIC (circles) and S5P/TROPOMI (triangle) SO2 data between 19:56 UT on January 13 and 00:54 UT on January 14. Error bars denote 20% uncertainty on the cloud radii. Gray lines show the evolution of umbrella cloud radius predicted by the Woods and Kienle [1994] model for two volumetric flow rates (VFR) that bracket the satellite observations, assuming an eruption onset at 15:32 UT on January 13. The lower and upper bounds correspond to VFRs of 6.3 and 13.8 km3 s−1, respectively.
Prior analysis of umbrella cloud growth during volcanic eruptions has been based on geostationary satellite imagery with higher temporal resolution than EPIC (e.g., Van Eaton et al., 2016; Prata et al., 2020; Gupta et al., 2022). Our study is the first attempt to use high-cadence UV imagery to analyze umbrella cloud growth, one key difference with prior work being that EPIC is sensitive to volcanic SO2, whereas IR geostationary measurements of volcanic cloud spread are based on the cloud-top brightness temperature of the bulk, opaque plume (i.e., a mixture of volcanic gas, ash, hydrometeors, etc.). We acknowledge that our analysis is limited by temporal resolution (i.e., the first EPIC SO2 observation is >4 h after the eruption onset (Figure 4), and hence missed any earlier umbrella growth phase, and EPIC’s hourly cadence is lower than geostationary sensors) and EPIC’s sensitivity (i.e., the volcanic cloud could be larger in extent than shown in the EPIC SO2 data). However, although we might expect differences between VFRs calculated using the UV and IR satellite data (as shown here) the availability of DSCOVR/EPIC SO2 data offers the potential for wider application of this technique and may provide better sensitivity to volcanic clouds under certain conditions (e.g., gas-rich and ash-poor eruptions).
4.4 The 15 January 2022 eruption
Following the January 13 eruption, the bulk of the emitted SO2 drifted west from Tonga under the influence of the easterly lower stratospheric winds (Figure 5). The presence of the January 13 SO2 cloud precludes detection of any SO2 emissions between January 13 and 15 in UV satellite imagery, but inspection of geostationary GOES-West Advanced Baseline Imager (ABI) imagery (available in NASA Worldview; https://worldview.earthdata.nasa.gov/) reveals several ‘puffs’ from HTHH, on January 14 at 18:00 UTC and 21:10 UTC, and at 02:50 UTC on January 15, shortly before the major eruption (Supplementary Video S1). Hence sporadic emissions were clearly ongoing.
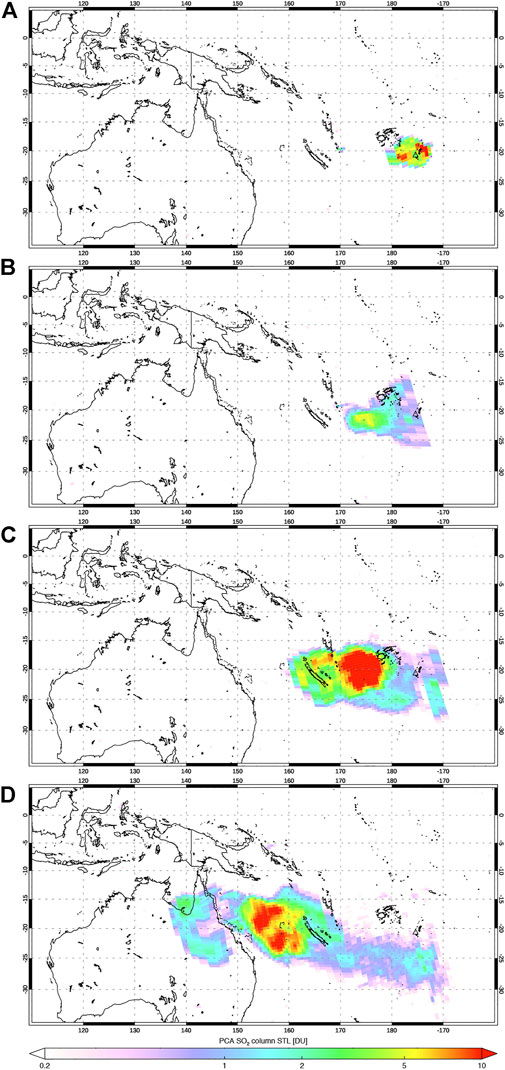
FIGURE 5. Daily SNPP/OMPS observations of HTHH SO2 emissions from January 14–17, 2022. (A) 00:50 UTC on January 14 (0.06 Tg SO2); (B) 02:12 UTC on January 15 (0.06 Tg SO2); (C) 01:53 UTC on January 16 (0.4 Tg SO2); (D) 03:16 UTC on January 17 (0.38 Tg SO2). Scale: 1° in latitude/longitude corresponds to a distance of ∼100 km.
The paroxysmal HTHH eruption occurred at ∼04:00 UTC on January 15, which is close to nightfall in Tonga (17:00 local time) and hence precluded early UV SO2 observations of the nascent eruption cloud. A DSCOVR/EPIC exposure at 04:21 UTC, just ∼20 min after the eruption, failed to detect any SO2 due to the high solar zenith angle (SZA) or simply because the cloud was too small. Hence, in contrast to the January 13 eruption, analysis of umbrella cloud spread using the EPIC SO2 data was not possible in this case. The first EPIC SO2 observation on the following day (18:46 UTC on January 15; 09:46 local time on January 16 in Tonga) captured the eastern edge of the SO2 cloud emitted by the January 15 eruption (Figure 6). The next EPIC exposure at 20:34 UTC shows a ∼200 km westward drift of the SO2 cloud in the 108 min elapsed between the measurements (Figure 6), indicating a wind speed of ∼31 m/s. Such high wind speeds were only measured at altitudes above 30 km in the Pago sounding (Supplementary Figure S2), consistent with other constraints on the injection altitude of the January 15 HTHH SO2 cloud (e.g., Carr et al., 2022; Gupta et al., 2022; Millán et al., 2022).
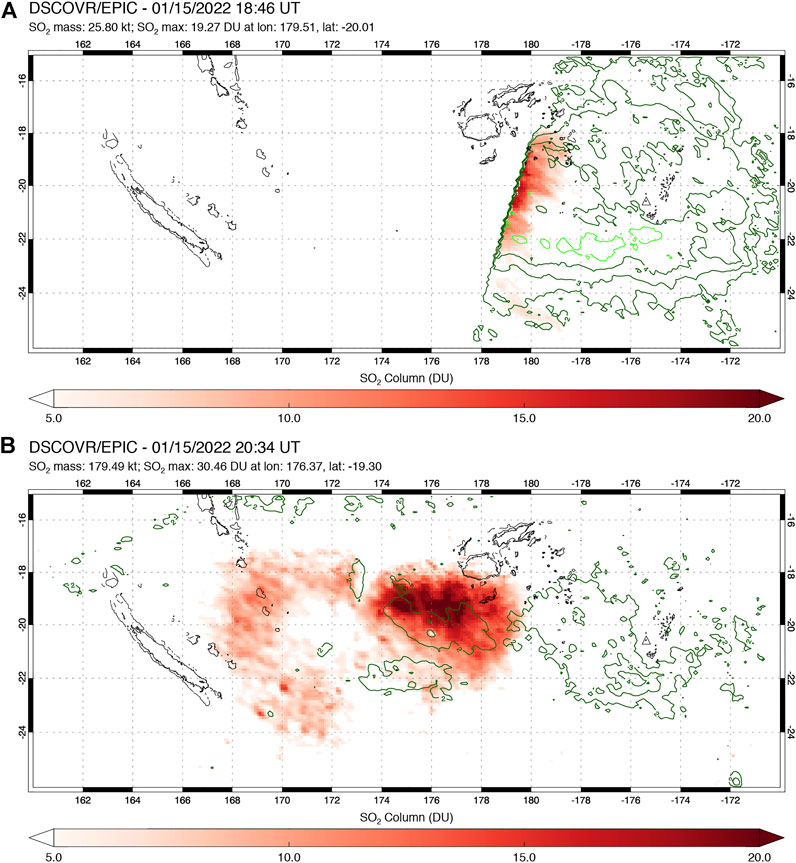
FIGURE 6. DSCOVR/EPIC observations of the 15 January 2022, HTHH eruption cloud. Green contours show the EPIC UV Aerosol Index (UVAI), where positive values indicate absorbing aerosols such as volcanic ash (but note the low UVAI values in this case). (A) Detection of the eastern edge of the plume at 18:46 UTC on January 15. The sharp boundary in the image is the terminator where the solar zenith angle becomes too high for UV measurements further west; (B) Full coverage of the volcanic SO2 cloud at 20:34 UTC on January 15. Note the ∼200 km westward drift of the SO2 cloud in the 108 min between the two EPIC exposures. Scale: 1° in latitude/longitude corresponds to a distance of ∼100 km.
Whilst the DSCOVR/EPIC data provide information on SO2 cloud transport, the total SO2 mass of ∼0.2 Tg measured by EPIC at 20:34 UTC on January 15 is an underestimate of the actual SO2 loading due to the lower SO2 VCDs than typically expected in a fresh volcanic cloud. More sensitive SNPP/OMPS observations at 01:53 UTC on January 16 measured ∼0.4 Tg SO2 in the volcanic cloud (Table 2; Figures 1, 5), though this also includes the ∼0.06 Tg SO2 emitted by the January 13 eruption, which is merged with the January 15 emissions. Very similar SO2 amounts were measured by TROPOMI (Table 2).
SNPP/OMPS tracked the stratospheric volcanic SO2 cloud produced by the January 13–15 HTHH eruptions for at least 10 days as it drifted west over Australia, the Indian Ocean and southern Africa (Figure 5; Supplementary Movie 2). Figure 7 shows the trend in SO2 mass retrieved using the OMPS data, which indicate an e-folding time of ∼6 days. This is short relative to other tropical stratospheric eruptions observed in the satellite era (e.g., Carn et al., 2016; Zhu et al., 2020). The January 15 HTHH eruption injected SO2 to altitudes of over 30 km, where we would expect SO2 lifetimes of ∼30–40 days based on the 1982 El Chichón and 1991 Pinatubo eruptions. However, the submarine, phreatomagmatic HTHH eruption differs notably from these other, magmatic, eruptions in that it also injected a huge mass of water vapor into the mid-stratosphere, estimated at ∼150 Tg H2O by Millán et al. (2022) using Aura/Microwave Limb Sounder (MLS) data. As also proposed by other studies (e.g., Zhu et al., 2022), we suspect that the relatively short lifetime of the HTHH SO2 is due to this co-emitted water vapor, which acts as a source of OH that in turn catalyzes the oxidation of SO2 to H2SO4 (sulfate) aerosol (Glaze et al., 1997).
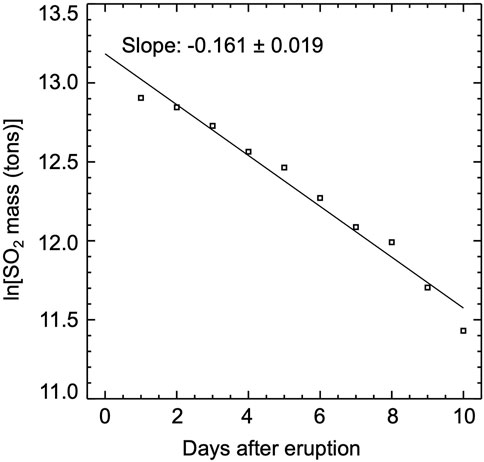
FIGURE 7. Trend in SO2 mass measured by SNPP/OMPS in the 15 January 2022 HTHH eruption cloud during 10 days of atmospheric residence. The SO2 mass e-folding time is ∼6 days, and extrapolation of the SO2 mass decay back to the eruption time yields an estimated initial SO2 mass of 0.54 Tg.
Using the observed SO2 mass decay (Figure 7) we can also estimate the initial erupted SO2 mass by extrapolating the trend back to the time of the January 15 eruption, assuming a constant decay rate. This yields an initial SO2 mass loading of ∼0.49–0.54 Tg, and subtracting the 0.06 Tg SO2 emitted on January 13 leaves 0.43–0.48 Tg SO2 produced by the January 15 eruption. This is in very good agreement with the 0.41 ± 0.02 Tg stratospheric SO2 mass measured by Aura/MLS (Millán et al., 2022) and confirms that most or all the emitted SO2 was injected into the stratosphere.
5 Discussion
5.1 Submarine volcanic eruptions of the satellite era
Here, we review available satellite measurements of SO2 emissions for reported submarine eruptions in the satellite era (since 1978) to provide context for the 2021–2022 HTHH eruptions. As of April 2022, the Smithsonian Institution’s Global Volcanism Program (GVP) reports 120 active Holocene submarine volcanoes, of which 80 have reported eruption dates and 40 last erupted since 1978 (Global Volcanism Program, 2013). Volcano elevations for the 40 submarine volcanoes that have erupted since 1978 range from −4,100 m [i.e., 4.1 km below sea level (bsl)] to 1.4 km above sea level with an average of ∼0.9 km bsl. Note that elevations above sea level refer to the small, emergent portions of some submarine volcanic edifices, whereas the eruption vents are always below sea level. Some of the submarine volcanoes [e.g., HTHH, Home Reef and Lateiki (Tonga), Fukutoku-Oka-no-Ba (Japan)] have multiple reported eruptions since 1978, and it is perhaps not surprising that these are among the shallowest and hence more likely to produce plumes that breach the surface, although modeling of condensable submarine volcanic gas jets by Cahalan and Dufek (2021) suggests that surface breaching is possible from vents as deep as 500 m below sea level.
A review of global ultraviolet (UV) satellite SO2 measurements since 1978 (Carn, 2022) reveals that ∼13 submarine eruptions (not including the 2021–2022 HTHH eruptions) were sufficiently energetic to generate plumes that breached the ocean surface and produce potentially detectable SO2 emissions (Table 4). Note that eruptions prior to 2004 were measured by the Total Ozone Mapping Spectrometer (TOMS) instruments, which had much lower sensitivity than OMI, OMPS, and TROPOMI (Carn et al., 2016). Also, no TOMS instrument was operating in June 1995, when another submarine eruption occurred at Lateiki (Tonga) (Global Volcanism Program, 2013). Table 4 includes two prior eruptions of HTHH in 2009 and 2014–15, which produced lower tropospheric plumes. One of the more remarkable events in Table 4 was the May 2010 eruption of South Sarigan seamount (CNMI), which produced a subaerial eruption column that rose to ∼12 km from an eruption vent at ∼200 m water depth (Green et al., 2013; Searcy, 2013; Embley et al., 2014). To date, this appears to be the deepest submarine eruption to have produced SO2 emissions detectable from space, although the measured SO2 mass was low [∼1 kiloton (kt)]. Indeed, in a review of subaqueous eruptions, Mastin and Witter (2000) list only two other submarine volcanoes reported to have produced surface breaching from depths of >100 m: at Kick’em Jenny (West Indies) in 1939, 1974 and 1988; and Ritter Island (Papua New Guinea) in 1972 and 1974. In these cases, the subaerial eruption columns extended only a few hundred meters above the ocean surface (Mastin and Witter, 2000). Nevertheless, the 2010 South Sarigan eruption showed that unpredictable, upper tropospheric plumes are a potential hazard of submarine eruptions, and the January 2022 HTHH eruptions demonstrate that in rare cases such plumes can penetrate deep into the stratosphere.
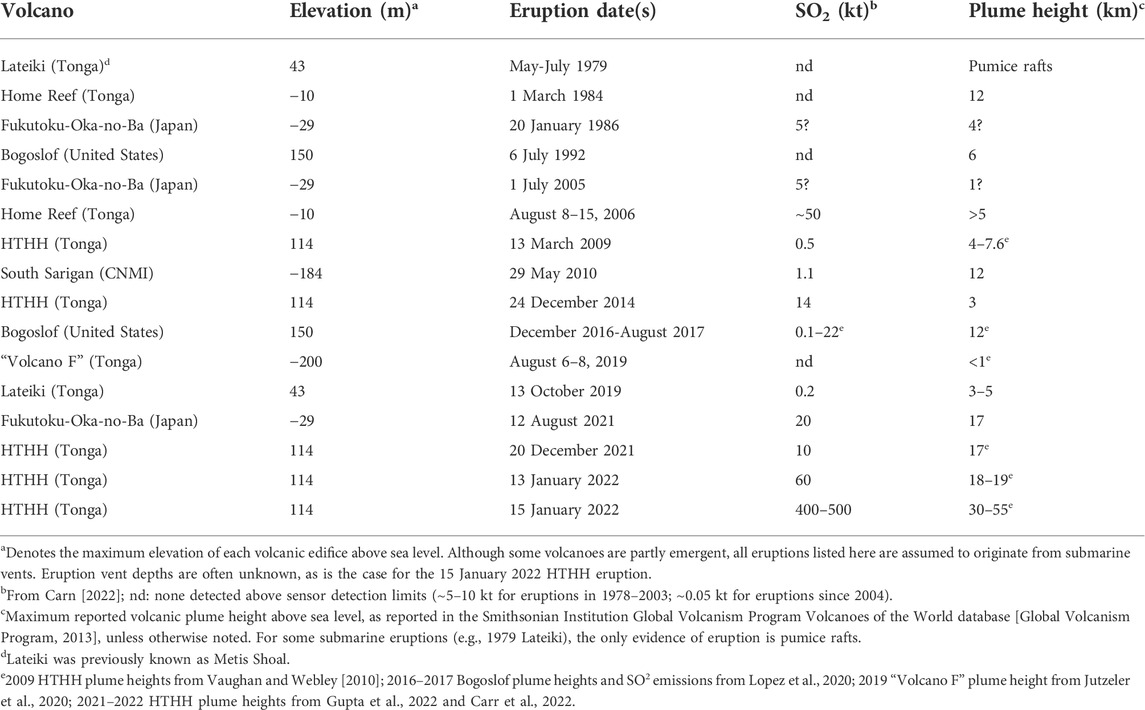
TABLE 4. Submarine volcanic eruptions in the satellite era (since 1978) with potential or confirmed subaerial plumes.
The data in Table 4 suggest that, despite the potential for upper tropospheric or stratospheric plumes, SO2 emissions from submarine eruptions are typically lower than subaerial eruptions of comparable magnitude (i.e., generating similar plume heights). This is likely due to the significant scrubbing of SO2 expected in water-rich, submarine eruption plumes. The 15 January 2022 HTHH eruption produced the highest SO2 emissions measured during a submarine eruption to date (∼0.4–0.5 Tg), and yet the SO2 mass is relatively modest given the inferred magnitude of the event (VEI 5–6). The mean SO2 yield for subaerial magmatic eruptions with VEI five is ∼2.3 Tg (Carn et al., 2016), although there have been only five eruptions of this magnitude in the satellite era to date. Based on the data in Table 4, reduced SO2 yield may be a consistent feature of submarine eruptions, with implications for their climate impacts, and making it difficult to assess the magnitude of such events based on SO2 emissions alone.
As alluded to earlier, it is also apparent from Table 4 that the SO2 emissions from HTHH in 2021–2022 were at least an order of magnitude higher than those measured during its previous eruptions in 2009 (0.0005 Tg SO2) and 2014–2015 (0.014 Tg SO2). This may be due in part to increasingly emergent (i.e., subaerial) activity since 2009, with higher SO2 fluxes due to reduced scrubbing of SO2. The abrupt onset, high altitude plume, and SO2 loading associated with the 19 December 2021 HTHH eruption, coupled with the subsequent SO2 emissions (Figure 1; Table 2), suggests that the onset of the 2021–2022 eruption sequence may have been driven by an injection of fresh magma into the volcano at shallow depths, promoting a phreatomagmatic eruption. Abrupt eruptions may also be triggered by second boiling of resident, cooling magma but are perhaps unlikely to be followed by increased SO2 emissions without fresh magma recharge. The period of continuous eruptive activity at HTHH between December 2021 and early January 2022 (emitting ∼0.12 Tg SO2; Figure 1) is particularly significant, and in retrospect is a strong indication of a rejuvenated magmatic system prior to the January 13 and 15 eruptions. Although this may not represent a true eruption ‘precursor’, it was a much clearer manifestation of increased unrest than typically seen prior to submarine eruptions; e.g., before the 2019 Lateiki submarine eruption the only precursor was an 8-months non-unique increase in hydrothermal discharge (Yeo et al., 2022).
5.2 Modest SO2 emissions in the 15 January 2022 eruption
Although the precise eruption magnitude and erupted volume remain uncertain, the 15 January 2022 HTHH eruption undoubtedly rivals the largest eruptions of the past Century or more. The maximum plume height of ∼55 km for the overshooting tops (Carr et al., 2022) is unprecedented in the satellite era, Wright et al. (2022) estimate an eruption energy yield of 10–28 Exajoules (EJ; 1 EJ =1018 J), and Matoza et al. (2022) report exceptional atmospheric Lamb wave amplitudes. Based on these metrics, the climactic 15 January 2022 HTHH explosion was likely larger than the 1991 Pinatubo eruption and comparable to the 1883 Krakatau eruption. However, the HTHH SO2 discharge (∼0.4–0.5 Tg) is ∼2 orders of magnitude lower than those eruptions, which produced ∼15–30 Tg SO2.
Although a detailed analysis is beyond the scope of this paper, there are several plausible reasons for the modest measured SO2 emission. The January 15 HTHH eruption emitted at least ∼150 Tg of water vapor (Millán et al., 2022), likely dominated by evaporated seawater but potentially also including water vapor exsolved from magma and entrained from the atmosphere. Potentially significant amounts of SO2 (and other soluble volcanic gases such as HCl) could have been scavenged by liquid water and ice particles in the water-rich HTHH plume (e.g., Textor et al., 2003; Rowell et al., 2022). The DSCOVR/EPIC observations of the January 13 eruption (Section 4.3) are potentially consistent with SO2 scavenging by water, and this was perhaps even more efficient in the January 15 plume. Aura/MLS measured only a weak enhancement in stratospheric HCl on January 16–18 (Millán et al., 2022), which is also consistent with scavenging by water. Other satellite observations of the January 15 HTHH eruption show large stratospheric aerosol optical depths (AODs) soon after the event, attributed to rapid sulfate aerosol formation (Sellitto et al., 2022), which is another sink for SO2. It is also possible that the magma driving the eruption was relatively sulfur-poor, or that sulfur outgassing was hindered by high hydrostatic pressures and premature quenching of fragmented magma before complete vesiculation, or complete suppression of magma fragmentation, which are expected in Surtseyan and other submarine eruptions (e.g., Lackschewitz et al., 1994; Colombier et al., 2018; Rowell et al., 2022). Finally, it is well-known that magma-water interaction in phreatomagmatic eruptions can generate one to two orders of magnitude greater explosion energy than magmatic eruptions (e.g., Sato and Taniguchi, 1997). Hence the magma mass supplying the HTHH eruption (i.e., the source of the emitted sulfur) could have been smaller than that erupted at Pinatubo or Krakatau, and yet could still have produced an explosion of comparable or larger size if magma-water interaction was highly efficient.
5.3 Water vapor emissions
Regardless of the origin of the modest SO2 emissions, by far the most significant atmospheric impact of the January 15 HTHH eruption is likely to be the resulting stratospheric water vapor (H2O) injection (Millán et al., 2022), which is also the probable cause of the short SO2 lifetime (Figure 7; Supplementary Video S2) (Glaze et al., 1997; Zhu et al., 2022), and will likely impact the stratospheric aerosol evolution in significant ways, e.g., by increasing aerosol size and AOD (LeGrande et al., 2016). Millán et al. (2022) estimate a stratospheric H2O loading of 146 ± 5 Tg using Aura/MLS data (∼10% of the typical stratospheric water vapor burden), but the initial water vapor injection during the January 15 eruption could have been significantly higher due to early water loss to ice in the eruption plume (Guo et al., 2004; Zhu et al., 2022). It is worth noting that the emission of ∼150 Tg H2O by a volcanic eruption would not be unprecedented; using petrological arguments, Gerlach et al. (1996) estimated that the 1991 Pinatubo eruption emitted ∼500 Tg H2O (derived from magmatic degassing and an accumulated vapor phase), although no stratospheric H2O anomaly was measured after the eruption. Guo et al. (2004) also measured an additional ∼80 Tg of ice in the young Pinatubo volcanic cloud. However, the HTHH H2O anomaly is unprecedented in its altitude (∼25–30 km), and MLS H2O measurements are the most effective way of tracking the zonal and meridional dispersion of the volcanic H2O as it disperses in the stratosphere (Figure 8).
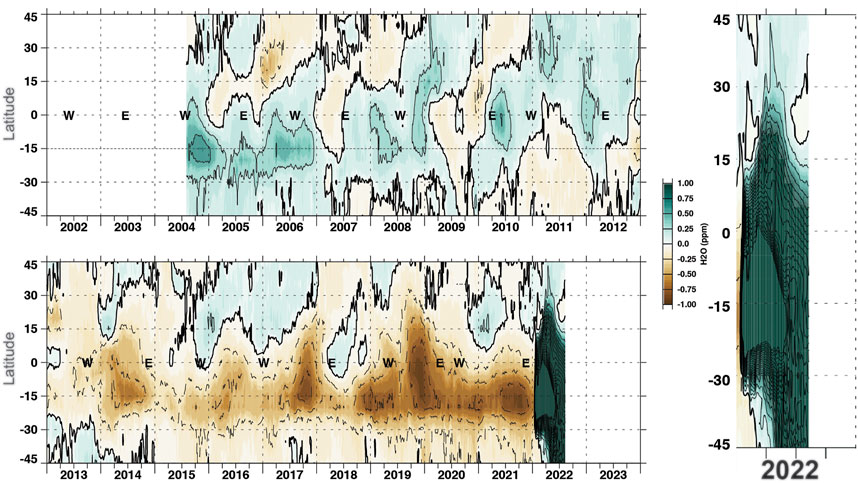
FIGURE 8. Zonal mean stratospheric water vapor at 26.1 hPa (in ppmv) vs. latitude from Aura/MLS (2004-present) showing the unprecedented stratospheric H2O anomaly due to the January 2022 HTHH eruption. The left plot shows MLS water vapor gridded into 5° latitude bins, with the annual cycle removed, missing data filled with linear interpolation, data detrended, and Gaussian smoothing applied (1/2 amplitude = 10 days) to remove higher frequency structure. The easterly (E) and westerly (W) points are as shown in the Singapore zonal winds and indicate the prevailing phase of the Quasi-biennial Oscillation (QBO) of stratospheric winds, which was easterly in January 2022. Zoom-in showing 2022 only is shown on the right. The HTHH water vapor has spread into the northern hemisphere (below ∼30°N) but most resides in the southern hemisphere. Source: NASA Goddard QBO website (P.A. Newman & N. Kramarova), https://acd-ext.gsfc.nasa.gov/Data_services/met/qbo/.
Volcanic eruptions can hydrate the stratosphere either by direct injection of H2O (as at HTHH), or by heating of the cold-point tropopause by volcanic aerosols, which increases the flux of tropospheric water into the stratosphere (Kroll et al., 2021). Work by Glaze et al. (1997) on volcanic H2O injection into the stratosphere found that larger eruption columns are dominated by magmatic water (not entrained atmospheric water), but they did not consider submarine eruptions. Based on modeling by Glaze et al. (1997), a large explosive eruption column in a wet atmosphere could inject ∼4 × 10⁹ kg H2O per hour (4 Tg/h); hence ∼24 h of continuous activity could deposit ∼100 Tg H2O into the stratosphere (equivalent to ∼100 midlatitude thunderstorms or 7% of the total stratospheric H2O). The January 2022 HTHH eruption injected at least as much H2O in a shorter timespan (∼11 h).
Actual measurements of stratospheric volcanic H2O injections are rare, and upper tropospheric volcanic H2O injections are challenging to detect due to swamping by ambient tropospheric water. Using Aura/MLS data, Sioris et al. (2016) estimated a stratospheric H2O injection of ∼2 Tg by the 2015 Calbuco (Chile) eruption (VEI 4), which was similar to short-lived (∼1 week), local stratospheric H2O perturbations observed after the 1980 Mount St. Helens (MSH) and 2008 Kasatochi eruptions. Murcray et al. (1981) measured up to ∼40 ppm H2O in the 1980 MSH eruption plume on 22 May 1980 at ∼19–20 km altitude, against a background of 20–30 ppm. There are no in-situ H2O observations for the largest eruptions of recent decades (1982 El Chichón, 1991 Pinatubo, 1991 Cerro Hudson) although, as noted by Glaze et al. (1997), Burnett and Burnett (1984) reported elevated OH radicals after the 1982 El Chichón eruption, possibly sourced from the volcanic H2O injection. Based on petrological estimates, the 1815 Tambora eruption (VEI 7) could have injected up to 2000–3,000 Tg H2O into the stratosphere, which would double the stratospheric H2O load (Glaze et al., 1997). For the ∼75 ka Toba eruption, the H2O injection could have been on the order of 27 Pg (27,000 Tg) (LeGrande et al., 2016). However, the ∼150 Tg stratospheric H2O injection by the 2022 HTHH eruption is clearly the largest such perturbation measured in the instrumental era, revealing that shallow submarine volcanic eruptions may be a previously unrecognized, yet effective (though perhaps rare) mechanism for stratospheric hydration.
5.4 Optical effects of the stratospheric volcanic cloud
Another measure of eruption magnitude and atmospheric impact is the geographical extent of the resulting atmospheric optical effects. The 15 January 2022 HTHH eruption is perhaps the largest volcanic explosion since the 1883 Krakatau eruption, and the vivid volcanic twilights, ‘blue suns and moons’ and other atmospheric phenomena observed in the months after August 1883 are well known (Symons, 1888). However, given the modest HTHH SO2 emission (∼one to two orders of magnitude less than Krakatau and Pinatubo) and the high stratospheric H2O loading, we might expect different effects in 2022 due to the distinctive stratospheric aerosol composition (fewer primary sulfate particles) and probable larger ‘hydrated’ aerosol particle size (e.g., Zhu et al., 2022; Sellitto et al., 2022). To date, this appears consistent with limited atmospheric observations from the southern hemisphere (e.g., public photos from Australia, Zimbabwe and Chile posted on the Space Weather image gallery: https://spaceweathergallery.com/index.php).
There have been no reports of blue (or otherwise unusually colored) suns or moons since the HTHH eruption, but these were observed soon (a few days to weeks) after the August 1883 Krakatau eruption (Symons, 1888). Since ‘blueing’ of the Sun or moon requires a specific stratospheric aerosol particle size of ∼0.5 µm (e.g., Garrison et al., 2021), this may tentatively be attributed to the larger size of the HTHH aerosol particles. Another atmospheric phenomenon first reported after the 1883 Krakatau eruption was the ‘Bishop’s Ring’ halo around the Sun, observed from Honolulu (Hawai’i) by the Reverend Sereno Bishop (Hamilton, 2012). A similar solar halo was observed from Zimbabwe (at a similar latitude to Tonga) throughout the day on 12 February 2022 (https://spaceweathergallery.com/indiv_upload.php?upload_id=182436). Aerosols or ice crystals at very high altitudes near the mesopause can also form noctilucent clouds, and such clouds have been observed in the aftermath of the HTHH eruption, such as this example from Chile on 30 January 2022: https://spaceweathergallery.com/indiv_upload.php?upload_id=182031. As indicated by the stratospheric H2O distribution in Figure 8, the HTHH stratospheric aerosol and H2O veil has not penetrated deep into the northern hemisphere to date, but in the coming months we might expect more atmospheric optical effects to be reported from further north as the aerosols are dispersed meridionally by the Brewer-Dobson Circulation.
The initial dispersion of the January 15 HTHH eruption cloud also bore a strong resemblance to the 1883 Krakatau eruption. After the 1883 eruption, the Krakatau volcanic aerosol cloud (and associated twilight phenomena) spread rapidly westwards from Indonesia and completed a global circuit in ∼2 weeks (Hamilton, 2012). The 1883 eruption provided the first observation of tropical stratospheric winds (the ‘Krakatoa Easterlies’) and was key to the later discovery of the phased variability in stratospheric wind direction now known as the Quasi-biennial Oscillation (QBO) (Hamilton, 2012; Figure 8). Similarly, after the 15 January 2022 HTHH eruption, the high-level stratospheric H2O anomaly at 2.1 hPa (∼45 km altitude) dispersed rapidly west under the prevailing easterly phase of the QBO, and had almost entirely circled the globe by January 22, whilst H2O at lower altitudes (26 hPa) traveled more slowly (Millán et al., 2022).
5.5 Challenges for eruption response, volcanic cloud sampling and tracking
NASA has a major volcanic eruption response plan to activate in the event of a major explosive eruption that could potentially impact climate (e.g., Carn et al., 2021). However, the 2022 HTHH eruption was unexpected in its magnitude and plume altitude (∼30–55 km) and posed unanticipated challenges for volcanic cloud sampling and eruption response (e.g., in-situ sampling). The ∼30 km altitude of the January 15 HTHH umbrella cloud, at which most volatile emissions (H2O, SO2) were emplaced, is too high for direct sampling by NASA’s high-altitude aircraft (e.g., NASA’s ER-2 has a ceiling of ∼21 km altitude), and hence direct sampling of the stratospheric volcanic gas and aerosol cloud must rely on balloon-borne campaigns (e.g., Kloss et al., 2022). Furthermore, the modest HTHH SO2 loading (but high H2O loading) defies conventional views of climate-forcing eruptions, since the NASA eruption response is primarily contingent on high SO2 loading measured by satellites (where >5 Tg SO2 indicates a potentially significant event), whereas in the HTHH case the stratospheric H2O anomaly is the more significant effect, and could lead to surface warming rather than the surface cooling expected after SO2-rich stratospheric eruptions (e.g., Joshi and Jones, 2009; Sellitto et al., 2022; Millán et al., 2022).
The 2022 HTHH eruption also comes at a turning point in NASA’s satellite observation-strategy. The agency plans to terminate its Earth Observing System flagship Terra (1999—present), Aqua (2002—present) and Aura (2004—present) missions in summer 2023 to prepare for the next generation Earth System Observatory (https://science.nasa.gov/earth-science/earth-system-observatory), although the Aura mission has sufficient fuel and solar power generation to continue operating until 2025. Termination of Aura would mean the loss of OMI SO2 and MLS H2O measurements, which would preclude monitoring of the unprecedented HTHH stratospheric H2O anomaly (Figure 8), which could persist for several years and have significant impacts on stratospheric chemistry (e.g., ozone depletion) and climate. The historic HTHH eruption therefore constitutes strong motivation for extending the Aura mission for as long as spacecraft resources permit.
6 Summary
The 15 January 2022 HTHH eruption ranks among the largest volcanic eruptions since 1883, but UV satellite observations from OMI, OMPS, TROPOMI and EPIC indicate a modest stratospheric SO2 injection of ∼0.4–0.5 Tg, consistent with other satellite measurements. A month of Surtseyan eruptive activity and precursory explosive eruptions (December 2021—January 2022) emitted an additional ∼0.2 Tg SO2, significantly exceeding SO2 emissions from prior HTHH eruptions and providing strong evidence for rejuvenation of the HTHH volcanic system prior to the paroxysmal event. The relatively low SO2 loading and short stratospheric SO2 lifetime observed after the 2022 HTHH eruptions are most likely attributed to abundant water in the volcanic plumes, which also has implications for the evolution and impacts of the stratospheric aerosols and the related optical effects.
Data availability statement
Publicly available datasets were analyzed in this study. OMI, OMPS and EPIC data can be found here: https://search.earthdata.nasa.gov/search. TROPOMI data can be found here: https://s5phub.copernicus.eu/dhus/#/home.
Author contributions
SC performed the bulk of the data analysis, created the figures and wrote the first draft of the manuscript. NK provided computing resources and data. BF generated the EPIC data products. CL provided the OMI and OMPS data and analyzed the data for Figure 7. All authors provided comments and input on the final version of the manuscript.
Funding
We acknowledge funding from the NASA Earth Science Division through the Science of Terra, Aqua and SNPP (grant 80NSSC18K0688 to CL), Aura Science Team (grant 80NSSC20K0983 to SC), DSCOVR Science Team (grant 80NSSC19K0771 to SC) and Interdisciplinary Research in Earth Science (grant 80NSSC20K1773 to SC) programs.
Acknowledgments
We also thank the two reviewers for comments that significantly improved the paper.
Conflicts of interest
Author BF is employed by the company Science Systems and Applications, Inc (SSAI).
The remaining authors declare that the research was conducted in the absence of any commercial or financial relationships that could be construed as a potential conflict of interest.
Publisher’s note
All claims expressed in this article are solely those of the authors and do not necessarily represent those of their affiliated organizations, or those of the publisher, the editors and the reviewers. Any product that may be evaluated in this article, or claim that may be made by its manufacturer, is not guaranteed or endorsed by the publisher.
Supplementary material
The Supplementary Material for this article can be found online at: https://www.frontiersin.org/articles/10.3389/feart.2022.976962/full#supplementary-material
Supplementary Figure S1 | Radiosonde sounding from Pago Pago (American Samoa) at 12:00 UTC on January 13, 2022. The y-axis units are atmospheric pressure in millibars (in blue) and equivalent altitude above sea level in meters (in black); the x-axis units are temperature (°C). Horizontal blue lines are isobars (lines of equal pressure), and vertical blue lines are isotherms (lines of equal temperature). Thick black lines on the sounding indicate the atmospheric temperature profile (right-hand line) and the dew point profile (left-hand line); when the air is saturated (100% relative humidity) the temperature equals the dew point. Inclined green, blue and purple lines show dry adiabatic lapse rates, saturated adiabatic lapse rates, and saturation mixing ratio lapse rates, respectively. Wind barbs to the right of the plot show the profile of wind speed and direction, where short barbs, long barbs and flag symbols denote wind speed increments of 5, 10 and 50 knots, respectively. Source: http://weather.uwyo.edu/upperair/sounding.html.
Supplementary Figure S2 | Radiosonde sounding from Pago Pago (American Samoa) at 00:00 UTC on January 15, 2022. The y-axis units are atmospheric pressure in millibars (in blue) and equivalent altitude above sea level in meters (in black); the x-axis units are temperature (°C). Horizontal blue lines are isobars (lines of equal pressure), and vertical blue lines are isotherms (lines of equal temperature). Thick black lines on the sounding indicate the atmospheric temperature profile (right-hand line) and the dew point profile (left-hand line); when the air is saturated (100% relative humidity) the temperature equals the dew point. Inclined green, blue and purple lines show dry adiabatic lapse rates, saturated adiabatic lapse rates, and saturation mixing ratio lapse rates, respectively. Wind barbs to the right of the plot show the profile of wind speed and direction, where short barbs, long barbs and flag symbols denote wind speed increments of 5, 10 and 50 knots, respectively. The sounding plot terminates at ∼31 km altitude but the raw data show wind speeds of up to 75 knots (39 m/s) at higher altitudes (∼32 km). Source: http://weather.uwyo.edu/upperair/sounding.html.
Supplementary Movie S1 | Animation of GOES-West Advanced Baseline Imager (ABI) GeoColor imagery (with 10-min temporal resolution) between 17:00 UTC on January 14 and 04:20 UTC on January 15, showing puffing from HTHH (at image center) prior to the January 15 eruption (the beginning of which is shown in the final frame). Imagery was visualized using NASA Worldview (https://worldview.earthdata.nasa.gov/).
Supplementary Movie S2 | Animation of SNPP/OMPS SO2 measurements from January 12–27, 2022, showing SO2 emissions from the January 13 and January 15 HTHH eruptions, and westerly transport of the stratospheric SO2 cloud.
References
Burnett, C. R., and Burnett, E. B. (1984). Observational results on the vertical column abundance of atmospheric hydroxyl: Description of its seasonal behavior 1977–1982 and of the 1982 El Chichon Perturbation. J. Geophys. Res. 89, 9603–9611. doi:10.1029/jd089id06p09603
Cahalan, R. C., and Dufek, J. (2021). Explosive submarine eruptions: The role of condensable gas jets in underwater eruptions. J. Geophys. Res. Solid Earth 126, e2020JB020969. doi:10.1029/2020JB020969
Carey, R., Adam Soule, S., Manga, M., White, J. D. L., McPhie, J., Wysoczanski, R., et al. (2018). The largest deep-ocean silicic volcanic eruption of the past century. Sci. Adv. 4, e1701121. doi:10.1126/sciadv.1701121
Carn, S. A., Clarisse, L., and Prata, A. J. (2016). Multi-decadal satellite measurements of global volcanic degassing. J. Volcanol. Geotherm. Res. 311, 99–134. doi:10.1016/j.jvolgeores.2016.01.002
Carn, S. A., Krotkov, N. A., Fisher, B. A., Li, C., and Prata, A. J. (2018). First observations of volcanic eruption clouds from the L1 Earth-Sun Lagrange point by DSCOVR/EPIC. Geophys. Res. Lett. 45, 11456–11464. doi:10.1029/2018GL079808
Carn, S. A. (2022). Multi-satellite volcanic sulfur dioxide L4 long-term global database V4. Greenbelt, MD, USA: Goddard Earth Science Data and Information Services Center GES DISC doi:10.5067/MEASURES/SO2/DATA405 (Accessed April 14 2022)
Carn, S. A., Newman, P. A., Aquila, V., Gonnermann, H., and Dufek, J. (2021). Anticipating climate impacts of major volcanic eruptions. Eos 102. doi:10.1029/2021EO162730
Carn, S. A., Yang, K., Prata, A. J., and Krotkov, N. A. (2015). Extending the long-term record of volcanic SO2 emissions with the Ozone Mapping and Profiler Suite (OMPS) nadir mapper. Geophys. Res. Lett. 42, 925–932. doi:10.1002/2014GL062437
Carr, J. L., Horváth, Á., Wu, D. L., and Friberg, M. D. (2022), Stereo plume height and motion retrievals for the record-setting Hunga Tonga- Hunga Ha'apai eruption of 15 January 2022. Geophys. Res. Lett., 49, e2022GL098131. https://doi. org/doi:10.1029/2022GL098131
Colombier, M., Scheu, B., Wadsworth, F. B., Cronin, S., Vasseur, J., Dobson, K. J., et al. (2018). Vesiculation and quenching during Surtseyan eruptions at Hunga Tonga-Hunga Ha’apai volcano, Tonga. J. Geophys. Res. Solid Earth 123, 3762–3779. doi:10.1029/2017JB015357
Constantinescu, R., Hopulele-Gligor, A., Connor, C. B., Bonadonna, C., Connor, L. J., Lindsay, J. M., et al. (2021). The radius of the umbrella cloud helps characterize large explosive volcanic eruptions. Commun. Earth Environ. 2, 3. doi:10.1038/s43247-020-00078-3
Cronin, S. J., Brenna, M., Smith, I. E. M., Barker, S. J., Tost, M., Ford, M., et al. (2017). New volcanic island unveils explosive past. Eos 98. doi:10.1029/2017EO076589
Embley, R. W., Tamura, Y., Merle, S. G., Sato, T., Ishizuka, O., Chadwick, W. W., et al. (2014). Eruption of South Sarigan seamount, Northern Mariana Islands: Insights into hazards from submarine volcanic eruptions. Oceanogr. Wash. D. C. 27 (2), 24–31. doi:10.5670/oceanog.2014.37
Fisher, B. L., Krotkov, N. A., Bhartia, P. K., Li, C., Carn, S. A., Hughes, E., et al. (2019). A new discrete wavelength backscattered ultraviolet algorithm for consistent volcanic SO2 retrievals from multiple satellite missions. Atmos. Meas. Tech. 12, 5137–5153. doi:10.5194/amt-12-5137-2019
Garrison, C., Kilburn, C., Smart, D., and Edwards, S. (2021). The blue suns of 1831: Was the eruption of Ferdinandea, near Sicily, one of the largest volcanic climate forcing events of the nineteenth century? Clim. Past. 17, 2607–2632. doi:10.5194/cp-17-2607-2021
Garvin, J. B., Slayback, D. A., Ferrini, V., Frawley, J., Giguere, C., Asrar, G. R., et al. (2018). Monitoring and modeling the rapid evolution of Earth’s newest volcanic island: Hunga Tonga Hunga Ha'apai (Tonga) using high spatial resolution satellite observations. Geophys. Res. Lett. 45, 3445–3452. doi:10.1002/2017GL076621
Gerlach, T. M., Westrich, H. R., and Symonds, R. B. (1996). “Preeruption vapor in magma of the cli- mactic mount Pinatubo eruption: Source of the giant stratospheric sulfur dioxide cloud,” in Fire and mud: Eruptions and lahars of mount Pinatubo, Philippines. Editors C. G. Newhall, and R. S. Punongbayan (Seattle, USA: University of Washington Press), 415–434. Available at: https://pubs.usgs.gov/pinatubo/index.html.
Glaze, L. S., Baloga, S. M., and Wilson, L. (1997). Transport of atmospheric water vapor by volcanic eruption columns. J. Geophys. Res. 102 (D5), 6099–6108. doi:10.1029/96jd03125
Green, D. N., Evers, L. G., Fee, D., Matoza, R. S., Snellen, M., Smets, P., et al. (2013). Hydroacoustic, infrasonic and seismic monitoring of the submarine eruptive activity and sub-aerial plume generation at South Sarigan, May 2010. J. Volcanol. Geotherm. Res. 257, 31–43. doi:10.1016/j.jvolgeores.2013.03.006
Guo, S., Rose, W. I., Bluth, G. J. S., and Watson, I. M. (2004). Particles in the great Pinatubo volcanic cloud of June 1991: The role of ice. Geochem. Geophys. Geosyst. 5, Q05003. doi:10.1029/2003GC000655
Gupta, A. K., Bennartz, R., Fauria, K. E., and Mittal, T. (2022). Timelines of plume characteristics of the Hunga Tonga-Hunga Ha'apai eruption sequence from 19 December 2021 to 16 January 2022: Himawari-8 observations. Earth Space Sci. Open ’rchive. doi:10.1002/essoar.10510853.2
Hamilton, K. (2012). Sereno Bishop, Rollo Russell, Bishop’s Ring and the discovery of the “Krakatoa Easterlies”. Atmosphere-Ocean 50 (2), 169–175. doi:10.1080/07055900.2011.639736
Harrison, T. (2022). Expanding islands in the south pacific. San Francisco, California, United States: Planet Labs Stories. Available at: https://www.planet.com/pulse/expanding-islands-in-the-south-pacific/.
Herman, J., Huang, L., McPeters, R., Ziemke, J., Cede, A., and Blank, K. (2018). Synoptic ozone, cloud reflectivity, and erythemal irradiance from sunrise to sunset for the whole Earth as viewed by the DSCOVR spacecraft from the Earth-Sun Lagrange 1 orbit. Atmos. Meas. Tech. 11 (1), 177–194. doi:10.5194/amt-11-177-2018
Joshi, M. M., and Jones, G. S. (2009). The climatic effects of the direct injection of water vapour into the stratosphere by large volcanic eruptions. Atmos. Chem. Phys. 9 (16), 6109–6118. doi:10.5194/acp-9-6109-2009
Jutzeler, M., Marsh, R., Carey, R. J., White, J. D. L., Talling, P. J., and Karlstrom, L. (2014). On the fate of pumice rafts formed during the 2012 Havre submarine eruption. Nat. Commun. 5, 3660. doi:10.1038/ncomms4660
Jutzeler, M., Marsh, R., van Sebille, E., Mittal, T., Carey, R. J., Fauria, K. E., et al. (2020), Ongoing dispersal of the 7 August 2019 pumice raft from the Tonga arc in the southwestern Pacific Ocean. Geophys. Res. Lett., 47(5), e1701121, https://doi. org/doi:10.1029/2019GL086768
Kloss, C., Sellitto, P., Renard, J.-B., Baron, A., Begue, N., Legras, B., et al. (2022). Aerosol characterization of the stratospheric plume from the volcanic eruption at Hunga Tonga January 15th 2022. Earth Space Sci. Open Archive. doi:10.1002/essoar.10511312.1
Kroll, C. A., Dacie, S., Azoulay, A., Schmidt, H., and Timmreck, C. (2021). The impact of volcanic eruptions of different magnitude on stratospheric water vapor in the tropics. Atmos. Chem. Phys. 21, 6565–6591. doi:10.5194/acp-21-6565-2021
Kubota, T., Saito, T., and Nishida, K. (2022). Global fast-traveling tsunamis driven by atmospheric Lamb waves on the 2022 Tonga eruption. Science 377, 91–94. doi:10.1126/science.abo4364
Lackschewitz, K. S., Dehn, J., and Wallrabe-Adams, H.-J. (1994). Volcaniclastic sediments from mid-oceanic Kolbeinsey Ridge, north of Iceland: Evidence for submarine volcanic fragmentation processes. Geol. 22 (11), 975–978. doi:10.1130/0091-7613(1994)022<0975:vsfmok>2.3.co;2
LeGrande, A. N., Tsigaridis, K., and Bauer, S. E. (2016). Role of atmospheric chemistry in the climate impacts of stratospheric volcanic injections. Nat. Geosci. 9, 652–655. doi:10.1038/ngeo2771
Levelt, P., Joiner, J., Tamminen, J., Veefkind, J. P., Bhartia, P. K., Stein Zweers, D. C., et al. (2018). The Ozone Monitoring Instrument: Overview of 14 years in space. Atmos. Chem. Phys. 18, 5699–5745. doi:10.5194/acp-18-5699-2018
Li, C., Krotkov, N. A., Carn, S. A., Zhang, Y., Spurr, R. J. D., and Joiner, J. (2017). New-generation NASA Aura Ozone Monitoring Instrument volcanic SO2 dataset: Algorithm description, initial results, and continuation with the Suomi-NPP Ozone Mapping and Profiler Suite. Atmos. Meas. Tech. 10, 445–458. doi:10.5194/amt-10-445-2017
Lopez, T., Clarisse, L., Schwaiger, H., Van Eaton, A., Loewen, M., Fee, D., et al. (2020). Constraints on eruption processes and event masses for the 2016–2017 eruption of Bogoslof volcano, Alaska, through evaluation of IASI satellite SO2 masses and complementary datasets. Bull. Volcanol. 82, 17. doi:10.1007/s00445-019-1348-z
Madden-Nadeau, A. L., Cassidy, M., Pyle, D., Mather, T., Watt, S., Engwell, S., et al. (2022). The magmatic and eruptive evolution of the 1883 caldera-forming eruption of Krakatau: Integrating field- to crystal-scale observations. J. Volcanol. Geotherm. Res. 411, 107176. doi:10.1016/j.jvolgeores.2021.107176
Marshak, A., Herman, J., Szabo, A., Blank, K., Cede, A., Carn, S., et al. (2018). Earth observations from DSCOVR/EPIC instrument. Bull. Am. Meteorol. Soc. 99 (9), 1829–1850. doi:10.1175/BAMS-D-17-0223.1
Martí, J., Pinel, V., Lõpez, C., Geyer, A., Abella, R., Tárraga, M., et al. (2013). Causes and mechanisms of the 2011–2012 El Hierro (Canary Islands) submarine eruption. J. Geophys. Res. Solid Earth 118 (3), 823–839. doi:10.1002/jgrb.50087
Mastin, L. G., and Witter, J. B. (2000). The hazards of eruptions through lakes and seawater. J. Volcanol. Geotherm. Res. 97, 195–214. doi:10.1016/S03770273(99)00174-2
Matoza, R. S., Fee, D., Assink, J. D., Iezzi, A. M., Green, D. N., Kim, K., et al. (2022). Atmospheric waves and global seismoacoustic observations of the January 2022 Hunga eruption, Tonga. Science 377, 95–100. doi:10.1126/science.abo7063
May, R. M., Arms, S. C., Marsh, P., Bruning, E., Leeman, J. R., Goebbert, K., et al. (2022). MetPy: A Python package for meteorological data, unidata. Available at: https’//github.com/Unidata/MetPy. doi:10.5065/D6WW7G29
Millán, L., Santee, M. L., Lambert, A., Livesey, N. J., Werner, F., Schwartz, M. J., et al. (2022), The Hunga Tonga-Hunga Ha'apai hydration of the stratosphere. Geophys. Res. Lett., 49, e2022GL099381, https://doi. org/doi:10.1029/2022GL099381
Murcray, D. G., Murcray, F. J., Barker, D. B., and Mastenbrook, H. J. (1981). Changes in stratospheric water vapor associated with the Mount St. Helens eruption. Science 211, 823–824. doi:10.1126/science.211.4484.823
Newhall, C. G., and Self, S. (1982). The volcanic explosivity index (VEI): An estimate of explosive magnitude for historical volcanism. J. Geophys. Res. 87, 1231–1238. doi:10.1029/jc087ic02p01231
Planet Team (2017). “Planet application program interface: In space for life on Earth. San Francisco, CA: Planet Labs. Available at: https://api.planet.com.
Prata, A. T., Folch, A., Prata, A. J., Biondi, R., Brenot, H., Cimarelli, C., et al. (2020). Anak Krakatau triggers volcanic freezer in the upper troposphere. Sci. Rep. 10, 3584. doi:10.1038/s41598-020-60465-w
Rose, W. I., Delene, D. J., Schneider, D. J., Bluth, G. J. S., Krueger, A. J., Sprod, I., et al. (1995). Ice in the 1994 Rabaul eruption cloud: Implications for volcano hazard and atmospheric effects. Nature 375, 477–479. doi:10.1038/375477a0
Rowell, C. R., Jellinek, A. M., Hajimirza, S., and Aubry, T. J. (2022). External surface water influence on explosive eruption dynamics, with implications for stratospheric sulfur delivery and volcano-climate feedback. Front. Earth Sci. 10, 788294. doi:10.3389/feart.2022.788294
Sato, H., and Taniguchi, H. (1997). Relationship between crater size and ejecta volume of recent magmatic and phreato-magmatic eruptions: Implications for energy partitioning. Geophys. Res. Lett. 24 (3), 205–208.
Searcy, C. (2013). Seismicity associated with the May 2010 eruption of South Sarigan seamount, Northern Mariana Islands. Seismol. Res. Lett. 84 (6), 1055–1061. doi:10.1785/0220120168
Self, S. (1992). Krakatau revisited: The course of events and interpretation of the 1883 eruption. GeoJournal 28, 109–121. doi:10.1007/BF00177223
Sellitto, P., Podglajen, A., and Belhadji, R. (2022), The unexpected radiative impact of the Hunga Tonga eruption of January 15th, 2022, 18 April 2022, PREPRINT (Version 1) available at Research Square, doi:10.21203/rs.3.rs-1562573/v1
Global Volcanism Program (2021a). “Report on Hunga Tonga-Hunga Ha'apai (Tonga),” in Weekly volcanic activity report, 15 December-21 December 2021. Editor S. K. Sennert (Washington, DC, United States: Smithsonian Institution and US Geological Survey). https://volcano.si.edu/showreport.cfm?wvar=GVP.WVAR20211215-243040.
Global Volcanism Program (2021b). “Report on Hunga Tonga-Hunga Ha'apai (Tonga),” in Weekly volcanic activity report, 22 December-28 December 2021. Editor S. K. Sennert (Washington, DC, United States: Smithsonian Institution and US Geological Survey). https://volcano.si.edu/showreport.cfm?wvar=GVP.WVAR20211222-243040.
Global Volcanism Program (2021c). “Report on Hunga Tonga-Hunga Ha'apai (Tonga),” in Weekly volcanic activity report, 29 December-4 January 2022. Editor S. K. Sennert (Washington, DC, United States: Smithsonian Institution and US Geological Survey). https://volcano.si.edu/showreport.cfm?wvar=GVP.WVAR20211229-243040.
Global Volcanism Program (2022). “Report on Hunga Tonga-Hunga Ha'apai (Tonga),” in Weekly volcanic activity report, 12 January-18 January 2022. Editor S. K. Sennert (Washington, DC, United States: Smithsonian Institution and US Geological Survey). https://volcano.si.edu/showreport.cfm?wvar=GVP.WVAR20220112-243040.
Sioris, C. E., Malo, A., McLinden, C. A., and D’Amours, R. (2016). Direct injection of water vapor into the stratosphere by volcanic eruptions. Geophys. Res. Lett. 43, 7694–7700. doi:10.1002/2016GL069918
Suzuki, Y. J., and Koyaguchi, T. (2009). A three-dimensional numerical simulation of spreading umbrella clouds. J. Geophys. Res. 114, B03209. doi:10.1029/2007JB005369
G. J. Symons (Editor) (1888). (London, U.K: Report of the Krakatoa Committee of the Royal Society. Royal Society).The Eruption of Krakatoa, and subsequent phenomena.
Textor, C., Graf, H.-F., Herzog, M., and Oberhuber, J. M. (2003). Injection of gases into the stratosphere by explosive volcanic eruptions. J. Geophys. Res. 108 (D19), 4606. doi:10.1029/2002JD002987
Theys, N., De Smedt, I., Yu, H., Danckaert, T., van Gent, J., Hormann, C., et al. (2017). Sulfur dioxide retrievals from TROPOMI onboard Sentinel-5 Precursor: Algorithm theoretical basis. Atmos. Meas. Tech. 10, 119–153. doi:10.5194/amt-10-119-2017
Van Eaton, A. R., Amigo, Á., Bertin, D., Mastin, L. G., Giacosa, R. E., González, J., et al. (2016). Volcanic lightning and plume behavior reveal evolving hazards during the April 2015 eruption of Calbuco volcano, Chile. Geophys. Res. Lett. 43, 3563–3571. doi:10.1002/2016GL068076
Vaughan, R. G., and Webley, P. (2010). Satellite observations of a surtseyan eruption: Hunga Ha'apai, Tonga. J. Volcanol. Geotherm. Res. 198 (1–2), 177–186. doi:10.1016/j.jvolgeores.2010.08.017
Veefkind, J. P., Aben, I., McMullan, K., Forster, H., de Vries, J., Otter, G., et al. (2012). TROPOMI on the ESA Sentinel-5 Precursor: A GMES mission for global observations of the atmospheric composition for climate, air quality and ozone layer applications. Remote Sens. Environ. 120, 70–83. doi:10.1016/j.rse.2011.09.027
Global Volcanism Program (2013). “Volcanoes of the World,”. Editor E. Venzke (Smithsonian Institution), 4.10.6. Downloaded 05 Apr 2022. doi:10.5479/si.GVP.VOTW4-2013
Woods, A. W., and Kienle, J. (1994). The dynamics and thermodynamics of volcanic clouds: Theory and observations from the April 15 and April 21, 1990 eruptions of Redoubt volcano, Alaska. J. Volcanol. Geotherm. Res. 62, 273–299. doi:10.1016/0377-0273(94)90037-X
Wright, C., Hindley, N. P., Alexander, M. J., Barlow, M., Hoffmann, L., Mitchell, C. N., et al. (2022). Surface-to-space atmospheric waves from Hunga Tonga-Hunga Ha’apai eruption. Nature. doi:10.1038/s41586-022-05012-5
Yeo, I. A., McIntosh, I. M., Bryan, S. E., Tani, K., Dunbabin, M., Metz, D., et al. (2022). The 2019–2020 volcanic eruption of Late'iki (Metis Shoal), Tonga. Sci. Rep. 12, 7468. doi:10.1038/s41598-022-11133-8
Zhu, Y., Bardeen, C., and Tilmes, S. (2022), 2022 Hunga-Tonga eruption: Stratospheric aerosol evolution in a water-rich plume, Preprint (Version 1) available at Research Square doi:10.21203/rs.3.rs-1647643/v1
Keywords: volcanic emissions, submarine eruptions, satellite remote sensing, sulfur dioxide, volcanic eruption chronology
Citation: Carn SA, Krotkov NA, Fisher BL and Li C (2022) Out of the blue: Volcanic SO2 emissions during the 2021–2022 eruptions of Hunga Tonga—Hunga Ha’apai (Tonga). Front. Earth Sci. 10:976962. doi: 10.3389/feart.2022.976962
Received: 23 June 2022; Accepted: 19 August 2022;
Published: 13 September 2022.
Edited by:
Silvana Hidalgo, Escuela Politécnice Nacional, EcuadorReviewed by:
Jonathan Dehn, University of Alaska Fairbanks, United StatesTushar Mittal, Massachusetts Institute of Technology, United States
Copyright © 2022 Carn, Krotkov, Fisher and Li. This is an open-access article distributed under the terms of the Creative Commons Attribution License (CC BY). The use, distribution or reproduction in other forums is permitted, provided the original author(s) and the copyright owner(s) are credited and that the original publication in this journal is cited, in accordance with accepted academic practice. No use, distribution or reproduction is permitted which does not comply with these terms.
*Correspondence: S. A. Carn, c2Nhcm5AbXR1LmVkdQ==