 Syegi Kunrat
 Christoph Kern
 Hilma Alfianti1
 Allan H. Lerner
94% of researchers rate our articles as excellent or good
Learn more about the work of our research integrity team to safeguard the quality of each article we publish.
Find out more
ORIGINAL RESEARCH article
Front. Earth Sci., 12 September 2022
Sec. Volcanology
Volume 10 - 2022 | https://doi.org/10.3389/feart.2022.976928
This article is part of the Research TopicRemote Sensing of Volcanic Gas Emissions from the Ground, Air, and SpaceView all 18 articles
Dome-building volcanic eruptions are often associated with frequent Vulcanian explosions, which constitute a substantial threat to proximal communities. One proposed mechanism driving such explosions is the sealing of the shallow volcanic system followed by pressurization due to gas accumulation beneath the seal. We investigate this hypothesis at Sinabung Volcano (Sumatra, Indonesia), which has been in a state of eruption since August 2010. In 2013, the volcano began erupting a lava dome and lava flow, and frequent explosions produced eruptive columns that rose many kilometers into the atmosphere and at times sent pyroclastic density currents down the southeast flanks. A network of scanning Differential Optical Absorption Spectrometers (DOAS) was installed on the volcano’s eastern flank in 2016 to continuously monitor SO2 emission rates during daytime hours. Analysis of the DOAS data from October 2016 to September 2017 revealed that passive SO2 emissions were generally lower in the 5 days leading up to explosive events (∼100 t/d) than was common in 5-day periods leading up to days on which no explosions occurred (∼200 t/d). The variability of passive SO2 emissions, expressed as the standard deviation, also took on a slightly wider range of values before days with explosions (0–103 t/d at 1-sigma) than before days without explosions (43–117 t/d). These observations are consistent with the aforementioned seal-failure model, where the sealing of the volcanic conduit blocks gas emissions and leads to pressurization and potential Vulcanian explosions. We develop a forecasting methodology that allows calculation of a relative daily explosion probability based solely on measurements of the SO2 emission rate in the preceding days. We then calculate forecast explosion probabilities for the remaining SO2 emissions dataset (October 2017—September 2021). While the absolute accuracy of forecast explosion probabilities is variable, the method can inform the probability of an explosion occurring relative to that on other days in each test period. This information can be used operationally by volcano observatories to assess relative risk. The SO2 emissions-based forecasting method is likely applicable to other open vent volcanoes experiencing dome-forming eruptions.
Providing accurate forecasts of volcanic events is at the very core of operational volcanology (Sparks, 2003). Pallister et al., 2019a define a forecast as “the communication passed from an observatory to governmental authorities and the public regarding the probability of future volcanic events” and further state that “a principal goal for a volcano observatory is to accurately communicate results of scientific evaluations and forecasts together with the associated uncertainties”. Agencies around the world tasked with volcano monitoring strive to develop forecasting capabilities that allow them to warn at-risk populations of potentially dangerous volcanic phenomena with the goal of protecting lives and property.
When producing forecasts, one key consideration is the time scale for which the forecast is intended (Marzocchi and Bebbington, 2012). Long-term forecasts address relevant hazards over time frames of years or decades and provide a basis for land use and emergency planning. Short-term forecasts address possible events in the coming hours to weeks or months. Short-term forecasts are perhaps the most critical type of forecasts, as their outcome may require immediate action by emergency managers and civil defense (Pallister et al., 2019b). However, even at short time scales, volcanic activity forecasts are generally not certain. Intrinsic uncertainties in model input parameters and the non-linearity of complex volcanic processes lead to uncertain outcomes (Sparks, 2003). Volcanologists therefore increasingly rely on probabilistic rather than deterministic forecasting methods, as these provide not only a range of possible outcomes but also an estimated probability for each (Marzocchi and Bebbington, 2012).
Probabilistic methods to forecast volcanic events largely fall into two categories. One class of techniques relies solely on stochastic analysis of the volcanic event time series itself (i.e., explosions, collapses). For example, Sandri et al. (2021) apply stochastic modelling of explosions at Galeras Volcano (Colombia) to analyze parameters such as the typical inter-event time and the tendency for events to temporally cluster into “eruptive cycles”. Derived from the past observational record, the statistical properties of the time series of explosive events can then be used to assign probabilities for future events (see Wickman (1976) for a general overview).
Another class of forecasting methods goes one step further and attempts to identify patterns in volcano monitoring parameters indicative of future behavior. In some cases, the input monitoring data can be relatively general. For example, a progression of seismic activity (event locations, changes in earthquake types and magnitudes) consistent with a conceptual model of magma ascending in a volcanic conduit was used to forecast increased risk of eruption at Sinabung Volcano in 2010 and 2013–2014 (McCausland et al., 2019). Alternatively, forecasts can be based on very specific patterns in monitoring parameters, with these patterns being identified (manually or automatically) in past datasets leading up to volcanic events (e.g., de Moor et al., 2016; Rouwet et al., 2019; Dempsey et al., 2020). This method is most applicable when the volcanic events in question occur frequently at a given volcano, as past time series of monitoring data then provide sufficient test data to allow identification of patterns indicative of a certain behavior.
In this study, we follow this second, monitoring-based approach to develop short-term forecasts of explosions at Sinabung Volcano, Indonesia. Specifically, we examine the volcano’s SO2 degassing behavior in days leading up to explosions and periods of explosive quiescence (i.e., when no explosions occurred but lava effusion may have continued). We develop a simple conceptual model for the relation between degassing and Vulcanian explosions and investigate the ability to derive explosion probabilities based on the volcano’s past SO2 emission rates. Relying exclusively on the magnitude and variability of SO2 emission rates, we aim to demonstrate the diagnostic power of these monitoring parameters but note that continuous geochemical monitoring can also be used as input data to more comprehensive forecasting tools (e.g., Marzocchi et al., 2008, and references therein).
Sinabung Volcano is a stratovolcano located in North Sumatra, Indonesia (Figure 1). Rising to approximately 2,460 m above sea level (ASL) and composed of lava flows and pyroclastic density-current deposits, Sinabung’s edifice is perched upon ignimbrite deposits from the Toba caldera and Permian basement rocks (Indrastuti et al., 2019). Prior to 2010, the last dated eruption at Sinabung was ∼1,100 years ago (Iguchi et al., 2012), and subsequent activity was limited to minor fumarolic activity near the summit for at least the last 400 years (Iguchi et al., 2011). In August 2010, however, Sinabung experienced a series of phreatic explosions. In 2013, these were followed by additional explosions, with activity quickly transitioning from phreatic to magmatic. In September of that year, pyroclastic density currents reached up to 5 km from the vent and entire villages had to be evacuated, then permanently relocated, affecting over 30,000 citizens (Otneil Ketaren et al., 2016). Formation of a lava dome at the summit of the volcano began in December 2013. Subsequent collapses of this dome and of the flow front of a connected lava flow on the southeast portion of the edifice led to pyroclastic density currents that have repeatedly reached up to 5 km from the summit (Pallister et al., 2019a). The eruption is classified by the Global Volcanism Program as having a maximum Volcanic Explosivity Index (VEI) of 4. (Global Volcanism Program, 2013). The eruption at Sinabung continues at the time of writing (June 2022) despite a deflationary trend identified in 2014 that has continued through at least 2016 (Hotta et al., 2019), though the eruption has recently transitioned to predominantly effusive in nature. Based on sulfur dioxide (SO2) emissions, Sinabung ranked among the three most active degassing volcanoes in Indonesia in the 2010–2019 period (Bani et al., 2022).
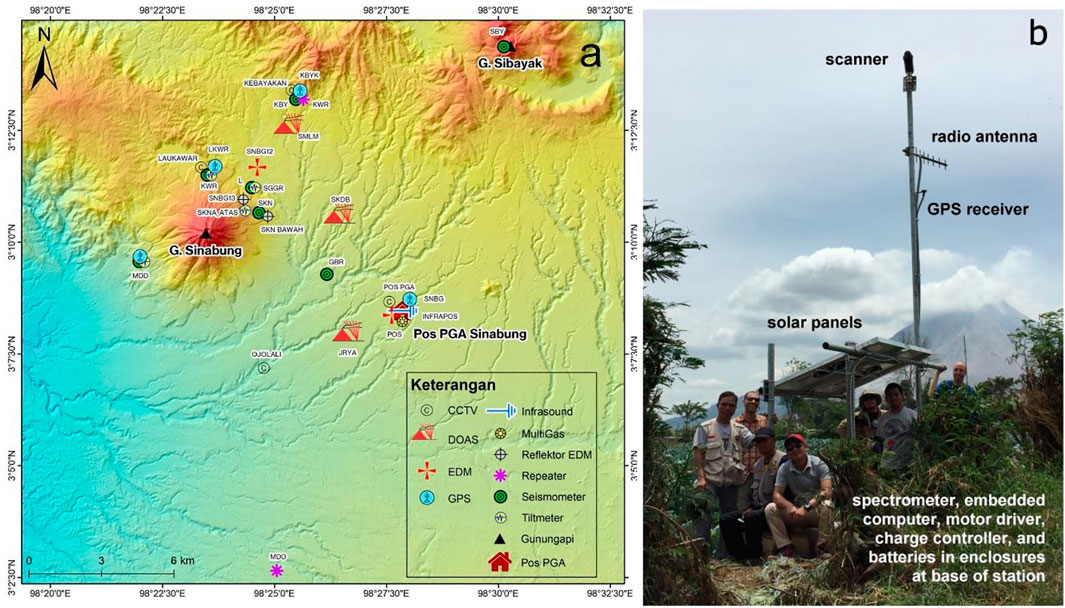
FIGURE 1. (A) Volcano monitoring network maintained by CVGHM at Sinabung. The red symbols labeled SMLM (site ‘Simalem’), SKDB (site ‘Sukandebi’), and JRYA (site ‘Jeraya’) indicate the locations of the NOVAC scanning DOAS instruments installed in 2016. Data from these instruments are telemetered to the radio repeater KWR and then on to the pos (observatory; house symbol) in real time. Explosion column height observations are also made from the pos. (B) Photograph of the DOAS station installed at JRYA in 2016. Photo by Syegi Kunrat, CVGHM.
With the onset of phreatic eruptions in 2010, the Indonesian Center for Volcanology and Geological Hazard Mitigation (CVGHM) moved quickly to facilitate monitoring. A network of seismometers, tiltmeters, Global Positioning System (GPS) receivers and Electronic Distance Measurement (EDM) lines was installed, with all data sent back to a newly established observatory approximately 8 km southeast of the volcano (Gunawan et al., 2019). At the local observatory (referred to as “pos” in Bahasa Indonesia), CVGHM observers carefully documented activity, both by visual observation and from the incoming geophysical data streams. Together with international partners, the recorded data were used to investigate the geology and eruptive processes occurring at Sinabung, and at times provide forecasts of evolving eruptive styles (Hotta et al., 2019; Indrastuti et al., 2019; McCausland et al., 2019; Wright et al., 2019). One particularly important dataset recorded by observers at the observatory was a time series of explosive events occurring at the volcano’s summit. Explosions occurred frequently, particularly after the volcano entered a phase of cyclic Vulcanian events in August 2015 (Gunawan et al., 2019; Nakada et al., 2019). In 2016, the Sinabung monitoring network was expanded to include three scanning Differential Optical Absorption Spectrometers (DOAS) (Primulyana et al., 2019). As described in more detail in the Methods section, these instruments measure the volcanic SO2 emission rate and were telemetered to the local observatory to provide data in near-real time. This, for the first time, provided the Sinabung observers and research volcanologists with continuous information on volcanic gas emissions at high temporal resolution (5–20 min during the day).
With these detailed time series of explosion occurrences and SO2 emission rates at Sinabung, we sought to determine whether the SO2 emission record could be used to gain insights into the processes leading to the explosive events at the volcano’s summit. And if so, might explosive events be probabilistically forecast based on the volcano’s SO2 emission rates?
The CVGHM installed a network of three scanning DOAS instruments at Sinabung in August 2016 (Primulyana et al., 2019). The instruments were positioned east of the volcano’s edifice (Figure 1) to best detect gas plumes that are transported towards the scanners during the prevailing westerly wind conditions. During daytime hours, each instrument scans the sky from horizon to horizon along a conical geometry surrounding the volcano, recording ultraviolet light scattered in the atmosphere (Galle et al., 2010). Each scan takes ∼5–20 min to complete, depending on lighting conditions, so approximately 70 scans per day are obtained from each of the three scanners. When SO2 gas is present in overhead volcanic plumes, the characteristic absorption of SO2 is quantified in the recorded spectra. The abundance of SO2 in the plume can be retrieved from the depth of absorption features using standard DOAS techniques (Galle et al., 2002; Platt and Stutz, 2008).
The DOAS instruments are part of the global Network for Observation of Volcanic and Atmospheric Change (NOVAC), and the data analysis is performed using the NOVAC community’s software and general methodology (Arellano et al., 2021; Galle et al., 2010, www.novac-community.org): First, a standard DOAS analysis determines whether any SO2 absorption is present in the scan. In this step, spectra recorded along all viewing directions within the scan are evaluated relative to the spectrum recorded closest to the zenith. In the next step, the average of the lowest 20% SO2 column densities retrieved within the scan is subtracted from all columns retrieved within the scan. This so-called ‘baseline correction’ assumes that plume-free sky is visible somewhere within the scan. In situations where the plume is located overhead, this correction converts relative column densities to absolute column densities and ensures that the lowest columns within the scan are approximately equal to 0 (Galle et al., 2010).
Scans without SO2 are excluded from further consideration, as the plume is assumed to have traveled away from the scanner at the time of measurement. The software determines whether a scan captured a full or partial SO2 plume by calculating a “plume completeness” parameter
where
Whenever multiple scanners detected the gas plume, the plume height was triangulated, thus allowing calculation of the SO2 burden in the plumes’ cross-sections (Galle et al., 2010). Multiplication of this SO2 burden with the wind speed at plume height yields the volcanic SO2 emission rate, typically reported in metric tons per day (t/d). In this study, we used wind information from the National Oceanic and Atmospheric Administration (NOAA) National Center for Environmental Predictions (NCEP) Global Forecast System (GFS) at 0.5° resolution, interpolated to the volcano’s geographic location and summit altitude, as an estimate of plume speed (see de Moor et al., 2017 for a comparison of GFS data with anemometer measurements).
As is described in the next section, explosive events at the volcano’s summit were very common during our 2016–2021 observation period. Explosions varied greatly in size, with some emitting gas and ash to almost 10 km ASL, and others so small they had no noticeable effect on plume height. During large explosions, significant volcanic ash loads were entrained into the eruption clouds, making them appear dark in color and at times leading to ash fallout downwind. The scanning DOAS instruments are not well-suited for quantifying gas emissions associated with large, ash-rich eruption clouds. The problems are two-fold: for one, large explosions often fill much of the visible sky with gas and ash, making it impossible for the scanners to measure a clear-sky spectrum relative to which the other measurements can be evaluated. Also, significant ash concentrations in the large eruptive clouds block solar radiation at all wavelengths, preventing it from penetrating the plume core. If left unmitigated, these conditions will lead to severe underestimation of the gas emission rates (often referred to as ‘light dilution’), as the majority of light collected by the instruments has not passed through the plume at all (Kern et al., 2010, 2013). Acknowledging these problems, our analyses excluded SO2 emission rates recorded on calendar days with explosion columns that reached >4,000 m ASL, or about 1,500 m above the volcano’s summit, as the SO2 amounts within these significant explosion plumes were likely underestimated. Days on which explosions with unknown column heights occurred (189 days over 5 years) were also removed from the SO2 record. Filtered in this way, we obtained a robust measure of the volcano’s “passive” SO2 emissions. However, we note that the record is missing all emissions associated with large explosive events (see Primulyana et al., 2019 for some examples) and thus represents a minimum constraint on the cumulative SO2 output over time.
Explosive events occurring at Sinabung produce characteristic seismic signals that are recorded by the volcano’s seismic network. These signals typically start as low-frequency events (LFs) but transition to broadband tremor within the first minute after onset. The CVGHM classifies these as ‘Emission’-type events (Kushendratno et al., 2012; McCausland et al., 2019) immediately preceded by impulsive low-frequency shaking. These signals are thought to be caused by magmatic gas and steam breaking through the upper conduit and dome on their way to the surface (McCausland et al., 2019).
Data from the seismic network is telemetered to the Sinabung observatory in Kabanjahe, North Sumatra, and sent to the CVGHM headquarters building in Bandung in real time. Based on the seismicity, an audible alarm at the Kabanjahe observatory alerts the observers each time an explosion occurs, and explosions occurring during the daytime are visually confirmed whenever the weather allows. When possible, the observers also note the color (dark/light), opacity, and estimated height of gas and ash plumes stemming from explosions.
The eruptive column heights reported in this study were determined by aiming a set of binoculars with an integrated inclinometer at the top of the column. The inclination was noted and, together with the known distance to the volcanic vent, the approximate column altitude was triangulated. In each case, the column height was determined immediately after the first explosive pulse. At times, the eruption clouds may have lofted further as they dispersed and drifted downwind, but this additional lofting could not be quantitatively captured using the methods at hand, so only the initial height was reported.
Running continuously since September 2016, the scanning DOAS network at Sinabung has been able to record the passive SO2 emission rates from Sinabung for the last 5 years (Figure 2). The instruments were able to record at least one valid emission rate (i.e., C ≥ 0.8) on approximately 80% of the days in the observation period. On the remaining 20% of days, the plume was either blown to the west where the instruments couldn’t capture the emissions, clouds between the plume and the scanners prevented reliable measurements, or a large explosion occurred, and the gas data were discarded due to concerns about ash emission adversely affecting data accuracy (see Section 2.1). Instantaneous passive SO2 emission rates derived from individual scans ranged from 0 to ∼4,800 t/d (maximum rate measured on 9 September 2021), while the maximum daily average emission rate was ∼2,600 t/d (measured on 11 August 2020). The mean passive daily average emission rate for the entire 2016–2021 reporting period was ∼240 t/d (N = 1,145 days).
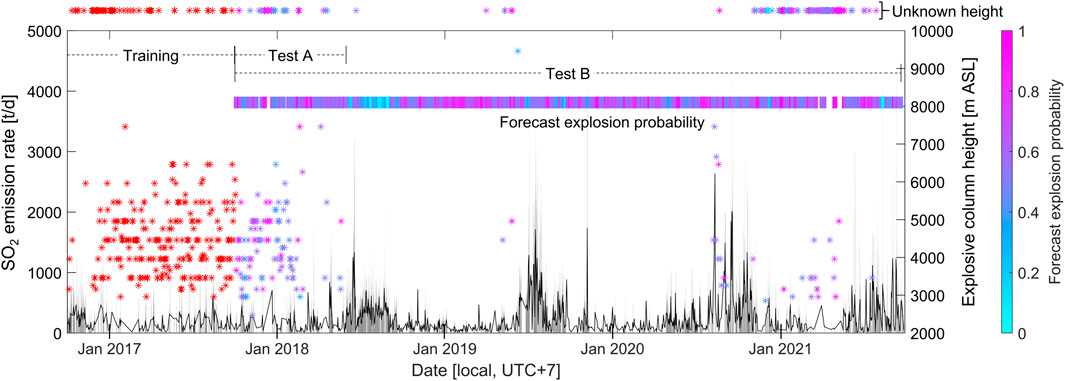
FIGURE 2. SO2 emission rates and explosive events measured at Sinabung Volcano from 1 October 2016 to 30 September 2021. Vertical grey bars depict the range of instantaneous SO2 emission rates measured by the scanners in the DOAS network, while the solid black line represents the daily average passive emission rate (see text for details). The timing and column height of explosions is indicated by the position of the stars. Explosive events with unquantified column heights are indicated by stars at the top of the plot. The time windows used for training and testing explosion forecasts are also indicated at the top and labeled ‘Training’, ‘Test A’, and ‘Test B’. Starting on 1 October 2017, the forecast daily explosion probabilities are represented by the horizontal bar in varying colors, with the color scale given at right; stars indicating column heights are color-coded according to the last valid forecast explosion probability before the corresponding explosion occurred (compare Figure 5C); red stars indicate explosions that occurred during the training period when no forecast was available.
Also shown in Figure 2, explosions were detected at Sinabung on a total of 567 days between 1 October 2016 and 30 September 2021. Of these, 432 occurred between 1 September 2016 and 20 May 2018, while 135 occurred in the remainder of the observation period. Observations of column heights associated with explosions ranged from 2,500 m (the volcano’s summit elevation) to 9,500 m ASL. At least 30% of observed explosions generated plume heights <4,000 m ASL, but the exact percentage is unknown due to some explosions having unquantified column heights. Of the known column heights, the mean height was ∼4,400 m and only 5% of explosive columns reached >6,000 m ASL. Indeed, the majority of explosions were relatively small; the warm, tropical environment likely aided associated columns in rising to altitudes that would not have been achieved in mid or high latitudes (Sparks, 1986).
With the comprehensive record of SO2 emissions and the large number of explosive events at Sinabung, we sought to determine whether the degassing signals can be used to improve the understanding of Sinabung’s activity and/or aid in forecasting explosive events. Initially focusing on the first year of measurements (1 October 2016 to 30 September 2017), we calculated the mean passive SO2 emission rates during the five preceding days on which explosions occurred. A histogram of these 5-day mean emission rates is shown in red in Figure 3A. Although the distribution encompasses occurrences of SO2 emission rates as high as 425 t/d, most days with explosions were preceded by relatively low mean emissions ranging from 0 to 200 t/d, with a mode of about 100 t/d.
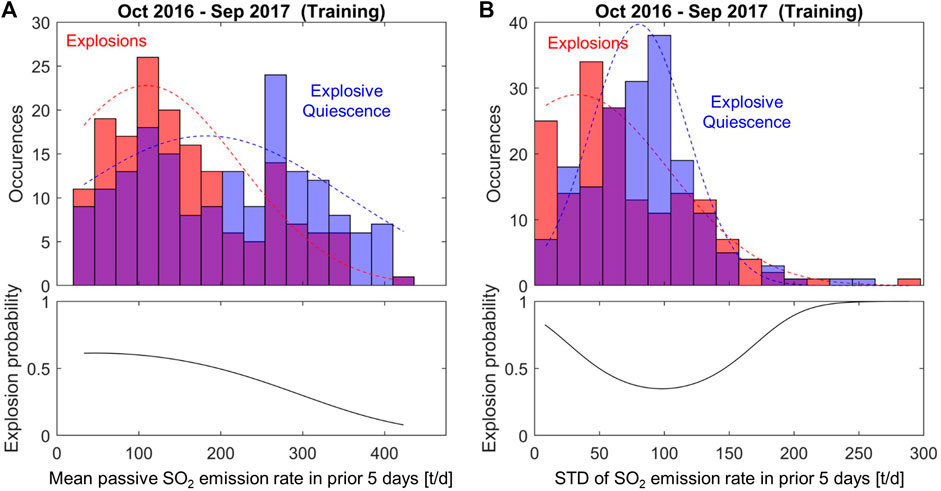
FIGURE 3. Results of a statistical analysis of SO2 emission rates from Sinabung Volcano during October 2016 to September 2017. The mean (A) and standard deviation (B) of the passive SO2 emission rate in the 5 days leading up to each day in this 1-year period were calculated. Histograms of these parameters have been separated into days on which explosions occurred (red, N = 167) and days without explosions (blue, N = 177). Areas where the histograms overlap appear purple. Note that days with explosions were more likely preceded by lower SO2 emissions than days of explosive quiescence. Days without explosions were also typically preceded by standard deviations (STD) of SO2 emission rates between 50 and 150 t/d, while days with explosions were preceded by a somewhat wider range of variability in emissions. Fitting normal distributions to the histograms (dotted lines) and requiring that the sum of the two probabilities equals 1, an explosion probability was calculated for each mean and STD value. Shown below each histogram, these probabilities are only valid for the period assessed here (October 2016–September 2017).
These observations can be compared to 5-day mean passive SO2 emissions leading up to days on which no explosions occurred (shown in blue in Figure 3A). Here, the probability distribution has two separate peaks, one coinciding with the peak in pre-explosive SO2 emissions and one towards higher gas emission rates. Regardless of whether the bi-modal nature of the distribution is truly significant, it appears that days of quiescence (no explosions) tend to be preceded by higher 5-day mean passive SO2 emission rates than days with explosions. Fitting a normal distribution to the histogram of emissions preceding quiescence, we find that the mode is closer to 200 t/d SO2, and 5-day periods with SO2 emission rates averaging >350 t/d were only once followed by an explosion.
Besides the magnitude of SO2 emissions, we also examined the inter-daily variability of SO2 emission rates leading up to explosions by calculating the standard deviation (STD) of daily averaged SO2 emission rates for the same 5-day windows. We found that periods preceding days with explosions generally have SO2 emission rate STDs around 40 t/d, while the periods preceding days of quiescence were more likely to be preceded by STDs twice as high, around 80 t/d (Figure 3B). Fitting normal distributions to the histograms, we also find that STDs greater than about 150 t/d are more likely during periods leading up to explosions than those leading to quiescence. In other words, the range of realized STDs preceding days with explosions is higher than that preceding quiescence. Collectively, we observe that SO2 emission rates are generally lower but exhibit a greater range of variability in the 5-day periods preceding explosive events, whereas SO2 emission rates in the 5-day period preceding quiescent days are generally higher and vary over a narrower range. We note that the 5-day timespan used here was chosen after manually inspecting a range of other spans. The 5-day window appeared to maximize the notable differences in emissions before explosive vs. quiescent days while at the same time encompassing sufficient data to allow means and STDs to be calculated for most days.
These observations can now be used to calculate daily explosion probabilities for the reference period. Since each observation day falls either into the category of days with explosions or days without explosions, the cumulative probability at each position in the histograms in Figure 3 must equal 1. Using the fitted normal distributions rather than the noise-prone data themselves, we calculate the probability of an explosion occurring for observed mean SO2 emission rates and STDs in the preceding 5-day period. The resulting probability curves are shown in the bottom panes of Figure 3. The daily explosion probability increases for 5-day periods of low SO2 emissions and for STDs either significantly lower or higher than the 80 t/d typically associated with quiescence.
Based on the multi-year SO2 emission record at Sinabung and the statistical analysis of SO2 emissions preceding explosions during October 2016—September 2017, we can develop a conceptual model to explain our observations. First, the mean SO2 emission rate of 240 t/d sustained over a 4-year interval requires a steady supply of magma to relatively shallow depths. In fact, similar emissions have been sustained for over a decade at Sinabung (Primulyana et al., 2019), indicating a relatively constant magma supply rate. The petrologic degassing behavior of sulfur is complex and has not been explicitly studied for Sinabung’s andesitic (Nakada et al., 2019) magmas. However, research from other andesitic arc magmas (hydrous, relatively oxidized) suggests that sulfur degassing occurs throughout the mid- and upper-crust, where many magmas are saturated in a H2O- and CO2-rich multicomponent vapor phase (Métrich and Wallace, 2008; Fiege et al., 2014). At depths shallower than ∼4–6 km, the decreasing pressure causes sulfur to increasingly partition into the vapor phase (Scaillet and Pichavant, 2005; Burgisser et al., 2008; Lesne et al., 2011; Wallace and Edmonds, 2011; Webster and Botcharnikov, 2011; Werner et al., 2020). Sulfur degassing at Sinabung is therefore likely sourced from magmas ascending at various levels within the crustal plumbing system (Christopher et al., 2015; Iacovino, 2015), but particularly from relatively shallow magmas.
A steady magma supply is also consistent with visual observations of generally sustained lava extrusion from Sinabung’s summit during 2016–2021. Photographs of the summit (Figure 4A) show steam emissions, mostly focused around the edges of the lava dome where degassing pathways presumably follow stress fractures caused by dome extrusion and growth. This combination of steady magma supply and fairly open degassing pathways around the slowly extruding lava dome allows for moderate gas emissions (100–400 t/d SO2) in a quasi-steady state (Figure 4B). As the lava dome itself is likely composed of material that previously degassed during slow ascent up the conduit, it is likely to be a highly viscous, crystalline lava (Nakada et al., 2019 measure crystallinities of ∼40 volume % in juvenile lava fragments from 2014), and we assume it is not very permeable to gas, consistent with the lack of visible gas or steam plumes emanating from the dome itself (Figure 4A).
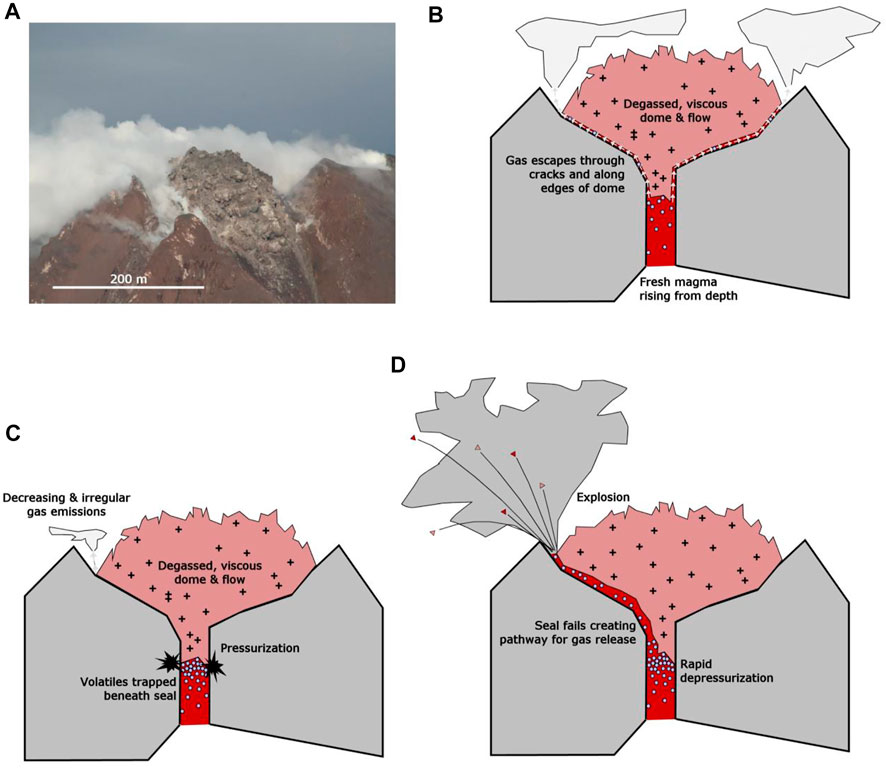
FIGURE 4. Schematic of our conceptual seal-failure model for magmatic degassing and explosions at Sinabung. (A) Photograph by CVGHM scientists of the lava dome perched in Sinabung Volcano’s summit crater on 25 November 2020. Degassing dominantly occurs from the margins of the dome. (B) During periods of explosive quiescence, gases exsolving from magma rising in the conduit escape through cracks in and pathways around the highly viscous and relatively impermeable lava dome. (C) If the degassing pathways become sealed, SO2 emissions decrease and gas accumulating beneath the dome begins to pressurize. Highly variable gas emissions may result if the seal is broken intermittently in a non-explosive manner before a critical pressure is achieved. (D) Explosions occur if the pressure builds beyond the threshold for generating new or re-establishing preexisting degassing pathways. Explosions are caused by the rapid depressurization of the shallow conduit. The magnitude of the resulting explosions will depend on the strength of the seal, which determines the accumulated pressure beneath it.
Secondly, the decrease in SO2 emission rates in the days preceding explosive events (Figure 3A) suggests that the established degassing pathways can become sealed by the viscous, degassed dome material, which causes pressurization and eventual explosive rupture. The potential for a protracted phase of repeating explosive events at Sinabung caused by magma densification through degassing and vesicle collapse of the lava dome and upper conduit was already recognized by Primulyana et al. (2019) and Nakada et al. (2019), and this prediction appears to hold true based on recent years of observations. One possible trigger for sealing of the system is a short-term reduction in magma supply rate from depth, which could lead to a slight cooling and reduction in gas streaming through the peripheral lava dome cracks, thus allowing ductile dome material to seal the pathways. When this occurs, the SO2 emission rate measured downwind decreases, consistent with our observations. Concomitantly, pressure will begin to build beneath the seal as exsolved volatiles accumulate (Figure 4C).
Depending on the strength of the seal, the pressure building beneath the dome may overwhelm it rather quickly. In this case, gas which had begun to accumulate may be released in a non-explosive manner, leading to a brief period of anomalously high SO2 emissions. For example, in their detailed 2-week record of SO2 emissions from 2016, Primulyana et al. (2019) discovered gas emission events occurring at Sinabung that appeared to occur contemporaneously with hybrid seismic events. Hybrid seismicity is often ascribed to brittle failure and resonance in fluid filled cracks (Chouet, 1996; Chouet and Matoza, 2013; McCausland et al., 2019), so these may well be manifestations of the non-explosive gas release events which we postulate here. When the volcanic system is in an unstable state of intermittent or partial sealing of degassing pathways (Figure 4C), gas emissions could well be more variable than during times when steady-state degassing is occurring, which might explain the greater range of standard deviations apparent in the October 2016—September 2017 SO2 emission rate data (Figure 3B).
However, if the degassing pathways become more robustly sealed, pressurization will continue and eventually lead to an explosion. In this process, the accumulated pressure may break open an existing pathway for gas escape or create a new one. In either case, the accumulated volatiles are rapidly released to the atmosphere, and the top of the conduit is suddenly exposed to near-atmospheric pressure causing additional degassing and expansion of the volatile phase. Gas and magma fragments are jetted from the conduit and form the observed explosive eruption columns (Figure 4D). The magnitude of the explosion and the height to which the resulting gas and ash plume ascends depends on the pressure that was attained beneath the plug at the volcano’s summit.
While we believe this simplistic seal-failure model explains the observations of SO2 degassing and Vulcanian explosive events at Sinabung, we acknowledge that other, more complex models could also be valid. For example, in addition to exsolved volatiles being trapped below a shallow seal, the exsolution of volatiles from rapid microlite crystallization within the lava dome itself and/or the rapid heating of groundwater could also play a role in producing overpressure that ultimately leads to Vulcanian explosions (Morrissey and Mastin, 2000). The information at our disposal does not allow for definitive conclusions to be drawn regarding the explosive processes. The model is also based only on observations from October 2016 to September 2017 and is therefore not necessarily valid outside this period. For example, if the magma supply rate from depth changed drastically over time, this would lead to significant changes in activity at the volcano’s summit that would not necessarily be represented in our model.
On the other hand, if parameters such as magma supply, magma chemistry, and lava effusion rates remained approximately constant over time, we could expect future activity to follow the same patterns as in the past. In this case, the statistical results discussed above might be used to provide forecasts of future behavior, regardless of whether the conceptual model is correct or not.
As defined in our statistical analysis above, the daily explosion probabilities are strictly accurate only for the evaluated period (October 2016 to September 2017). However, we can consider this a “training” period for a forecasting method which aims to forecast future events. If the system behaved exactly as it did during the training period, future explosions would be expected to follow the same pattern. To produce a forecast, the two separate diagnostics (i.e., mean SO2 emission rate and standard deviation in the preceding 5 days) must first be combined in some way, as they will typically produce different results. For example, if a 5-day mean SO2 emission rate of 300 t/d is accompanied by a STD of 200 t/d, the emission rate would indicate an explosion probability of approximately 0.3 while the STD of emissions would indicate a probability of 0.8 (see Figure 3). In the absence of additional information, we choose to weight the 5-day mean and 5-day STD metrics equally (in this example yielding a combined explosion probability of 0.55).
Following this procedure, we can forecast explosion probabilities for most days in our record. Ranging from 0.20 to 0.75, these daily forecasts are shown in a colored horizontal bar spanning 1 October 2017–30 September 2021 in Figure 2. The forecast record contains gaps because gas emissions could not be constrained every day (e.g., when the plume was blown to the west), and days on which large explosions may have occurred are removed from the passive SO2 emission dataset (see Methods section). Furthermore, in order to calculate meaningful STD values, we only present forecasts for days where SO2 emissions data are available on at least two of the five preceding days. In the end, we were able to calculate forecasts on approximately 70% of days during 1 October 2017–30 September 2021.
We first focus on the period from 1 October 2017 to 31 May 2018 (marked “Test A” in Figure 2). This 8-month period directly follows the 1-year training period and ends just before explosions at Sinabung stopped for about a year in 2018–2019. The rationale for choosing this test period is that the frequency of explosions was similar to that of the training period, and thus the processes driving explosions are likely to be similar to those occurring during the training period.
Based on SO2 emission characteristics, a total of 145 daily explosion probability forecasts were calculated during this 242-day period, so a forecast could be provided on roughly 60% of days. Forecast daily explosion probabilities ranged from 0.32 to 0.73. A histogram of forecast probabilities is given in Figure 5A. Explosion probabilities between 0.4 and 0.5 were forecast for 55 days, and an additional 50 days had explosion probability forecasts between 0.5 and 0.6. Thus, approximately 75% of all forecast days fell into these two categories. Only 7 days yielded explosion probabilities of less than 0.4, while explosion probabilities >0.6 were forecast for 33 days.
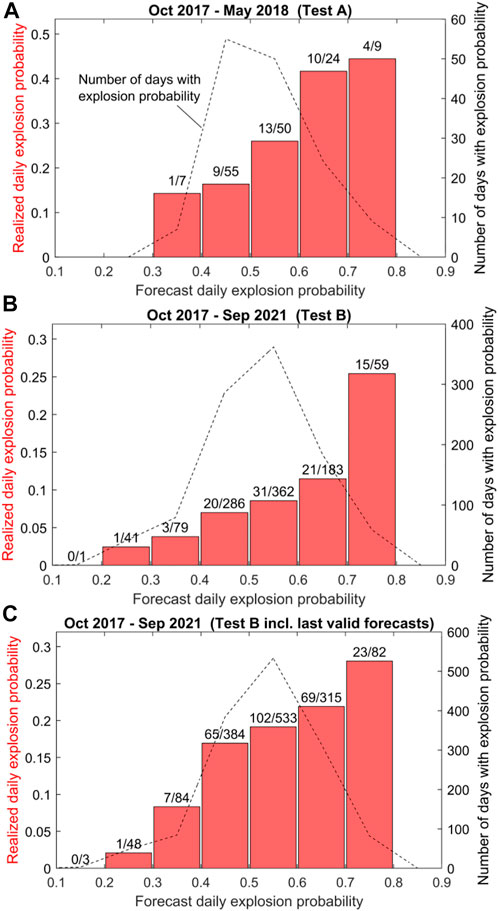
FIGURE 5. Results of several tests of the explosion forecast methodology based on SO2 emission characteristics. (A) In Test A, we applied the explosion forecast framework to data between October 2017 and May 2018, a period that exhibited a similar explosion frequency as the training period (October 2016—September 2017). (B) In Test B, the forecast was applied to all available data collected between October 2017 and September 2021. A forecast explosion probability between 0 and 1 was calculated for each day in the respective study, and these were then binned in intervals of 0.1. The dotted line and right axis indicate the number of forecast values in each bin. Dividing the number of explosions that occurred on the days in each bin by the total number of days in the bin yields the realized daily explosion probability, which is indicated by the red bars (left axis). The numbers above the bars give the number of days with observed explosions per number of days in each forecast bin. In (C), we plot the results of Test B, this time including all days in the test period, not just those with a valid forecast. Days without a forecast were assigned the last valid forecast that could be calculated. Note that in all cases, the absolute forecast explosion probabilities were higher than the realized probabilities, but in a relative sense, the probability of an explosion occurring always increased with increasing forecast probability.
Since this test period lies in the past, the accuracy of the forecasts can be assessed by examining the realized daily explosion probability, which is simply the number of days with explosions divided by the total number of days in the observation period. The bars in Figure 5A show the realized explosion probability disaggregated by forecast explosion probability, with the numbers above each bar indicating the number of explosions per total number of days in the respective bin. For all bins, realized explosion probabilities were lower than the forecast values. For example, only nine explosions occurred during the 55 days that had explosion probability forecasts between 0.4 and 0.5, corresponding to a realized explosion probability of 0.16, or less than half the forecast value. The same holds true for all other bins, with the forecasts exceeding the realized explosion probabilities by about a factor of 2. This observation indicates that the absolute accuracy of the explosion probability forecasts is rather poor, as our method was not able to accurately forecast the total number of explosions that occurred during the test period.
On the other hand, the forecasting method was quite successful in discriminating days with a higher likelihood of explosions from days with a relatively lower probability of an explosion occurring. This is evidenced by the monotonic increase of realized explosion probabilities with increasing forecast values. Explosions were three times more likely on days in the 0.7–0.8 explosion probability forecast category (p = 4/9 = 0.44) than on days with forecasts <0.4 (p = 0.14). Therefore, though the absolute daily explosion probability was overestimated in all bins, the method still provided a means for determining the relative likelihood of an explosion occurring on a given day.
In a second test, we considered the entire available dataset following the training period (labeled “Test B” in Figure 2). Running from 1 October 2017 to 20 September 2021, this 4-year period contains phases of frequent explosive activity, but also phases of explosive quiescence that last for many months at a time. Given the far lower average frequency of explosions in this period and the results of the first test, we do not expect our method to accurately forecast the total number of explosions or absolute daily explosion probability in this test period. However, if the processes that cause explosions remained the same as in the training period, the forecast might again provide a relative indication of daily explosion probability when compared with other days in the period.
The test results appear to confirm this supposition. As shown in Figure 5B, we were able to calculate explosion probability forecasts on 1,011 of 1,450 days, or about 70% of days in the period. Explosion probability forecasts ranged from 0.20 to 0.75, with most days again falling in the range of 0.4–0.6. The realized explosion probabilities were far lower than the forecast values. However, the monotonic increase of realized explosion probabilities with increasing forecast values remained, thus again allowing for discrimination of days with relatively low explosion probability from those with relatively high risk. In fact, the realized likelihood of an explosion occurring on a day in the 0.7–0.8 bin (0.25) was now more than seven times greater than that of one occurring on a day with forecast probability <0.4 (0.033).
Despite the relatively high number of days with valid forecasts available, gaps in our ability to provide a forecast tend to disproportionately occur during phases of frequent explosions as SO2 emission rates are deemed unreliable (see Methods). In a final test, we assigned the last valid forecast probability to any day on which the probability could not be calculated, thus filling the gaps in our forecast record. The results of this procedure (Figure 5C) are generally consistent with what we found previously. The absolute forecast explosion probabilities were similarly low, but the monotonic increase of realized probabilities with increasing forecast values remained. Relying on the last valid forecast therefore seems to be an acceptable method for dealing with forecast gaps due to unmeasured SO2 emissions.
We envision the methodology described here could prove useful not just at Sinabung, but also at other volcanoes with dome-building eruptive activity. Notable examples include Santiaguito Volcano, Guatemala, where observations of degassing along the edges of a lava dome are strikingly similar to activity at Sinabung’s summit (see Figure 1 in Bluth and Rose, 2004); Popocatépetl Volcano, Mexico, where SO2 camera data revealed that a subset of explosions were preceded by low emission rates attributed to the accumulation of gas beneath a rapidly compacting dome (Campion et al., 2018); Colima Volcano, Mexico, where measurements of gas flux appeared to track the failure of a crystalized obstruction in the volcano’s shallow system prior to ash-rich explosions (Varley et al., 2010; Cassidy et al., 2015); and Sakurajima Volcano, Japan, where SO2 emission rates were observed to decrease contemporaneously with increased inflation of the edifice prior to explosions from Showa crater (Yokoo et al., 2013; Kazahaya et al., 2016).
Although promising in its ability to provide a relative risk metric, the utilized explosion forecasting approach clearly has limitations. As the forecast output is based on a single training period, the methodology will surely fail if the processes governing explosions and volcanic activity overall at Sinabung Volcano change. For example, if magma supply from depth decreases and the years-long eruption trends towards its end, the forecast will incorrectly predict high explosion probability levels as the mean SO2 emission rate decreases. Similarly, the methodology fails to forecast the long-term changes in explosion frequency exhibited in our 5-year record. As long-term mean SO2 emissions did not drop noticeably during periods of explosive quiescence, we hypothesize that magma supply from depth likely continued during these times, but other processes made for efficient degassing and lack of pressurization and explosions. These differences are not captured in our training data, and thus the forecast is unable to predict them.
Also, some of the explosions included in our record were caused by dome-collapse events during which portions of the lava dome and flow broke off or collapsed, instantly decreasing the lavastatic pressure on the upper conduit and leading to rapid decompression, degassing, and explosion (Pallister et al., 2019a). These types of explosions are unlikely to be preceded by changes in degassing caused by variable permeability of the dome, but instead depend on the structural integrity of the dome/lava flow complex and the degree of oversteepening. A notable example of an unforeseen explosion occurred on 9 June 2019 at 16:28 local time. In what was one of the largest eruptive events in the last 5 years, a large explosion at Sinabung produced a thick, black column of gas and ash which ascended to approximately 9,500 m ASL. The explosion produced pyroclastic flows that traveled more than 3 km down the south and southeast flanks of the volcano. This paroxysmal event occurred on a day with a SO2-emissions-derived explosion probability of only 0.4 according to our forecast method. We attribute the failure to forecast this event to a high likelihood that this explosion was caused by a mechanism not described by our seal-failure model, possibly a dome-collapse as mentioned above.
Although some of our method’s limitations are intrinsic to forecasting itself, it may be possible to improve the forecast accuracy in the future by providing additional information upon which to base the projections. Examination of the explosion record at Sinabung reveals that explosions tend to be temporally clustered in phases of frequent activity, interspersed by periods of relative explosive quiescence. If we assume that these phases are significantly longer than our forecasting window, the absolute probability of an explosion occurring on a given day likely depends on which phase of activity the volcano is in and the observed frequency of explosions in that phase. Considering the history of explosions in recent weeks, months, or even years along with the short-term (5-day) degassing behavior might then improve the forecast accuracy. This could be implemented in an approach similar to the Short-Term Average/Long-Term Average (STA/LTA) algorithms which are commonly used in event-detection applications based on geophysical data (Withers et al., 1998; Trnkoczy, 2012; Brill et al., 2018; Power et al., 2021; Viccaro et al., 2021). Alternatively, it may be beneficial to repeat the training process intermittently, either at preset time intervals or whenever volcanic activity is deemed to have entered a new phase. Even a sliding window approach that constantly re-trains the algorithm on a period of time immediately preceding the current day could be implemented, though care must be taken to include a sufficient number of events to avoid imbalanced training data. Such improvements could be particularly valuable when the magma supply rate at a given volcano changes. The current transition towards a more effusive eruption with fewer Vulcanian events at Sinabung may be caused by a decrease in magma supply, which would in turn negatively affect the absolute accuracy of the forecasting method over time (as shown in Section 4.4) unless some sort of re-calibration is performed.
Further improvements might come from a more rigorous analysis of the optimal input features that lead to accurate forecasts. In this study, we chose to base forecasts only on the simple mean and standard deviation of emission rates over the last 5 days after manually inspecting a variety of other properties. Prior maximum and minimum emission rates, short-term and long-term trends in emissions, and the elapsed time since the last explosion all did not appear to exhibit systematic differences leading up to explosions when compared to explosive quiescence during October 2016—September 2017. However, a more rigorous investigation of these and other parameters, possibly even employing machine learning algorithms to select optimal features and produce forecasts, may yield improved results. The drawback of such an approach is that the forecast model becomes less transparent to the users, thus making it more difficult to link the observations to a conceptual model for the explosions. Assessing whether the forecasts remain valid in the face of a potential long-term change in activity at Sinabung thus also becomes more complicated. For these reasons, we have elected not to use machine learning approaches here, instead favoring a simple statistical approach.
Perhaps the greatest improvement could come from combining our forecasting method with others, particularly with methods based on other monitoring parameters. As discussed above, explosions at Sinabung may be caused by a number of different processes, and not all are likely to be preceded by significant changes in gas emissions. Therefore, a forecasting method based solely on degassing observations will necessarily miss certain events. Pallister et al., 2019b show how information from satellite remote sensing platforms was instrumental in monitoring lava dome stability and forecast dome/lava flow collapse events and pyroclastic flows at Sinabung during 2013–2016. Tracking lava dome changes on timescales comparable with the SO2-based forecasts (i.e., ∼5-day periods) could help determine whether our proposed conduit sealing and gas accumulation model was accompanied by observable lava dome inflation. Low lava dome extrusion rates might also make the system more prone to sealing, and high extrusion rates likely increase the chance of lava dome or flow front collapse. Seismic and geodetic data also provide valuable information about processes occurring at depth that can presage changes in eruptive activity and inform forecasts (Hotta et al., 2019; McCausland et al., 2019). For example, the processes that cause ‘Emission’- or ‘Hembusan’-type (Caudron et al., 2015; McCausland et al., 2019) and ‘Hybrid’-type (Primulyana et al., 2019) seismic events are not yet fully understood. Coupling our gas-based forecasts with those from other automated or process-based forecasts would therefore provide complimentary information and likely result in the most accurate forecasts, particularly when compiled and discussed by a multi-disciplinary team of analysists.
Using a relatively simple statistical analysis of passive SO2 emission rates recorded at Sinabung Volcano during a 1-year period in 2016–2017, we found that explosions were often preceded by below-average emission rates over the prior 5 days (Figure 3A). The absolute standard deviation of the SO2 emission rate, while typically also lower than average, took on a slightly greater range of values in the 5 days leading up to explosions than before days without explosions (Figure 3B). These findings could be explained by a simple conceptual model in which degassing pathways from the volcano’s conduit to the atmosphere are intermittently blocked, allowing pressure to build and sometimes lead to explosions. Based solely on the measurements of SO2 emissions and timing of explosions, the model is not unique and other, more complex models might also explain the observations. However, the diagnostic nature of the statistical observations appears robust. Derived from the observations of the 2016–2017 training period, a simple method for forecasting explosion probabilities was tested on the remainder of the available gas emission and explosion dataset (2017–2021). Although the method failed to accurately forecast the absolute probability of explosions, it succeeded in providing a relative measure of the daily explosion probability when compared to other days in each test period. Based on these findings, we suggest that the explosion probability forecasts be interpreted as relative rather than absolute probabilities. These forecasts can then be used operationally: days on which a high relative probability is forecast are more likely than others in the same general time window to have explosions occurring.
Forecast explosion probabilities can be obtained daily in a fully automatic process. Interpretation of the relative probabilities requires knowledge of the limitations of the methods used in their calculation. For example, explosions caused by dome-collapse events cannot be forecast with this technique as they are generally not associated with precursory changes in gas emission rates. Time will tell whether the forecasts of future activity at Sinabung will remain accurate, or whether the volcano will transition to a new phase of significantly different activity. Regardless, we envision the described forecasting methodology could well be applied to other volcanoes experiencing dome-building eruptions.
Finally, this study adds to the growing body of research demonstrating that important, actionable information on volcanic activity and processes can be obtained from continuous gas measurements and emphasizes the value of establishing and maintaining continuous gas monitoring at more active volcanoes worldwide (Aiuppa et al., 2007; Werner et al., 2013; de Moor et al., 2016; Kern et al., 2017, 2022; Stix and de Moor, 2018).
The original contributions presented in the study are included in the Supplementary Material, further inquiries can be directed to the corresponding author and the Indonesian Center for Volcanology and Geological Hazard Mitigation.
SK, CK, and AL led the installation of the gas monitoring instruments on Sinabung Volcano in 2016. SK oversaw data collection and analysis for the observation period. CK developed the presented approach for statistical data analysis and forecasting and wrote the first draft of the manuscript. SK, HA, and AL wrote sections of the manuscript. All authors contributed to manuscript revision and approved the submitted version.
Theauthors would like to thank the observers at the Sinabung Observatory (Moh. Nurul Asrori, Armen Putra, Deri Al Hidayat), Sulus Setiono, Ugan B. Saing, and Sofyan Primulyana for assistance with the installation and maintenance of the monitoring network and reporting explosions at Sinabung. The Indonesian Geological Agency and its Center for Volcanology and Geologic Hazard Mitigation (CVGHM) and the USGS-USAID Volcano Disaster Assistance Program (VDAP) are gratefully acknowledged for providing support for this study. Finally, we would like to acknowledge the Network for Observation of Volcanic and Atmospheric Change (NOVAC) community for providing hardware and software support without which the reported gas measurements would not have been possible. Any use of trade, firm, or product names is for descriptive purposes only and does not imply endorsement by the U.S. Government.
The authors declare that the research was conducted in the absence of any commercial or financial relationships that could be construed as a potential conflict of interest.
All claims expressed in this article are solely those of the authors and do not necessarily represent those of their affiliated organizations, or those of the publisher, the editors and the reviewers. Any product that may be evaluated in this article, or claim that may be made by its manufacturer, is not guaranteed or endorsed by the publisher.
The Supplementary Material for this article can be found online at: https://www.frontiersin.org/articles/10.3389/feart.2022.976928/full#supplementary-material
Supplementary Table S1 | Table of sulfur dioxide emission rates and the number of observed explosions and notable seismic events from Sinabung Volcano, 2016–2021.
Aiuppa, A., Moretti, R., Federico, C., Giudice, G., Gurrieri, S., Liuzzo, M., et al. (2007). Forecasting Etna eruptions by real-time observation of volcanic gas composition. Geol. 35, 1115. doi:10.1130/G24149A.1
Arellano, S., Galle, B., Apaza, F., Avard, G., Barrington, C., Bobrowski, N., et al. (2021). Synoptic analysis of a decade of daily measurements of SO2 emission in the troposphere from volcanoes of the global ground-based Network for Observation of Volcanic and Atmospheric Change. Earth Syst. Sci. Data 13, 1167–1188. doi:10.5194/essd-13-1167-2021
Bani, P., Oppenheimer, C., Tsanev, V., Scaillet, B., Primulyana, S., Saing, U. B., et al. (2022). Modest volcanic SO2 emissions from the Indonesian archipelago. J. Volcanol. Geotherm. Res. 13, 1–15. doi:10.1038/s41467-022-31043-7
Bluth, G. J. S., and Rose, W. I. (2004). Observations of eruptive activity at Santiaguito Volcano, Guatemala. J. Volcanol. Geotherm. Res. 136, 297–302. doi:10.1016/j.jvolgeores.2004.06.001
Brill, K. A., Waite, G. P., and Chigna, G. (2018). Foundations for forecasting: Defining baseline seismicity at Fuego Volcano, Guatemala. J. Geophys. Res. 6, B12204–B12218. doi:10.3389/feart.2018.00087
Burgisser, A., Scaillet, B., and Harshavardhan, (2008). Chemical patterns of erupting silicic magmas and their influence on the amount of degassing during ascent. J. Geophys. Res. Solid Earth 113, 1–14. doi:10.1029/2008JB005680
Campion, R., Delgado-Granados, H., Legrand, D., Taquet, N., Boulesteix, T., Pedraza-Espitía, S., et al. (2018). Breathing and coughing: The extraordinarily high degassing of Popocatépetl Volcano investigated with an SO2 camera. Front. Earth Sci. 6, 163. doi:10.3389/feart.2018.00163
Cassidy, M., Cole, P. D., Hicks, K. E., Varley, N. R., Peters, N., and Lerner, A. H. (2015). Rapid and slow: Varying magma ascent rates as a mechanism for Vulcanian explosions. Earth Planet. Sci. Lett. 420, 73–84. doi:10.1016/j.epsl.2015.03.025
Caudron, C., Syahbana, D. K., Lecocq, T., Van Hinsberg, V., McCausland, W., Triantafyllou, A., et al. (2015). Kawah ijen volcanic activity: A review. Bull. Volcanol. 77, 16. doi:10.1007/s00445-014-0885-8
Chouet, B. A. (1996). Long-period volcano seismicity: Its source and use in eruption forecasting. Nature 380, 309–316. doi:10.1038/380309a0
Chouet, B. A., and Matoza, R. S. (2013). A multi-decadal view of seismic methods for detecting precursors of magma movement and eruption. J. Volcanol. Geotherm. Res. 252, 108–175. doi:10.1016/j.jvolgeores.2012.11.013
Christopher, T., Blundy, J., Cashman, K., Cole, P., Edmonds, M., Smith, P., et al. (2015). Crustal-scale degassing due to magma system destabilization and magma-gas decoupling at Soufrière Hills Volcano, Montserrat. Geochem. Geophys. Geosyst. 16, 2797–2811. doi:10.1002/2015GC005791
de Moor, J. M., Aiuppa, A., Pacheco, J., Avard, G., Kern, C., Liuzzo, M., et al. (2016). Short-period volcanic gas precursors to phreatic eruptions: Insights from Poás Volcano, Costa Rica. Earth Planet. Sci. Lett. 442, 218–227. doi:10.1016/j.epsl.2016.02.056
de Moor, J. M., Kern, C., Avard, G., Muller, C., Aiuppa, A., Saballos, A., et al. (2017). A new sulfur and carbon degassing inventory for the Southern Central American Volcanic Arc: The importance of accurate time-series datasets and possible tectonic processes responsible for temporal variations in arc-scale volatile emissions. Geochem. Geophys. Geosyst. 18, 4437–4468. doi:10.1002/2017GC007141
Dempsey, D. E., Cronin, S. J., Mei, S., and Kempa-Liehr, A. W. (2020). Automatic precursor recognition and real-time forecasting of sudden explosive volcanic eruptions at Whakaari, New Zealand. Nat. Commun. 11, 3562–3568. doi:10.1038/s41467-020-17375-2
Fiege, A., Behrens, H., Holtz, F., and Adams, F. (2014). Kinetic vs. thermodynamic control of degassing of H2O-S±Cl-bearing andesitic melts. Geochim. Cosmochim. Acta 125, 241–264. doi:10.1016/j.gca.2013.10.012
Galle, B., Johansson, M., Rivera, C., Zhang, Y., Kihlman, M., Kern, C., et al. (2010). Network for observation of volcanic and atmospheric change (NOVAC)—a global network for volcanic gas monitoring: Network layout and instrument description. J. Geophys. Res. 115, D05304. doi:10.1029/2009JD011823
Galle, B., Oppenheimer, C., Geyer, A., Mcgonigle, A. J. S., Edmonds, M., and Horrocks, L. (2002). A miniaturised ultraviolet spectrometer for remote sensing of SO2 fluxes: A new tool for volcano surveillance. J. Volcanol. Geotherm. Res. 119, 241–254. doi:10.1016/S0377-0273(02)00356-6
Global Volcanism Program (2013). Sinabung (261080) in Volcanoes of the World. Available at: https://volcano.si.edu/volcano.cfm?vn=261080 (Accessed April 25, 2022).
Gunawan, H., Surono, Budianto, A., Kristianto, Prambada, O., McCausland, W., et al. (2019). Overview of the eruptions of Sinabung Volcano, 2010 and 2013 – present and details of the 2013 phreatomagmatic phase. J. Volcanol. Geotherm. Res. 382, 103–119. doi:10.1016/j.jvolgeores.2017.08.005
Hotta, K., Iguchi, M., Ohkura, T., Hendrasto, M., Gunawan, H., Rosadi, U., et al. (2019). Magma intrusion and effusion at Sinabung volcano, Indonesia, from 2013 to 2016, as revealed by continuous GPS observation. J. Volcanol. Geotherm. Res. 382, 173–183. doi:10.1016/j.jvolgeores.2017.12.015
Iacovino, K. (2015). Linking subsurface to surface degassing at active volcanoes: A thermodynamic model with applications to Erebus Volcano. Earth Planet. Sci. Lett. 431, 59–74. doi:10.1016/j.epsl.2015.09.016
Iguchi, M., Ishihara, K., Surono, , , and Hendrasto, M., (2011). Learn from 2010 eruptions at Merapi and Sinabung Volcanoes in Indonesia. Annu. Disas. Prev. Res. Inst. 54B, 185–194.
Iguchi, M., Surono, , , Nishimura, T., Hendrast, M., Rosadi, U., Ohkura, T., Triastuty, H., et al. (2012). Methods for eruption prediction and hazard evaluation at Indonesian volcanoes. J. Disaster Res. 7, 26–36. doi:10.20965/jdr.2012.p0026
Indrastuti, N., Nugraha, A. D., McCausland, W. A., Hendrasto, M., Gunawan, H., Kusnandar, R., et al. (2019). 3-D seismic tomographic study of Sinabung Volcano, northern Sumatra, Indonesia, during the inter-eruptive period october 2010–july 2013. J. Volcanol. Geotherm. Res. 382, 197–209. doi:10.1016/j.jvolgeores.2019.03.001
Johansson, M. (2009). Application of passive DOAS for studies of megacity air pollution and volcanic gas emissions. PhD thesis. Gothenburg, Sweden: Chalmers University of Technology. Available at: https://research.chalmers.se/en/publication/88868.
Kazahaya, R., Shinohara, H., Mori, T., Iguchi, M., and Yokoo, A. (2016). Pre-eruptive inflation caused by gas accumulation: Insight from detailed gas flux variation at Sakurajima volcano, Japan. Geophys. Res. Lett. 43, 11219–11225. doi:10.1002/2016GL070727
Kern, C., Aiuppa, A., and de Moor, J. M. (2022). A golden era for volcanic gas geochemistry. Bull. Volcanol. 84, 43–11. doi:10.1007/s00445-022-01556-6
Kern, C., Deutschmann, T., Vogel, L., Wöhrbach, M., Wagner, T., and Platt, U. (2010). Radiative transfer corrections for accurate spectroscopic measurements of volcanic gas emissions. Bull. Volcanol. 72, 233–247. doi:10.1007/s00445-009-0313-7
Kern, C., Masias, P., Apaza, F., Reath, K. A., and Platt, U. (2017). Remote measurement of high preeruptive water vapor emissions at Sabancaya volcano by passive differential optical absorption spectroscopy. J. Geophys. Res. Solid Earth 122, 3540–3564. doi:10.1002/2017JB014020
Kern, C., Werner, C., Elias, T., Sutton, A. J., and Lübcke, P. (2013). Applying UV cameras for SO2 detection to distant or optically thick volcanic plumes. J. Volcanol. Geotherm. Res. 262, 80–89. doi:10.1016/j.jvolgeores.2013.06.009
Kushendratno, , Pallister, J. S., Kristianto, , , Bina, F. R., McCausland, W., Carn, S., et al. (2012). Recent explosive eruptions and volcano hazards at Soputan volcano-a basalt stratovolcano in north Sulawesi, Indonesia. Bull. Volcanol. 74, 1581–1609. doi:10.1007/s00445-012-0620-2
Lesne, P., Kohn, S. C., Blundy, J., Witham, F., Botcharnikov, R. E., and Behrens, H. (2011). Experimental simulation of closed-system degassing in the system basalt-H2O-CO2-S-Cl. J. Pet. 52, 1737–1762. doi:10.1093/petrology/egr027
Marzocchi, W., and Bebbington, M. S. (2012). Probabilistic eruption forecasting at short and long time scales. Bull. Volcanol. 74, 1777–1805. doi:10.1007/s00445-012-0633-x
Marzocchi, W., Sandri, L., and Selva, J. (2008). BET_EF: A probabilistic tool for long- and short-term eruption forecasting. Bull. Volcanol. 70, 623–632. doi:10.1007/s00445-007-0157-y
McCausland, W. A., Gunawan, H., White, R. A., Indrastuti, N., Patria, C., Suparman, Y., et al. (2019). Using a process-based model of pre-eruptive seismic patterns to forecast evolving eruptive styles at Sinabung Volcano, Indonesia. J. Volcanol. Geotherm. Res. 382, 253–266. doi:10.1016/j.jvolgeores.2017.04.004
Métrich, N., and Wallace, P. J. (2008). Volatile abundances in basaltic magmas and their degassing paths tracked by melt inclusions. Rev. Mineral. Geochem. 69, 363–402. doi:10.2138/rmg.2008.69.10
Morrissey, M. M., and Mastin, L. G. (2000). “Vulcanian eruptions,” in Encyclopedia of volcanoes. Editors H. Sigurdsson, B. F. Houghton, S. R. McNutt, H. Rymer, and J. Stix (San Diego, San Francisco, New York, Boston, London, Syndey, Toronto: Academic Press), 463–475.
Nakada, S., Zaennudin, A., Yoshimoto, M., Maeno, F., Suzuki, Y., Hokanishi, N., et al. (2019). Growth process of the lava dome/flow complex at Sinabung Volcano during 2013–2016. J. Volcanol. Geotherm. Res. 382, 120–136. doi:10.1016/j.jvolgeores.2017.06.012
Otneil Ketaren, S., Sudibyato, H. A., Hasan, W., and Purba, A. (2016). Environmental health aspect in health emergency management (a case study : Sinabung vulcanous eruption). Int. J. Appl. Nat. Sci. 5, 47–56.
Pallister, J., Papale, P., Eichelberger, J., Newhall, C., Mandeville, C., Nakada, S., et al. (2019b). Volcano observatory best practices (VOBP) workshops - a summary of findings and best-practice recommendations. J. Appl. Volcanol. 8, 2. doi:10.1186/s13617-019-0082-8
Pallister, J., Wessels, R., Griswold, J., McCausland, W., Kartadinata, N., Gunawan, H., et al. (2019a). Monitoring, forecasting collapse events, and mapping pyroclastic deposits at Sinabung volcano with satellite imagery. J. Volcanol. Geotherm. Res. 382, 149–163. doi:10.1016/j.jvolgeores.2018.05.012
Platt, U., and Stutz, J. (2008). Differential optical absorption spectroscopy - principles and applications. Berlin, Heidelberg: Springer. doi:10.1007/978-3-540-75776-4
Power, J. A., Roman, D. C., Lyons, J. J., Haney, M. M., Rasmussen, D. J., Plank, T., et al. (2021). Volcanic seismicity beneath Chuginadak Island, Alaska (Cleveland and Tana volcanoes): Implications for magma dynamics and eruption forecasting. J. Volcanol. Geotherm. Res. 412, 107182. doi:10.1016/j.jvolgeores.2021.107182
Primulyana, S., Kern, C., Lerner, A. H., Saing, U. B., Kunrat, S. L., Alfianti, H., et al. (2019). Gas and ash emissions associated with the 2010-present activity of Sinabung Volcano, Indonesia. J. Volcanol. Geotherm. Res. 382, 184–196. doi:10.1016/j.jvolgeores.2017.11.018
Rouwet, D., Mora Amador, R. A., Sandri, L., Ramírez-Umaña, C., González, G., Pecoraino, G., et al. (2019). “39 years of geochemical monitoring of laguna caliente crater lake, Poás: Patterns from the past as keys for the future,” in Poás volcano. Active volcanoes of the world. Editors F. Tassi, O. Vaselli, and R. Mora Amador (Springer), 213–233. doi:10.1007/978-3-319-02156-0_9
Sandri, L., Garcia, A., Costa, A., Guerrero Lopez, A., and Cordoba, G. (2021). Stochastic modeling of explosive eruptive events at Galeras Volcano, Colombia. Front. Earth Sci. 8, 1–19. doi:10.3389/feart.2020.583703
Scaillet, B., and Pichavant, M. (2005). A model of sulphur solubility for hydrous mafic melts: Application to the determination of magmatic fluid compositions of Italian volcanoes. Ann. Geophys. 48, 671–698. doi:10.4401/ag-3226
Sparks, R. S. J. (2003). Forecasting volcanic eruptions. Earth Planet. Sci. Lett. 210, 1–15. doi:10.1016/S0012-821X(03)00124-9
Sparks, R. S. J. (1986). The dimensions and dynamics of volcanic eruption columns. Bull. Volcanol. 48, 3–15. doi:10.1007/BF01073509
Stix, J., and de Moor, J. M. (2018). Understanding and forecasting phreatic eruptions driven by magmatic degassing. Earth Planets Space 70, 83. doi:10.1186/s40623-018-0855-z
Trnkoczy, A. (2012). “Understanding and parameter setting of STA/LTA trigger algorithm,” in New manual of seismological observatory practice 2. Potsdam: Deutsches Geoforschungszentrum). Editor P. Bormann, 1–20. doi:10.2312/GFZ.NMSOP-2_IS_8.1
Varley, N., Arámbula-Mendoza, R., Reyes-Dávila, G., Sanderson, R., and Stevenson, J. (2010). Generation of Vulcanian activity and long-period seismicity at Volcán de Colima, Mexico. J. Volcanol. Geotherm. Res. 198, 45–56. doi:10.1016/j.jvolgeores.2010.08.009
Viccaro, M., Cannata, A., Cannavò, F., De Rosa, R., Giuffrida, M., Nicotra, E., et al. (2021). Shallow conduit dynamics fuel the unexpected paroxysms of Stromboli volcano during the summer 2019. Sci. Rep. 11, 266–315. doi:10.1038/s41598-020-79558-7
Wallace, P. J., and Edmonds, M. (2011). The sulfur budget in magmas: Evidence from melt inclusions, submarine glasses, and volcanic gas emissions. Rev. Mineral. Geochem. 73, 215–246. doi:10.2138/rmg.2011.73.8
Webster, J. D., and Botcharnikov, R. E. (2011). Distribution of sulfur between melt and fluid in S-O-H-C-Cl-bearing magmatic systems at shallow crustal pressures and temperatures. Rev. Mineral. Geochem. 73, 247–283. doi:10.2138/rmg.2011.73.9
Werner, C., Kelly, P. J., Doukas, M., Lopez, T., Pfeffer, M., McGimsey, R., et al. (2013). Degassing of CO2, SO2, and H2S associated with the 2009 eruption of Redoubt Volcano, Alaska. J. Volcanol. Geotherm. Res. 259, 270–284. doi:10.1016/j.jvolgeores.2012.04.012
Werner, C., Rasmussen, D. J., Plank, T., Kelly, P. J., Kern, C., Lopez, T., et al. (2020). Linking subsurface to surface using gas emission and melt inclusion data at Mount Cleveland Volcano, Alaska. Geochem. Geophys. Geosyst. 21, 1–33. doi:10.1029/2019GC008882
Wickman, F. E. (1976). “Markov models of repose-period patterns of volcanoes,” in Random processes in geology. Editor D. F. Merriam (Berlin, Heidelberg, New York: Springer), 135–161. Available at: https://link.springer.com/chapter/10.1007/978-3-642-66146-4_11.
Withers, M., Aster, R., Young, C., Beiriger, J., Harris, M., Moore, S., et al. (1998). A comparison of select trigger algorithms for automated global seismic phase and event detection. Bull. Seismol. Soc. Am. 88, 95–106. doi:10.1785/bssa0880010095
Wright, H. M. N., Pallister, J. S., McCausland, W. A., Griswold, J. P., Andreastuti, S., Budianto, A., et al. (2019). Construction of probabilistic event trees for eruption forecasting at Sinabung volcano, Indonesia 2013–14. J. Volcanol. Geotherm. Res. 382, 233–252. doi:10.1016/j.jvolgeores.2018.02.003
Keywords: Sinabung Volcano, Vulcanian explosions, volcanic gases, DOAS, eruption forecasting, sulfur dioxide, volcanic eruptions, remote sensing
Citation: Kunrat S, Kern C, Alfianti H and Lerner AH (2022) Forecasting explosions at Sinabung Volcano, Indonesia, based on SO2 emission rates. Front. Earth Sci. 10:976928. doi: 10.3389/feart.2022.976928
Received: 23 June 2022; Accepted: 05 August 2022;
Published: 12 September 2022.
Edited by:
Yosuke Aoki, The University of Tokyo, JapanReviewed by:
Karoly Nemeth, Massey University, New ZealandCopyright © 2022 Kunrat, Kern, Alfianti and Lerner. This is an open-access article distributed under the terms of the Creative Commons Attribution License (CC BY). The use, distribution or reproduction in other forums is permitted, provided the original author(s) and the copyright owner(s) are credited and that the original publication in this journal is cited, in accordance with accepted academic practice. No use, distribution or reproduction is permitted which does not comply with these terms.
*Correspondence: Syegi Kunrat, c3llZ2lrdW5yYXRAZ21haWwuY29t
Disclaimer: All claims expressed in this article are solely those of the authors and do not necessarily represent those of their affiliated organizations, or those of the publisher, the editors and the reviewers. Any product that may be evaluated in this article or claim that may be made by its manufacturer is not guaranteed or endorsed by the publisher.
Research integrity at Frontiers
Learn more about the work of our research integrity team to safeguard the quality of each article we publish.