 Xi Lu
Xi Lu Liming Jiang
 Cunde Xiao3
94% of researchers rate our articles as excellent or good
Learn more about the work of our research integrity team to safeguard the quality of each article we publish.
Find out more
ORIGINAL RESEARCH article
Front. Earth Sci., 17 August 2022
Sec. Cryospheric Sciences
Volume 10 - 2022 | https://doi.org/10.3389/feart.2022.972291
This article is part of the Research TopicCryosphere and Climate Change in the Arctic, the Antarctic and the Tibetan PlateauView all 24 articles
The Northeast Greenland Ice Stream (NEGIS), the largest basin in Greenland, is undergoing rapid and sustained dynamic change. However, the ice-flow behaviours over decadal timescales and the impacts of ice geometry and hydrology remain poorly understood. Here, we investigated the spatial and temporal characteristics of ice motions of three branches in NEGIS between 1985 and 2018 in response to bed topographic features and surface meltwater runoff based on 33 years of annual ice velocities derived from the satellite image of Landsat series. Spatial heterogeneities in ice velocity were found in three glaciers and were correlated with subglacial topography. Specifically, the peak velocities of both Nioghalvfjerdsfjorden and Zachariæ Isstrøm glaciers occur near the grounding line zone, where tidewater acts as a crucial force causing ice retreat, subglacial melting, and further acceleration. While for the Storstrømmen glacier, changes in the slope of the ice bed might cause an increase in ice motion in its inland segment. The temporal variability of ice velocity for both Nioghalvfjerdsfjorden and Zachariæ Isstrøm glaciers shows a clear regional speedup, with a mean increase of 14.60% and 9.40% in 2001–2018 compared to 1985–2000, but a widespread slowing of Storstrømmen glacier with a mean of 16.30%, which were related to a 184% surface runoff increase. This hydrodynamic coupling on ice motion over decadal timescales in these three glaciers is in line with previous studies on short-term acceleration in NEGIS induced by surface melt, not in agreement with negative feedback between enhanced surface meltwater production and ice motion previously reported in the southwest Greenland ice stream. Our work highlights crucial roles of subglacial topography and surface runoff on ice motion, which helps to promote understanding of dynamic changes of NEGIS response to changing atmospheric circumstances.
The Greenland ice sheet (GrIS), the second largest ice sheet in the world, has experienced marked acceleration in loss of mass and ice velocity linked to atmospheric and ocean warming since the beginning of the 21st century (Bevan et al., 2012; Straneo et al., 2013; Cook et al., 2014; Kjeldsen et al., 2015; Rignot et al., 2017). It has been the major contributor to sea level rise since the early 1990s with a 1991–2015 average annual mass loss of approximately 0.47 ± 0.23 mm sea-level equivalent (SLE) and a peak contribution of 1.2 mm SLE in 2012, and the loss is substantially attributed to the dynamic changes of outlet glaciers (King et al., 2020; Shepherd et al., 2012; van den Broeke et al., 2016; Noël et al., 2019).In Greenland, the glaciers are more active in northwest and southeast sectors as most of the glaciers are in contact with the ocean and shown strong mass loss (Abdalati et al., 2001; Khan et al., 2014). However, it is worth noting that the Northeast Greenland Ice Stream (NEGIS) contains many marine-terminating glaciers, and is also a region of high climatic sensitivity, but received relatively little attention (Hoejmark Thomsen et al., 1997; Nick et al., 2012; Larsen et al., 2018).
The NEGIS consists of an ice stream that is approximately 600 km long, drains 12–16% of the interior GrIS, and is home to three major glaciers including: Nioghalvfjerdsfjorden (79N), Zachariæ Isstrøm (ZI), and Storstrømmen (SG). The 79N glacier formed a large (80 km long) floating tongue confined in a wide (20 km) valley (Mayer et al., 2000; Mayer et al., 2018), which flowed at approximately 1.2 km/yr within a few kilometers of the ice front and exhibited the sustained stability with few variations until 2012 (Rignot and Kanagaratnam 2006; Bevan et al., 2012; Rosenau et al., 2015). The ice shelf near the grounding line thinned by 30% from 1999 to 2014 (Mouginot et al., 2015), and its northern branch was calved in July 2020. After losing a large part of the ice shelf during 2002, the ZI glacier accelerated to a speed greater than 0.6 km/yr between 2001 and 2011 (Rignot and Kanagaratnam 2006; Joughin et al., 2010). Since then, the glacier has continued retreating, thinning, and accelerating, and reached a velocity of 2 km/yr near its calving front in 2015 (Khan et al., 2014; Mouginot et al., 2015). The dynamic variations of these two glaciers highlight the vulnerability of the NEGIS to climate change. The SG glacier surged with a velocity of 1.5–2 km/yr at the front during 1978–1984 and has been static ever since (Reeh et al., 1994; Hill et al., 2018; Mouginot et al., 2018). Previous studies have suggested that rapid flow during the active phase is controlled by either basal temperature (Fowler et al., 2001) or hydrology (Kamb et al., 1985). However, the response of ice motion and hydrology over long time series in SG glacier remains unclear. Although several recent studies have revealed the dynamic changes of individual glaciers in the NEGIS, they have focused on short-term seasonal ice motion as well as thinning and retreat attributed to ocean thermal forcing (Khan et al., 2014; Mouginot et al., 2015; Rathmann et al., 2017; Neckel et al., 2020; An et al., 2021). The ice motion anomaly and its links with ice geometry and hydrology in this region have received limited attention at long-term and basin scales for more than 2 decades.
In general, the acceleration of marine-terminating glaciers is primarily driven by processes at the ice-ocean interface (Joughin et al., 2020; Wood et al., 2021). Ocean warming is likely to increase the rates of submarine melting and discharged meltwater plumes, which may exacerbate the rate of melting (Slater et al., 2016). Additionally, the reduction of sea ice may promote calving, allowing more ice to break off the ice sheet, this forcing can cause rapid glacier retreat and acceleration (McFadden et al., 2011; Cook et al., 2014). However, local topographic factors affect the extent to which individual glaciers respond to these forcing at the ice-ocean interface (Moon and Joughin 2008; Carr et al., 2015). For example, reverse bed slopes may make glaciers more prone to acceleration and increase ice retreat (Thomas et al., 2009; DeConto and Pollard 2016). The local topographic variability underlines the importance of targeted glacier surveys, which are crucial for accurately predicting the response of the glaciers in NEGIS to climate change (Hill et al., 2017).
Rising atmosphere temperature increase surface melting and has a significant influence on glaciers dynamic changes (Mouginot et al., 2015). One hypothesis is that increased meltwater runoff enhances the thermohaline circulation and submarine melting in terminus, thus drives a stronger ice motion (Xu et al., 2013). Another hypothesis is that enhanced runoff contributes to glaciers motion via hydrofracturing and increasing basal water pressure (Pollard, DeConto, and Alley 2015). However, the mechanism behind the behavior of marine-terminating glaciers is complex and the subglacial discharge induced by increased meltwater runoff and hydrodynamic coupling has not well understood and link to glacier dynamics in recent years. In Greenland, some previous studies indicated that the exact mechanism of enhanced runoff effects on glacier velocity is highly controversial across different regions and time scales. For example, increased meltwater inputs lead to short-term velocity increases in Jakobshavn glacier, which has been attributed to the drainage of surface meltwater to the subglacial zone. Increased basal water pressure alters the effective pressure (defined as the difference between the overburdened ice and basal water pressure) and reduces friction at the ice bed interface, thereby promoting faster sliding (Zwally et al., 2002; Hoffman et al., 2011). However, several studies found that increased meltwater production results in a net annual deceleration of ice-flow motion owing to drainage channels evolving from inefficient to efficient and therefore the faster draining of high-pressure water (Schoof 2010; Cowton et al., 2013; Tedstone et al., 2015). In recent years, the expansion of ablation area in north Greenland is almost twice as much as in the south response to recent warming, amplifying runoff production in north Greenland (Noël et al., 2019). However, little is known about the effect of runoff input on ice velocity in NEGIS, especially on a long-term scale (Hill et al., 2017; Williams et al., 2020).
In this study, we investigated the spatial and temporal characteristics of ice motion in the 79N, ZI, and SG glaciers in NEGIS over the last 33 years, using annual ice velocity data products derived from satellite remote sensing between 1985 and 2018. We then linked subglacial geometry to ice dynamic changes to estimate the influence of basal topography features on the heterogeneous spatial distributions of three individual glaciers. Finally, we investigated the relationship of the surface meltwater runoff and decadal variations of glacier velocities, thus estimating the impacts of hydrothermal conditions on long-term ice dynamic changes in NEGIS.
To assess annual changes in ice motion over decadal timescales, we employed the annual ice velocity of The Inter-Mission Time Series of Land Ice Velocity and Elevation (ITS_LIVE), which was created using the method of feature tracking and error-weighted average of all image-pair velocity fields derived from Landsat images, and available from 1985 to 2018 with a spatial resolution of 240 m (Gardner et al., 2018; Gardner et al., 2019a). Preprocessing includes the normalization of local variability in image radiance caused by shadows, topography, sun angle, and the removal of Landsat 4 and 5 along track artifacts and SLC-OFF of Landsat 7. The errors were corrected by setting the rock surface velocity to zero and setting the slow-moving area to the median reference velocity of the MEaSURE data (Gardner et al., 2019b).
Following the method of Tedstone et al. (2015), we computed the median percentage change in ice velocities over the study area (Figure 1) between 1985–2000 and 2001–2018. We then calculated the distribution of the median percentage change over the three glacial catchments below 1,600 m.a.s.l. For each 200 m-elevation band, we presented the median percentage change and median deviation of each glacier velocity.
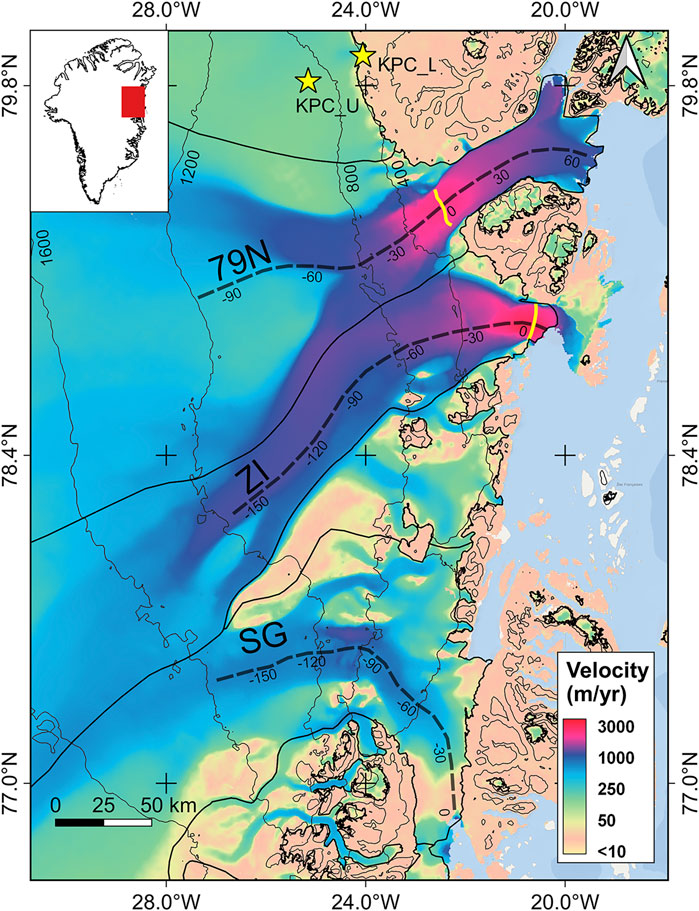
FIGURE 1. Study area of the catchment in NEGIS divided into separate glaciers by the bold black line (Mouginot and Rignot 2019). Average glacier velocities (m/yr) between 1985 and 2018 derived from ITS_LIVE are shown (Gardner et al., 2018). The short dash black lines show the central flow lines of each glacier.The thin gray lines are 400–1600 m contour line of ice surface elevation, and the yellow lines are the ground line locations of 79N and ZI glaciers (Morlighem et al., 2017). Asterisks indicate the two closest automatic weather stations (AWS) in the Programme for Monitoring the Greenland Ice Sheet (PROMICE) project (Fausto and Van as 2019).
We then explored the temporal variability in glacier velocities along the central flow lines of the three glaciers according to the streamline of NEGIS region provided by Krieger et al. (2020) and Nagler et al. (2015), and the points with velocity values were separated by 1 km and extracted by bilinear interpolation. To avoid the effect of null values or large errors on the analysis of temporal variation of velocity, we excluded points with velocity values with errors greater than 30%. Additionally, central flow line segments with relatively complete velocity values were selected to ensure the comparability of the time series variability. The velocity maps of 1996, 2002, and 2003 could not represent the mean ice velocity because of the large amount of missing data in the whole basin and were not considered during the time series analysis.
Previous studies have shown that the velocity magnitude has a biased mean that increases with the standard deviation of the components (Dehecq et al., 2019). The absolute magnitude of ice velocity may cause an artificial negative velocity trend, particularly where the signal-to-noise ratio of ice velocity is low in slow-flowing sectors (Williams et al., 2020). Therefore, in the comparisons process with the factors such as air temperature, we calculated the anomaly to analyze the temporal variation trends. We defined the velocity anomaly as the difference between the annual velocity and the mean velocity from 1985 to 2018, using the method of Williams et al. (2020). This method concentrates the noise distribution symmetrically around zero and removes any artificial slowing trends resulting from changes in the noise magnitude between different sensors.
Climate warming can cause an increase in meltwater and affect glacier movement, so we employed the ERA5 monthly averaged reanalysis temperature of air 2 m above the surface of glaciers from 1979 to 2019 to calculate the air temperature change anomaly (Wang et al., 2019). For validation, we also calculated the average annual temperature anomaly from 2009 to 2018 using monthly averages of near-surface air temperatures acquired by the AWS KPC_L and KPC_U of PROMICE (Fausto and Van as 2019).
To explore the relationship between runoff and ice velocity in three glaciers from 1985 to 2019, we investigated the changes in surface meltwater runoff provided by PROMICE (Mankoff et al., 2020). Previous studies have shown a statistical relationship between ice movement and annual melt volume and accounted for 50% of the ice movement by including 3 years of antecedent melt volume (Tedstone et al., 2015). Therefore, following this study, we performed the regression analysis of the glacier velocity anomalies and surface meltwater runoff (averaged over the first N years) for each glacier. R2 is coefficient of determination from 0 to 1, using to quantify the strength of the relationship between glacier velocity change and the antecedent runoff. p value represents significance and is used to judge whether R2 is statistically significant, with a general standard of 0.05. If the value is less than 0.05, R2 is significant.
We used IceBridge Bedmachine Greenland, Version 3 data with 150 m resolution to acquire bed elevation, ice surface elevation, and ice thickness (Morlighem et al., 2017). These were extracted along the central flow lines of the three glaciers and sampled over 1 km. The distance between the ice bed and lower surface of the glacier was calculated by subtracting the ice thickness from the ice surface elevation.
To assist the analysis of the impact of runoff on ice motion, we investigated the 5-year average changes in glacier surface elevation from 1992 to 2020 provided by CCI (Simonsen and Louise, 2017; Sørensen et al., 2018). We also computed the median percentage change in surface elevation over the study area between 1992–2000 and 2001–2018.
The spatial variation in ice velocity in the NEGIS showed distinct differences for each glacier (Figure 2A). The catchments of 79N and ZI glaciers experienced a larger area of ice-flow acceleration in 2001–2018 than in 1985–2000, with 78.77% (16,039 km2) of the total surface area in the 79N glacier and 92.50% (9,138 km2) of the total surface area in the ZI glacier exhibiting increased velocity. The mean acceleration was approximately 14.60% and 9.40%, respectively (Figure 2B). In contrast, the SG glacier displayed a widespread ice-flow deceleration of approximately 81.37% (9,118 km2) between 1985–2000 and 2001–2018, with a mean deceleration of 16.30%.
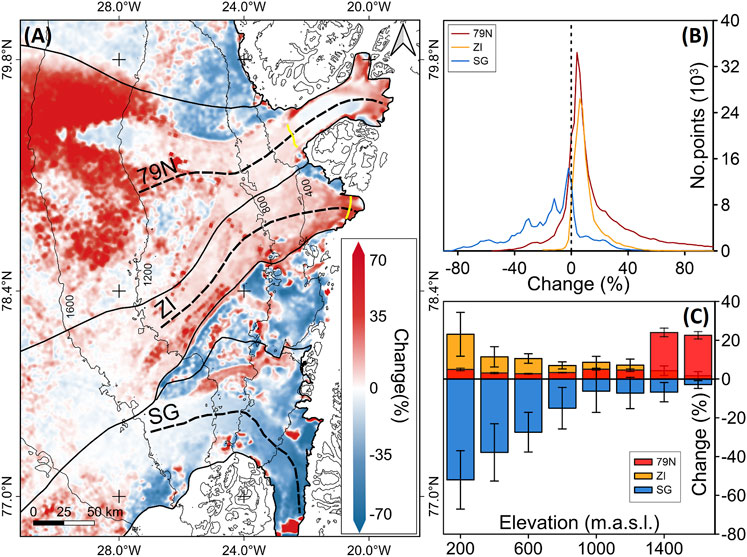
FIGURE 2. (A) Spatial pattern of velocity change of three glaciers in NEGIS between 1985–2000 and 2001–2018. The colour scale shows the median percentage change in ice velocities during 2001–2018 compared with the 1985–2000 reference period, the short dash lines represent the central flow lines, the yellow lines indicate the grounding lines of the 79N and ZI glaciers (Morlighem et al., 2017), the thin gray lines are 400–1600 m contour lines representing ice surface elevation (Morlighem et al., 2017). (B) Median percentage velocity changes for each glacier sampled at 240 m intervals between 0 m.a.s.l. and 1,600 m.a.s.l. (C) Median percentage velocity changes for eachglacier in each 200 m contour interval between 0 m.a.s.l. and 1,600 m.a.s.l. The error bar shows the median absolute deviation.
The areas with the strongest velocity increase were in different sectors of the 79N and ZI glaciers, and the acceleration percentages varied according to the contour interval (Figure 2C). The acceleration in the 79N glacier was approximately 20% greater at higher surface elevation of 1,200–1,600 m.a.s.l., and approximately 5% at lower elevations (Figure 2C). Glacier velocity showed an accelerating trend with an increase in surface elevation. For the ZI glacier, between 1985 and 2018, its higher velocity sectors (approximately 20%) occurred near the terminus at a low surface elevation of 0–200 m.a.s.l., and the percentage of velocity increase decreased as the surface elevation increased (Figure 2C).
The deceleration in the SG glacier was greatest (20–50%) below 800 m.a.s.l. (Figure 2C). The glacier also shows that the percentage of velocity variations changed with the surface elevation, which decreased as it approached the interior and was similar to the pattern of long-term velocity change in southwest Greenland (Williams et al., 2020).
To explore the temporal characteristics of ice motion, we compared the variations of two specific periods of glacier velocity along the central flow lines (Figure 3). The velocities of the 79N and ZI glaciers showed limited change between 1985 and 2000, but gradually increased after 2000, especially near their grounding line (Figures 3A,B). In contrast, the SG glacier continued to slow between 1985 and 2000 and approached a static state after 2000 (Figure 3C).
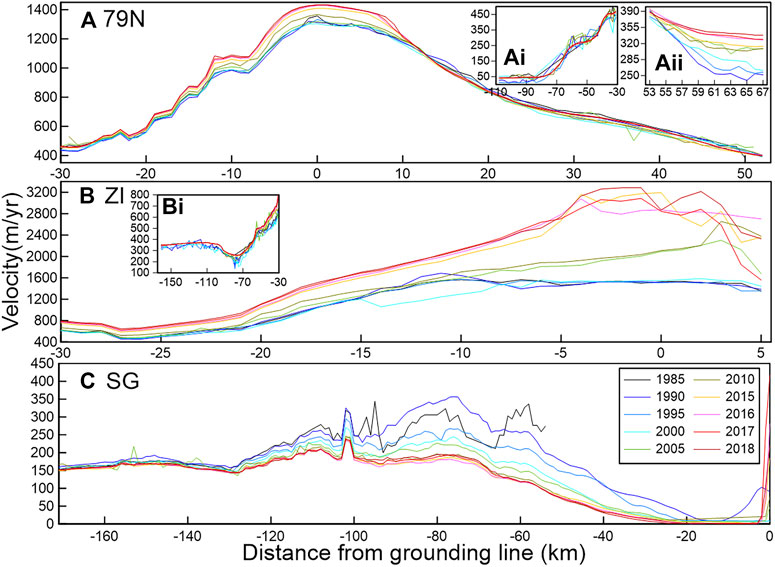
FIGURE 3. (A) Temporal characteristic of the velocity variations of three glaciers along their central flow lines. The velocity of the 79N glacier at -30 to -53 km along the central flow line. 0 in the X axis indicates the grounding line position of 79N glacier as shown in Figure 1, and the negative values point to the direction of internal extension of the ice sheet. (Ai) The velocity of 79N glacier at -110 to -30 km along the central flow line. (Aii) The velocity of the 79N glacier at 53 to 67 km along the central flow line. (B) The velocity of ZI glacier at -30 to 5 km along the central flow line (Bi) The velocity of ZI glacier at -140 to -30 km along the central flow line. (C) The velocity of SG glacier along the central flow line.
Specifically, the time evolution of ice velocity in the upper areas of 79N is not significant, and it has not accelerated significantly in the past 33 years (Figure 3Ai). Starting 30 km upstream of the grounding line, the characteristics of the velocity variation with time become apparent, especially near the grounding line (Figure 3A). The ice velocity accelerated rapidly between 2000 and 2015, followed by decreased acceleration. Within 14 km of the glacier terminus, the ice velocity gradually decreases (Figure 3Aii), but again showed distinctive temporal evolution characteristics. Unlike the area near the grounding line, the ice velocity in this area has been accelerating slowly since 1985.
Similar to the 79N glacier, the upstream velocity of the ZI glacier changed little before 2000 (Figure 3Bi). From 30 km upstream of the grounding line to the terminus, the glacier velocity showed an apparent characteristic of time evolution (Figure 3B). Since 2000 to 2015, the velocity rapidly accelerated, followed by slowed acceleration for the next 3 years. The velocity reached 3,200 m/yr near the terminus of ZI glacier in 2018, compared to the peak velocity of only 1400 m/yr in 79N.
The ice velocity of SG is was small (Figure 3C). Unlike the other two glaciers, SG decelerated from 1985 to 2018. The ice velocity changed little over time upstream of approximately 120–170 km from the grounding line. In the rest of the segment, the glacier slowed rapidly before 2000, but the deceleration began to slow after 2000 and appeared to move slightly around 2016.
Each individual glacier in the NEGIS has distinct geometric variability (Figure 4), which is an important factor in determining the response of glaciers to ocean and atmosphere warming (Thomas et al., 2009; Cowton et al., 2018). Our results show that glacier velocity is related to the position of the grounding line near the terminus.
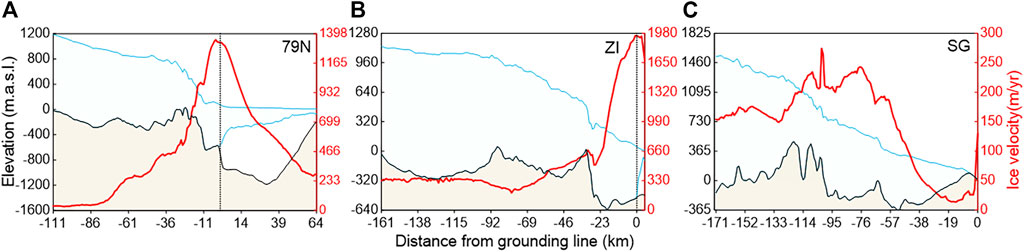
FIGURE 4. For each glacier, 79N (A), ZI (B) and SG (C), the average ice velocity from 1985 to 2018 is shown in red lines, the surface topography is shown in bright blue, and bedrock is shown in black for each glacier along its central flow line. The vertical black lines indicate the respective grounding line position of the 79N and ZI glaciers.
For the 79N glaciers with floating ice tongue, we found that the velocity increased rapidly approaching the grounding zone and the peak velocity generally occurred near the grounding zone (Figure 4A). Generally, the state of floating ice tongues downstream of the grounding line affects glacier movement (Hill et al., 2017). The glacier with floating ice provides less base/lateral resistance than those without, which makes the glacier insensitive to the retreat at terminus and its acceleration after retreat is negligible (Hill et al., 2018). However, the acceleration of the 79N glacier as it retreated in the early 21st century was inconsistent with the general pattern that glacier velocities with floating ice tongues are not sensitive to retreat, and occurred mainly in the grounding zone (Khan et al., 2014; Mouginot et al., 2015). This was related to the steep and unstable bed slope in the grounding zone in the 79N glaciers, which exacerbate the continued acceleration and retreat of glacier (Khan et al., 2014; Mouginot et al., 2015; Hill et al., 2018). In addition, a more than 70 km long and 1,200 m deep cavity underneath the 79N ice shelf and its northern branch facilitate the intrusion of warm water and the erosion to the underside of the ice shelf, which associated with the spatial distribution of ice velocity in the grounding zone (Wilson and Straneo 2015). Several previous studies have also identified the critical role of warming seawater in the acceleration and dynamic thinning of marine-terminating glaciers (Joughin et al., 2004; Howat et al., 2005; Nick et al., 2009; Joughin et al., 2010; Vieli and Nick 2011).
For the ZI glacier, the grounding zone near its terminus contact with the seawater directly, where the ice motion is fastest (Figure 4B). In 2002, its floating ice tongue broke off and the glacier gradually accelerated (Khan et al., 2014; Mouginot et al., 2015). Although the glacier with floating ice was insensitive to the retreat at terminus, while once the tongue fully collapses and the terminus becomes grounded, basal resistance becomes an important control and basal topography becomes even more important (Hill et al., 2018). Therefore, the acceleration different from the general pattern in ZI glacier still related to the steep and unstable bed slope in the grounding zone.
In contrast to the other two glaciers, the grounding line of SG glacier on the smooth ice bed above sea level near the terminus (Figure 4C), the ice flow barely contacts seawater and the variations in ice velocity are not extensively affected by seawater and bed slope. In the upstream of the SG glacier, the ice bed suddenly dipped downward and accompanied by the fluctuated surface velocity. This indicates that undulations in the bed slope may induce the local movement of the glacier through the patterns of basal stress (Figure 4C).This consistent with previous studies which found that the dynamic changes of the inland glacier movement was related to the bedrock topography (Sergienko and Hindmarsh 2013; Sergienko et al., 2014; Hvidberg et al., 2020).
From 1985 to 2018, the time series of ice velocity anomalies revealed mean acceleration in the 79N (R2 = 0.5) and ZI glaciers (R2 = 0.77) and deceleration in the SG glacier (R2 = 0.85). However, the two most statistically distinct periods were identified in each glacier through several best-fit tests and showed similar positive changes since 2000 (Figures 5A–C). Varying degrees of ice flow deceleration trends were found from 1985 to 2000 in the three glaciers, among which 79N and ZI were relatively stable (-0.75 ± 0.25m/yr2 and -0.25 ± 1.28 m/yr2), whereas SG experienced a steep deceleration in ice velocity (-4.97 ± 0.5 m/yr2). In contrast, from 2000 to 2018, 79N and ZI glaciers experienced substantial ice flow acceleration of 1.95 ± 0.45 m/yr2 and 24.1 ± 2.87 m/yr2, respectively. Over this period the deceleration trend of the SG glacier gradually flattened (-1.22 ± 0.16 m/yr2) compared to its previous rate between 1985 and 2000.
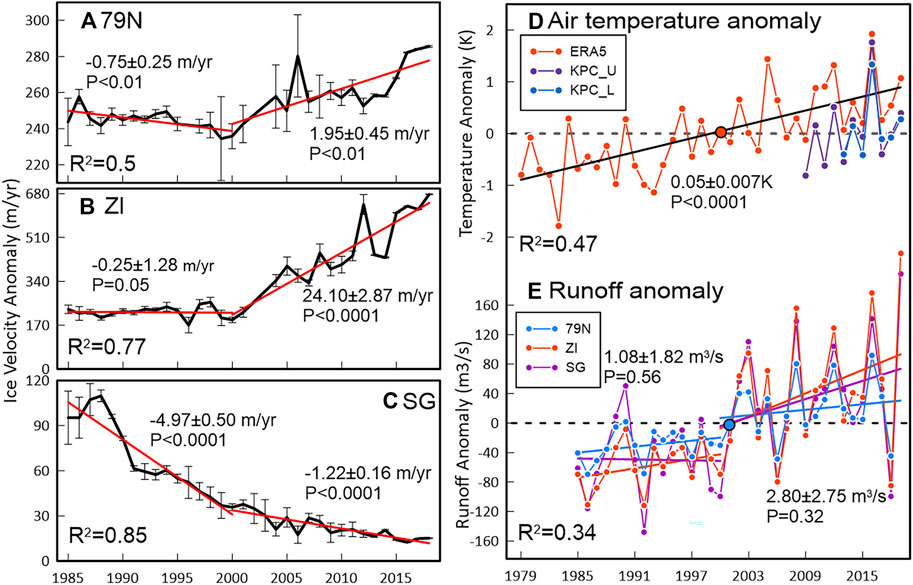
FIGURE 5. Time series of the velocities anomaly in the 79N (A), ZI (B), and SG (C) glacier along their respective central flow lines, R2 is the indicator of how well the trend line fits. (D) Air temperature anomaly derived from automatic weather station and ERA5 datasets along the respective central flow lines of the three glaciers. (E) Runoff variation anomaly in each basin of the three glaciers.
The mean surface air temperature anomaly in three glaciers from the ERA5 dataset, which was well verified by the in-situ measurements of two weather stations, shows a clear increase of 0.47 ± 0.007 K and exceeded the average temperature in 2000 (Figure 5D). The runoff anomaly was relatively stable before 2000, with only a small rise of 1.08 ± 1.82 m3/s per year. After 2000, a sustained increase in the runoff anomaly (1.99 ± 2.56 m3/s per year) was observed which exceeded the average in 2000 similar to the air temperature, and increased by 184% between 1985–2000 and 2000–2019 based on the median runoff production for each period (Figure 5E). Overall, the rapid increase in runoff production since 2000 has coincided with the acceleration of the ice motion of the 79N and ZI glaciers, which indicates that runoff changes might modulate the movement of the three glaciers. During our study period, the ice motion pattern was different in the SG glacier as it decelerated continuously (Figure 5C). The glacier surged between 1978 and 1984, and its floating ice tongue began to advance in the 1970s and continued until 1985, with the overall thickening and decelerating inland, thinning and accelerating near the terminus, and the glacier remained stationary ever since (Reeh et al., 1994; Hill et al., 2018; Mouginot et al., 2018). However, our results show that the increases in temperature and runoff might have impeded the deceleration since 2000, leading to a stabilization trend in the ice flow deceleration of the SG glacier.
Figure 5 shows that the temporal variation of glacier velocity lags behind the increase in runoff, as runoff experienced a long-term increase from 1985 while glacier velocities only started to increase in 2000. Previous studies also have concluded that there is a certain relationship between antecedent runoff and ice velocity (Tedstone et al., 2015; Williams et al., 2020). Therefore, we calculated the statistical relationship of glacier velocity anomaly and the antecedent 0–30 years of runoff anomaly. The R2 values between runoff anomaly and glacial velocity increased when more antecedent melt years are included (Figure 6). Although Williams et al. (2020) suggests that this significant relationship may be constructed as more antecedent runoff are included and the data became smoothed. However, the correlation in this study between ice velocity anomaly and runoff anomaly reached the maximum (0.66, 0.81, and 0.74) in six, five, and 8 years for the three glaciers, which did not continually increase due to the gradual smoothing of runoff. Our findings indicate a strong correlation between the antecedent runoff and ice velocity variations and underline the positive response of ice flow to enhanced runoff production, but there is a delay of approximately five to 8 years for glacier movement. This may be due to the fact that surface meltwater can be trapped and stored in the bed of the ice sheet, thus forming multi-year effects (Willis et al., 2015). Karlsson and Dahl-Jensen (2015) also showed the possibility for far field controls on the subglacial water system of NEGIS, and that the variations in subglacial water outflux at the outlets of three glaciers may be caused by changes in several hundred kilometers upstream. Thus, observed changes in ice-flow velocity at the margins are not necessarily caused by processes in the same spatial and temporal scale.
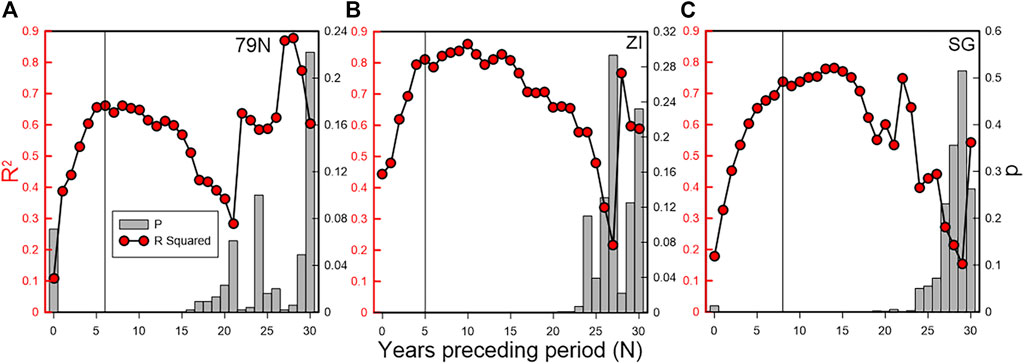
FIGURE 6. Statistical relationship between runoff anomaly preceding N years and three glacial velocity anomalies for the glaciers 79N (A), ZI (B) and SG (C). The line with the red dot indicates R2, the grey bar indicates p value. The black vertical line indicates the maximum value of R2 on each glacier before it starts to decrease.
Subglacial drainage systems play key roles in controlling the glacier dynamics in GrIS through the drainage of surface meltwater runoff to the subglacial area, especially for the land-terminating glaciers (Nienow et al., 2017; Davison et al., 2019). However, our study indicates the possibility that long-term velocity changes in marine-terminating glaciers are also influenced by subglacial drainage systems. The continuous increase in surface meltwater runoff for many years causes gradual pressure buildup in the subglacial drainage system, which accelerates or retards deceleration in the glacier. Some studies have attributed the deceleration of ice motion in southwest Greenland to the channeling action of subglacial drainage systems, which increased drainage efficiency and reduced subglacial water pressure, and slowed the ice motion (Tedstone et al., 2015; Williams et al., 2020). In other words, more effective drainage led to the reduction of basal pressure and thus result in the deceleration of inter-annual changes. However, the glacier has been accelerating (retarding deceleration) following the continuous increase of runoff since 2000, and the change from inefficient to high-efficiency drainage in the hydrological system does not appear to be significant, or limited in NEGIS (Neckel et al., 2020). Davison et al. (2019) show that the efficient channels can form along principal water flow paths beneath large areas of the ablation area (up to at least ∼40 km from the margin), but their formation and persistence appears to be suppressed and may even be precluded with increasing ice thickness and distance from the margin. Northeast Greenland is clearly larger than the southwest, and as the largest basin in Greenland, its subglacial drainage path extends further inland than the southwest. This indicates that even if there is channeled efficient drainage in NEGIS, it only occurs in the downstream. However, in the larger upstream un-channelized area, the basal pressure keeps increasing after the runoff input increases. The upstream meltwater input and the increased basal pressure may have a greater impact on the ice velocity than the downstream channelization at a small scale. Therefore, we propose that weak channelization in NEGIS may be responsible for the differences with the southwest Greenland. It is worth mentioning that marine-terminating glacier dynamics are complex and related to ice-ocean interactions, such as fjord water and calving (Howat et al., 2005; Cowton et al., 2018). Therefore, increased runoff may not be a dominant factor in the acceleration of glaciers in NEGIS, but the surge of runoff on the long-term scale is correlated with the changes of glacier velocity in this region.
Generally, ice surface melting results in an increase in ice runoff and a decrease in ice surface elevation (Gilbert and Kittel 2021). To further estimate the relationship between runoff and ice velocity, we compared the changes in glacier surface elevation and ice velocities between 1992 and 2018. The thinning of 79N and ZI glaciers significantly accelerated and expanded to a greater area and magnitude after 2000, and the thickening of the SG glacier decreased (Figure 7). During the same period, the runoff of the three glaciers increased two to six times, went from a negative to a positive rate of increase for the SG glacier. We found that significant thinning areas of the surface elevation for the three glaciers spatially corresponded with greater changes in ice velocity (Figure 3), indicating that large amounts of runoff were generated in the significant change areas of ice velocity after 2000. Recent studies have suggested that some supraglacial lakes forming in these areas drain rapidly beneath the ice in a short time, further demonstrating the process of runoff discharge into ice bed in areas with significant ice velocity variations. (Neckel et al., 2020; Turton et al., 2021).
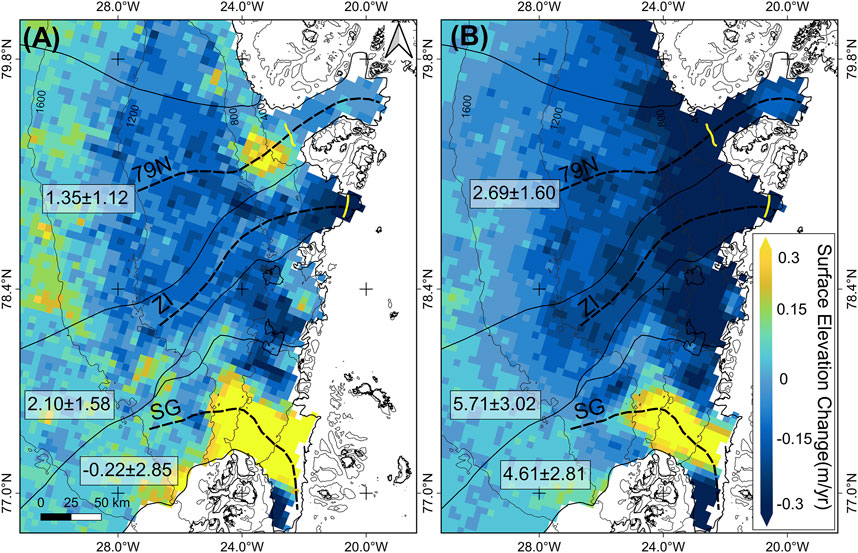
FIGURE 7. Median surface elevation changes across the study area between 1992 and 2000 (A) and between 2001 and 2018 (B). The values showed in the boxes are the changes of runoff (m3/s) in the basins of each glacier. The yellow lines indicate the grounding line of 79N and ZI glaciers (Morlighem et al., 2017). The short dash lines show the central flow lines. The thin gray lines are 400–1600 m contour line of ice surface elevation.
By analyzing annual ice velocity data from 1985 to 2018, derived from satellite remote sensing images, we found that the 79N, ZI, and SG glaciers in the NEGIS experienced spatially heterogeneous variations in ice motion over decadal timescales, which are generally related to the subglacial topographic features. Our results revealed a clear regional ice-flow speedup in both the 79N and ZI glaciers, with a mean increase of 14.60% and 9.40% in 2001–2018 compared to 1985–2000, but a widespread deceleration of the SG glacier with a mean of 16.30%. The 184% increase in surface runoff was strongly correlated with the ice velocity changes in the three glaciers.
Our statistical analysis showed that surface runoff has a significant positive effect on glacier movement over decadal time scales in this basin, which is supported by previous studies on supraglacial lake dynamics (Neckel et al., 2020; Turton et al., 2021). However, the influence of several other driving forces (such as basal melting (Rignot et al., 1997) and mélange buttressing (Khan et al., 2014)) could not be excluded because of the complexity of marine-terminating glacier dynamics. This study highlights the crucial roles of subglacial topographic features and surface runoff dynamics on the ice motion of the marine-terminating glacier in NEGIS. This improves our understanding of the dynamic changes occurring in NEGIS in response to changing atmospheric circumstances. Future research is necessary to elucidate the underlying dynamic mechanisms driving hydrodynamic coupling processes on ice motion across the NEGIS.
The original contributions presented in the study are included in the article/Supplementary Material, further inquiries can be directed to the corresponding author.
XL and LJ designed the study. XL processed all the data, analyzed the results, and wrote the manuscript. LJ and CX reviewed the study and edited the manuscript. DL participated in discussions during the study. All authors contributed to the final form of the manuscript.
This research was funded by the National Key R&D Program of China (Grant No. 2018YFC1406102 and 2017YFA0603103), the Strategic Priority Research Program of the Chinese Academy of Sciences (Grant No. XDA19070104).
We would first like to thank NASA MEaSUREs ITS_LIVE project for providing velocity production data and the European Center for Medium-Range Weather Forecasts (ECMWF) for providing ERA5 dataset. Automatic weather station data and surface meltwater runoff data was provided by the Programme for Monitoring the Greenland Ice Sheet (PROMICE). Surface elevation data from 1992 to 2020 was obtained from the Greenland Ice Sheet CCI project. The basal topography data was provided by the National Snow and Ice Data Center. We are grateful to Dr. Kang Yang for his constructive suggestions on data analysis and discussion during the study and the researchers of the East Greenland Ice-core Project (EastGRIP) for their helpful suggestions on ice velocity extraction and time series analysis. We also thank the reviewers for providing valuable comments and suggestions for improving the study.
The authors declare that the research was conducted in the absence of any commercial or financial relationships that could be construed as a potential conflict of interest.
The handling editor MD declared a past co-authorship with the authors CX.
All claims expressed in this article are solely those of the authors and do not necessarily represent those of their affiliated organizations, or those of the publisher, the editors and the reviewers. Any product that may be evaluated in this article, or claim that may be made by its manufacturer, is not guaranteed or endorsed by the publisher.
Abdalati, W., Krabill, W., Frederick, E., Manizade, S., Martin, C., and Sonntag, J. (2001). Outlet glacier and margin elevation changes: Near-coastal thinning of the Greenland ice sheet. J. Geophys. Res. Atmos. 106(D24), 33729–33741. doi:10.1029/2001JD900192
An, L., Rignot, E., Wood, M., Willis, J. K., Mouginot, J., and Khan, S. A. (2021). Ocean melting of the zachariae Isstrøm and nioghalvfjerdsfjorden glaciers, northeast Greenland. Proc. Natl. Acad. Sci. 118 (2), e2015483118. doi:10.1073/pnas.2015483118
Bevan, S. L., Luckman, A. J., and Murray, T. (2012). Glacier dynamics over the last quarter of a century at Helheim, Kangerdlugssuaq and 14 other major Greenland outlet glaciers. Cryosphere 6 (5), 923–937. doi:10.5194/tc-6-923-2012
Carr, J. R., Vieli, A., Stokes, C. R., Jamieson, S. S. R., Palmer, S. J., Christoffersen, P., et al. (2015). Basal topographic controls on rapid retreat of Humboldt Glacier, northern Greenland. J. Glaciol. 61 (225), 137–150. doi:10.3189/2015jog14j128
Cook, S., Rutt, I. C., Murray, T., Luckman, A., Zwinger, T., Selmes, N., et al. (2014). Modelling environmental influences on calving at Helheim Glacier in eastern Greenland. Cryosphere 8 (3), 827–841. doi:10.5194/tc-8-827-2014
Cowton, T., Nienow, P., Sole, A., Wadham, J. L., Lis, G. P., Bartholomew, I., et al. (2013). Evolution of drainage system morphology at a land-terminating Greenlandic outlet glacier. J. Geophys. Res. Earth Surf. 118 (1), 29–41. doi:10.1029/2012JF002540
Cowton, T. R., Sole, A. J., Nienow, P. W., Slater, D. A., and Christoffersen, P. (2018). Linear response of east Greenland's tidewater glaciers to ocean/atmosphere warming. Proc. Natl. Acad. Sci. 115 (31), 7907–7912. doi:10.1073/pnas.1801769115
Davison, B. J., Sole, A. J., Livingstone, S. J., Cowton, T. R., and Nienow, P. W. (2019). The influence of hydrology on the dynamics of land-terminating sectors of the Greenland ice sheet. Front. Earth Sci. 7 (10). doi:10.3389/feart.2019.00010
DeConto, R. M., and Pollard, D. (2016). Contribution of Antarctica to past and future sea-level rise. Nature 531 (7596), 591–597. doi:10.1038/nature17145
Dehecq, A., Gourmelen, N., Gardner, A. S., Brun, F., Goldberg, D., Nienow, P. W., et al. (2019). Twenty-first century glacier slowdown driven by mass loss in High Mountain Asia. Nat. Geosci. 12 (1), 22–27. doi:10.1038/s41561-018-0271-9
Fausto, R., and Van as, D. (2019). “Automatic weather station data,” in Programme for monitoring of the Greenland ice sheet (PROMICE), 03. doi:10.22008/promice/data/aws
Fowler, A. C., Murray, T., and Ng, F. S. L. (2001). Thermally controlled glacier surging. J. Glaciol. 47 (159), 527–538. doi:10.3189/172756501781831792
Gardner, A. S., Fahnestock, M. A., and Scambos, T. A. (2019a). ITS_LIVE regional glacier and ice sheet surface velocities. Pasadena, United States: Jet Propulsion Laboratory. NASA. doi:10.5067/6II6VW8LLWJ7
Gardner, A. S., Fahnestock, M. A., and Scambos, T. A. (2019b). MEaSUREs ITS_LIVE Landsat image-pair glacier and ice sheet surface velocities. Pasadena, United States: Jet Propulsion Laboratory. NASA. doi:10.5067/IMR9D3PEI28U
Gardner, A. S., Moholdt, G., Scambos, T., Fahnstock, M., Ligtenberg, S., Broeke, M. v. d., et al. (2018). Increased West Antarctic and unchanged East Antarctic ice discharge over the last 7 years. Cryosphere 12 (2), 7. doi:10.5194/tc-12-521-2018
Gilbert, E., and Kittel, C. (2021). Surface melt and runoff on antarctic ice shelves at 1.5°C, 2°C, and 4°C of future warming. Geophys. Res. Lett. 48 (8), e2020GL091733. doi:10.1029/2020GL091733
Hill, E. A., Carr, J. R., and Stokes, C. R. (2017). A review of recent changes in major marine-terminating outlet glaciers in northern Greenland. Front. Earth Sci. 4 (111). doi:10.3389/feart.2016.00111
Hill, E. A., Carr, J. R., Stokes, C. R., and Gudmundsson, G. H. (2018). Dynamic changes in outlet glaciers in northern Greenland from 1948 to 2015. Cryosphere 12 (10), 3243–3263. doi:10.5194/tc-12-3243-2018
Hoejmark Thomsen, H., Olesen, O. B., Egede Boeggild, C., Weidick, A., Higgins, A. K., Reeh, N., et al. (1997). The nioghalfjerdsfjorden glacier project, north-east Greenland: A study of ice sheet response to climatic change. Geol. Greenl. Surv. Bull. (176), 95–103.
Hoffman, M. J., Catania, G. A., Neumann, T. A., Andrews, L. C., and Rumrill, J. A. (2011). Links between acceleration, melting, and supraglacial lake drainage of the Western Greenland Ice Sheet. J. Geophys. Res. Earth Surf. 116 (F4). doi:10.1029/2010JF001934
Howat, I. M., Joughin, I., Tulaczyk, S., and Gogineni, S. (2005). Rapid retreat and acceleration of Helheim Glacier, east Greenland. Geophys. Res. Lett. 32 (22). doi:10.1029/2005GL024737
Hvidberg, C. S., Grinsted, A., Dahl-Jensen, D., Khan, S. A., Kusk, A., Andersen, J. K., et al. (2020). Surface velocity of the Northeast Greenland ice stream (NEGIS): Assessment of interior velocities derived from satellite data by GPS. Cryosphere 14 (10), 3487–3502. doi:10.5194/tc-14-3487-2020
Joughin, I., Abdalati, W., and Fahnestock, M. (2004). Large fluctuations in speed on Greenland's Jakobshavn Isbræ glacier. Nature 432 (7017), 608–610. doi:10.1038/nature03130
Joughin, I., Shean, D. E., Smith, B. E., and Floricioiu, D. (2020). A decade of variability on Jakobshavn isbrae: Ocean temperatures pace speed through influence on melange rigidity. Cryosphere 14 (1), 211–227. doi:10.5194/tc-14-211-2020
Joughin, I., Smith, B. E., Howat, I. M., Scambos, T., and Moon, T. (2010). Greenland flow variability from ice-sheet-wide velocity mapping. J. Glaciol. 56 (197), 415–430. doi:10.3189/002214310792447734
Kamb, B., Raymond, C. F., Harrison, W. D., Engelhardt, H., Echelmeyer, K. A., Humphrey, N., et al. (1985). glacier surge mechanism: 1982-1983 surge of variegated glacier, Alaska. Science 227 (4686), 469–479. doi:10.1126/science.227.4686.469
Karlsson, N. B., and Dahl-Jensen, D. (2015). Response of the large-scale subglacial drainage system of Northeast Greenland to surface elevation changes. Cryosphere 9 (4), 1465–1479. doi:10.5194/tc-9-1465-2015
Khan, S. A., Kjær, K. H., Bevis, M., Bamber, J. L., Wahr, J., Kjeldsen, K. K., et al. (2014). Sustained mass loss of the northeast Greenland ice sheet triggered by regional warming. Nat. Clim. Change 4 (4), 292–299. doi:10.1038/nclimate2161
King, M. D., Howat, L. M., and Candela, S. G. (2020). Dynamic ice loss from the Greenand Ice Sheet driven by sustained glacier retreat. London, England: Communications Earth & Environment.
Kjeldsen, K. K., Korsgaard, N. J., Bjørk, A. A., Khan, S. A., Box, J. E., Funder, S., et al. (2015). Spatial and temporal distribution of mass loss from the Greenland Ice Sheet since AD 1900. Nature 528 (7582), 396–400. doi:10.1038/nature16183
Krieger, L., Floricioiu, D., and Neckel, N. (2020). Drainage basin delineation for outlet glaciers of Northeast Greenland based on Sentinel-1 ice velocities and TanDEM-X elevations. Remote Sens. Environ. 237, 111483. doi:10.1016/j.rse.2019.111483
Larsen, N. K., Levy, L. B., Carlson, A. E., Buizert, C., Olsen, J., Strunk, A., et al. (2018). Instability of the Northeast Greenland ice stream over the last 45,000 years. Nat. Commun. 9 (1), 1872. doi:10.1038/s41467-018-04312-7
Mankoff, K. D., Noël, B., Fettweis, X., Ahlstrøm, A. P., Colgan, W., Kondo, K., et al. (2020). Greenland liquid water discharge from 1958 through 2019. Earth Syst. Sci. Data 12 (4), 2811–2841. doi:10.5194/essd-12-2811-2020
Mayer, C., Reeh, N., Jung-Rothenh¨ausler, F., Huybrechts, P., and Oerter, H. (2000). The subglacial cavity and implied dynamics under Nioghalvfjerdsfjorden Glacier, NE-Greenland. Geophys. Res. Lett. 27. doi:10.1029/2000gl011514
Mayer, C., Schaffer, J., Hattermann, T., Floricioiu, D., Krieger, L., Dodd, P. A., et al. (2018). Large ice loss variability at nioghalvfjerdsfjorden glacier, northeast-Greenland. Nat. Commun. 9 (1), 2768. doi:10.1038/s41467-018-05180-x
McFadden, E. M., Howat, I. M., Joughin, I., Smith, B. E., and Ahn, Y. (2011). Changes in the dynamics of marine terminating outlet glaciers in west Greenland (2000–2009). J. Geophys. Res. Earth Surf. 116 (F2). doi:10.1029/2010JF001757
Moon, T., and Joughin, I. (2008). Changes in ice front position on Greenland's outlet glaciers from 1992 to 2007. J. Geophys. Res. Earth Surf. 113 (F2). doi:10.1029/2007JF000927
Mouginot, J., Bjørk, A., Millan, R., Scheuchl, B., and Rignot, E. (2018). Insights on the surge behavior of Storstrømmen and L. Bistrup Bræ, Northeast Greenland, over the last century. Nat. Commun.
Mouginot, J., Morlighem, M., Rignot, E., Buzzi, A., Scheuchl, B., Fenty, I., et al. (2015). Fast retreat of Zachariæ Isstrøm. northeast Greenland Science.
Mouginot, J., and Rignot, E. (2019). Glacier catchments/basins for the Greenland ice sheet. Dryad. doi:10.7280/D1WT11
Nagler, T., Rott, H., Hetzenecker, M., Jan, W., and Pierre, P. (2015). The sentinel-1 mission: New opportunities for ice sheet observations. Remote Sens. 7 (7), 9371–9389. doi:10.3390/rs70709371
Neckel, N., Zeising, O., Steinhage, D., Helm, V., and Humbert, A. (2020). Seasonal observations at 79°N glacier (Greenland) from remote sensing and in situ measurements. Front. Earth Sci. 8. doi:10.3389/feart.2020.00142
Nick, F. M., Luckman, A., Vieli, A., Van Der Veen, C. J., Van As, D., Van De Wal, R. S. W., et al. (2012). The response of Petermann Glacier, Greenland, to large calving events, and its future stability in the context of atmospheric and oceanic warming. J. Glaciol. 58 (208), 229–239. doi:10.3189/2012JoG11J242
Nick, F. M., Vieli, A., Howat, I. M., and Joughin, I. (2009). Large-scale changes in Greenland outlet glacier dynamics triggered at the terminus. Nat. Geosci. 2 (2), 110–114. doi:10.1038/ngeo394
Noël, B., Van de Berg, W. J., Lhermitte, S., and Van den Broeke, M. R. (2019). Rapid ablation zone expansion amplifies north Greenland mass loss. Sci. Adv. 5 (9), eaaw0123.
Pollard, D., DeConto, R. M., and Alley, R. B. (2015). Potential Antarctic Ice Sheet retreat driven by hydrofracturing and ice cliff failure. Earth Planet. Sci. Lett. 412, 112–121. doi:10.1016/j.epsl.2014.12.035
Rathmann, N. M., Hvidberg, C. S., Solgaard, A. M., Grinsted, A., Gudmundsson, G. H., Langen, P. L., et al. (2017). Highly temporally resolved response to seasonal surface melt of the Zachariae and 79N outlet glaciers in northeast Greenland. Geophys. Res. Lett. 44 (19), 9805–9814. doi:10.1002/2017gl074368
Reeh, N., Bøggild, C. E., and Oerter, H. (1994). Surge of storstrømmen, a large oulet glacier from the inland ice of north-east Greenland. Grønl. Geol. Unders. Rapp. 162, 201–209. doi:10.34194/rapggu.v162.8263
Rignot, E., Fenty, I., Menemenlis, D., and Xu, Y. (2017). Spreading of warm ocean waters around Greenland as a possible cause for glacier acceleration. Ann. Glaciol. 53 (60), 257–266. doi:10.3189/2012AoG60A136
Rignot, E. J., Gogineni, S. P., Krabill, W. B., and Ekholm, S. (1997). North and northeast Greenland ice discharge from satellite radar interferometry. Science 276 (5314), 934–937. doi:10.1126/science.276.5314.934
Rignot, E., and Kanagaratnam, P. (2006). Changes in the velocity structure of the Greenland ice sheet. Science 311 (5763), 986–990. doi:10.1126/science.1121381
Rosenau, R., Scheinert, M., and Dietrich, R. (2015). A processing system to monitor Greenland outlet glacier velocity variations at decadal and seasonal time scales utilizing the Landsat imagery. Remote Sens. Environ. 169, 1–19. doi:10.1016/j.rse.2015.07.012
Schoof, C. (2010). Ice-sheet acceleration driven by melt supply variability. Nature 468 (7325), 803–806. doi:10.1038/nature09618
Sergienko, O. V., Creyts, T. T., and Hindmarsh, R. C. A. (2014). Similarity of organized patterns in driving and basal stresses of Antarctic and Greenland ice sheets beneath extensive areas of basal sliding. Geophys. Res. Lett. 41 (11), 3925–3932. doi:10.1002/2014GL059976
Sergienko, O. V., and Hindmarsh, R. C. A. (2013). Regular patterns in frictional resistance of ice-stream beds seen by surface data inversion. Science 342 (6162), 1086–1089. doi:10.1126/science.1243903
Shepherd, A., Ivins, E. R., Barletta, V. R., Bentley, M. J., Bettadpur, S., et al. (2012). A reconciled estimate of ice-sheet mass balance. Science 338 (6111), 1183–1189. doi:10.1126/science.1228102
Simonsen, S. B., and Louise, S. S. (2017). Implications of changing scattering properties on Greenland ice sheet volume change from Cryosat-2 altimetry. Remote Sens. Environ. 190, 207–216. doi:10.1016/j.rse.2016.12.012
Slater, D. A., Goldberg, D. N., Nienow, P. W., and Cowton, T. R. (2016). Scalings for submarine melting at tidewater glaciers from buoyant plume theory. J. Phys. Oceanogr. 46 (6), 1839–1855. doi:10.1175/jpo-d-15-0132.1
Sørensen, S. L., Simonsen, S. B., Forsberg, R., Khvorostovsky, K., Meister, R., and Engdahl, M. E. (2018). 25 years of elevation changes of the Greenland Ice Sheet from ERS, Envisat, and CryoSat-2 radar altimetry. Earth Planet. Sci. Lett. 495, 234–241.
Straneo, F., Heimbach, P., Sergienko, O., Hamilton, G., Catania, G., Griffies, S., et al. (2013). Challenges to understanding the dynamic response of Greenland's marine terminating glaciers to oceanic and atmospheric forcing. Bull. Am. Meteorological Soc. 94 (8), 1131–1144. doi:10.1175/bams-d-12-00100.1
Tedstone, A. J., Nienow, P. W., Gourmelen, N., Dehecq, A., Goldberg, D., and Hanna, E. (2015). Decadal slowdown of a land-terminating sector of the Greenland Ice Sheet despite warming. Nature 526 (7575), 692–695. doi:10.1038/nature15722
Thomas, R., Frederick, E., Krabill, W., Manizade, S., and Martin, C. (2009). Recent changes on Greenland outlet glaciers. J. Glaciol. 55 (189), 147–162. doi:10.3189/002214309788608958
Turton, J. V., Hochreuther, P., Reimann, N., and Blau, M. T. (2021). The distribution and evolution of supraglacial lakes on 79°N Glacier (north-eastern Greenland) and interannual climatic controls. Cryosphere 15 (8), 3877–3896. doi:10.5194/tc-15-3877-2021
van den Broeke, M. R., Enderlin, E. M., Howat, I. M., Kuipers Munneke, P., Noël, B. P. Y., van de Berg, W. J., et al. (2016). On the recent contribution of the Greenland ice sheet to sea level change. Cryosphere 10 (5), 1933–1946. doi:10.5194/tc-10-1933-2016
Vieli, A., and Nick, F. M. (2011). Understanding and modelling rapid dynamic changes of tidewater outlet glaciers: Issues and implications. Surv. Geophys. 32 (4), 437–458. doi:10.1007/s10712-011-9132-4
Wang, C., Graham, R. M., Wang, K., Gerland, S., and Granskog, M. A. (2019). Comparison of ERA5 and ERA-interim near-surface air temperature, snowfall and precipitation over arctic sea ice: Effects on sea ice thermodynamics and evolution. Cryosphere 13 (6), 1661–1679. doi:10.5194/tc-13-1661-2019
Williams, J. J., Gourmelen, N., and Nienow, P. (2020). Dynamic response of the Greenland ice sheet to recent cooling. Sci. Rep. 10 (1), 1647. doi:10.1038/s41598-020-58355-2
Willis, M. J., Herried, B. G., Bevis, M. G., and Bell, R. E. (2015). Recharge of a subglacial lake by surface meltwater in northeast Greenland. Nature 518 (7538), 223–227. doi:10.1038/nature14116
Wilson, N. J., and Straneo, F. (2015). Water exchange between the continental shelf and the cavity beneath Nioghalvfjerdsbræ (79 North Glacier). Geophys. Res. Lett. 42 (18), 7648–7654. doi:10.1002/2015gl064944
Wood, M., Rignot, E., Fenty, I., An, L., Bjørk, A., Broeke, M. v. d., et al. (2021). Ocean forcing drives glacier retreat in Greenland. Sci. Adv. doi:10.1126/sciadv.aba7282
Xu, Y., Rignot, E., Fenty, I., Menemenlis, D., and Mar Flexas, M. (2013). Subaqueous melting of Store Glacier, west Greenland from three-dimensional, high-resolution numerical modeling and ocean observations. Geophys. Res. Lett. 40 (17), 4648–4653. doi:10.1002/grl.50825
Keywords: ice motion, landsat, surface runoff, subglacial topography, Northeast Greenland ice stream
Citation: Lu X, Jiang L, Xiao C and Li D (2022) Analyzing spatial-temporal variability of ice motion in Northeast Greenland from 1985 to 2018. Front. Earth Sci. 10:972291. doi: 10.3389/feart.2022.972291
Received: 18 June 2022; Accepted: 22 July 2022;
Published: 17 August 2022.
Edited by:
Minghu Ding, Chinese Academy of Meteorological Sciences, ChinaCopyright © 2022 Lu, Jiang, Xiao and Li. This is an open-access article distributed under the terms of the Creative Commons Attribution License (CC BY). The use, distribution or reproduction in other forums is permitted, provided the original author(s) and the copyright owner(s) are credited and that the original publication in this journal is cited, in accordance with accepted academic practice. No use, distribution or reproduction is permitted which does not comply with these terms.
*Correspondence: Liming Jiang, amxtQHdoaWdnLmFjLmNu
Disclaimer: All claims expressed in this article are solely those of the authors and do not necessarily represent those of their affiliated organizations, or those of the publisher, the editors and the reviewers. Any product that may be evaluated in this article or claim that may be made by its manufacturer is not guaranteed or endorsed by the publisher.
Research integrity at Frontiers
Learn more about the work of our research integrity team to safeguard the quality of each article we publish.