Abstract
The process of crack initiation, propagation, and coalescence is the essential cause of rock failure. A three-dimensional numerical model based on microscopic damage mechanics is adopted to simulate the failure process and acoustic emissions (AEs) of a jointed rock mass containing a pre-existing hole subjected to stress waves. The numerically simulated results demonstrate that transmission energy plays an important role in the failure process of specimens. The greater the energy of joint transmission is, the greater the damage to the joint transmission area of the rock mass is. Furthermore, the joint width could significantly influence crack propagation patterns and the damage of the joint transmission area of rock specimens. Moreover, the degree of damage to the local joint transmission area of the rock mass is small but then becomes more obvious when the joint angle grows larger. In addition, the wavelength of the stress wave can also affect the failure modes of the rock when stress waves are applied. As the wavelength of the stress wave reduces, the larger the damage of the rock mass is and the smaller the effect of the joint on crack propagation is. Finally, the numerical results demonstrate that the width of the specimen has a significant effect on its dynamic failure mode and degree, showing an obvious size effect. This finding could explain the lateral growth of an existing flaw in its own plane, which is a phenomenon that has not been observed in laboratory experiments.
1 Introduction
Rock masses are complex geological bodies consisting of rock masses and various macro-structural surfaces (joints, fissures, etc.) in their natural state (Cui et al., 2021). The composition of the rock body shows strong discontinuity, inhomogeneity, and anisotropy due to the long-term geological tectonics during the formation process. Therefore, the stability support of the surrounding rock during blasting, excavation, and mining puts forward higher requirements due to the complexity of the internal structure of natural rock masses. How to ensure the stability of jointed rock chambers under dynamic loads has become a hot issue for researchers. Many researchers have carried out a lot of research work on the propagation law of stress waves in joints. Liu et al. (2013) studied the effects of the initial stiffness, spacing and the number of joints as well as stress wave amplitude, frequency, and angle of incidence on the longitudinal wave energy transfer and attenuation law based on the stress wave propagation equation. Yi et al. (2017) used the Hopkinson pressure bar (SHPB) experiment to investigate the transformation process of the tensile damage mechanism and shear damage mechanism of brittle granular materials under different loading velocities and proposed a time-series failure model with tensile–shear coupling, revealing the relationship between loading velocity and damage zone, which is of good significance for understanding the dynamic damage of granular materials. Dong et al. (2018) studied the propagation law of cylindrical stress wave in jointed rock mass under in situ stress by establishing a theoretical model and blasting experiment and deduced the propagation equation of cylindrical wave in jointed rock mass under in situ stress based on the interaction relationship between cylindrical wave and joint. Li et al. (2013) analyzed the effect of stability of adjacent tunnels or chambers under stress waves by establishing a theoretical model and proposed a theoretical approach to tunnel deformation. Fan and Wong (2013) studied the energy transmission law of stress waves through filled joints under different waveforms based on the B-B model. The development of various numerical simulation methods, especially the finite element method makes it possible to study the damage of rocks under dynamic load comprehensively and accurately by numerical simulation. Numerical simulations have advantages that laboratory physical tests and field experiments do not have, and can explore the damage properties of rocks under more complex conditions with significant cost savings. Liao et al. (2013, 2016) used RFPA simulation software based on FEM and continuous damage mechanics to study the effects of joint inclination, joint spacing, joint mechanical properties, and high ground stress on the damage and fracture process of the jointed rock mass. Zhang et al. (2008) simulated the field explosion experiment with the DDA program and found that the joint has an obstacle to the propagation of stress waves, which makes the stress wave decay rapidly. Wu and Liao, 2017 studied the attenuation law of stress wave propagation in non-homogeneous rock-like materials by using the finite element method simulation and proposed an exponential stress wave peak fitting formula that includes a constant term.
However, joints and other forms of structures such as chambers and tunnels are often present in rock masses (He and Kusiak, 2018; Zhou et al., 2021). The interaction of joints with these structures has a significant impact on the stability of the rock mass (Zhang et al., 2005; Guo et al., 2008; Wu et al., 2019; Li et al., 2022; Wu et al., 2022). Wang et al. (2013) used the dynamic finite element method based on damage mechanics to simulate and analyze the crack propagation process and acoustic emission characteristics of a rock mass with multiple circular holes under the action of the stress wave. They discussed the influence of the distribution of holes on the failure mode of the rock mass. Acoustic emission is the elastic energy stored in the sample after the failure of rock material, which is released in the form of an elastic wave, also known as the acoustic emission stress wave. Acoustic emission is produced during the stress and deformation of rock. Its parameters, such as size, frequency, etc., can reflect the damage and failure degree of rock and rock-like materials. It is a measure of the stability of mechanical rock structures (Wan et al., 2011). Tang et al. (2014) studied the effect of the spatial geometric distribution of the weak interlayer on the mechanical response of the surrounding rock under the effect of dynamic disturbance using the finite element method. It was shown that the geometric distribution and mechanical properties of the weak interlayer affect the attenuation of the stress wave, which in turn affects the stability of the roadway surrounding rock. However, the following problems still exist: (1) Most studies of jointed chambers under dynamic loading are two-dimensional models, ignoring the influence of three-dimensional effects. The three-dimensional effect of rock specimens greatly influences the experimental results of rock dynamics, and researchers from many different fields have carried out a large number of related studies. However, current studies have focused on the relationship between dynamic strength and specimen aspect ratio (Song and Hu, 2005; Li et al., 2011), and relatively little research has been conducted on the effect of rock specimen thickness on its force mechanism and damage mode. (2) The study of jointed chambers is limited to the effect of impact on the vibration velocity and deformation of the structure but does not consider the effect on the stress state and damage form of the structure. (3) The numerical simulation methods that have been used have little research on the structural damage and acoustic emission energy characteristics, and there are certain limitations.
For the abovementioned problems, a three-dimensional finite element model under impact loading is established in this paper. The dynamic damage process of the jointed rock mass under the stress waves is finely simulated by using the OpenMP technique and setting a reasonable over-relaxation factor. The dynamic damage process of the jointed rock masses under different stress wave wavelengths, joint mechanical properties, and spatial distribution is studied. The stress mechanism, acoustic emission energy characteristics, and evolution of crack extension of the numerical model of the jointed rock mass under different working conditions are analyzed, and the transmission-reflection law of stress waves at the joints is derived. In addition, we have discussed the influence of mechanical properties, geometric distribution, and stress wavelength on the failure mode of the jointed rock mass. The research results can provide a supplement and reference for theoretical analysis and physical experiments. The RFPA dynamic analysis system (Yang, 2013; Li et al., 2015) used in this study can simulate the fracture process of heterogeneous brittle materials such as rock under dynamic load.
2 Numerical method and model verification
2.1 Brief descriptions of RFPA3D
In this study, an FEM-based numerical tool, rock failure process analysis code (RFPA), is used to simulate the failure process of rock specimens. The rock is a heterogeneous material filled with disordered microstructures, which play a significant role in the mechanical properties of the rock. Therefore, rock heterogeneity should be considered and implemented in the numerical model. Rock heterogeneity can be well characterized using statistical methods. In RFPA3D, the numerical testing sample is composed of elements with the exact same shape and size. The distribution of elemental mechanical parameters, including the strength, Poisson’s ratio, elastic modulus, and density, is assumed to be depicted by the Weibull distribution function as follows (Liang et al., 2012):where φ(α) is the statistical distribution density of a mechanical property α; m defines the shape of the Weibull distribution function and is named the heterogeneity index; and α is the mechanical parameter of the material, e.g., the strength, elastic modulus, Poisson’s ratio, and weight. α0 refers to the average of the element parameters. According to the Weibull distribution, with increasing m, the rocks tend to be homogeneous.
2.2 Model verification
The simulation results are compared with the physical tests in the literature (Li et al., 2015) to verify the accuracy of the numerical simulation results. The physical tests were conducted using a 75 mm diameter split Hopkinson pressure bar (SHPB) horizontal impact test platform, and the test material was a marble rock specimen with the macroscopic modulus of elasticity, uniaxial compressive strength, and Poisson’s ratio of 25.5 MPa, 8.5 GPa, and 0.24, respectively, and a hole diameter of 12 mm. The comparison between the results of the SHPB impact test and numerical simulation is shown in Figure 1, and it can be seen that the results of numerical simulation and the SHPB test are in good agreement. Initial tensile cracks parallel to the loading direction, “X" type initial shear cracks, and initial tensile cracks appear around the hole under the stress wave. The results show that RFPA has good accuracy and advantages in simulating the dynamic failure of heterogeneous brittle materials.
FIGURE 1

Comparison of numerical and experimental results for rock specimen with a pre-existing hole. (A) Physical test result (Li et al, 2015). (B) Crack propagation mode of numerical simulation (C)AE distribution of numerical simulation.
2.3 Mode set
In this study, a three-dimensional jointed rock impact model containing hole defects is used. The model size is 80 mm × 60 mm × 15 mm, the hole diameter is 10 mm, the joint is 15 mm from the center of the hole, the stress wave is applied to the left boundary of the model (Figure 2), and the element is a 0.5 mm hexahedron. According to the simplified treatment in the literature (Li et al., 2018), the triangular waveform is selected as in Figure 3. In addition, the right side of the model is set as the viscoelastic absorption boundary, and the rest is the free reflection boundary for simulating the real force situation in the numerical model test. The model parameters are detailed in Table 1.
FIGURE 2
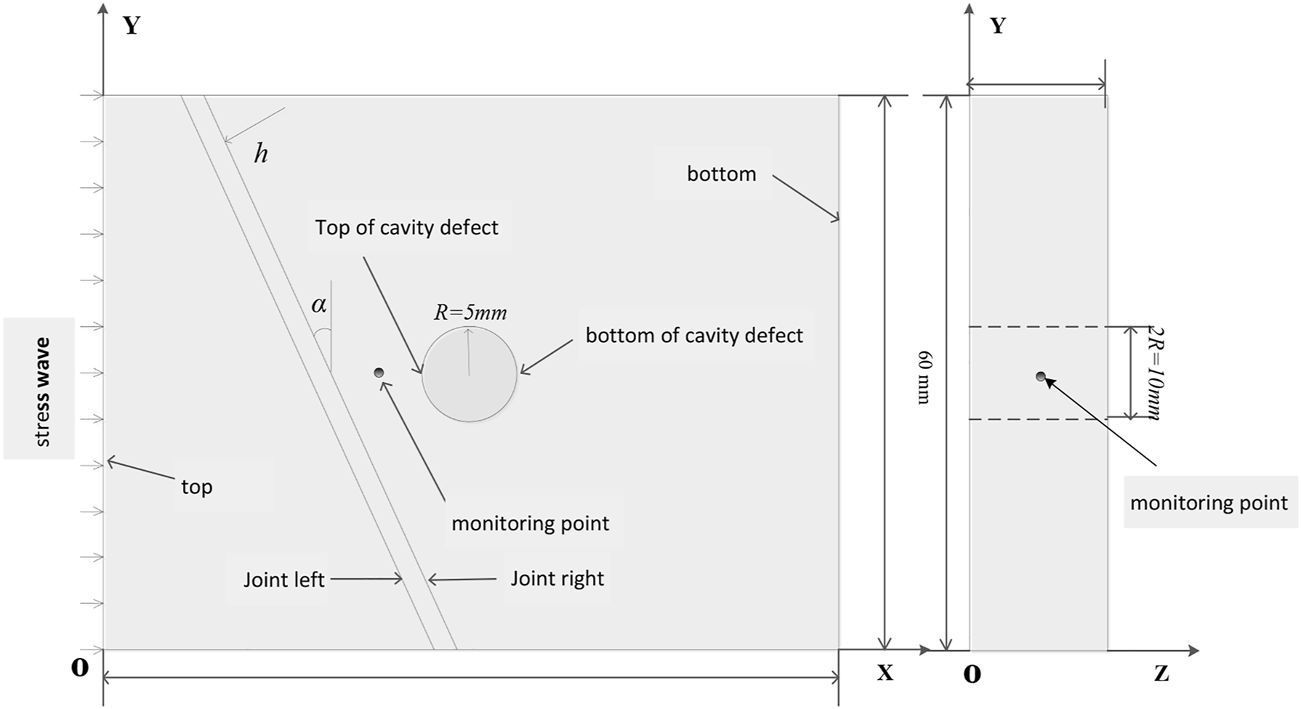
Numerical specimen.
FIGURE 3

Stress waves applied on the rock specimen.
TABLE 1
| Elastic modulus/GPa | Density/Kg/m3 | Poisson ratio | Uniaxial tensile strength/MPa | Uniaxial compressive strength/MPa | Homogeneity index |
|---|---|---|---|---|---|
| 37.5 | 2600 | 0.25 | 260 | 20 | 4 |
Mechanical parameters.
In this study, we use RFPA numerical simulation software to study the effects of factors such as mechanical properties of model joints (joint stiffness E), geometric spatial distribution (joint width h and joint inclination α), and stress wave wavelength λ on the damage model of jointed rock masses containing hole defects. We extract the curves of the maximum principal stresses with time at the monitoring points to quantitatively describe the effects of the geometric distribution and mechanical properties of the joints on the transmission refraction of stress waves.
The specific numerical simulation scheme is as follows:
By keeping the stress wavelength λ=36 mm constant and changing the mechanical properties and geometric spatial distribution of the joints, the damage characteristics of the joint chamber under the action of stress waves are calculated separately.
① The joint stiffness E is 1, 5, 10, and 20 GPa when the joint inclination α=0° and the joint width h=3mm, respectively.
② Joint width h is 0.5, 3, 5, and 10 mm when joint stiffness E=20 GPa and joint inclination α=0°, respectively
③ Joint inclination α is 0°, 15°, 30°, 45°, and 60°when the joint stiffness E=20 GPa and the joint width h=3mm, respectively.
(2) The damage characteristics of the joint chamber are calculated for a numerical model with thickness d=15mm, joint stiffness E=20GPa, joint inclination α=0°, and joint width h=3 mm for stress wave wavelengths λ of 12, 36, 72, and 144mm, respectively.
2.4 Efficient solution of the finite element numerical model
2.4.1 Finite element parallel computing based on OpenMP
The most time-consuming part of the whole finite element analysis is the finite element calculation part. In order to effectively improve the calculation efficiency and scale of the system, this module is parallelized based on OpenMP. OpenMP standard is a programming model for shared storage architecture and a general system. It is based on serial programming language, establishes parallel instructions by using embedded compilation commands and some library functions, and then compiles them into concurrent executable code by the compiler. The OpenMP-based multithreaded shared storage architecture adopts the standard fork join mode, as shown in Figure 4.
FIGURE 4

OpenMP fork-join parallel mode.
Fork in Figure 4 indicates enabling an existing thread or creating a new thread in parallel computing; join represents the convergence of multiple threads in parallel computing. At the beginning of the program, a main thread executes. During the execution of the main thread, if parallel compilation instructions are encountered, the main thread will derive sub threads to execute parallel tasks. In the process of parallel task execution, the main thread and its derived sub thread cooperate to complete the parallel task. When the parallel task ends, the derived sub thread will no longer participate in the task execution, will be exited or suspended, and the program will continue to execute on the main thread.
The total number of elements to be calculated in the model is n, and the number of derived sub-threads is K. Since the time consumed in assembling each element’s stiffness matrix to the total stiffness matrix is the same, the elements of the model are evenly divided into M = n/P parts and calculated in different sub threads. In this way, parallel computing tasks on a single PC are formed so as to improve the computing efficiency of the program. At the same time, after the node displacement is calculated by the equations and the node displacement is replaced back into the equations, in the process of calculating the stress field, strain, and principal stress of each element, the calculation of each element is also independent of each other, and the above method can also be used to perform parallel tasks. However, for the triangular decomposition part of the total stiffness matrix, because the data of the circular volume in the decomposition program are not independent of each other but have a certain random correlation, the decomposition program is not suitable for parallel tasks. Figure 5 is a flowchart of the stage of forming a total stiffness matrix by performing parallel tasks.
FIGURE 5

Flow chart of the total stiffness matrix.
2.4.2 Dynamic finite element solving system of equations
The method of solving the global stiffness matrix has a significant influence on the finite element numerical analysis. When considering the multi-field coupling, the quantities of the global stiffness equation to be solved also increase, which causes great difficulties in the efficiency of the solution. Choosing a more efficient solution method has become one of the most urgent needs in the current finite element. In order to reduce the burden of computing and storage, the preconditioned conjugate gradient method (PCG) is selected to solve the equations, which is based on the conjugate gradient method (CG) to preprocess the coefficient matrix, accelerating the convergence speed of iterative calculation. The preconditioned conjugate gradient method improves computational efficiency and speed by introducing a preprocessing factor matrix M, which decreases the number of conditions in the coefficient matrix. The equation Ax = b turns intowhere the preprocessing factor matrix M is expressed as M=WTW and when the construction of matrix M is similar to the matrix A, the equation converges would be faster. The PCG solution for the equation Ax = b can be expressed in detail below:
The first iterative calculation is assumed as follows:where A is the total stiffness matrix, r0 is the residual between two iterations, and M is the inverse matrix of A (Smith et al., 2014).
The iterative calculation of k is
When the ||rk+1|| ≤ ɛ occurs, the iterative calculation stops.
In the equation above,
xkis the solution to each iterative calculation,
Z0is the residual of the first iteration
x0.,
kis the number of iterations,
and
are scalars and
rkis the residual for each iterative calculation and the remaining variables appearing in above equation are iterative calculation process variables (
Smith et al., 2014). The principle of selection of coefficient matrix
Mas follows:
1) The construction of matrix M is similar to the matrix A.
2) The inverse matrix is easy to find.
The detailed description of over-relaxation iterative preprocessing for matrix M is as follows:where D is a diagonal matrix, Dij is one of element in D, C is an upper corner matrix, and L is a strictly upper triangular matrix for C, and 0 ˂ ω ˂ 2 is a relaxation factor. When the elements are diagonal (i = j), the value of Dij are set to (Aij/ω)½. When i ≠ j, the value of Dij were set to 0 and the initial of value ω is set to 1.5 (Lu, 1992) .
3 Results and discussion
3.1 Influence of joint parameters
3.1.1 Influence of joint stiffness
Joint stiffness has an essential influence on the transmission and reflection distribution of stress wave energy, which affects the damage of the jointed rock mass. Figure 6 shows the variation of the maximum principal stresses with time at the monitoring points for different joint stiffness conditions. This shows that the smaller the joint stiffness, the smaller the energy transmitted by the stress wave to the transmitted wave, and the more energy transmitted to the reflected wave according to energy conservation. In this study, there is a circular hole in the numerical model, and the stress wave will be reflected at the boundary of the circular hole, thus causing the stress in the area of the monitoring point to fluctuate with time.
FIGURE 6
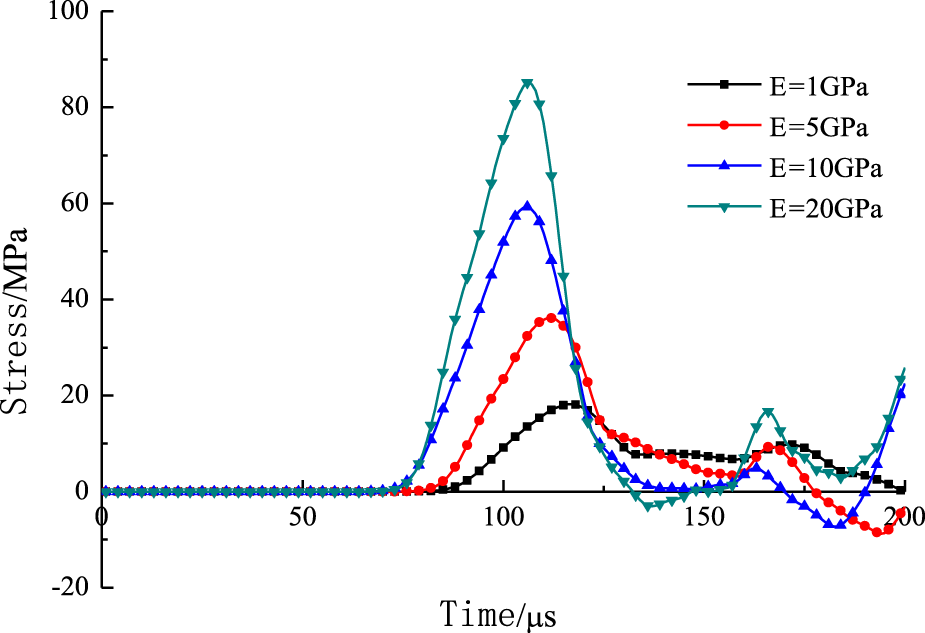
Numerical simulated stress distributions at the monitoring points with different joint stiffness.
Figure 7 shows the failure patterns and AE distribution of jointed rocks with different joint stiffness at t=200 μs. The red sphere represents shear failure, and the blue sphere represents tensile failure. The larger the radius of the sphere, the greater the energy released by acoustic emission. The numerical simulation results show that the joint stiffness has an important influence on the failure patterns of the rock mass. When the joint stiffness is relatively small, the incident wave is transmitted and reflected at the joint, and the propagation energy of the reflected wave is greater than that of the transmitted wave. The acoustic emission in the left area of the joint is densely distributed and seriously broken; In the right area of the joints, the acoustic emission is less distributed, and only in the middle area between the holes and the joints. As the joint stiffness increases, the energy propagated by the reflected wave decreases, the energy propagated by the transmitted wave gradually increases, the number of acoustic emissions in the left area of the joint gradually decreases, the acoustic emission events in the right hole area concentrate, and the crack extension length gradually grows. It is important to note that the element damage to the joints is dominated by sheer damage. This is mainly since the strength of the joints is relatively low, and the damage has already occurred when the first contact with the stress wave is made.
FIGURE 7
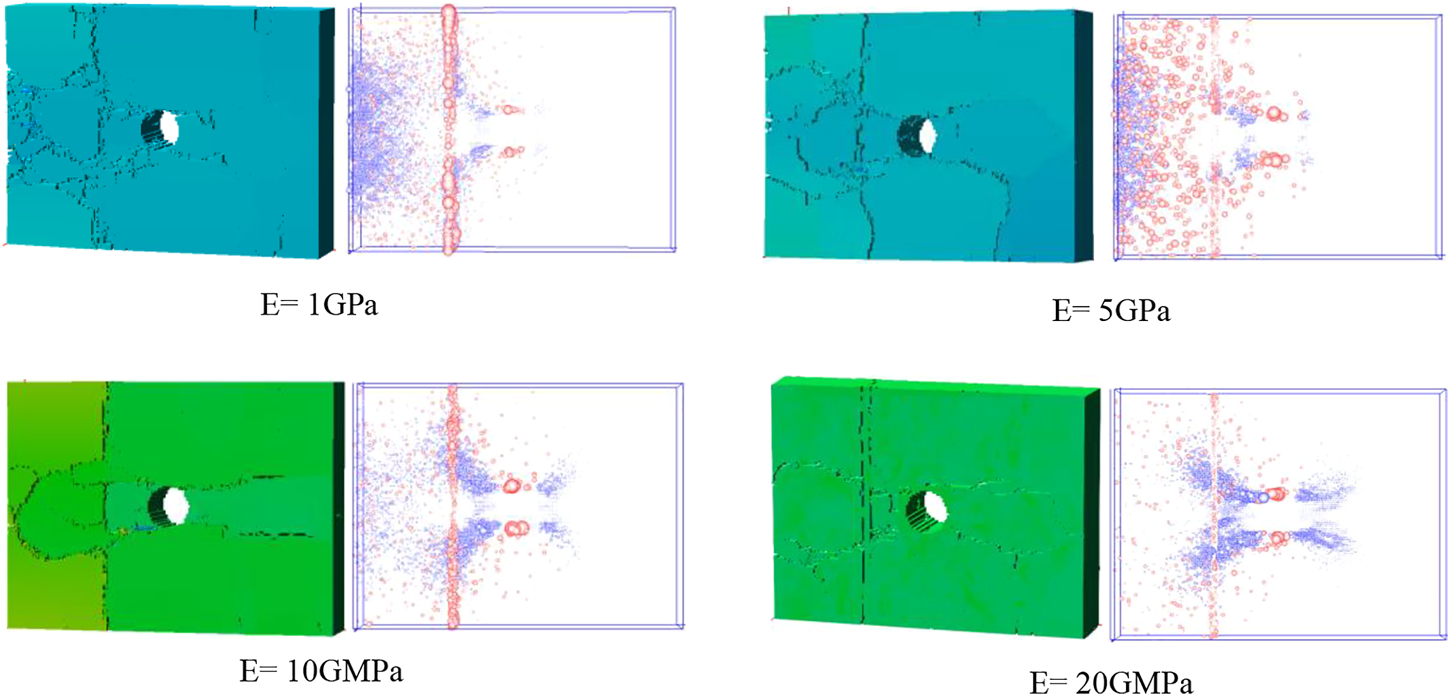
Failure patterns and AE distribution of jointed rocky with a pre-existing hole under different joint stiffness.
Figure 8 shows the accumulative AE counts and energy of jointed rocks with time for different joint stiffness. It can be seen that at the early stage of loading, no acoustic emission event occurs because the peak stress wave does not reach the rock strength. Both the acoustic emission energy and acoustic emission counts increase with time as the loading continues. At the same time, the acoustic emission energy and number increase with the decrease in joint stiffness. That is mainly because the smaller the stiffness is, the more reflected waves are generated at the joints and transformed into tensile waves, and the rock mass is subjected to tensile stress greater than its strength, increasing acoustic emission events and energy.
FIGURE 8
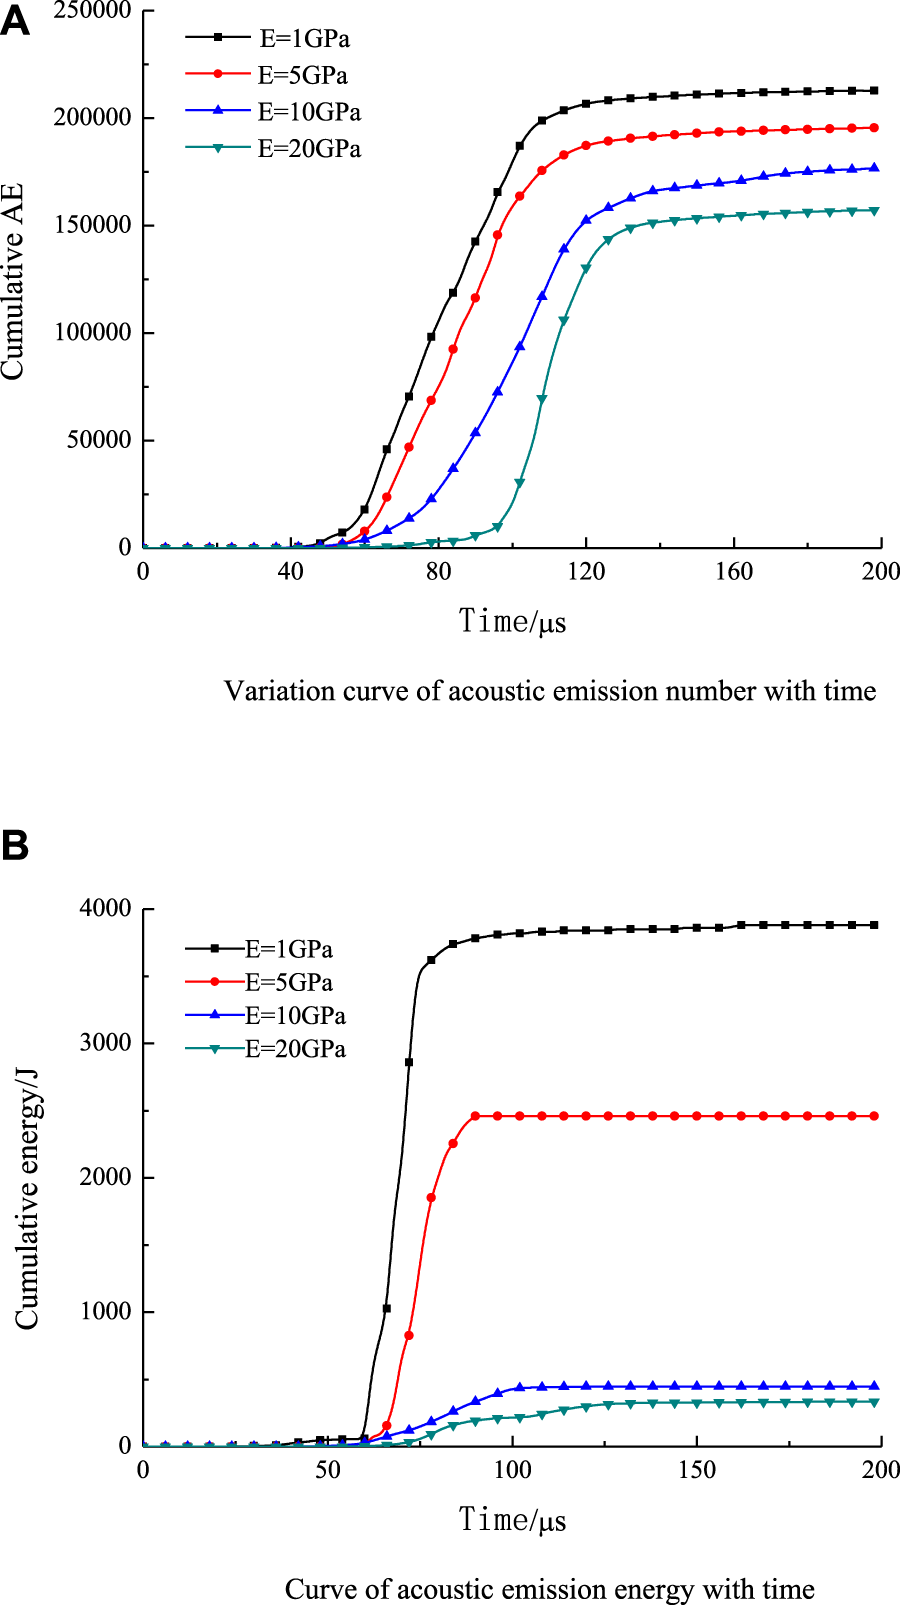
Accumulative AE counts and energy of jointed rocky with a pre-existing hole under different joint stiffness. (A) Variation curve of acoustic emission number with time. (B) Curve of acoustic emission energy with time.
3.1.2 Influence of joint width
By extracting the curves of the maximum principal stresses at the monitoring points with time in different joint width models, the effect of joint width on the energy attenuation of stress wave propagation is investigated. Figure 9 shows the curves of the maximum principal stresses at the monitoring points with time for different joint widths. The results show that when the dip angle and stiffness of the joints are certain, the maximum principal stress at the monitoring point varies nonlinearly with the increase in the joint width, and the principal peak stress decreases with the increase in the joint width. This indicates that under this condition, the energy of the stress wave passing through the joints is significantly attenuated, and the degree of attenuation increases with the increase in the width of the joints. In other words, as the width of the joints increases, the energy transmitted at the joints gradually decreases.
FIGURE 9
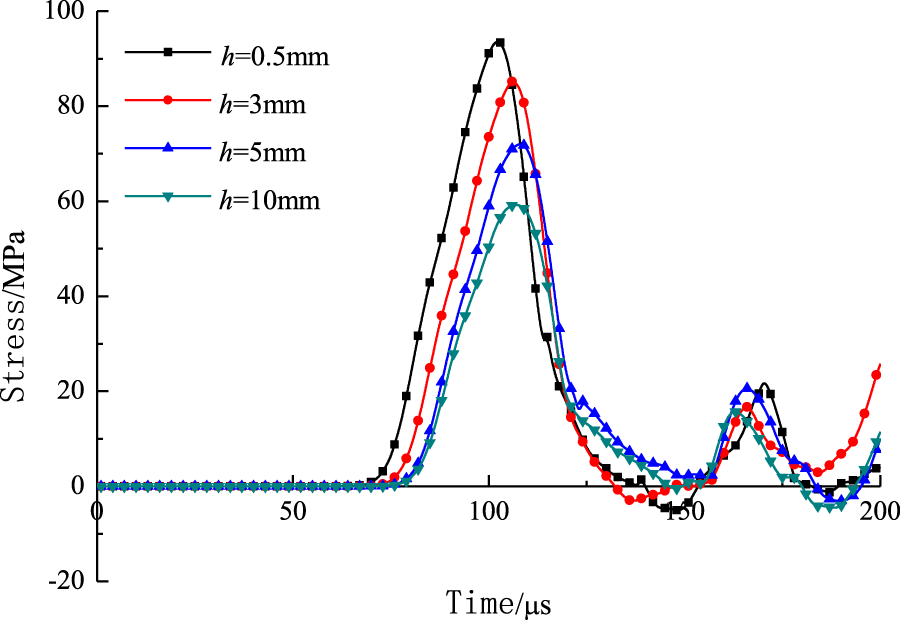
Numerical simulated stress distributions at the monitoring points with different joint width.
Figure 10 shows the crack expansion patterns of rock masses with different joint widths under the stress wave action. A comparative observation shows that the joint width directly affects the final damage pattern of the rock mass. When the joint width is 0.5 mm, the “X" type crack around the hole is formed, and the element forming the crack is mainly tensile damage, while the element at the joint is mainly shear damage. The cracks around the hole can extend through the joint to the top or bottom of the rock mass, causing shear damage to the whole rock mass. As the width of the joints increases, the energy attenuation of stress waves at the joints increases, and the energy of stress waves through the joints decreases. As a result, the number of cracks generated around the hole decreases and the extension length becomes shorter, and the phenomenon of lamina cracking in the jointed rock becomes less and less obvious. For example, when the width is 10mm, two cracks originating from the top of the hole are blocked by joints, and only one crack occurs at the bottom of the hole and the propagation distance is short. A small number of shorter vertical tensile cracks appear at the boundary of the rock specimen. As the element strength at the joint is relatively small compared to the rock mass strength, when the stress wave passes through it, a large number of damages are caused to the joint, resulting in a large number of shear breaks in the joint, which is the main reason for energy attenuation during the propagation of the stress wave.
FIGURE 10
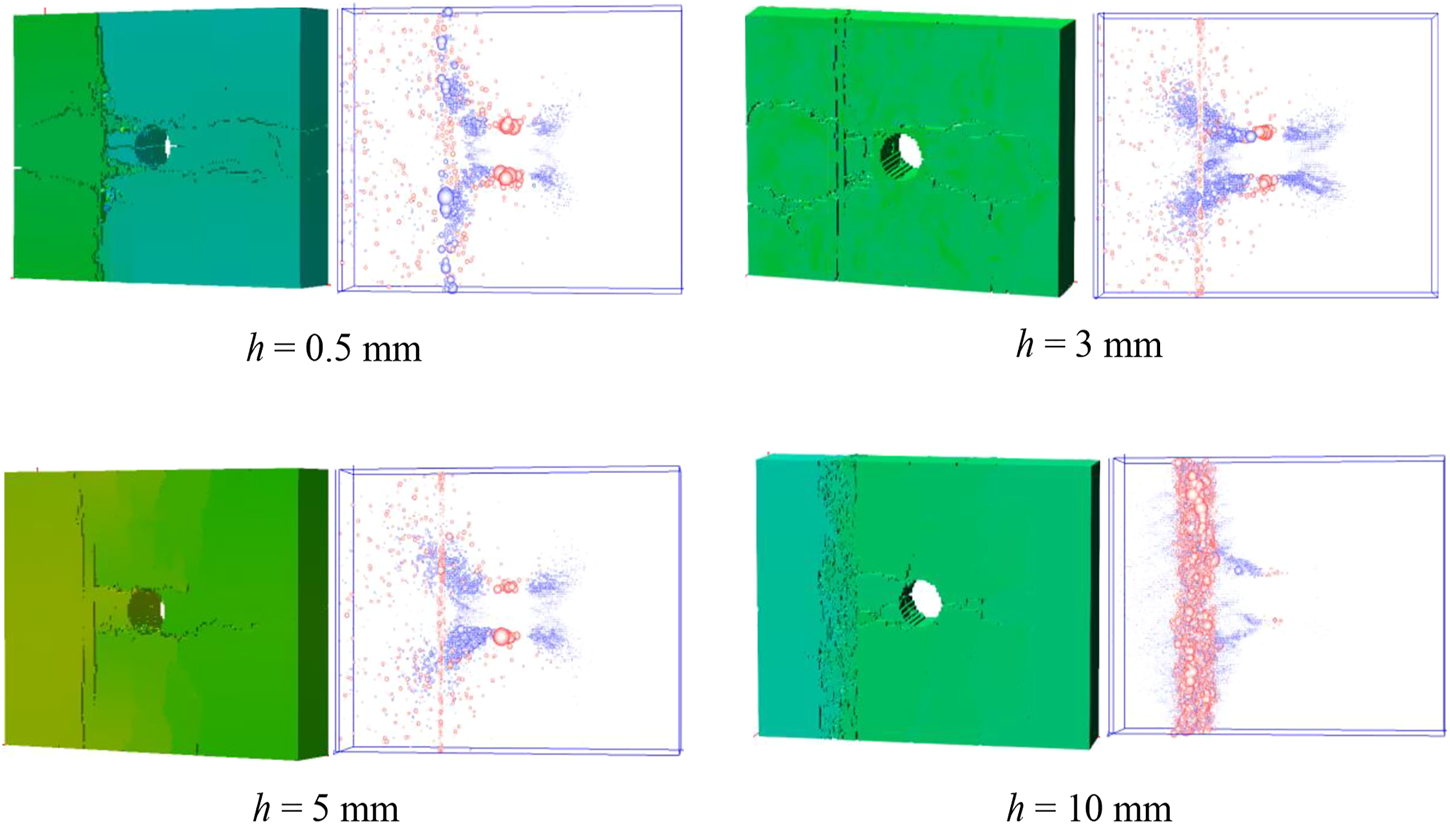
Failure patterns and AE distribution of jointed rocky with a pre-existing hole under different joint width.
Figure 11 shows the variation of acoustic emission number and acoustic emission energy with time under different joint widths. As can be seen from Figure 11A, the number of acoustic emissions decreases with the increase of joint width. This is because as the width of the joints increases, the energy dissipation of the stress wave increases as it passes through the joints. As a result, the number of cracks produced at the holes and the length of cracks decrease. However, the acoustic emission energy increases with the increase in joint width, and the larger the joint width, the more significant the change. Due to the compressive but not tensile properties of rock materials, the energy required for shear damage of rock materials is much greater than the energy required for their tensile strength. From the numerical simulation results in this section, it is concluded that the damage of joints in the rock mass is dominated by shear damage, which generates a large amount of energy. Therefore, the acoustic emission events decrease as the width of the joints increases, but the energy released by acoustic emission is increasing.
FIGURE 11

Accumulative AE counts and energy of jointed rocky with a pre-existing hole under different joint width. (A) Variation curve of acoustic emission number with time. (B) Curve of acoustic emission energy with time.
Figure 12 shows the variation of the maximum principal stress at the monitoring points with time for different joint inclinations α (0° ∼ 60°). It can be seen from the figure that when the joint stiffness and width are constant, the peak value of the maximum principal stress at the monitoring point decreases with the increase of joint inclination. This result indicates that as joint inclinations α increase, the stress wave attenuation effect is obvious and the energy propagated by the transmitted waves decreases. This result indicates that as the joint inclinations α increase, the stress wave attenuation effect is obvious and the energy propagated by the transmitted waves decreases. It can be seen that the attenuation of stress wave is not obvious when the joint inclination α is less than 15°; when the joint inclination α is greater than 45°, the attenuation of stress wave is significant. That is the same as the conclusion of the literature (Guo et al., 2008).
FIGURE 12
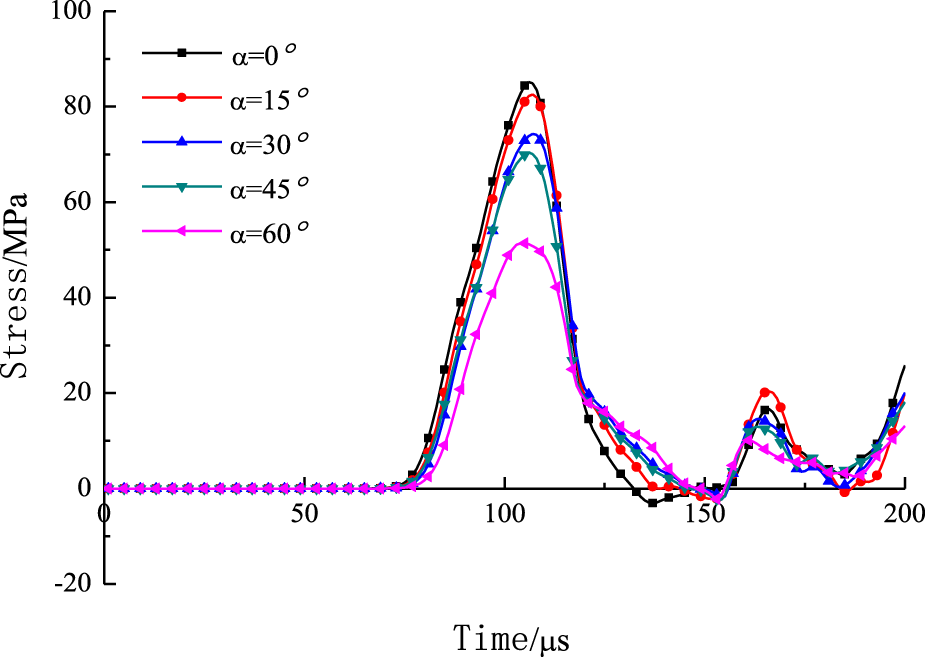
Numerical simulated stress distributions at the monitoring points with different joint width.
Due to the limitation of the specimen size of the jointed rock mass, only five angle cases from 0° to 60° are considered in this section for analyzing their effects on the damage model of the jointed rock mass. Figure 13 shows the damage pattern and acoustic emission distribution of rock mass containing hole joints under different joint inclinations. The damage patterns of the rock masses were similar for the joint inclinations of 0° and 15°, and the cracks generated around the holes extended through the joints to the upper and lower boundaries of the specimens. Lamination cracks are evident on the right side of the joints. From the distribution of acoustic emission events, when the joint inclination is slight, the effect of the joint on the transmission of stress waves is not apparent.
FIGURE 13
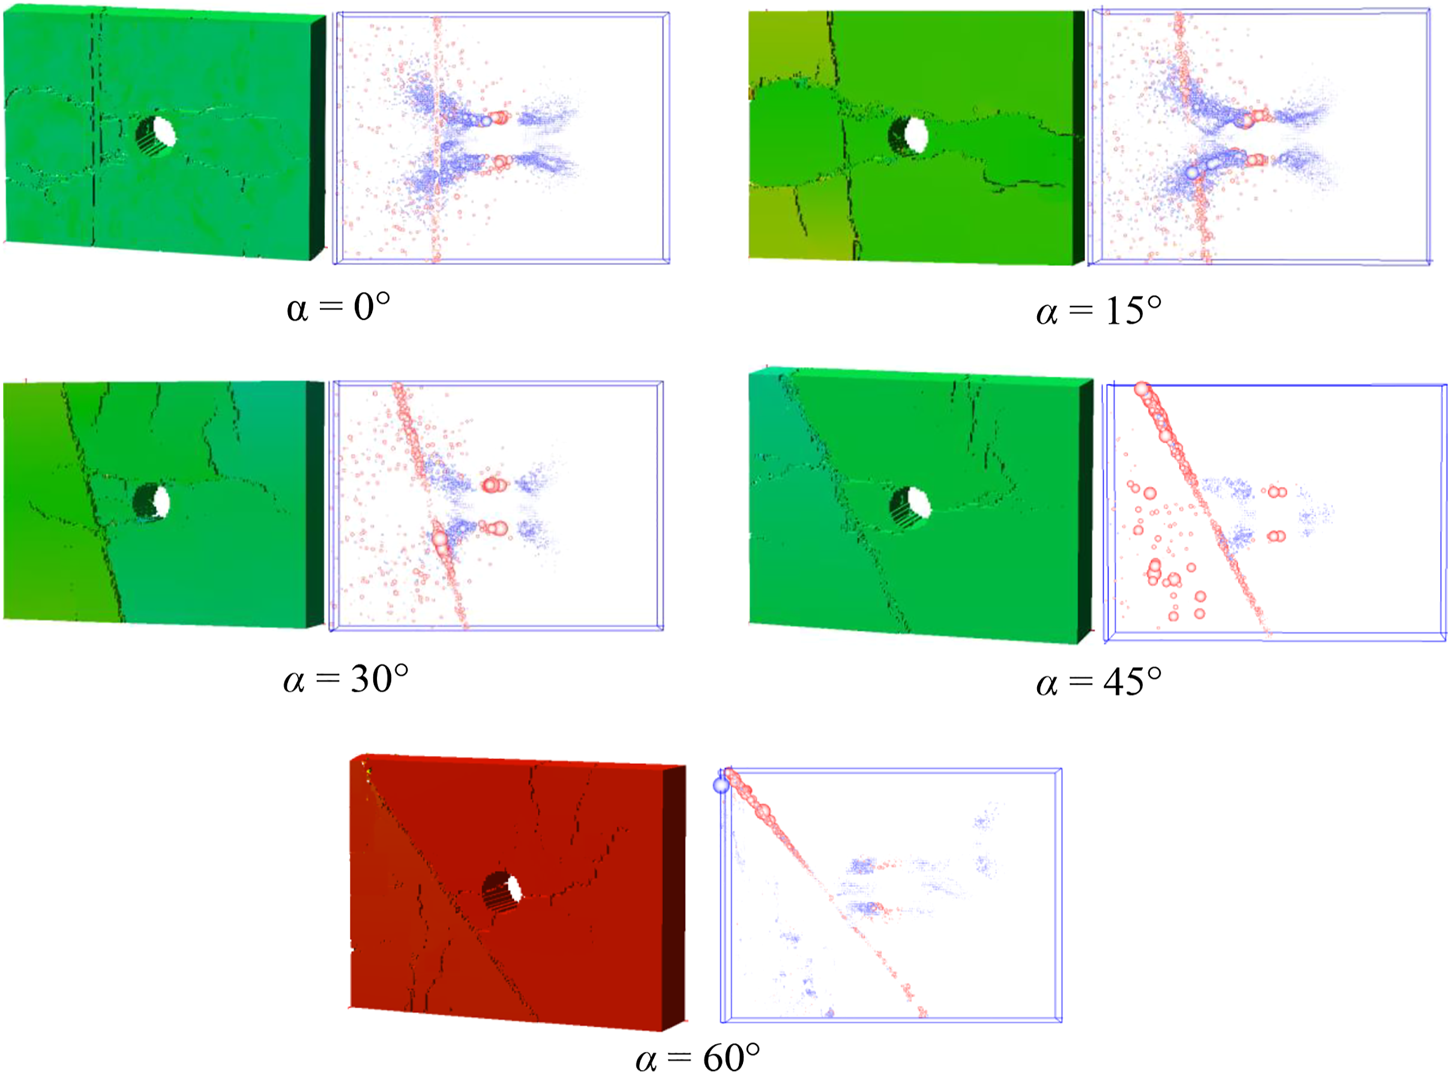
Failure patterns and AE distribution of jointed rocky with a pre-existing hole under different joint.
When the joint inclination is 30° and 45°, the reflected waves generated by the stress waves in the joints are concentrated below the left side of the joints. The energy through the joints also becomes smaller and is mainly concentrated above the right side of the joints. Although the crack generated at the top of the hole can penetrate the joint, the crack cannot extend to the top of the specimen. The cracks produced at the bottom of the hole have a short extension distance. It is only in the upper area to the right of the joint where the laminar crack-like cracks appear.
When the angle is 60° degree, this stress wave changes more significantly at the joints. At the upper and lower ends of the hole, there is a horizontal crack with a short extension distance. At the left end of the hole, due to the proximity of the joint, the stress wave undergoes multiple transverse reflections and a crack that extends into the joint appears. The lamellar cracks in the specimen appear only in the region where the reflected and transmitted waves of the stress wave are concentrated. In other words, when the joint inclination changes, the reflection and transmission of stress waves at the joints (such as energy magnitude, distribution location, etc.) also change. The damage occurring at the joints is still dominated by shear damage, and the larger the joint inclination, the larger the proportion of shear damaged elements.
Figure 14 shows the variation of acoustic emissions and acoustic emission energy with time for joint inclination angle 0°–60°. The results show that the number of acoustic emissions tends to increase and then decrease with the joint inclination angle, while the acoustic emission energy keeps increasing. Combined with the acoustic emission distribution diagram, the shear damage of the unit gradually increases as the angle of the joints increases. While the number of acoustic emissions decreases, the overall acoustic emission energy gradually increases because the shear damage releases more energy than the tensile damage. According to the law of stress wave transmission reflection, the larger the dip angle of the joint, the greater the energy reflected from the stress wave at the joint, thus causing more shear damage.
FIGURE 14
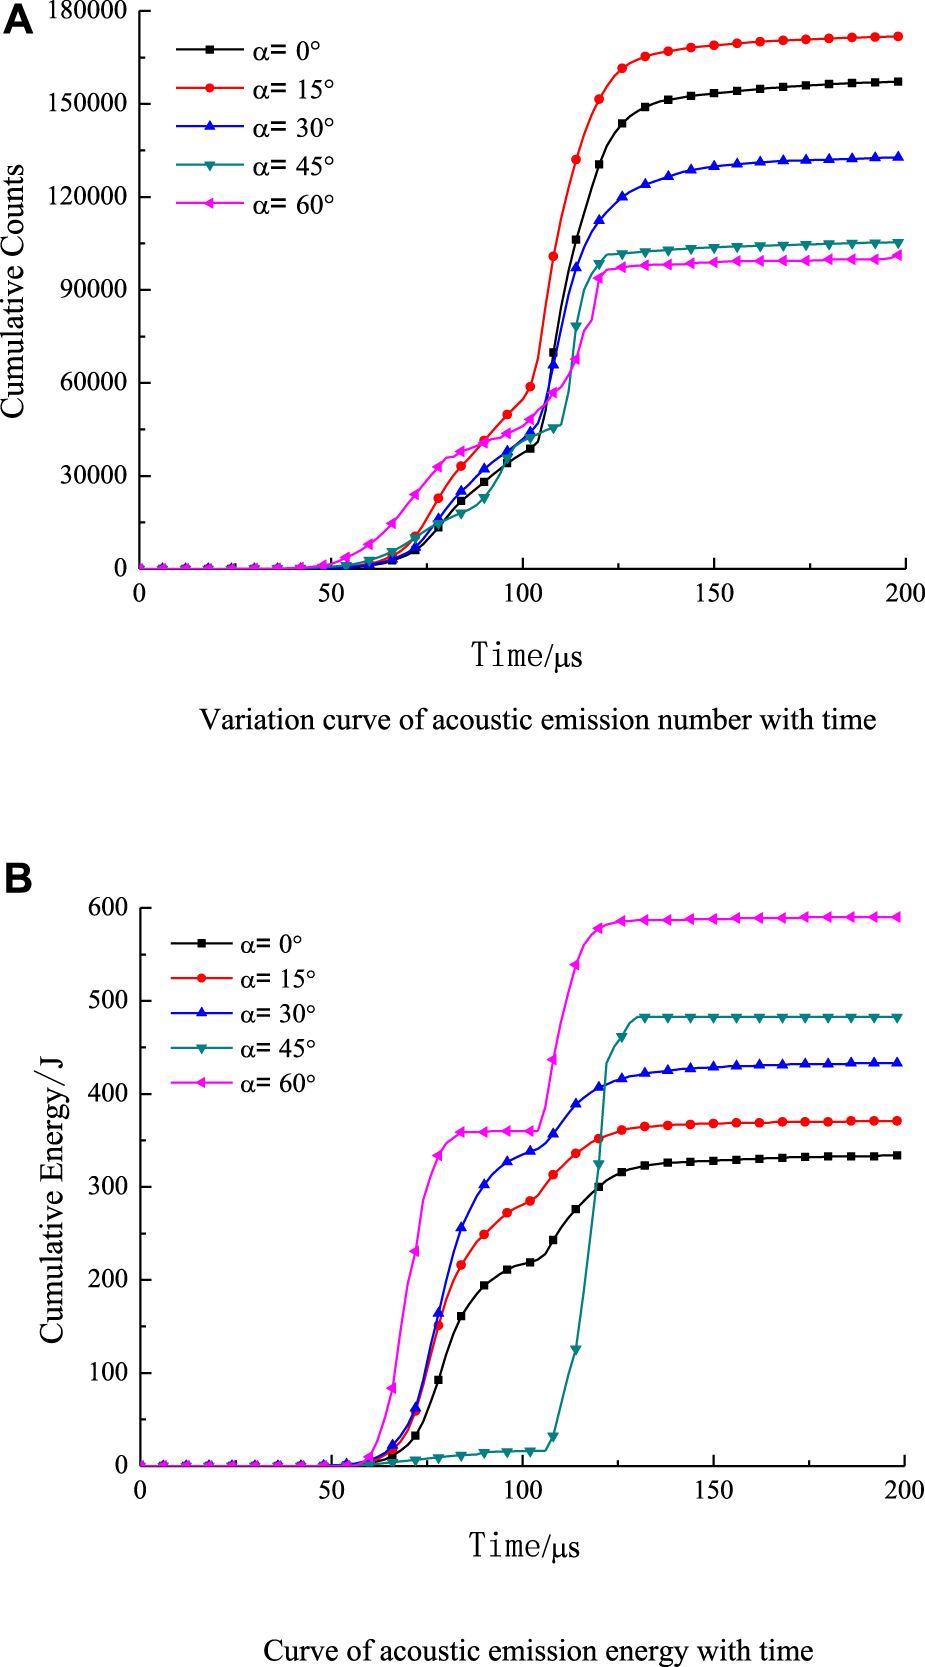
Accumulative AE counts and energy of jointed rocky with a pre-existing hole under different joint angles. (A) Variation curve of acoustic emission number with time. (B) Curve of acoustic emission energy with time.
3.2 Influence of stress wavelength
The impact force generated during the propagation of the stress wave has a greater relationship with the wavelength. The wavelength is different, and the incident wave energy is different, which directly affects the damage pattern of the rock mass. In this section, the damage modes of jointed rock masses containing cavity defects are studied for stress wavelengths of 12 mm, 36 mm, 72 mm, and 144 mm, respectively. Figure 15 shows the variation of the maximum principal stress at different wavelengths with time at the monitoring point. It can be seen that the peak of the maximum principal stress at the monitoring point decreases with the increase of wavelength, and the time to achieve the peak is gradually delayed. As the wavelength decreases, although the total energy of the stress wave transmission gradually decreases, the stress wave transmission at the junction will also quickly reach a higher stress state.
FIGURE 15

Numerical simulated stress distributions at the monitoring points with different wavelength.
The damage pattern and acoustic emission distribution of the jointed rock mass containing cavities under different stress wavelengths are shown in Figure 16. It can be seen that the stress wave wavelength has a significant effect on the damage pattern of the jointed rock mass containing cavities. When the wavelength λ=12mm, the cracks generated around the hole penetrate the joints and extend to the left and right boundaries of the rock specimen, forming a macroscopic “X"-shaped crack pattern, and the lamellar cracking of the rock specimen is obvious. It indicates that the effect of joints on rock crack extension under this stress wave is not apparent. With the increase of wavelength, the damage pattern of rock specimens appears to change significantly. When the wavelength λ=180mm, no cracks appear around the cavities, and the specimens only produce apparent damage at the joints and no obvious lamellar cracks. It indicates that at longer wavelengths, the joints play a significant role in the damage pattern of the rock mass. What is different from the results of the previous study is that when the stress wave wavelength is 72 mm and 144 mm, the joints are dominated by tensile damage, accompanied by a small amount of shear damage.
FIGURE 16
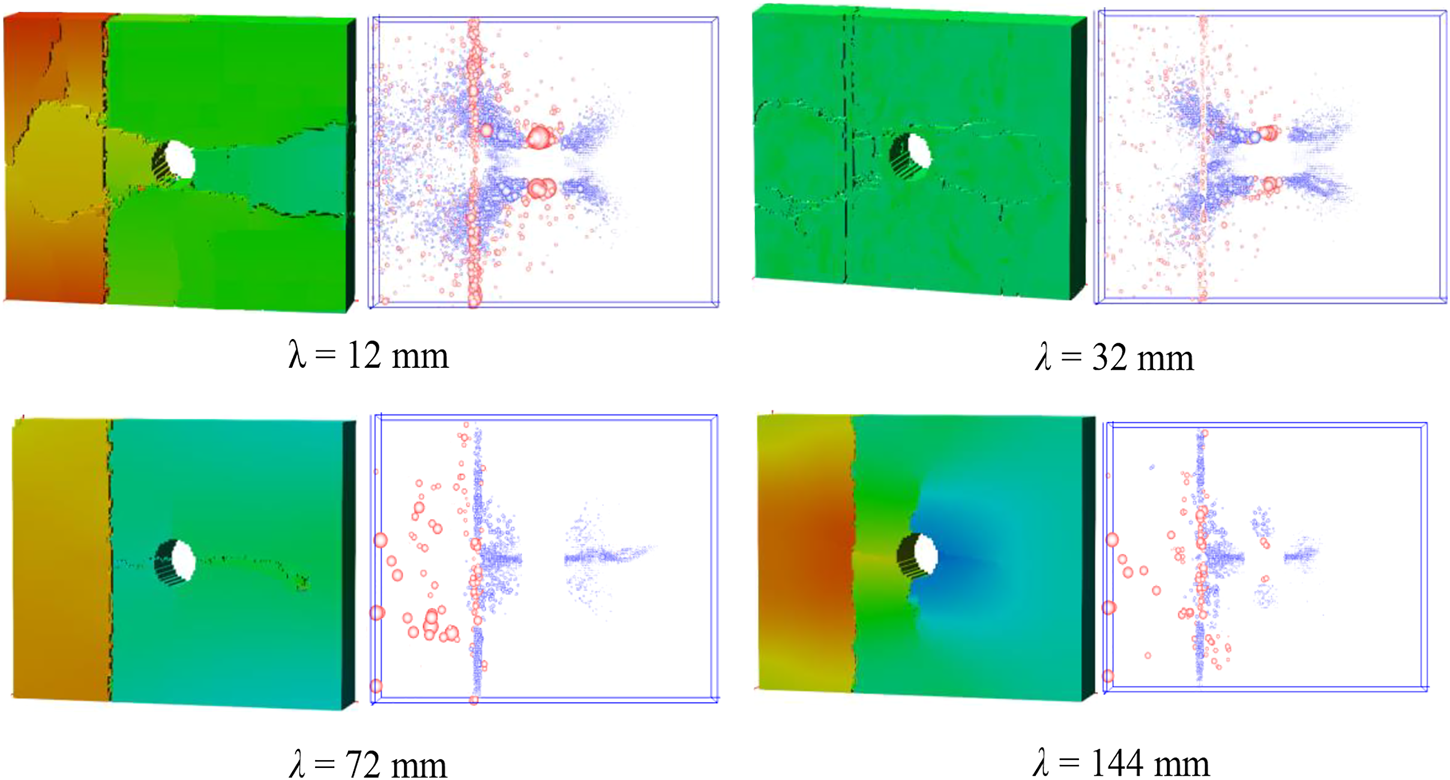
Failure patterns and AE distribution of jointed rocky with a pre-existing hole under different wavelength.
Figure 17 shows the relationship between acoustic emissions and the acoustic emission energy with time for jointed rock containing cavities at different wavelengths. From the figure it can be concluded that the number of acoustic emissions and acoustic emission energy decrease as the wavelength increases. When the wavelength is short, the stress wave quickly reaches its peak, making the local area achieve higher stress in a short time. The rock mass is severely broken locally, releasing a large amount of acoustic emission and more energy. At this time, the impact of joints on rock mass failure is negligible. As the wavelength increases, the energy inside the rock mass has sufficient time to be transferred, and at this time, the rock mass is only damaged at the weak joints, while the other locations are relatively stable. This shows that weak joints have a greater influence on the stability of the rock mass.
FIGURE 17
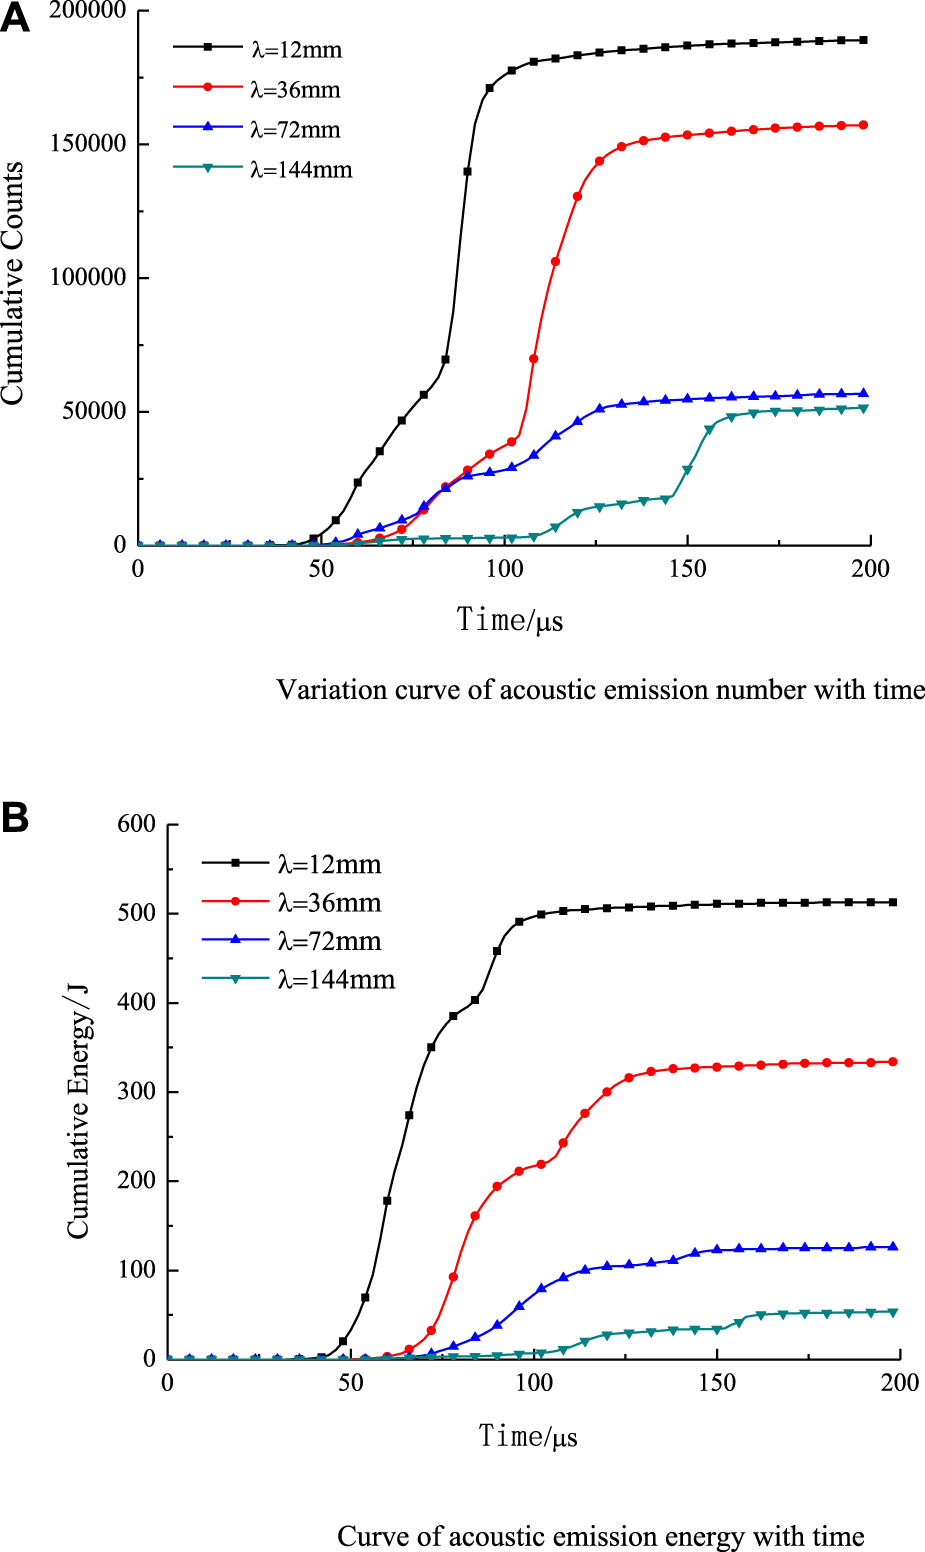
Accumulative AE counts and energy of jointed rocky with a pre-existing hole under different wavelength. (A) Variation curve of acoustic emission number with time. (B) Curve of acoustic emission energy with time.
4 Conclusion
Using the RFPA simulation method based on OpenMP, this study has investigated the influences of stress wave wavelength and different joint parameters on the failure mode of rock mass. The initiation and propagation of flaws are affected by many factors, such as weak interlayer inclination, weak interlayer width, specimen thickness, and loading style. The present numerical simulation only focused on the joint parameters and loading wave energy. Although the role of these parameters needs further experimental and theoretical analysis and the propagation processes of cracks under complex dynamic loading cases should be further investigated, the numerical results of this study demonstrate many phenomena that have already been shown in laboratory experiments. However, many of these fracture phenomena results direct the necessity of additional experiments. This study highlights some interesting phenomena for improving the understanding of the mechanism of dynamic rock fracturing. Some of the key results are summarized as follows:
(1) The crack expansion pattern of the jointed rock mass containing the chamber is related to the wavelength of the stress wave. As the wavelength of the stress wave increases, the number of cracks initially around the hole decreases, and the crack extension length decreases.
(2) The effect of joints on the damage mode of rock masses is related to the stress wavelength. When the stress wavelength is short, the influence of the joints on the damage modes of the rock mass is not obvious; the longer the wavelength of the stress wave , the more obvious the influence of the joints on the damage modes of the rock mass.
(3) The mechanical properties (such as joint stiffness) and spatial distribution (such as joint width and inclination) of the joints directly influence the damage pattern of the jointed rock masses containing cavities. They determine the distribution of the transmission reflection energy of the stress waves at the joint surface affecting the acoustic emission energy and the damage pattern of the jointed rock masses.
Statements
Data availability statement
The original contributions presented in the study are included in the article/Supplementary Material; further inquiries can be directed to the corresponding author.
Author contributions
All authors listed have made a substantial, direct, and intellectual contribution to the work and approved it for publication.
Funding
This study was supported by the Social Governance Science and Technology Special Project of Shenyang (20-206-4-11), Science and Technology Project of the Transportation Department of Liaoning Province (2021034), and National Natural Science Foundation of China (Grant No. 52179123).
Conflict of interest
The authors declare that the research was conducted in the absence of any commercial or financial relationships that could be construed as a potential conflict of interest.
Publisher’s note
All claims expressed in this article are solely those of the authors and do not necessarily represent those of their affiliated organizations, or those of the publisher, the editors, and the reviewers. Any product that may be evaluated in this article, or claim that may be made by its manufacturer, is not guaranteed or endorsed by the publisher.
References
1
Cui S. Pei X. Jiang Y. Wang G. Fan X. Yang Q. et al (2021). Liquefaction within a Bedding Fault: Understanding the Initiation and Movement of the Daguangbao Landslide Triggered by the 2008 Wenchuan Earthquake (Ms = 8.0). Eng. Geol.295, 106455. 10.1016/j.enggeo.2021.106455
2
Dong X. P. Dong Q. Liu T. T. Huang J. H. (2018). Research on Propagation Law of Cylindrical Stress Wave in Jointed Rock Mass under In-Situ Stress. Chin. J. Rock Mech. Eng.37, 3121–3131. 10.13722/j.cnki.jrme.2017.1013
3
Fan L. F. Wong L. N. Y. (2013). Stress Wave Transmission across a Filled Joint with Different Loading Unloading Behavior. Int. J. Rock Mech. Min. Sci.60, 227–234. 10.1016/j.ijrmms.2012.12.046
4
Guo F. L. Zhang D. L. Su J. Niu X. K. Hou Y. J. (2008). Research on Deformation Mechanism about Stratified Tunnel Surrounding Rock Mass Containing Weak Intercalation. Rock Soil Mech.29 (S1), 247–252. 10.16285/j.rsm.2008.s1.122
5
He Y. Kusiak A. (2018). Performance Assessment of Wind Turbines: Data-Derived Quantitative Metrics. IEEE Trans. Sustain. Energy9 (1), 65–73. 10.1109/TSTE.2017.2715061
6
Li D. Y. Cheng T. J. Zhou T. Li X. B. (2015). Experimental Study of the Dynamic Strength and Fracturing Characteristics of Marble Specimens with a Single Hole under Impact Loading. Chin. J. Rock Mech. Eng.34 (2), 249–260. 10.13722/j.cnki.jrme.2015.02.004
7
Li D. Y. Li C. C. Li X. (2011). Influence of Sample Height-To-Width Ratios on Failure Mode for Rectangular Prism Samples of Hard Rock Loaded in Uniaxial Compression. Rock Mech. Rock Eng.44 (3), 253–267. 10.1007/s00603-010-0127-0
8
Li D. Y. Xiao P. Xie T. Li X. B. (2018). On the Effect of Length to Diameter Ratio of Rock Specimen Subjected to Dynamic and Static Compression. J. Exp. Mech.33 (01), 93–100.
9
Li H. He Y. Xu Q. Deng j. Li W. Wei Y. (2022). Detection and Segmentation of Loess Landslides via Satellite Images: a Two-phase Framework. Landslides19, 673–686. 10.1007/s10346-021-01789-0
10
Li J. C. Li H. B. Ma G. W. Zhou Y. (2013). Assessment of Underground Tunnel Stability to Adjacent Tunnel Explosion. Tunn. Undergr. Space Technol.35, 227–234. 10.1016/j.tust.2012.07.005
11
Liang Z. Z. Xing H. Wang S. Y. Williams D. J. Tang C. A. (2012). A Three-Dimensional Numerical Investigation of the Fracture of Rock Specimens Containing a Pre-existing Surface Flaw. Comput. Geotech.45, 19–33. 10.1016/j.compgeo.2012.04.011
12
Liao Z. Y. Liang Z. Z. Yang Y. F. Wang Y. Tang C. A. (2013). Numerical Simulation of Fragmentation Process of Jointed Rock Mass Induced by a Drill Bit under Dynamic Loading. Chin. J. Geotechnical Eng.35 (06), 1147–1155. 10.1016/j.watres.2010.04.030
13
Liao Z. Y. Zhu J. B. Tang C. A. (2016). Dynamic Behavior and Response of Rock and Underground Openings Subjected to High Initial Stresses. Chin. J. Geotechnical Eng.38 (S2), 260–265. 10.11779/CJGE2016S2043
14
Liu T. T. Li J. C. Li H. B. Chai S. B. (2013). Energy Analysis of Wave Propagation across Parallel Nonlinear Joints. Chin. J. Rock Mech. Eng.32 (08), 377–382. 10.1201/b14916-47
15
Lu T. (1992). Domain Decomposition Algorithm-New Technique of Partial Differential Numerical Solution. Math. Pract. theory1, 71–76.
16
Smith I. M. Griffiths D. V. Margetts L. (2014). Programming the Finite Element Method. United states: Wiley Press.
17
Song L. Hu S. S. (2005). Stress Uniformity and Constant Strain Rate in SHPB Test. Explos. Shock Waves25 (3), 207–216. 10.1360/biodiv.050084
18
Tang L. Z. Gao L. H. Wang C. Jiang F. (2014). Mechanical Response Features of Roadway Surrounding Rock with Weak Interlayer under Dynamic Disturbance. Sci. Technol. Rev.32 (21), 56–61. 10.3981/j.issn.1000-7857.2014.21.009
19
Wan G. X. Wang Q. S. Li X. B. (2011). Acoustic Emission Test of a Rock under Action of Stress Wave. J. Vib. shock30 (01), 116–120. 10.13465/j.cnki.jvs.2011.01.006
20
Wang S. Y. Sun L. Yang C. Yang S. Q. Tang C. A. (2013). Numerical Study on Static and Dynamic Fracture Evolution Around Rock Cavities. J. Rock Mech. Geotechnical Eng.5 (04), 262–276. 10.1016/j.jrmge.2012.10.003
21
Wu N. Liang Z. Z. Li Y. C. Li H. Li W. R. Zhang M. L. (2019). Stress-dependent anisotropy index of strength and deformability of jointed rock mass: Insights from a numerical study. B. Eng. Geol. Environ.78 (8), 5905–5917. 10.1007/s10064-019-01483-5
22
Wu N. Liang Z. Z. Zhang Z. Z. Li S. H. Lang Y. X. (2022). Development and verification of three-dimensional equivalent discrete fracture network modelling based on the finite element method. Eng. Geol.306 (5), 106759. 10.1016/j.enggeo.2022.106759
23
Wu X. T. Liao L. (2017). Numerical Simulation of Stress Wave Attenuation in Brittle Material and Spalling Experiment Design. Explos. Shock Waves37 (4), 705–711. 10.11883/1001-1455(2017)04-0705-07
24
Yang Y. F. (2013). Simulation-Based Research on Crack Propagation Mechanism of Rock-like Materials under Dynamic Stress. Dalian: Dalian University of Technology.
25
Yi H. Xu S. L. Shan J. F. Zhang M. (2017). Fracture Characteristics of Brittle Particles at Different Loading Velocities. Explos. Shock Waves37 (05), 913–922. 10.11883/1001-1455(2017)05-0913-10
26
Zhang X. L. Jiao Y. Y. Liu Q. S. Liu B. L. (2008). Numerical Study on Effect of Joints on Blasting Wave Propagation in Rock Mass. Rock Soil Mech.03, 717–721. 10.16285/j.rsm.2008.03.001
27
Zhang Z. Q. Li N. Swoboda G. (2005). Influence of Weak Interbed Distribution on Stability of Underground Openings. Chin. J. Rock Mech. Eng.18, 3252–3257. 10.3321/j.issn:1000-6915.2005.18.008
28
Zhou J. Wei J. Yang T. Zhang P. Liu F. Chen J. (2021). Seepage Channel Development in the Crown Pillar: Insights from Induced Microseismicity. Int. J. Rock Mech. Min. Sci.145, 104851. 10.1016/j.ijrmms.2021.104851
Summary
Keywords
stress wave, joint, crack propagation, AE, spallation, energy
Citation
Yu Q, Yu F, Yao D and Jin S (2022) Numerical simulation of stress wave propagation in joint rock specimens with cavity defects. Front. Earth Sci. 10:971172. doi: 10.3389/feart.2022.971172
Received
16 June 2022
Accepted
28 July 2022
Published
02 September 2022
Volume
10 - 2022
Edited by
Yusen He, Grinnell College, United States
Reviewed by
Jirong Yi, Hologic, Inc., United States
Jiahao Deng, DePaul University, United States
Updates
Copyright
© 2022 Yu, Yu, Yao and Jin.
This is an open-access article distributed under the terms of the Creative Commons Attribution License (CC BY). The use, distribution or reproduction in other forums is permitted, provided the original author(s) and the copyright owner(s) are credited and that the original publication in this journal is cited, in accordance with accepted academic practice. No use, distribution or reproduction is permitted which does not comply with these terms.
*Correspondence: Fang Yu, xn_yufang@sut.edu.cn
This article was submitted to Geohazards and Georisks, a section of the journal Frontiers in Earth Science
Disclaimer
All claims expressed in this article are solely those of the authors and do not necessarily represent those of their affiliated organizations, or those of the publisher, the editors and the reviewers. Any product that may be evaluated in this article or claim that may be made by its manufacturer is not guaranteed or endorsed by the publisher.