 Yang Lyu1
 Shoupeng Zhu
 Luying Ji
 Yi Fan
95% of researchers rate our articles as excellent or good
Learn more about the work of our research integrity team to safeguard the quality of each article we publish.
Find out more
ORIGINAL RESEARCH article
Front. Earth Sci. , 30 August 2022
Sec. Atmospheric Science
Volume 10 - 2022 | https://doi.org/10.3389/feart.2022.970791
This article is part of the Research Topic AI-Based Prediction of High-Impact Weather and Climate Extremes under Global Warming: A Perspective from The Large-Scale Circulations and Teleconnections View all 21 articles
In this study, subseasonal precipitation forecast skills over Maritime Continent in boreal summer are investigated for the ECMWF and CMA models involved in the S2S Project. Results indicate that the ECMWF model shows generally superior forecast performances than CMA, which is characterized by lower errors and higher correlations compared with the observations. Meanwhile, ECMWF tends to produce wet biases with increasing lead times, while the mean errors of CMA are revealed to be approximately constant throughout lead times of 2–4 weeks over most areas. Besides, the temporal correlations between model outputs and observations obviously decrease with growing lead times, with a high-low distribution presented from north to south. In addition, the roles of large-scale drivers like ENSO and BSISO in modulating subseasonal precipitation forecast skills are also assessed in the models. Both ECMWF and CMA can reasonably capture the ENSO related precipitation anomalies for all lead times, while their capabilities of capturing BSISO related precipitation anomalies decrease with growing lead times, which is more obvious in CMA. The enhanced subseasonal precipitation forecast skills mainly respond to the BSISO associated precipitation variability. For most MC areas such as southern Indochina, western Indonesia, Philippines and the eastern ocean, the forecast skills of both ECMWF and CMA can be improved to a great extent by enhancing the capture of BSISO related precipitation anomalies, with the temporal correlations for both ECMWF and CMA increased by about 0.15 for lead times of 3–4 weeks. It provides an opportunity window for the models to improve precipitation forecasts on the subseasonal timescale.
In the context of global warming, extreme weather events such as floods and droughts are revealed to be increasingly frequent, which emerge serious threats to both economic society and human health (Zhang et al., 2015; Zhu et al., 2020a; 2020b). Recently, there has been a surge of interest to develop the precise seamless forecasts, playing a crucial role in disaster reduction (WMO, 2015; Yuan et al., 2016; Rauser et al., 2017). Although the weather forecasts and seasonal forecasts, which are mainly influenced by atmospheric initial conditions and boundary conditions, respectively, have been improved significantly during the past decades, the subseasonal forecasts are still lacking in development and remain as a great challenge for operational forecasting centers (Johnson et al., 2014; Robertson et al., 2015; Vigaud et al., 2017).
The World Weather Research Programme (WWRP) and World Climate Research Programme (WCRP) have jointly implemented the Subseasonal to Seasonal (S2S) Prediction project to improve the forecast skills and physical understanding on the S2S processes (Vitart et al., 2012; Vitart et al., 2017). The S2S Project database have been broadly used to investigate different scientific issues on the subseasonal timescale, including forecasts of temperature (Zhu et al., 2021) and precipitation (L’Heureux et al., 2021; Vigaud et al., 2018), as well as simulations of Asian summer monsoon (Jie et al., 2017; Wang X. et al., 2022; Fan et al., 2022). Generally, the S2S models retain certain skills in predicting instance temperature (Tian et al., 2017; Mastrangelo and Malguzzi 2019) and the large-scale climate conditions, such as the Madden-Julian Oscillation (MJO; Vitart, 2017; Kim et al., 2018; Marshall and Hendon, 2019), the Boreal Summer Intraseasonal Oscillation (BSISO; Wang et al., 2019; Shibuya et al., 2021), and the North Atlantic Oscillation (NAO; Vitart, 2014) even for lead times of week 3 and 4, while their forecast skills after week 2 are always quite limited for precipitation. Such phenomena have been demonstrated for a wide range of geographical areas, including the contiguous United States (Tian et al., 2017), East Asia (Liang and Lin 2018), and more generally at a global scale (de Andrade et al., 2019; Mastrangelo and Malguzzi 2019).
In order to achieve a better understanding on subseasonal forecast of precipitation and to improve the corresponding forecast skills, recent studies have devoted to finding the sources of subseasonal predictability and their roles in modulating precipitations (Koster et al., 2010; Liu et al., 2015; Pan et al., 2019). So far, El Niño-Southern Oscillation (ENSO) and Intraseasonal Oscillation (ISO) are considered as two of the main predictability sources (Neena et al., 2014; Li and Robertson., 2015; Liang and Lin, 2018), whose different phases have various impacts on the subseasonal precipitation forecast skills (de Andrade et al., 2019). On the other hand, the ENSO and ISO have also been utilized to improve subseasonal precipitation forecasts based on the Bayesian framework, multiple linear regression, and many other advanced statistical approaches (Cohen et al., 2019; Vigaud et al., 2019; Specq and Batté et al., 2020). To be noted, ISO mainly include the eastward propagating MJO in boreal winter and the northward and eastward propagating BSISO, which play different roles in different seasons (Lee et al., 2013; Wang et al., 2018; Wang S. et al., 2022). Previous studies have well indicated that MJO plays an important role in modulating precipitation forecast skills (de Andrade et al., 2019; de Andrade et al., 2021), while the role of BSISO has been relatively less explored.
Meanwhile, comprehensive assessments for different models over different areas are still necessary, which would provide an “opportunity window” for enhancements of subseasonal precipitation forecast skills for specific areas (Coelho et al., 2018; Mariotti et al., 2020). The current paper investigates the weekly forecasts skills on precipitation in boreal summer over Maritime Continent (MC), which is an area featured by complex topography, warmest oceans, and characterized by great vulnerabilities to high-impact precipitation events (Neale and Slingo, 2003; Qian et al., 2010), for the models of European Centre for Medium-Range Weather Forecasts (ECMWF) and China Meteorological Administration (CMA) derived from the S2S Project. In addition, the roles of ENSO and BSISO in modulating the subseasonal forecast skills of local precipitation are also explored.
The rest of the paper is organized as follows. Section 2 provides a brief description of the used datasets and methods. Section 3 firstly evaluates the model performances of subseasonal precipitation forecasts. And the relationships between the local precipitation and drivers of ENSO and BISO are assessed in detail for both observations and model forecasts, with the contributions of these climate drivers on prediction enhancements of precipitation over MC also captured for the subseasonal timescale. Finally, a summary and discussion are given in Section 4.
The precipitation reforecast datasets from the ECMWF and CMA models are extracted from the S2S Project (Vitart et al., 2017). They are both air-sea coupled systems and are characterized by consistent initialized day. The main features of these two models are summarized in Table 1. The data are derived from the ECMWF archive with a common resolution of 1.5° × 1.5° over MC (10°S-20°N, 90°E-150°E). The study period is boreal summer seasons (June, July and August) from 2006 to 2020, composing a total of 360 samples (24 initialization days per year × 15 years) for the forecast evaluation. Besides, the precipitation from the Global Precipitation Climatology Project (GPCP) Version 3.2 Daily Precipitation Data Set covering the same period is used for verification.
TABLE 1. Information on the S2S models of ECMWF and CMA.
In order to obtain the ENSO and BSISO indices, the daily sea surface temperature (SST) and outgoing longwave radiation (OLR) at the top of atmosphere from ECMWF and CMA reforecasts are also required. Besides, the daily optimum interpolation SST (OISST) version 2 and daily interpolated OLR from the National Oceanic and Atmospheric Administration (NOAA; Reynolds et al., 2007) are used to calculate the observed indices. The ENSO index is calculated by averaging SST anomalies in the Niño-3.4 region (5°S–5°N, 120°W–170°W; Bamston et al., 1997). The OLR-based MJO index (OMI), which has been demonstrated capable of effectively tracking BSISO (Wang et al., 2018), is calculated as in Kiladis et al. (2014), and the OMI1 and OMI2 indices correspond to the first two leading principal components of the equatorial-averaged OLR derived from the empirical orthogonal function analysis (Tseng et al., 2020; Hoffmann et al., 2021).
Aiming at making a comprehensive assessment for subseasonal precipitation forecasts of ECMWF and CMA models over MC in boreal summer, two verification metrics are employed including mean error (ME) and correlation coefficient (R):
where
where N is the sample size.
For assessments of the subseasonal precipitation forecasts over MC in the ECMWF and CMA models, Figure 1 presents spatial distributions of the MEs between weekly mean precipitations in the model forecasts and observations for lead times of 1–4 weeks in boreal summer ranging from 2006 to 2020. Generally, ECMWF shows lower MEs than CMA for almost all the lead times. At the first lead week, the MEs of ECMWF are mostly lower than 2 mm, with the largest of around 4 mm over specific areas, while CMA overall shows MEs of greater than 2 mm, reaching up to 6 mm to the southeast of Philippines. Besides, the two models are characterized by different ME features with the increasing lead times. ECMWF shows a wetting trend, and the largest overestimation exhibits a banded distribution from the north of Indonesia to the east of Thailand, while CMA MEs are approximately constant throughout lead times of 2–4 weeks over most areas. The CMA model displays obvious overestimations from west central Indonesia to Philippines, and prominent underestimations over around eastern Indonesia and its surrounding oceans.
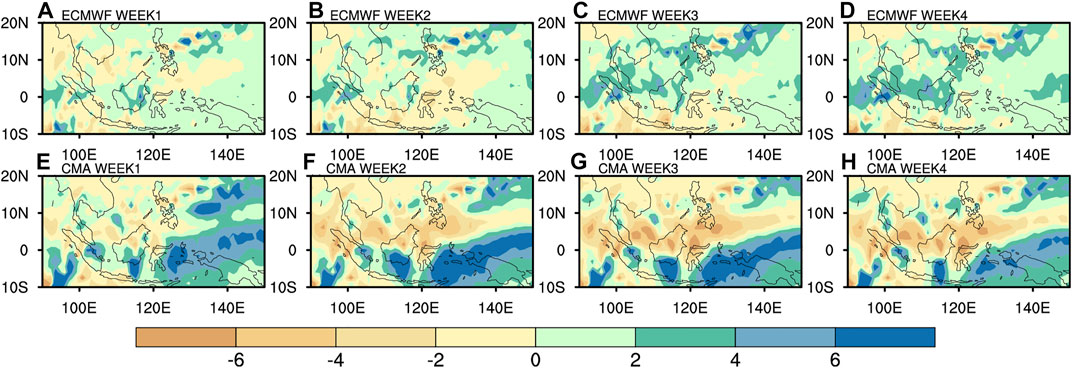
FIGURE 1. Spatial distributions of the MEs (unit: °C) between weekly mean precipitations in the ECMWF (A–D) as well as CMA (E–H) and observations for lead times of 1–4 weeks in boreal summer ranging from 2006 to 2020.
Figure 2 describes the temporal correlation coefficients between the weekly mean precipitation anomalies in the observations and model forecasts for lead times of 1–4 weeks in boreal summer. Generally, the ECMWF results are characterized by higher correlations than CMA over most regions. Specifically, at the lead time of 1 week, the correlations of ECMWF are greater than 0.6 for most areas, which is higher than those of CMA, especially over areas around western Indonesia and the ocean to the east of Indonesia. In addition, the correlations of both ECMWF and CMA decrease obviously with growing lead times and present a high-low distribution from north to south. The correlations over around Indochina and Philippines are still above 0.4 even for lead times of 3–4 weeks in the ECMWF forecasts, whereas they are generally lower than 0.3 over the southern MC. On the other hand, in the CMA results, it reaches roughly 0.3 over the northern MC for the lead time of 3 weeks, while only no greater than 0.1 over the southern MC.
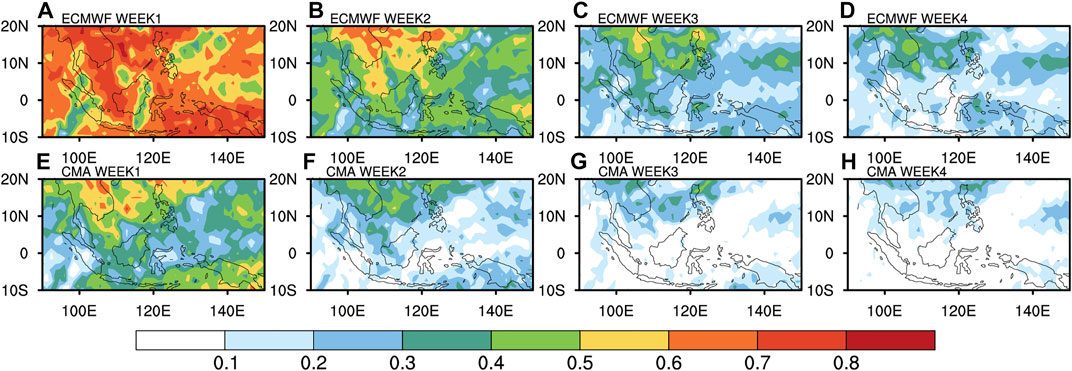
FIGURE 2. Spatial distributions of the temporal correlation coefficients between weekly mean precipitations in the ECMWF (A–D) as well as CMA (E–H) and observations for lead times of 1–4 weeks in boreal summer ranging from 2006 to 2020.
To summarize, the ECMWF model shows generally superior performances than CMA in the precipitation forecast over MC on the subseasonal timescale, which are characterized by lower errors and higher correlations compared with the observations. Meanwhile, ECMWF tends to produce wet biases with increasing lead times, while the MEs of CMA are revealed to be approximately constant throughout the lead times of 2–4 weeks over most areas. In addition, the temporal correlations between model outputs and observations obviously decrease with growing lead times, with a high-low distribution presented from north to south.
Although previous studies have figured out the fact that large-scale drivers such as ENSO and ISO play important roles in modulating precipitation, the capabilities of subseasonal models in capturing the relationships between precipitation and these drivers remain to be assessed. Thus, Figures 3–5 describe the spatial distributions of temporal correlation coefficients between the observed weekly mean precipitation anomalies and weekly mean ENSO, OMI1 and OMI2 indices, respectively, together with those in the ECMWF and CMA model outputs for lead times of 1–4 weeks. The pattern correlation coefficients between observed and predicted correlation distributions are also provided at the right-top of each plot.
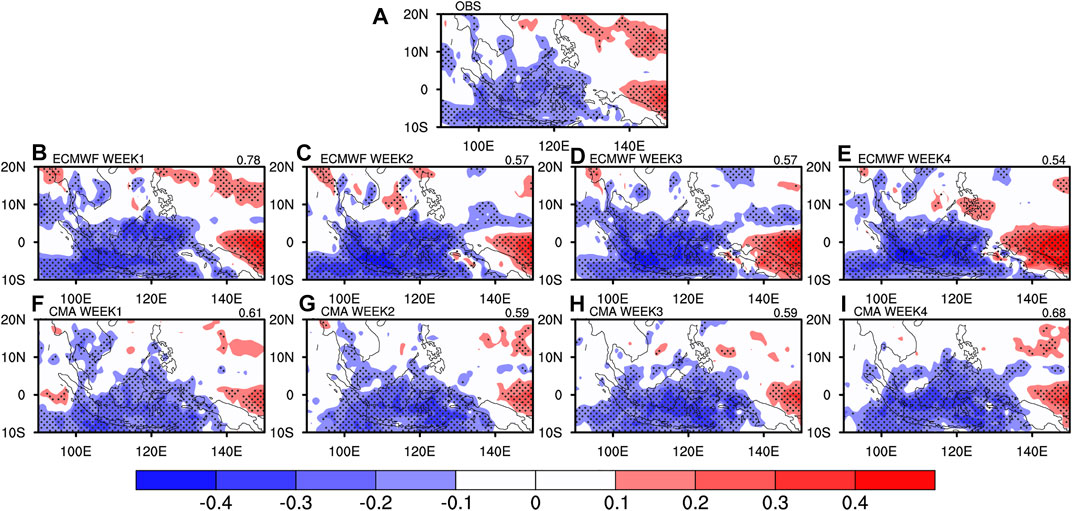
FIGURE 3. Spatial distribution of correlation coefficients between observed weekly mean precipitation anomalies and observed weekly mean ENSO index (A), together with the correlation coefficients maps between forecasted weekly mean precipitation anomalies and forecasted ENSO index in ECMWF (B–E) and CMA (F–I) at the lead time of 1–4 weeks. The pattern correlation coefficients between observed correlation coefficients maps and forecasted correlation coefficients maps are also provided on the right strings. Stipples indicate correlations statistically significant at the 95% level.
Generally, negative correlations between weekly mean precipitation anomalies and weekly mean ENSO indices are observed around Indonesia and its surrounding ocean, along with positive correlations occurring over the ocean to the north of New Guinea and the surrounding ocean of Guam (Figure 3A). The two models of ECMWF and CMA could well reproduce these ENSO related precipitation variabilities around Indonesia and the island of New Guinea, with the pattern correlations in both models being greater than 0.5 for all lead times. However, deficiencies exist in capturing ENSO related precipitation variabilities over the Guam surrounding regions for both ECMWF and CMA, which require further improvements in the future.
Meanwhile, BSISO also plays an important role in modulating the local precipitation. Negative correlations are verified between precipitation anomalies and OMI1 over around the northeast area of MC, while the southwest regions are mainly featured with positive correlations (Figure 4A). On the other hand, there are strong positive correlations between precipitation anomalies and OMI2 over the belt from northwest to southeast, along with negative correlations over southwest and northeast areas (Figure 5A). Although the capabilities of capturing OMI1 and OMI2 related precipitation variabilities are both decreasing with growing lead times in ECMWF and CMA products, the reproducibility differs from different models for different drivers. The ECMWF model could represent the OMI1 related precipitation variabilities for all lead times, and the corresponding pattern correlation is greater than 0.7 for even the lead time of 4 weeks. Nevertheless, CMA tends to show lower pattern correlations for 3–4-week lead times, with the corresponding pattern correlation being 0.38 at the lead time of 4 weeks. On the other hand, both ECMWF and CMA show lower skills in capturing OMI2 related precipitation variabilities than those for OMI1 for longer lead times. The phenomenon is more obvious in the CMA results, showing pattern correlations of lower than 0.15 for lead times of 3–4 weeks. In general, the shortage of ECMWF in capturing OMI2 related precipitation variabilities is associated with the insufficiency in reproducing the negative correlations over southwest MC, while the CMA model could hardly reproduce any of them.
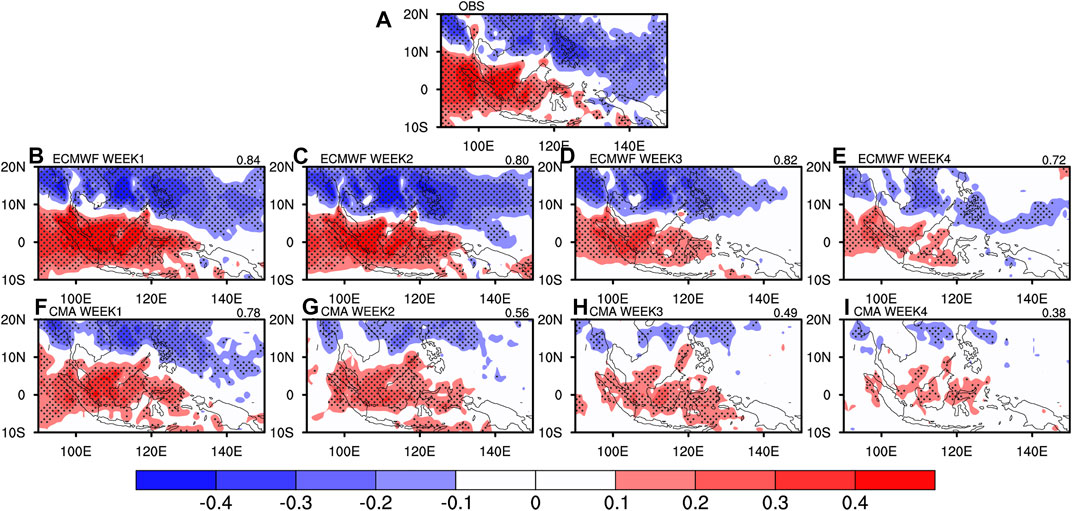
FIGURE 4. Spatial distribution of correlation coefficients between observed weekly mean precipitation anomalies and observed weekly mean OMI1 index (A), together with the correlation coefficients maps between forecasted weekly mean precipitation anomalies and forecasted OMI1 index in ECMWF (B–E) and CMA (F–I) at the lead time of 1–4 weeks. The pattern correlation coefficients between observed correlation coefficients maps and forecasted correlation coefficients maps are also provided on the right strings. Stipples indicate correlations statistically significant at the 95% level.
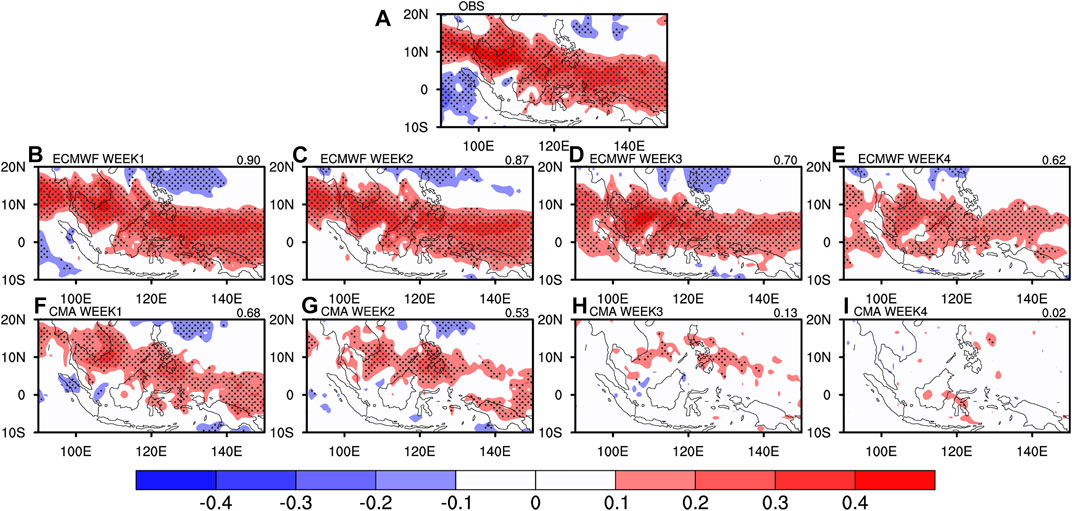
FIGURE 5. Spatial distribution of correlation coefficients between observed weekly mean precipitation anomalies and observed weekly mean OMI2 index (A), together with the correlation coefficients maps between forecasted weekly mean precipitation anomalies and forecasted OMI2 index in ECMWF (B–E) and CMA (F–I) at the lead time of 1–4 weeks. The pattern correlation coefficients between observed correlation coefficients maps and forecasted correlation coefficients maps are also provided on the right strings. Stipples indicate correlations statistically significant at the 95% level.
Furthermore, in order to quantitatively reveal the large-scale driver emerging impacts on the model forecast performances, Figure 6 describes the regionally averaged correlations between hindcasts and observed precipitation anomalies over MC in the initial model output and experiments after adding the corresponding observed regression patterns to hindcasts, that is, replacing the modeled regression patterns associated with drivers of ENSO, OMI1, OMI2, and OMI1+OMI2 with the observed regression patterns for ECMWF and CMA, respectively. The linear regression approach is used to obtain ENSO, OMI1 and OMI2 related precipitation variabilities for both forecasts and observations. To be specific, the predicted large-scale driver associated precipitation anomalies are computed based on the predicted weekly mean precipitation anomalies and the predicted weekly mean ENSO, OMI1 and OMI2 indices, while the observed ones are obtained from the observed weekly mean precipitation anomalies and the observed weekly mean ENSO, OMI1 and OMI2 indices. Generally, the enhanced forecast skills of both ECMWF and CMA are mainly associated with BSISO related precipitation variability, while there is no obvious improvement in response to the ENSO signal, which might be attributed to the better performances of both ECMWF and CMA to capture the ENSO related precipitation. Therefore, a multiple linear regression considering both OMI1 and OMI2 is further applied to obtain the associated precipitation variability. The obviously enhanced forecast skills are found at lead times of 2–4 weeks for both ECMWF and CMA models, showing the greatest correlation improvement of even up to 0.1 when the OMI1 and OMI2 signals are considered simultaneously at the lead time of 4 weeks.
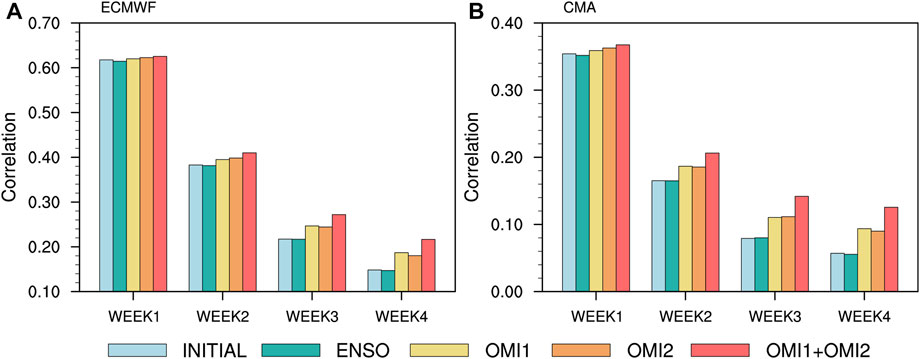
FIGURE 6. The regionally averaged correlations between hindcasts and observed precipitation anomalies over MC in the initial model output and experiments after replacing the modeled regression patterns associated with drivers of ENSO, OMI1, OMI2, and OMI1+OMI2 with the observed regression patterns for ECMWF (A) and CMA (B), respectively.
Aiming at investigations on spatial characteristics of the subseasonal precipitation forecast skills improved by enhancing precipitation forecasts associated with different drivers, Figures 7, 8 display the spatial distributions of differences on temporal correlations before and after the replacement of large-scale driver associated precipitation anomalies in the model products. For both ECMWF and CMA models, the OMI1 signal plays an important role in enhancing the forecast skills over Philippines, along with the west Indonesia, and their surrounding ocean, while the OMI2 signal affects the forecast skills over the belt from south of Indochina Peninsula to north of New Guinea Island, where temporal correlations could be improved by up to 0.1 at lead times of 2–4 weeks. Moreover, for both replacements of OMI1 and OMI2 associated precipitations, it indicates more obvious improvement for CMA than ECMWF, and greater improvements are always found for longer lead times. In addition, when the OMI1 and OMI2 signals are “perfectly” captured simultaneously, all these associated regions exhibit obviously enhanced forecast skills.
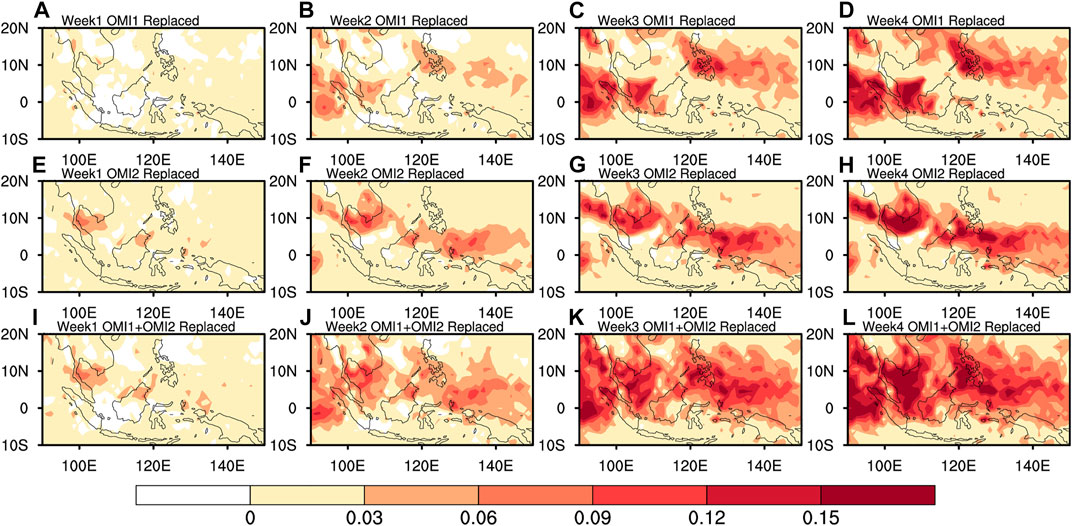
FIGURE 7. Spatial distributions of enhanced correlations between hindcasts and observed precipitation anomalies at lead times of 1–4 weeks after replacing the modeled regression patterns associated with drivers of OMI1 (A–D), OMI2 (E–H), and OMI1+OMI2 (I–L) with the observed regression patterns for the ECMWF model.
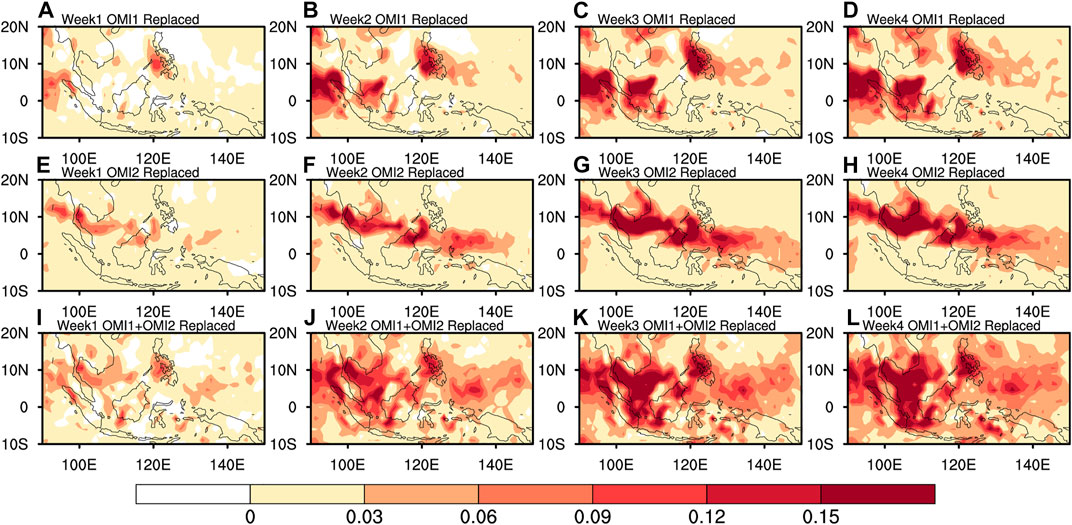
FIGURE 8. Spatial distributions of enhanced correlations between hindcasts and observed precipitation anomalies at lead times of 1–4 weeks after replacing the modeled regression patterns associated with drivers of OMI1 (A–D), OMI2 (E–H), and OMI1+OMI2 (I–L) with the observed regression patterns for the CMA model.
In summary, both ECMWF and CMA can reasonably capture the ENSO related precipitation anomalies for all lead times, showing decreasing capabilities with growing lead times. The ECMWF model generally displays better performances than CMA. The enhanced subseasonal precipitation forecast skills mainly respond to the BSISO associated precipitation variability. For most MC areas such as southern Indochina, western Indonesia, Philippines and the eastern ocean, the forecast skills of both ECMWF and CMA can be improved to a great extent by enhancing the capture of BSISO related precipitation anomalies. It provides an opportunity window for the models to further improve the subseasonal precipitation forecasts.
In this study, the subseasonal precipitation forecast skills over Maritime Continent in boreal summer are investigated for the ECMWF and CMA models involved in the S2S Project for the period of 2006–2020. The roles of large-scale drivers like ENSO and BSISO in modulating the subseasonal precipitation forecast skills are also assessed. Associated results are obtained as follows.
Generally, the ECMWF model outperforms CMA in the subseasonal precipitation forecast over Maritime Continent in boreal summer, which are featured with lower errors and higher correlations compared with the observations. ECMWF tends to generate wet biases with increasing lead times, while the mean errors of CMA are approximately constant throughout the lead times of 2–4 weeks. In addition, the temporal correlations between model outputs and observations decrease obviously with growing lead times, along with a high-low distribution presented from north to south.
Both ECMWF and CMA can reasonably capture the ENSO related precipitation anomalies for all lead times, with the pattern correlations in both models being greater than 0.5 for all lead times. In contrast, their capabilities of capturing BSISO related precipitation anomalies decrease with growing lead times, which is more obvious in CMA, with the pattern correlations lower than 0.15 at lead times of 3–4 weeks. The enhanced subseasonal precipitation forecast skills mainly respond to the BSISO associated precipitation variability, while there is no obvious improvement in response to the ENSO signal. For most MC areas such as southern Indochina, western Indonesia, Philippines and the eastern ocean, the forecast skills of both ECMWF and CMA could be improved to a great extent by enhancing the capture of BSISO related precipitation anomalies, with the temporal correlations for both ECMWF and CMA increased by about 0.15 for lead times of 3–4 weeks. It provides an opportunity window for the models to improve precipitation forecasts on the subseasonal timescale.
As analyzed in the current study, the prediction of large-scale drivers in the subseasonal models do have crucial impacts on forecasts of local precipitation. Besides, for lead times of within 4 weeks on the subseasonal timescale, there is generally little changes in ENSO while the BSISO forecasts would vary a lot (Jie et al., 2017; Wang et al., 2019; Shibuya et al., 2021), which corresponds to the non-significant (significant) response of the forecast skill of adding ENSO (BSISO) signals to the hindcasts in this study. On the other hand, the models always have different capabilities of predicting the large-scale drivers such as ENSO and BSISO, which tends to result in different subseasonal forecast skills of precipitation for different cases. Classified experiments are to be further investigated to reveal the different roles of these predictors in the subseasonal model forecasts and to make full use of the predictors in the operational forecasts on the subseasonal timescale. In addition, on the basis of the model outputs and the historical observations, the prediction skills could also be strengthened via sort of statistical postprocessing methods such as the single-model calibrations (Lyu et al., 2021; Pan et al., 2022) and the multimodel ensembles (Ji et al., 2019; Ji et al., 2020; Peng et al., 2020). Associated investigations would be further carried out in the future.
The original contributions presented in the study are included in the article/Supplementary Material, further inquiries can be directed to the corresponding author.
YL, SZ and XZ contributed to conception and design of the study. FD and YF contributed to the analysis. CZ and LJ organized the database. All authors contributed to manuscript revision, read, and approved the submitted version.
The study was jointly supported by the National Natural Science Foundation of China (Grant No. 42105030), the National Key R&D Program of China (Grant No. 2017YFC1502002), the Basic Research Fund of CAMS (Grant No. 2022Y027) and the research project of Jiangsu Meteorological Bureau (Grant No. KQ202209).
The authors are grateful to ECMWF, CMA, NOAA, and NCEP for their datasets.
The authors declare that the research was conducted in the absence of any commercial or financial relationships that could be construed as a potential conflict of interest.
All claims expressed in this article are solely those of the authors and do not necessarily represent those of their affiliated organizations, or those of the publisher, the editors and the reviewers. Any product that may be evaluated in this article, or claim that may be made by its manufacturer, is not guaranteed or endorsed by the publisher.
Bamston, A. G., Chelliah, M., and Goldenberg, S. B. (1997). Documentation of a highly ENSO‐related SST region in the equatorial Pacific: Research note. Atmosphere-ocean 35 (3), 367–383. doi:10.1080/07055900.1997.9649597
Coelho, C. A. S., Firpo, M. A. F., and de Andrade, F. M. (2018). A verification framework for South American sub-seasonal precipitation predictions. metz. 27 (6), 503–520. doi:10.1127/metz/2018/0898
Cohen, J., Coumou, D., Hwang, J., Mackey, L., Orenstein, P., Totz, S., et al. (2019). S2S reboot: An argument for greater inclusion of machine learning in subseasonal to seasonal forecasts. WIREs Clim. Change 10 (2), e00567. doi:10.1002/wcc.567
de Andrade, F. M., Coelho, C. A. S., and Cavalcanti, I. F. A. (2019). Global precipitation hindcast quality assessment of the Subseasonal to Seasonal (S2S) prediction project models. Clim. Dyn. 52 (9), 5451–5475. doi:10.1007/s00382-018-4457-z
de Andrade, F. M., Young, M. P., MacLeod, D., Hirons, L. C., Woolnough, S. J., and Black, E. (2021). Subseasonal precipitation prediction for Africa: Forecast evaluation and sources of predictability. Weather Forecast. 36 (1), 265–284. doi:10.1175/waf-d-20-0054.1
Fan, Y., Zhu, S., Wang, L., and Wang, X. (2022). Subseasonal dynamical prediction of South China Sea summer monsoon. Atmos. Res., 106347. doi:10.1016/j.atmosres.2022.106347
Ge, F., Zhu, S., Peng, T., Zhao, Y., Sielmann, F., Fraedrich, K., et al. (2019). Risks of precipitation extremes over southeast Asia: Does 1.5° C or 2° C global warming make a difference? Environ. Res. Lett. 14 (4), 044015. doi:10.1088/1748-9326/aaff7e
Gottschalck, J., Wheeler, M., Weickmann, K., Vitart, F., Savage, N., Lin, H., et al. (2010). A framework for assessing operational madden–julian oscillation forecasts: A clivar MJO working group project. Bull. Am. Meteorol. Soc. 91 (9), 1247–1258. doi:10.1175/2010bams2816.1
Hoffmann, C. G., Kiladis, G. N., Gehne, M., and Von Savigny, C. (2021). A Python package to calculate the OLR-based index of the Madden-Julian-Oscillation (OMI) in climate science and weather forecasting. J. Open Res. Softw. 9, 9. doi:10.5334/jors.331
Ji, L., Zhi, X., Simmer, C., Zhu, S., and Ji, Y. (2020). Multimodel ensemble forecasts of precipitation based on an object-based diagnostic evaluation. Mon. Weather Rev. 148 (6), 2591–2606. doi:10.1175/mwr-d-19-0266.1
Ji, L., Zhi, X., Zhu, S., and Fraedrich, K. (2019). Probabilistic precipitation forecasting over East Asia using Bayesian model averaging. Weather Forecast. 34 (2), 377–392. doi:10.1175/waf-d-18-0093.1
Jie, W., Vitart, F., Wu, T., and Liu, X. (2017). Simulations of the Asian summer monsoon in the sub‐seasonal to seasonal prediction project (S2S) database. Q. J. R. Meteorol. Soc. 143 (706), 2282–2295. doi:10.1002/qj.3085
Johnson, N. C., Collins, D. C., Feldstein, S. B., L’Heureux, M. L., and Riddle, E. E. (2014). Skillful wintertime North American temperature forecasts out to 4 weeks based on the state of ENSO and the MJO. Weather Forecast. 29 (1), 23–38. doi:10.1175/waf-d-13-00102.1
Kim, H., Vitart, F., and Waliser, D. E. (2018). Prediction of the madden–julian oscillation: A review. J. Clim. 31 (23), 9425–9443. doi:10.1175/jcli-d-18-0210.1
Koster, R. D., Mahanama, S. P. P., Yamada, T. J., Balsamo, G., Berg, A. A., Boisserie, M., et al. (2010). Contribution of land surface initialization to subseasonal forecast skill: First results from a multi‐model experiment. Geophys. Res. Lett. 37, L02402. doi:10.1029/2009gl041677
Lee, J. Y., Wang, B., Wheeler, M. C., Fu, X., Waliser, D. E., and Kang, I. S. (2013). Real-time multivariate indices for the boreal summer intraseasonal oscillation over the Asian summer monsoon region. Clim. Dyn. 40 (1), 493–509. doi:10.1007/s00382-012-1544-4
L’Heureux, M. L., Tippett, M. K., and Becker, E. J. (2021). Sources of subseasonal skill and predictability in wintertime California precipitation forecasts. Weather Forecast. 36 (5), 1815–1826. doi:10.1175/waf-d-21-0061.1
Li, S., and Robertson, A. W. (2015). Evaluation of submonthly precipitation forecast skill from global ensemble prediction systems. Mon. Weather Rev. 143 (7), 2871–2889. doi:10.1175/mwr-d-14-00277.1
Liang, P., and Lin, H. (2018). Sub-seasonal prediction over East Asia during boreal summer using the ECCC monthly forecasting system. Clim. Dyn. 50 (3), 1007–1022. doi:10.1007/s00382-017-3658-1
Liu, X., Yang, S., Li, J., Jie, W., Huang, L., and Gu, W. (2015). Subseasonal predictions of regional summer monsoon rainfall over tropical Asian oceans and land. J. Clim. 28 (24), 9583–9605. doi:10.1175/jcli-d-14-00853.1
Lyu, Y., Zhi, X., Zhu, S., Fan, Y., and Pan, M. (2021). Statistical calibrations of surface air temperature forecasts over East Asia using pattern projection methods. Weather Forecast. 36 (5), 1661–1674. doi:10.1175/waf-d-21-0043.1
Mariotti, A., Baggett, C., Barnes, E. A., Becker, E., Butler, A., Collins, D. C., et al. (2020). Windows of opportunity for skillful forecasts subseasonal to seasonal and beyond. Bull. Am. Meteorological Soc. 101 (5), E608–E625. doi:10.1175/bams-d-18-0326.1
Marshall, A. G., and Hendon, H. H. (2019). Multi-week prediction of the madden–julian oscillation with ACCESS-S1. Clim. Dyn. 52 (5), 2513–2528. doi:10.1007/s00382-018-4272-6
Mastrangelo, D., and Malguzzi, P. (2019). Verification of two years of CNR-ISAC subseasonal forecasts. Weather Forecast. 34 (2), 331–344. doi:10.1175/waf-d-18-0091.1
Neale, R., and Slingo, J. (2003). The Maritime continent and its role in the global climate: A gcm study. J. Clim. 16 (5), 834–848. doi:10.1175/1520-0442(2003)016<0834:tmcair>2.0.co;2
Neena, J. M., Lee, J. Y., Waliser, D., Wang, B., and Jiang, X. (2014). Predictability of the Madden–Julian oscillation in the intraseasonal variability hindcast experiment (ISVHE). J. Clim. 27 (12), 4531–4543. doi:10.1175/jcli-d-13-00624.1
Pan, B., Hsu, K., AghaKouchak, A., Sorooshian, S., and Higgins, W. (2019). Precipitation prediction skill for the West Coast United States: From short to extended range. J. Clim. 32 (1), 161–182. doi:10.1175/jcli-d-18-0355.1
Pan, M., Zhi, X., Liu, Z., Zhu, S., Lyu, Y., and Zhu, D. (2022). Statistical calibrations to improve the 2–5-year prediction skill for SST over the North Atlantic. Meteorol. Atmos. Phys. 134 (3), 52–14. doi:10.1007/s00703-022-00888-4
Peng, T., Zhi, X., Ji, Y., Ji, L., and Tian, Y. (2020). Prediction skill of extended range 2-m maximum air temperature probabilistic forecasts using machine learning post-processing methods. Atmosphere 11 (8), 823. doi:10.3390/atmos11080823
Qian, J. H., Robertson, A. W., and Moron, V. (2010). Interactions among ENSO, the monsoon, and diurnal cycle in rainfall variability over Java, Indonesia. J. Atmos. Sci. 67 (11), 3509–3524. doi:10.1175/2010jas3348.1
Rauser, F., Alqadi, M., Arowolo, S., Baker, N., Bedard, J., Behrens, E., et al. (2017). Earth system science frontiers: An early career perspective. Bull. Am. Meteorological Soc. 98 (6), 1120–1127. doi:10.1175/bams-d-16-0025.1
Reynolds, R. W., Smith, T. M., Liu, C., Chelton, D. B., Casey, K. S., and Schlax, M. G. (2007). Daily high-resolution-blended analyses for sea surface temperature. J. Clim. 20 (22), 5473–5496. doi:10.1175/2007jcli1824.1
Robertson, A. W., Kumar, A., Peña, M., and Vitart, F. (2015). Improving and promoting subseasonal to seasonal prediction. Bull. Am. Meteorological Soc. 96 (3), ES49–ES53. doi:10.1175/bams-d-14-00139.1
Shibuya, R., Nakano, M., Kodama, C., Nasuno, T., Kikuchi, K., Satoh, M., et al. (2021). Prediction skill of the Boreal Summer Intra-Seasonal Oscillation in global non-hydrostatic atmospheric model simulations with explicit cloud microphysics. J. Meteorological Soc. Jpn. 99, 046–992. doi:10.2151/jmsj.2021-046
Shiogama, H., Watanabe, M., Yoshimori, M., Yokohata, T., Ogura, T., Annan, J. D., et al. (2012). Perturbed physics ensemble using the MIROC5 coupled atmosphere–ocean GCM without flux corrections: Experimental design and results. Clim. Dyn. 39 (12), 3041–3056. doi:10.1007/s00382-012-1441-x
Specq, D., and Batté, L. (2020). Improving subseasonal precipitation forecasts through a statistical–dynamical approach: Application to the southwest tropical pacific. Clim. Dyn. 55 (7), 1913–1927. doi:10.1007/s00382-020-05355-7
Tian, D., Wood, E. F., and Yuan, X. (2017). CFSv2-based sub-seasonal precipitation and temperature forecast skill over the contiguous United States. Hydrol. Earth Syst. Sci. 21 (3), 1477–1490. doi:10.5194/hess-21-1477-2017
Tseng, K. C., Barnes, E. A., and Maloney, E. (2020). The importance of past MJO activity in determining the future state of the midlatitude circulation. J. Clim. 33 (6), 2131–2147. doi:10.1175/jcli-d-19-0512.1
Vigaud, N., Robertson, A. W., and Tippett, M. K. (2017). Multimodel ensembling of subseasonal precipitation forecasts over North America. Mon. Weather Rev. 145 (10), 3913–3928. doi:10.1175/mwr-d-17-0092.1
Vigaud, N., Tippett, M. K., and Robertson, A. W. (2019). Deterministic skill of subseasonal precipitation forecasts for the east africa‐west Asia sector from september to may. J. Geophys. Res. Atmos. 124 (22), 11887–11896. doi:10.1029/2019jd030747
Vigaud, N., Tippett, M. K., and Robertson, A. W. (2018). Probabilistic skill of subseasonal precipitation forecasts for the east africa–west Asia sector during september–may. Weather Forecast. 33 (6), 1513–1532. doi:10.1175/waf-d-18-0074.1
Vitart, F., Ardilouze, C., Bonet, A., Brookshaw, A., Chen, M., Codorean, C., et al. (2017). The subseasonal to seasonal (S2S) prediction project database. Bull. Am. Meteorological Soc. 98 (1), 163–173. doi:10.1175/bams-d-16-0017.1
Vitart, F. (2014). Evolution of ECMWF sub‐seasonal forecast skill scores. Q. J. R. Meteorol. Soc. 140 (683), 1889–1899. doi:10.1002/qj.2256
Vitart, F. (2017). Madden—julian oscillation prediction and teleconnections in the S2S database. Q. J. R. Meteorol. Soc. 143 (706), 2210–2220. doi:10.1002/qj.3079
Vitart, F., Robertson, A. W., and Anderson, D. L. T. (2012). Subseasonal to seasonal prediction project: Bridging the gap between weather and climate. Bull. World Meteorological Organ. 61 (2), 23.
Wang, S., Ma, D., Sobel, A. H., and Tippett, M. K. (2018). Propagation characteristics of BSISO indices. Geophys. Res. Lett. 45 (18), 9934–9943. doi:10.1029/2018gl078321
Wang, S., Martin, Z. K., Sobel, A. H., Tippett, M. K., Dias, J., Kiladis, G. N., et al. (2022a). A multivariate index for tropical intraseasonal oscillations based on the seasonally‐varying modal structures. JGR. Atmos. 127 (4), e2021JD035961. doi:10.1029/2021jd035961
Wang, S., Sobel, A. H., Tippett, M. K., and Vitart, F. (2019). Prediction and predictability of tropical intraseasonal convection: Seasonal dependence and the Maritime Continent prediction barrier. Clim. Dyn. 52 (9), 6015–6031. doi:10.1007/s00382-018-4492-9
Wang, X., Fan, Y., Wang, L., and Zhu, Y. (2022b). The 1-31-day predictions of the south China sea summer monsoon in the CAMS-CSM climate forecast system. Atmosphere 13 (7), 1051. doi:10.3390/atmos13071051
WMO (2015). Seamless prediction of the earth system: From minutes to months. Switzerland: Communication and Public Affairs Office Geneva.
Yuan, H., Sun, M., and Wang, Y. (2016). Assessment of the benefits of the Chinese public weather service. Mater. Apps. 23 (1), 132–139. doi:10.1002/met.1539
Zhu, S., Ge, F., Fan, Y., Zhang, L., Sielmann, F., Fraedrich, K., et al. (2020a). Conspicuous temperature extremes over southeast Asia: Seasonal variations under 1.5 C and 2 C global warming. Clim. Change 160 (3), 343–360. doi:10.1007/s10584-019-02640-1
Zhu, S., Ge, F., Sielmann, F., Pan, M., Fraedrich, K., Remedio, A. R. C., et al. (2020b). Seasonal temperature response over the Indochina Peninsula to a worst-case high-emission forcing: A study with the regionally coupled model ROM. Theor. Appl. Climatol. 142 (1), 613–622. doi:10.1007/s00704-020-03345-7
Keywords: Subseasonal forecast, Summer precipitation, Maritime continent, ENSO, BSISO
Citation: Lyu Y, Zhu S, Zhi X, Dong F, Zhu C, Ji L and Fan Y (2022) Subseasonal forecasts of precipitation over maritime continent in boreal summer and the sources of predictability. Front. Earth Sci. 10:970791. doi: 10.3389/feart.2022.970791
Received: 16 June 2022; Accepted: 25 July 2022;
Published: 30 August 2022.
Edited by:
Jingyu Wang, Nanyang Technological University, SingaporeReviewed by:
Ping Liang, Shanghai Meteorological Bureau, ChinaCopyright © 2022 Lyu, Zhu, Zhi, Dong, Zhu, Ji and Fan. This is an open-access article distributed under the terms of the Creative Commons Attribution License (CC BY). The use, distribution or reproduction in other forums is permitted, provided the original author(s) and the copyright owner(s) are credited and that the original publication in this journal is cited, in accordance with accepted academic practice. No use, distribution or reproduction is permitted which does not comply with these terms.
*Correspondence: Shoupeng Zhu, enNwc2hvdXBlbmdAMTYzLmNvbQ==; Xiefei Zhi, emhpQG51aXN0LmVkdS5jbg==
Disclaimer: All claims expressed in this article are solely those of the authors and do not necessarily represent those of their affiliated organizations, or those of the publisher, the editors and the reviewers. Any product that may be evaluated in this article or claim that may be made by its manufacturer is not guaranteed or endorsed by the publisher.
Research integrity at Frontiers
Learn more about the work of our research integrity team to safeguard the quality of each article we publish.