 Yulu Fan
 Peng Zhang1,2*
 Bangshen Qi
- 1Institute of Geomechanics, Chinese Academy of Geological Sciences, Beijing, China
- 2Key Laboratory of Active Tectonics and Geological Safety, Ministry of Natural Resources, Beijing, China
- 3China United Engineering Corporation Limited, Hangzhou, China
In order to ascertain the impact of the Tohoku-Oki 3.11 M9.0 earthquake on the stability of the faults in the Tangshan seismic region, we investigated the adjustment of the in situ stress field of the seismic region after this earthquake based on in situ stress monitoring data. Then, according to the Mohr-Coulomb failure criteria and Byerlee’s law, we used the FSP v.1.0 software package to calculate the fault slip potential (FSP) of the main faults in the seismic region at each adjustment stage of the in situ stress field, and to study the risk of fault activity. The research results show that 1) after the Tohoku-Oki 3.11 M9.0 earthquake, the tectonic environment of the Beijing Plain area changed rapidly from nearly EW extrusion to nearly EW extension, and this state was maintained until June 2012. After this, it began to gradually adjust to the state present before the earthquake. As of September 2019, at the depth of 100m, the maximum horizontal principal stress value in Tangshan seismic region was 7.61–7.81MPa, the minimum horizontal principal stress value was 5.30–5.50MPa, and the maximum horizontal principal stress orientation was N55.1°–59.5°E. (2) Before the Tohoku-Oki 3.11 M9.0 earthquake, the stress accumulation level of the main faults in the seismic region was relatively high with the FSP values of 30–60%. After this earthquake, the stress accumulation level of each fault continued to decrease, as of May 2013, the FSP values were mainly concentrated at 10–35%. Then, the stress accumulation level of major faults in the seismic region began to gradually increase. As of September 2019, the FSP values were mainly concentrated at 23–37%, and the stress accumulation level was still lower than the pre-earthquake state. 3) The fault activity in the central and northern parts of the seismic region was the strongest, followed by the southern part and western part, and the fault activity in the eastern part was the weakest.
Introduction
There are many causes for earthquakes, but most of them are due to the long-term accumulation and strengthening of regional stress, which eventually lead to the sudden release of the strain energy of pre-existed faults (Li, 1973; Wang et al., 2017). The change of the regional in situ stress field is the main reason affecting the fault stability (Tan et al., 2019; Fan et al., 2021). Therefore, carrying out in situ stress measurement and real-time monitoring in areas with strong tectonic activity to reveal the variation of in situ stress field, and then to analyze the stability of faults in the region, which is of great scientific significance for judging regional tectonic stability and ensuring regional geological safety.
Predecessors have done a lot of work in combining the in situ stress field to study fault stability (Huang et al., 2013; Wang et al., 2014; Walsh and Zoback, 2016; Feng et al., 2019). Tanaka et al. (1998) calculated the ratio of the maximum shear stress to the average stress using the measured in situ stress data, and analyzed the possible influence of the in situ stress on the fault slip. The study found that the ratio continued to increase to 0.53 before the 1995 Hyogoken-Nambu earthquake, after the earthquake, the ratio decreased to 0.2. Townend and Zoback (2004) calculated the friction coefficient of the San Andreas Fault based on the in situ stress measurement data, and the results showed that the friction coefficient were about 0.6 in the shallow part of the borehole and about 0.2 in the deep part. Tan et al. (2014) found that the current tectonic activity in the Tangshan-Luanxian-Changli area was abnormal through a comparative analysis of in situ stress measurements and real-time monitoring data at different key tectonic locations around Beijing. Feng et al. (2015) calculated the magnitude and orientation of the principal stresses in different periods around the Ming Tombs borehole in Changping, Beijing, based on the in situ stress measurement and real-time monitoring data, and discussed the activity of the Nankou piedmont fault based on the Mohr-Coulomb failure criterion and Byerlee’s law. Qiu et al. (2017) calculated the ratio of the maximum shear stress to the average stress in the southwestern section of the Longmenshan fault zone based on the in situ stress measurement data after the Lushan MS7.0 earthquake on 20 April 2013, and then combined Byerlee’s law to evaluate the stress accumulation level. The results shown that after the Lushan earthquake, the stress accumulation in the northern and southern subsections of the southwestern section of the Longmenshan fault zone increased, and there was a possibility of fault slippage, especially in the northern subsection. According to the literature survey, it can be seen that the current fault stability analysis using in situ stress data is mainly based on the Mohr-Coulomb failure criterion and Byerlee’s law to calculate the friction coefficient of the fault plane and judge the fault stress accumulation level.
North China is located in the eastern China and is one of the regions with frequent strong earthquakes in China (Shi et al., 2020). The subduction of the Pacific plate under the Eurasian plate provides a continuous source of stress for tectonic activities in North China, and the strength of plate subduction directly affects the tectonic stress field in North China (Ma et al., 2003; Wu et al., 2014; Tan et al., 2015; Zhu and Xu, 2019). The Tangshan seismic region is located in the northeastern part of the North China Plain and is located at the intersection of the Zhangjiakou-Bohai fault zone and the Tangshan-Hejian-Cixian fault zone. There are mainly two groups of NE-trending and NW-trending faults in the area, and most faults were formed by the late Pleistocene-Holocene tectonic activity (Ji et al., 2016; Peng and Meng, 2017; Feng et al., 2019; Wang et al., 2020). At the same time, the seismic region is located in the southern piedmont of the large-area rigid basement of Yanshan Mountain. Due to the mechanical properties of the rigid basement, such as high strength and small deformation, the fault activity in the seismic region is blocked in front of the Yanshan Mountain, which is easy to cause the concentration of stress and energy in the area (Tan et al., 2010). Under the comprehensive influence of internal and external dynamics, geological environment, active structure, the Tangshan seismic region become one of the most seismically active areas in North China, it has the tectonic background and conditions for occurring moderate-intensity earthquakes in the future.
Strong seismic activity can cause near-field and far-field stress changes (Liao et al., 2003; Zhang et al., 2017). On 11 March 2011, the Tohoku-Oki 84 M9.0 earthquake (hereinafter referred to as the 3.11 earthquake) occurred in the eastern sea of Japan (142.86°E, 38.10°N). It caused significant near-field and far-field crustal deformation. Coseismic displacement measurements based on global positioning system (GPS) monitoring revealed that the 3.11 earthquake produced a nearly EW-trending tensile effect in eastern China, with a maximum coseismic horizontal displacement of 35 mm (Wang et al., 2011; Yang et al., 2011; Zhu et al., 2018). Studies have shown that the 3.11 earthquake had a huge impact on the tectonic environment in eastern China, and this impact may still persist (Wang et al., 2013; Sun et al., 2015; Hao and Zhuang, 2020), GPS monitoring also shown that the topographic deformation of the Bohai Bay Basin and the active characteristics of the Zhangjiakou-Bohai fault zone and the Tanlu fault zone adjusted after the 3.11 earthquake (Zhu, 2020). The Tangshan seismic region belongs to the East China Stress Zone, it is located in the northern part of the Bohai Bay Basin, and at the intersection of the Zhangjiakou-Bohai fault zone and the Tanlu fault zone. The 3.11 earthquake inevitably had an impact on the stress field and tectonic stability of the seismic region. However, the existing researches on earthquake geology in the seismic region mainly focused on the deep structure, the seismogenic fault and aftershock sequence of the 1976 Tangshan MS7.8 earthquake, and the time interval of seismic activity (Zeng et al., 1987; Liu et al., 2011; Zhang et al., 2020; Chen et al., 2021; Wang et al., 2021). Scientific issues such as the dynamic adjustment of the in situ stress field after the 3.11 earthquake, the current in situ stress state, and the current tectonic stability of the main active faults in the seismic region have not been studied. The Tangshan seismic region is close to Beijing, and Tangshan is an important part of the Beijing-Tianjin-Hebei urban agglomeration. The study on the stability of the main active faults in Tangshan seismic region after 3.11 earthquake is of great significance to ensure the geological safety of the urban agglomeration.
Tan et al. (2020) carried out the deep-borehole in situ stress measurements and constructed a real-time in situ stress monitoring station in Changli, Hebei, in 2009. The Changli piezomagnetic stress monitoring station is located in the east of the seismic region and began to continuously record monitoring data on 15 December 2011. It completely recorded the dynamic adjustment process of the in situ stress field in the seismic region after the 3.11 earthquake, providing an in situ stress monitoring basis for seismic geology and other related research. In order to reveal the current state of the in situ stress field and to evaluate the tectonic stability of the main active faults of the Tangshan seismic region. We first analyzed the dynamic adjustment of the in situ stress field using in situ stress measurement data before the 3.11earthquake and real-time monitoring data after the 3.11earthquake from the Changli monitoring station. Second, we considered the uncertainty (or error) of the fault attribute parameters and the in situ stress field, and used the FSP v.1.0 software package to analyze the change of the fault stability in the seismic region before and after the 3.11 earthquake, and the possibility of fault slip under the current in-situ stress environment. The results of this study provide scientific support for ensuring the urban geological security of the capital region and provide a reference for exploring the application of real-time in situ stress monitoring in tectonic stability evaluation.
Geologic setting
The Tangshan seismic region is located in the northeastern part of the North China Craton, and is at the intersection of the southeastern edge of the Yanshan Uplift and the North China Plain. This region has undergone multiple stages of tectonic evolution since the Archean (Li, 2005). During the Archean-Early Proterozoic, this region experienced the formation period of the crystalline basement of the North China Platform, and the rock underwent strong metamorphism to form an ancient crystalline basement of granitization and migmatization. The Middle and Late Proterozoic-Paleozoic was a relatively stable platform stage, forming sedimentary rock series dominated by continental facies. Since the Mesozoic, the North China Craton has begun to break up, and a large number of rifted basins and normal faults developed (Cao, 2016). Since the Cenozoic, the North China Craton has generally been in a tensile stress environment. On the basis of the tectonic activity of fault block in the Mesozoic, the Tangshan seismic region experienced differential lifting and lowering activities of fault blocks, and finally, the present tectonic pattern in which depressions and uplifts are spaced apart from each other along the near-NE direction was formed (Long, 2010).
As shown in Figure 1, there are two main groups of NE-trending and NW-trending faults in the seismic region. The NE-trending faults mainly include the Lulong fault (F1), the Yejituo fault (F2), the Cangdong fault (F3), the Tangshan fault belt (F4), the Changli-Ninghe fault (F5), the Xinanzhuang fault (F6); and the NW-trending faults mainly include the Lengkou fault (F7), the Luangxian-Laoting fault (F8), the Baigezhuang fault (F9), and the Jiyunhe fault (F10) (Peng and Meng, 2017; Zhou et al., 2022). The current fault activity in the seismic region is mainly characterized by normal fault and strike-slip movement. The NE-trending faults are mostly cut by the NW-trending faults. Among them, the Yejituo fault, the Changli-Ninghe fault, the Luanxian-Laoting fault and the Jiyunhe fault bounded a rhombic block (Liu et al., 2014; Yang et al., 2016), and the earthquakes in the seismic region were mainly distributed in this rhombic block (Figure 1). There have been 42 earthquakes magnitudes of ≥5.0 in the seismic region since 1,400. Among them, the 1976 Tangshan MS7.8 earthquake was the largest earthquake in North China after the 1,679 Sanhe-Mafang M8.0 earthquake. This earthquake caused more than 240,000 deaths and huge property losses. Aftershocks continued after the earthquake. The largest aftershocks were the Luanxian MS7.1 earthquake on 28 July 1976 and the Ninghe MS6.9 earthquake on 15 November 1976 (Zhong and Shi, 2012; Wang et al., 2016). The earthquake statistics since 2010 showed that there were 1,252 earthquakes in the region. The earthquakes were mainly distributed in the rhombic block and mainly distributed along the faults. Among them, there were 1,227 earthquakes with magnitudes of 1.0–2.9, 16 earthquakes with magnitudes of 3.0–3.9, and eight earthquakes with magnitudes of 4.0–4.9 and one earthquake with magnitude of 5.0–4.9.
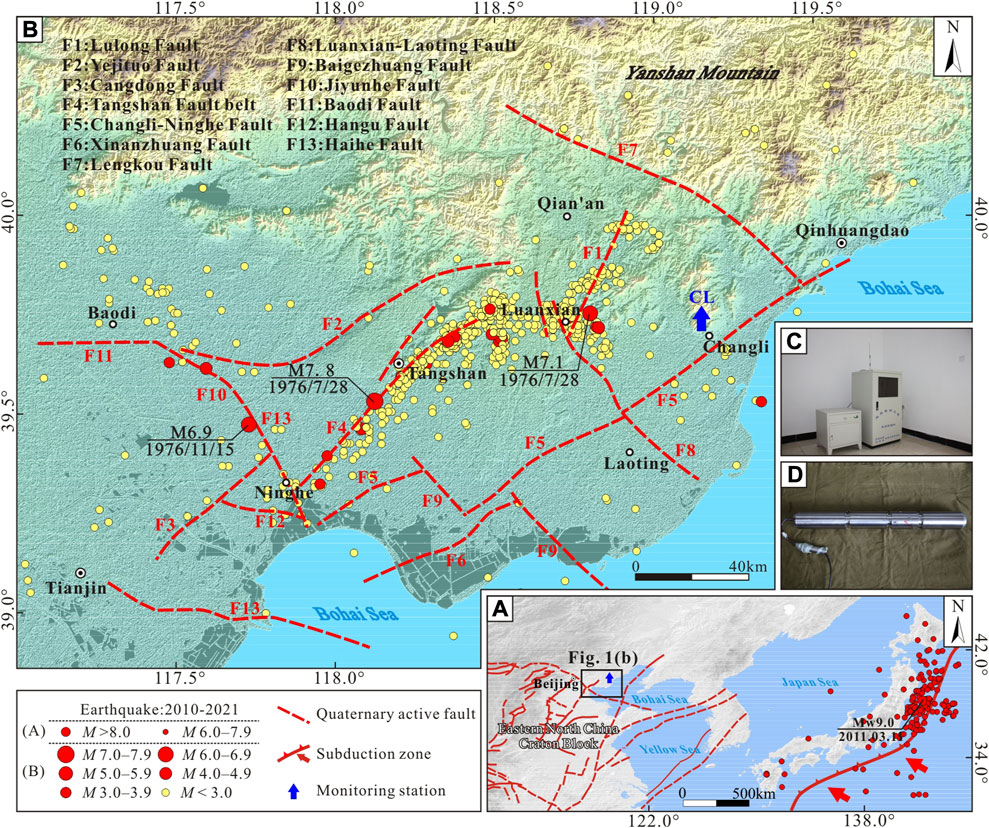
FIGURE 1. Regional structure of Tangshan seismic region and location of Changli piezomagnetic stress monitoring station (A) Regional structure diagram, (B) The distribution of faults in the Tangshan seismic region and the location of Changli station, (C) Ground Equipment for Piezomagnetic stress monitoring system, (D) Downhole Equipment for Piezomagnetic stress monitoring system.
Materials and methods
Principle of piezomagnetic stress monitoring
The core part of the piezomagnetic stress monitoring system at Changli station is a piezomagnetic stress sensor designed based on the principle of magnetostriction. The length and volume of permalloy ferromagnetic materials will change after magnetization, which are called linear magnetostriction and volume magnetostriction, respectively. On the contrary, mechanical deformation will also change the permeability of ferromagnetic materials, which is called piezomagnetic effect (Wu et al., 2016). The relative permeability change and stress have the following relationship.
where μ is the permeability, Δμ is the change in the permeability, β is the saturated intensity of the magnetization, λ is the saturated magnetostriction coefficient, and σ is the stress that acts on the material.
Piezomagnetic stress gauge is mainly composed of a mandrel made of a special permalloy ferromagnetic material (iron-nickel alloy) and a self-inductor coil wound arount it (Tan et al., 2020). The self-inductor coil is externally connected to a constant power supply. When an external force acts on the permalloy ferromagnetic material, the deformation of the mandrel will cause the coil impedance value to change, resulting in a change in the coil voltage value. By monitoring the changes of the coil voltage value in real time, and according to the calibration curve of the indoor confining pressure and voltage, the stress change acting on the measuring element in the monitoring probe can be obtained.
Least-squares solution algorithm for principal stress magnitude and orientation
Taking the due east direction as the X axis and the due north direction as the Y axis, a Cartesian coordinate system XOY is established at the horizontal section of the monitoring depth of the Changli borehole, and the angles between the component probes (P1–P4) are mutually 45°. Assume that the angle between P2 and the X-axis is ω, and the angle between the maximum horizontal principal stress and the X-axis is θ.
We assume that the normal stress changes of the four monitoring directions (P1∼P4) at a certain time are respectively recorded as: Δσ1, Δσ2, Δσ3, Δσ4, and the resulting changes in the plane stress components in the XOY coordinate system are recorded as ∆σxx, ∆σyy, ∆τxy. According to the two-dimensional plane stress tensor transformation formula (Li et al., 2016), We can list the four equalities about Δσ1, Δσ2, Δσ3, and Δσ4 by ∆σxx, ∆σYY, ∆τxy and obtain the least squares solutions of ∆σxx, ∆σyy and ∆τxy. According to the two-dimensional plane stress tensor formula, the plane stress components σxxP ,σyyP ,τxyP of the initial maximum and minimum principal stress in the XOY rectangular coordinate system can be obtained. The three initial value components are superimposed with ∆σxx, ∆σyy and ∆τxy, and then we can obtain the maximum and minimum horizontal principal stress and the maximum horizontal principal stressat orientation at this moment by the two-dimensional plane stress tensor conversion formula. The calculation formulas are as follows.
Fault sliding instability criterion
Fault slip is a mechanical process in which the shear stress on the fault plane gradually accumulated and exceeded the anti-slip resistance under the action of the in situ stress field (Zoback and Gorelick, 2012; Ellsworth, 2013). Numerous studies have shown that this mechanical process follows the Mohr-Coulomb failure criterion (Healy et al., 1968; Raleigh et al., 1976; Zoback, 2007).
where τ is the shear stress of the fault plane, μ is the friction coefficient of the fault plane, σn is the normal stress of the fault plane, and P0 is the pore water pressure. Studies have shown that in low-permeability rocks on the shallow surface of the crust, the pore pressure is roughly equal to the hydrostatic pressure, so in this paper, the pore pressure was assumed to be approximately equal to the hydrostatic pressure (Zoback et al., 2002).
Byerlee (1978) summed up the results of numerous rock mechanics experiments and considered that μ of crustal rocks is 0.6–1.0, except for a few rocks. In situ stress measurements conducted by the researchers proved that μ measured in the laboratory is suitable for the crust (Jamison and Cook, 1980; Norman, 1999; Townend and Zoback, 2000). Generally, the empirical friction coefficient of 0.6 is used as the critical value for judging fault instability (Walsh and Zoback, 2016; Snee and Zoback, 2018).
We used the FSP v.1.0 software package to calculate the fault slip potential of the main faults in the Tangshan seismic region, and used the analysis result to measure the level of fault stress accumulation. The software first randomly samples each key parameter within the error range according to the Monte Carlo simulation method and redetermined the probability distribution characteristics of each expected value. Secondly, the software calculated the ratio and probability distribution of shear stress to effective normal stress on each segmented fault plane according to the Mohr-Coulomb criterion. Finally, by comparing with the critical friction coefficient (probability distribution) of the fault, the fault slip potential can be obtained. It should be noted that the FSP software package does not predict earthquakes. It can be used to evaluate the cumulative conditional probability of slip occurring on known faults, rather than quantify the seismic hazard for a given fault (Walsh et al., 2017).
In situ stress field in the Tangshan seismic region before the 3.11 earthquake
The in situ stress measurement work carried out before the 3.11 earthquake in the Tangshan seismic region was mainly carried out shortly after the Tangshan MS7.8 earthquake in 1976 (Ding and Liang, 1984), which was far away from the 3.11 earthquake. Tan et al. (2020) carried out deep-hole in situ stress measurement in the northern part of Changli County in 2009. This is the only pre-earthquake in situ stress measurement data in the seismic region, which is close to the time of the 3.11 earthquake. After the measurement work, Tan et al. installed piezomagnetic in situ stress monitoring instrument in the borehole and built an in situ stress monitoring station. The Changli piezomagnetic stress monitoring station (CL) (119.15°E, 39.74°N) is located in the large Yanshanian granite body on the north side of the intersection of the Tan-Lu fault zone and the Zhangjiakou-Bohai fault zone. It is one of the most ideally located in situ stress monitoring stations in North China (Figure 1). The monitoring drilling depth is 500.46 m. The lithology of the stratum within the drilling depth range is mainly medium and coarse-grained granite. The in situ stress measurements were collected using the hydraulic fracturing method, which is one of the two major in situ stress estimation methods suggested by the International Society for Rock Mechanics (ISRM) (Zoback and Healy, 1992; Haimson and Cornet, 2003; Feng et al., 2013). We analyzes the characteristics of the in situ stress field in the shallow crustal of the Tangshan seismic region before the 3.11 earthquake based on the measured data of the Changli borehole. The measured results of the Changli borehole are shown in Table 1.
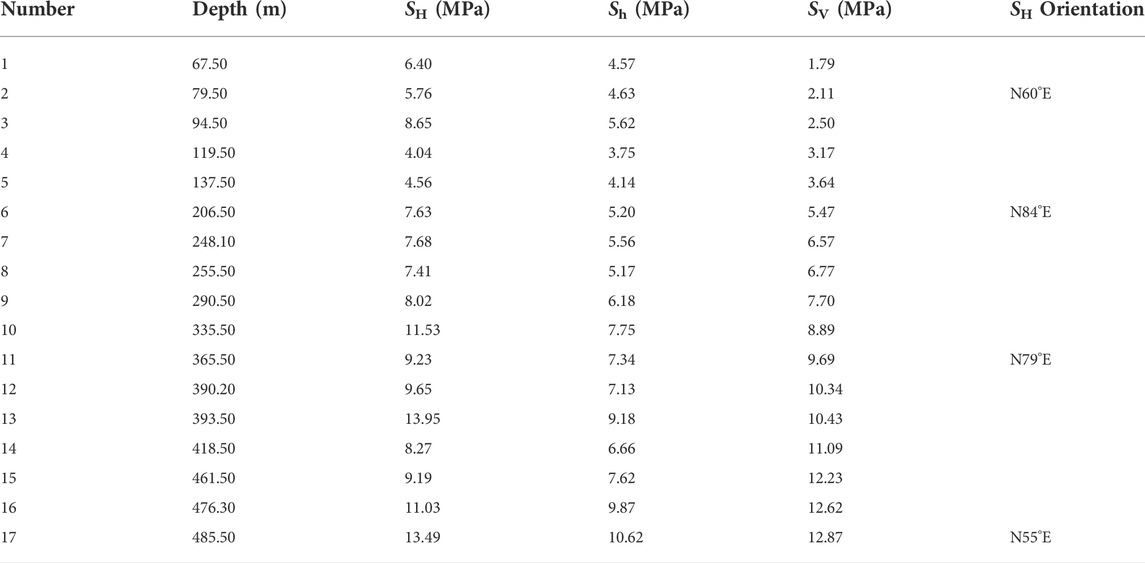
TABLE 1. Measurement results of hydraulic fracturing in situ stress in Changli borehole.
The in situ stress measurement results in the measurement depth range of the Changli borehole showed that the maximum horizontal principal stress (SH) was 4.04–13.49 MPa, and the minimum horizontal principal stress (Sh) was 3.75–10.62 MPa. In the depth of about 0–210 m, the principal stress relationship was SH>Sh>SV, which was a “thrust-type” stress state. In the depth range of nearly 250–335 m, the principal stress relationship was SH>SV>Sh, which was a “strike-slip” stress state, and the principal stress relationship at depths below about 390 m was SV>SH>Sh, which was a “normal breaking” stress state. The SH and Sh gradients were 0.0164 MPa/m and 0.0135 MPa/m, which were slightly lower than the average level in North China (Huang et al., 2013).
The measurement results of the maximum horizontal principal stress orientation (SH orientation) in the Changli borehole showed that the SH orientation within the borehole depth was N 55°–84° E. Li and Wang (2008) used the digital seismic data from 2002 to 2006 in the Tangshan seismic region to analyze the spatial distribution characteristics of small and medium earthquakes. The results all showed that the maximum principal compressive stress direction of the tectonic stress field in the seismic region before the 3.11 earthquake was NEE–EW. Yang et al. (2016) analyzed the focal mechanism solution of the ML≥2.5 earthquakes in the Tangshan seismic region from 2002 to 2015 and found that the direction of the maximum principal stress in the seismic region was the nearly EW. Based on the combined in situ stress measurement results and the focal mechanism analysis results, the dominant orientation of the maximum horizontal principal stress in the shallow crust in the Tangshan seismic region should be the NEE direction (N 79°–84°E).
Dynamic change in the in situ stress field after the 3.11 earthquake
In situ stress monitoring curve
The Changli piezomagnetic stress monitoring station used a new type of four-component piezomagnetic stress monitoring system. The monitoring instrument was placed at a depth of 100.0 m. The monitoring directions of the four probes were N 336° W (P1), N 66° E (P2), N 291° W (P3), and N 21° E (P4). The in situ stress data from 15 December 2011 to 8 September 2019 were showed in Figure 2. The stress curve of each probe recorded the relative change of the normal stress in the monitoring direction, and the fluctuations of the curve reflected the dynamic adjustment of the regional in situ stress field.
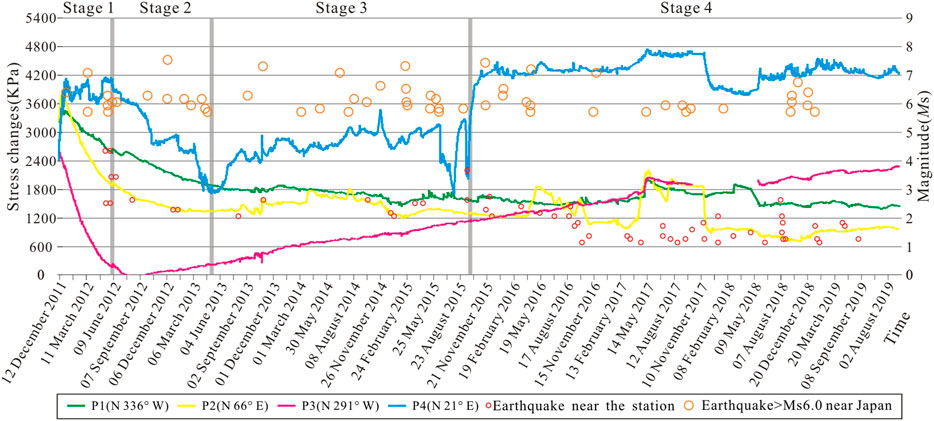
FIGURE 2. Relative changes of in situ stress in Changli piezomagnetic stress monitoring station from December 2011 to September 2019.
The reliability of the in situ stress monitoring data directly affects the analysis of the in situ stress field and fault stability. For Changli monitoring station, assuming that the wall of the borehole is an ideal elastic body, according to the influence of the partial stress tensor on the deformation of the circular hole, the sum of the changes in the monitoring values in the two measurement directions can be equal to conduct self-verification of the monitoring data (Shi et al., 2021), that is, (P1 + P2) = (P3 + P4). However, in reality, crustal rocks have extensive vertical and lateral heterogeneity and are filled with fractures and pore fluids, which makes it difficult to ensure that the cross-section of the borehole is a regular circle. Factors such as changes in the geomagnetic field and the error of the instrument would have an impact on the monitoring results. Therefore, when analyzing piezomagnetic geostress monitoring data, it is difficult to verify the reliability of the monitoring data according to the ideal conditions, and the reliability of the data is usually judged from the trend of the two groups of data (P1 + P2) and (P3 + P4) (Feng et al., 2014; Wu et al., 2016). Figure 3 shows the self-verification results of the monitoring curve for the Changli piezomagnetic stress monitoring station from August to October 2013. The change curves of the two groups of data (P1 + P2) and (P3 + P4) have similar shapes. Although they are not equal, the difference is small. Therefore, the positive stress changes monitored at the Changli monitoring station are relatively reliable.
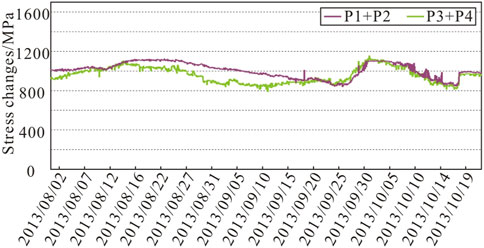
FIGURE 3. Self checking curves of stress monitoring data at Changli piezomagnetic stress monitoring station.
Analysis of in situ stress monitoring results
According to the change trend of the in situ stress monitoring curves, the dynamic adjustment process of in situ stress field after the 3.11 earthquake in the Tangshan seismic region can be divided into four stages: stage 1 (November 2011 to June 2012), stage 2 (June 2012 to May 2013), stage 3 (May 2013 to December 2015), and stage 4 (December 2015 to September 2019).
The initial value of the SH and Sh at the monitoring depth of 100 m at Changli Station was based on the measured data at the depth of 94 m. It is determined that the initial value of SH was 8.65MPa, and the initial value of Sh was 5.62 MPa. The SH orientation was N 79°–84° E. The relative changes of normal stress at the end of the four stages were extracted respectively, and the SH, Sh, and SH orientation of the Tangshan seismic region at each time node were calculated according to Eq. 2. The calculation results were shown in Table 2.
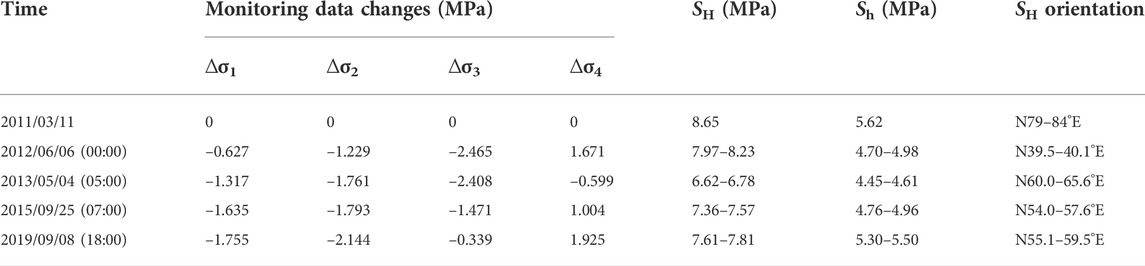
TABLE 2. Dynamic adjustment of in situ stress field in Tangshan seismic region after the Tohoku-Oki 3.11 M9.0 earthquake.
In stage 1 (11 March 2011–6 June 2012), the variation characteristics of the stress curves in each monitoring direction were as follows. The stress values in the P1 (N 336° W) direction and P2 (N 66° E) direction continued to decrease after a short period of rapid growth, the stress value in the P3 (N 291° W) direction decreases rapidly, and the stress value in the P4 (N 21° E) direction increased rapidly and was in a high-value state. The calculated magnitude and orientation of the principal stress at the end of stage 1 revealed that the values of SH were 7.97–8.23°MPa, and the values of Sh were 4.70–4.98 MPa. The values of SH and Sh were both lower than those before the 3.11 earthquake, and the value decreased of the Sh was slightly larger than that of the SH. The SH orientation was deflected from the NEE direction to the NNE direction. The stage 1 was in the early post-earthquake period. The nearly EW-trending extensional effect in North China would inevitably lead to the deflection of the SH orientation in the Tangshan seismic region. At the same time, the coseismic displacement field of the 3.11 earthquake showed that the east-west displacement in North China was significant in the early post-earthquake period, while the north-south displacement was not obvious (Wang et al., 2011; Yang et al., 2011). This situation caused the Sh (SEE) to decreased greater than SH (NNE).
In stage 2 (6 June 2012–4 May 2013), the variation characteristics of the stress curve in each monitoring direction were as follows. After 6 June 2012, the monitoring values in the P1 (N 336° W) direction and P2 (N 66° E) direction continued to decrease. The monitoring value in the P3 (N 291°W) direction changed from a continuous decrease to a slow increase, and that in the P4 (N21°E) direction decreased rapidly. The calculated magnitude and orientation of the principal stress at the end of stage 2 revealed that the values of SH were 6.62–6.78 MPa, which was significantly lower than that during stage 1, the larger decrease in the maximum horizontal principal stress value was mainly due to the stress release caused by the coseismic displacement in the nearly EW direction. The values of Sh were 4.45–4.61 MPa, which was basically stable compared with the stage 1. The SH orientation returned clockwise from NNE to N 60.0°–65.6° E. In the stage 2, the nearly EW-trending tensile effect in the Tangshan seismic region changed from strong to weak, and the regional tectonic environment began to gradually adjust back to the nearly EW-trending compression. The GPS continuous monitoring data near the Zhangjiakou-Bohai fault zone showed that the fault zone deformed greatly from 2011 to 2013 and was different from the previous deformation state. The horizontal deformation field showed that the tectonic activity of the fault zone was dominated by compression during this period (Ji et al., 2016). The deformation characteristics of the Zhangjiakou-Bohai fault zone also indicated that the regional in situ stress field was adjusted after the 3.11 earthquake.
In stage 3 (4 May 2013–25 September 2015), the variation characteristics of the stress curve in each monitoring direction were as follows. The monitoring values in the P1 (N 336° W) direction and P2 (N 66° E) direction fluctuated slightly and remained stable overall, and that in the P3 (N 291° W) direction continued to increase. The monitoring values in the P4 (N 21° E) direction fluctuated within a certain range. The calculated magnitude and orientation of the principal stress at the end of stage 3 revealed that the values of SH were 7.36–7.57 MPa, the values of Sh were 4.76–4.96 MPa. The principal stress value at the end of the stage 3 was slightly higher than that at the end of the stage 2. The SH orientation was N 54.0°–57.6° E. From the stage 3, the stress in the Tangshan seismic region began to accumulate gradually, and the principal stress value increased relatively.
In stage 4 (25 September 2015–8 September 2019), the variation characteristics of the stress curve in each monitoring direction were as follows. The stress values in P1 (N 336° W) direction and P2 (N 66° E) direction were relatively stable. The stress value in P3 (N 291° W) direction was in a state of continuous and slow increase. The stress value in the P4 (N 21° E) direction was generally in a stable state. The calculated magnitude and orientation of the principal stress at the end of stage 4 revealed that the values of SH were 7.61–7.81 MPa, the values of Sh were 4.72–4.92 MPa, and the SH orientation was N 55.1°–59.5° E. The analysis results showed that the activity of the Pacific plate has been relatively stable since December 2015, and the stress accumulation of the in situ stress field in the Tangshan seismic region was still continuing.
In summary, the 3.11 earthquake had a significant impact on the in situ stress field in the Tangshan seismic region. The regional tectonic environment in the seismic region changed from nearly EW-trending compression to nearly EW-trending tension in a short period of time after the earthquake, and the SH orientation was adjusted from NEE to NNE–NE, and remained until June 2012, and then it began to gradually adjust to the state before the 3.11 earthquake.
Analysis of the stability of the active fautls
Simplified model of the main active faults
This paper only discussed the fault slip potential of the main active faults related to the rhombic block in the Tangshan seismic region, including the Lulong fault (F1), the Yejituo fault (F2), the Cangdong fault (F3), and the Tangshan fault belt (F4), Changli-Ninghe fault (F5), the Xinanzhuang fault (F6), the Lengkou fault (F7), the Luanxian-Laoting fault (F8), the Baigezhuang fault (F9) and the Jiyunhe fault (F10). Based on the results of urban active fault explorations conducted in Tianjin City by the Tianjin Earthquake Agency (Zheng et al., 2006; Liu et al., 2013; Yan et al., 2014) and in the Hebei province of China conducted by the Hebei Earthquake Agency (Peng and Meng, 2007), and the research results of other scholars on the fault structure in the Tangshan seismic region (Liu et al., 2011; Zhu et al., 2019; Chen et al., 2020; Tan et al., 2021), we collected the information on the location, length, strike and dip angle of the above 10 main active faults. The simplified model of each active fault according to the strike difference was showed in Figure 4, which contained 44 subsections in total. The fault parameters used in the analysis of fault slip potential were shown in Table 3.
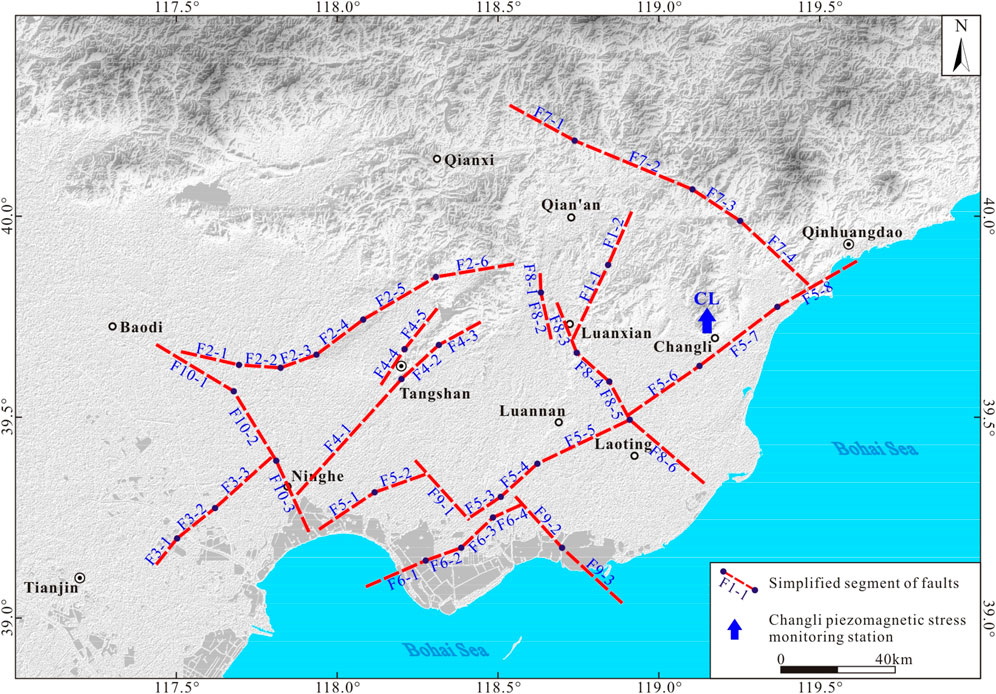
FIGURE 4. Simplified-segmental features of the main active faults in Tangshan seismic region.

TABLE 3. Characteristic parameters of the main active faults in Tangshan seismic region.
The simplified segmentation of faults would cause errors in fault strike. At the same time, due to the understanding of fault strike and dip angle in the referenced materials was slightly different, especially the fault dip angle changes significantly in depth. In order to fully consider the influence of the uncertainty of fault strike and dip angle on the results of fault stability research, we comprehensively analyzed the relevant reference and assigned the strike and dip angle of the 10 faults to the errors of ±5° and ±10° respectively.
Parameters uncertainty
Based on FSP software, we mainly considered the errors of seven parameters: SH value, Sh value, SH orientation, pore water pressure, fault strike, fault dip angle, and critical friction coefficient when analyzing the fault slip potentia in the Tangshan seismic region. As shown in Table 2, the values of SH and Sh, and the SH orientation were uncertainty. As shown in Table 3, the fault strike and dip angle had errors of ±5° and ±10°, respectively. The groundwater level in the seismic region changes dynamically, so there was also uncertainty in the pore water pressure. According to the monitoring results of groundwater level at Changli Station from 2012 to 2019, the groundwater level near the station was 34 ± 4 m.
The critical friction coefficient of each main active fault was also uncertainty. Studies shown that the μ value of the actual crust in the process of stress accumulation may be lower than 0.6. The μ values of the San Andreas fault system were 0.18–0.26 (Hickman and Zoback, 2004). The ratios of shear stress to normal stress on the measured fracture surfaces of several research sites given by Townend and Zoback (2000) showed that about 10–20% of the data can approach and exceed the value limited by μ = 0.6, and most of them were lower than the value limited by μ = 0.6. Zoback (2007) pointed out that the criterion for the buckling slip of reverse fault may be that the maximum effective principal stress was roughly equal to 2.2 times the vertical effective principal stress (μ takes about 0.4), and the normal fault may be that the minimum effective principal stress was roughly equal to 0.6 times the vertical effective principal stress (μ takes about 0.2). Feng et al. (2017) studied the fault activity of the Tanlu fault zone and its adjacent areas based on in situ stress measurement data, and found that the calculation results of the apparent friction coefficient of faults in the Changli area were generally low (0.21–0.45). Considering the existing research results and the fault characteristics of the Tangshan seismic region, the critical friction coefficient range was 0.4 ± 0.2 (0.2–0.6) when analyzing the fault slip potential of the seismic region.
Taking subsection F1-1 of the Lulong fault as an example, the resampling of the probabilistic distribution of the model parameters for subsection F1-1 was shown in Figure 5.
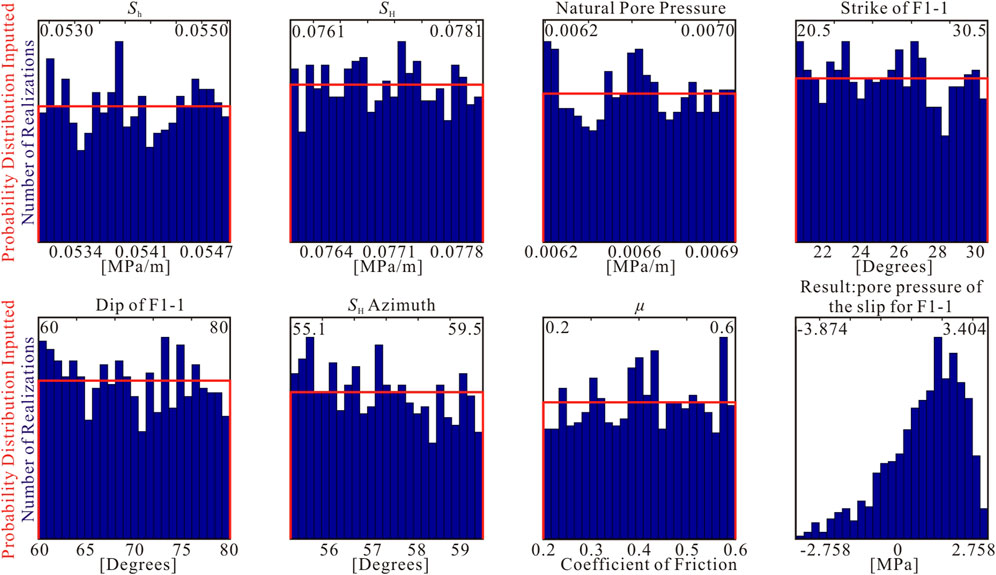
FIGURE 5. Probability distributions of the in situ stress field and the characteristic parameters of the mapped fault F1-1.
Results and analysis
The calculation results of the FSP of the main active faults in the seismic region were shown in Table 4. Based on the calculation results and combined with the existing earthquake distribution in the seismic region, we discussed the fault activity at each stage.
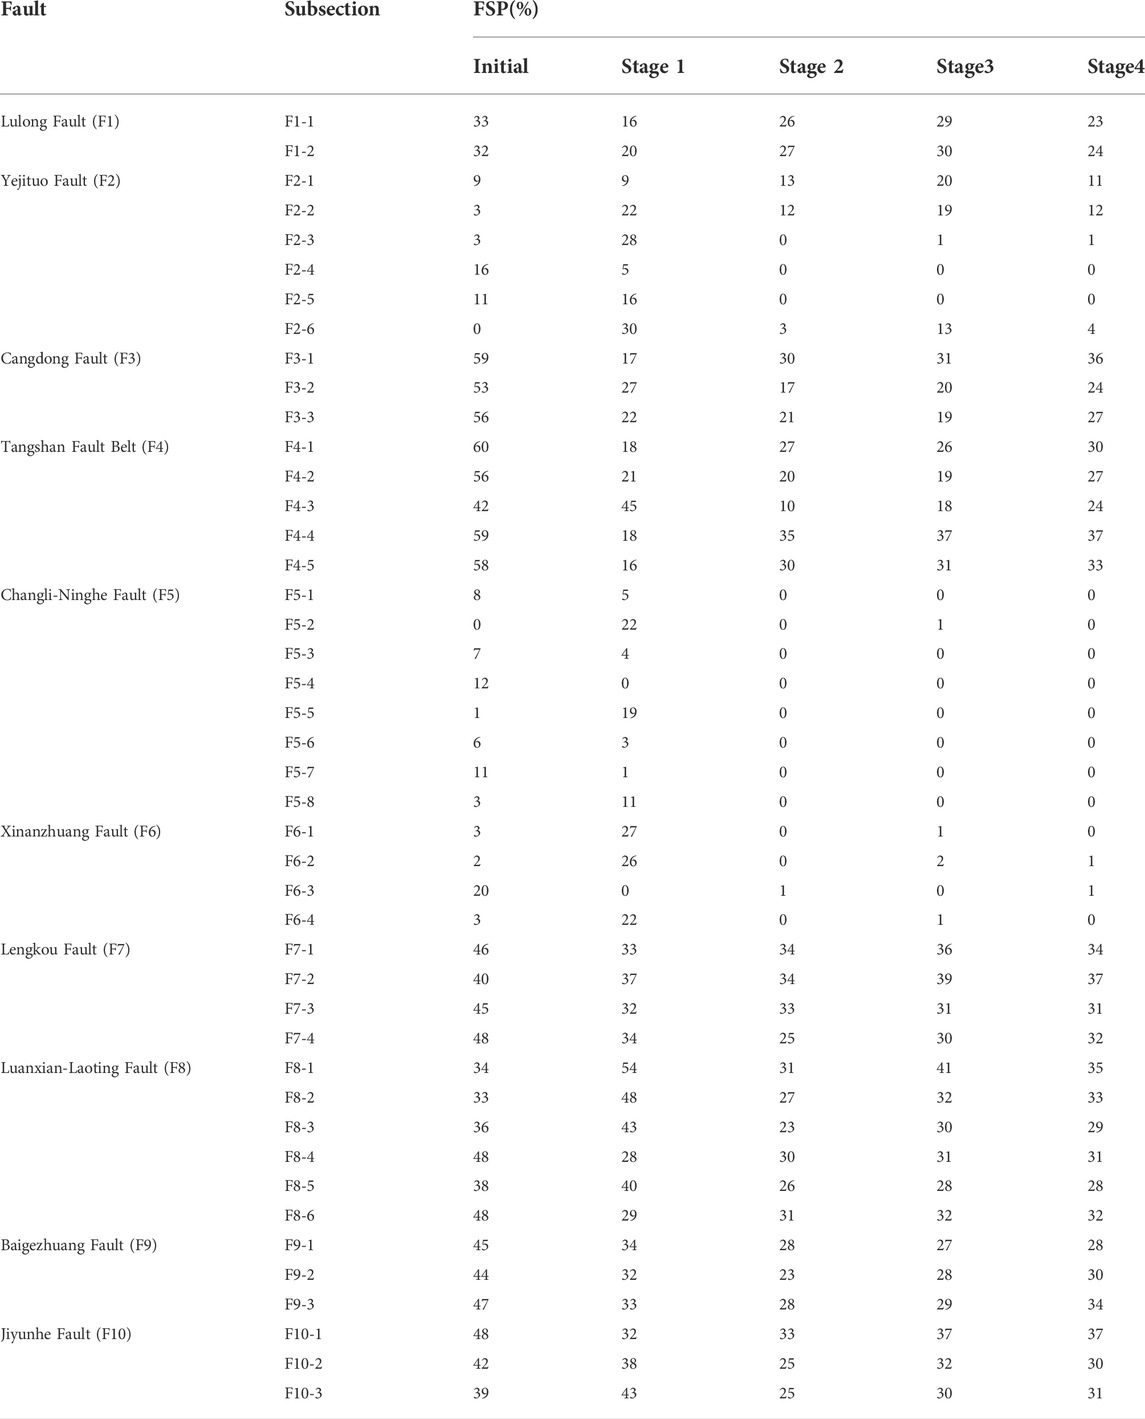
TABLE 4. Statistics of the calculation results of the fault slip potential.
Fault stability before the 3.11 earthquake
Before the 3.11 earthquake, the calculation results of the FSP of the main faults in the seismic region were shown in Table 4; Figure 6. The calculation results revealed that before the 3.11 earthquake, under the action of the NEE in situ stress field, the stress accumulation level of the Tangshan fault belt and the Cangdong fault was relatively the highest, the FSP values were 42–60%, and the probability of fault slip was relatively the largest, and followed by the Lulong fault, the Lengkou fault, the Luanxian-Laoting fault, the Baigezhuang fault and the Jiyunhe fault with FSP values of 32–48%. The Yejituo fault, the Changli-Ninghe fault, and the Xinanzhuang fault had the lowest stress accumulation level, with the lowest FSP values of 0–20%, the probability of fault slip was relatively the smallest.
FIGURE 6. The fault slip potential on the main faults in Tangshan seismic region before the 3.11 Japan earthquake.
In summary, before the 3.11 earthquake, the stress accumulation level of NW-trending faults in the seismic region was generally higher than that of NE-trending faults. The probability of fault slip of the Tangshan fault belt was the highest. The earthquake statistics in the Tangshan seismic region from January 2010 to March 2011 showed that the earthquakes were mainly small earthquakes (M<3.0). The earthquakes were densely distributed in the rhombic blocks of the Tangshan seismic region, and were mainly distributed in the areas with high FSP values. The seismically active areas were mainly concentrated along the Tangshan fault zone and its intersection with the Lulong fault, the Luanxian-Laoting fault, and the Jiyunhe fault.
Fault stability in the stage 1
In the stage 1, the calculation results of the FSP of the main faults in the seismic region were shown in Table 4; Figure 7. The calculation results revealed that in the stage 1, the stress accumulation in the seismic region was released due to the co-seismic displacement caused by the 3.11 earthquake and the adjustment of the tectonic environment, and the accumulation level of the main faults was significantly reduced, and the stress accumulation levels of each fault subsection were obviously different. The F4-3 subsection of the Tangshan fault belt, the F8-1, F8-2, F8-3, and F8-5 subsections of the Luanxian-Laoting fault, the F10–2 and F10-3 subsections of the Jiyunhe fault had the highest stress accumulation level, the FSP values were 40–54%, and the probability of fault slip was relatively the largest. This was followed by the F1-2 subsection of the Lulong fault, the F2-2, F2-3, and F2-6 subsections of the Yejituo fault, the F3-2 and F3-3 subsections of the Cangdong fault, the F4-2 subsection of the Tangshan fault belt, the F5-2 subsection of the Changli-Ninghe fault, and the Xinanzhuang fault, the Lengkou fault, the remaining subsections of the Luanxian-Laoting fault, the Baigezhuang fault, and the F10-1 subsection of the Jiyunhe fault, the FSP values were 20–37%. The rest of the Lulong fault, the rest of the Yejituo fault, the F3-1 subsection of the Cangdong fault, the rest of the Tangshan fault belt, and the rest of the Changli-Ninghe fault had the lowest stress accumulation level, with FSP values of 0–20%, and the probability of falut slip was relatively the smallest.
FIGURE 7. The fault slip potential on the main faults in Tangshan seismic region in stage 1.
In summary. In the stage 1, the stress accumulation level of main faults in the Tangshan seismic region was lower than that before the earthquake, and the stress accumulation level of NW-trending faults was higher than that of NE-trending faults. The F4-3 subsection of the Tangshan fault belt, the middle-northern section of the Luanxian-Laoting fault and the southwestern section of the Jiyunhe fault had the highest probability of fault slip. The earthquake statistics in the Tangshan seismic region from June 2011 to June 2012 showed that the earthquakes were mainly small earthquakes (M<3.0), and were mainly distributed in the areas with high FSP values. The seismically active areas were mainly concentrated along the Tangshan fault belt and its intersection with the Lulong fault and the Luanxian-Laoting fault.
Fault stability in the stage 2
In the stage 2, the calculation results of the FSP of the main faults in the seismic region were shown in Table 4; Figure 8. The calculation results revealed that in the stage 2, the stress accumulation in the seismic region was further released along with the adjustment of the regional in situ stress field after the 3.11 earthquake, and the main fault stress accumulation level was lower than that in the stage 1. The stress accumulation level of NW-trending faults was relatively higher than that of NE-trending faults. The stress accumulation level of the F4-4 subsection of the Tangshan fault belt, and the F7-1 and F7-2 subsections of the Lengkou fault were relatively the highest, the FSP values were 34–35%, and the probability of falut slip was relatively the highest. This was follow by the Lulong fault, the Cangdong fault, the rest of the Tangshan fault belt, the rest of the Lengkou fault, the Luanxian-Laoting fault, the Baigezhuang fault and the Jiyunhe fault, with FSP values of 10–30%. The Yejituo fault, the Changli-Ninghe fault and the Xinanzhuang fault had the lowest stress accumulation levels, the FSP values were 0–12%, and the probability of fault slip was relatively the smallest.
FIGURE 8. The fault slip potential on the main faults in Tangshan seismic region in stage 2.
In summary, in the stage 2, the fault stress accumulation level in the seismic region was lower than that in the stage 1, and the stress accumulation level of NW-trending faults was higher than that of NE-trending faults. The F4-4 subsection of the Tangshan fault belt, and the F7-1 and F7-2 subsections of the Lengkou fault had the highest probability of fault slip. The earthquake statistics in the Tangshan seismic region from June 2012 to June 2013 showed that the earthquakes were mainly small earthquakes (M<3.0). Earthquakes were mainly distributed inside the rhombic block in the seismic region, and were mainly distributed in the areas with high FSP values. The seismically active areas were mainly concentrated in the intersection of the Tangshan fault belt, the Lulong fault, and the Luanxian-Laoting fault in the rhombic block. Some earthquakes were also distributed in the intersection of the Tangshan fault belt and the Jiyunhe fault, and the intersection of the Jiyunhe fault and the Yejituo fault.
Fault stability in the stage 3
In the stage 3, the calculation results of the FSP of the main faults in the seismic region were shown in Table 4; Figure 9. The calculation results revealed that in the stage 3, the stress accumulation level in the Tangshan seismic region was slightly higher than that in the stage 2. Under the action of NE-NEE trending in situ stress field, the stress accumulation level of NW-trending faults was relatively higher than that of NE-trending faults. Among them, the F4-4 subsection of the Tangshan fault belt, the F7-1 and F7-2 subsections of the Lengkou fault, the F8-1 subsection of the Luanxian-Laoting fault, and the F10-1 subsection of the Jiyunhe fault had the highest stress accumulation level, the FSP values were 36–41%, and the probability of fault slip was relatively the highest, and followed by the Lulong fault, the F2-1 and F2-2 subsections of the Yejituo fault, the Cangdong fault, the rest of the Tangshan fault belt, the rest of the Lengkou fault, the rest of the Luanxian-Laoting fault, the Baigezhuang fault and the rest of the Jiyunhe fault, FSP values were 18–35%. The rest of the Yejituo fault, the Changli-Ninghe fault and the Xinanzhuang fault had the lowest stress accumulation levels, the FSP values were 0–13%, and the probability of fault slip was relatively the smallest.

FIGURE 9. The fault slip potential on the main faults in Tangshan seismic region in stage 3.
In summary, in the stage 3, the stress accumulation level of main faults in the Tangshan seismic region continued to increase, and the stress accumulation level of NW-trending faults was higher than that of NE-trending faults. the F4-4 subsection of the Tangshan fault belt, the F7-1 and F7-2 subsections of the Lengkou fault, the F8-1 subsection of the Luanxian-Laoting fault had the highest probability of fault slip. The earthquake statistics in the Tangshan seismic region from September 2014 to September 2015 showed that the earthquakes were mainly small earthquakes (M<3.0). The earthquakes were mainly distributed in the rhombic block in the seismic region, and were mainly distributed in the areas with high FSP values. The seismically active areas were mainly concentrated in the intersection of the Tangshan fault belt and the Lulong fault, the Luanxian-Laoting fault and the Jiyunhe fault in the rhmobic block.
Fault stability in the stage 4
In the stage 4, the calculation results of the FSP of the main faults in the seismic region were shown in Table 4; Figure 10. The calculation results revealed that in the stage 4, the stress accumulation level in the Tangshan seismic region was slightly higher than that in the stage 3. Under the action of NE-NEE trending in situ stress field, the stress accumulation level of NW-trending faults was relatively higher than that of NE-trending faults. Among them, the F4-4 subsection of the Tangshan fault belt, the F7-2 subsection of the Lengkou Fault, the F10-1 subsection of the Jiyunhe fault had the highest stress accumulation level, the FSP values were 37%, and the probability of fault slip was relatively the highest, and followed by the Lulong fault, the Cangdong fault, the rest of the Tangshan fault belt, the rest of the Lengkou fault, the Luanxian-Laoting fault, the Baigezhuang fault and the rest of the Jiyunhe fault, the FSP values were 23–37%. The Yejituo fault, the Changli-Ninghe fault and the Xinanzhuang fault had the lowest stress accumulation levels, the FSP values were 0–12%, and the probability of fault slip was relatively the smallest.
FIGURE 10. The fault slip potential on the main faults in Tangshan seismic region in stage 4.
In summary, in the stage 4, the stress accumulation level of main faults in the Tangshan seismic region continued to increase, and the stress accumulation level of NW-trending faults was higher than that of NE-trending faults. The F4-4 subsection of the Tangshan fault belt, the F7-2 subsection of the Lengkou fault, and the F10-1 subsection of the Jiyunhe fault had the highest probability of fault slip. The earthquake statistics in the Tangshan seismic region from September 2018 to August 2021 showed that the earthquakes were mainly small earthquakes (M<3.0). The earthquakes were mainly distributed in the rhombic block in the seismic region, and were mainly distributed in the areas with high FSP values. The seismically active areas were mainly concentrated in the intersection area of the Tangshan fault belt, the Lulong fault, and the Luanxian-Laoting fault, the intersection area of the Tangshan fault belt and the Jiyunhe fault, and the intersection area of the Jiyunhe fault and the Yejituo fault.
Variation of FSP value of major seismogenic faults with time
The areas with the most intensive earthquake distribution in the Tangshan seismic region were along the Tangshan fault belt and the surrounding areas of Luanxian County, and the corresponding main fault subsections were the F1-1 subsection of the Lulong fault, each subsection of the Tangshan fault belt, and the F8-1, F8-2, and F8-3 subsections of the Luanxian-Laoting fault. We extracted the magnitude and orientation of principal stress at each time node from 7 December 2011 to 10 September 2019 at a time interval of 14 days. Then we calculated the FSP values of each fault subsection above to analyze the change of FSP with time, and tried to analyze the corresponding relationship between the calculation results and the earthquakes (MS>1) distributed near the faults.
Due to the lack of focal mechanism data, we can only make a rough judgment on the seismogenic faults of each earthquake based on the positional relationship between the epicenter and the fault. Earthquakes distributed in the northern section of the Tangshan fault belt (F4-2, F4-3, F4-4, F4-5) and the surrounding areas of Luanxian County (F1-1, F8-1, F8-2, F8-3) were difficult to distinguish their respective seismogenic faults according to their epicenters, so the two groups of faults were combined and analyzed separately (Figure 11).
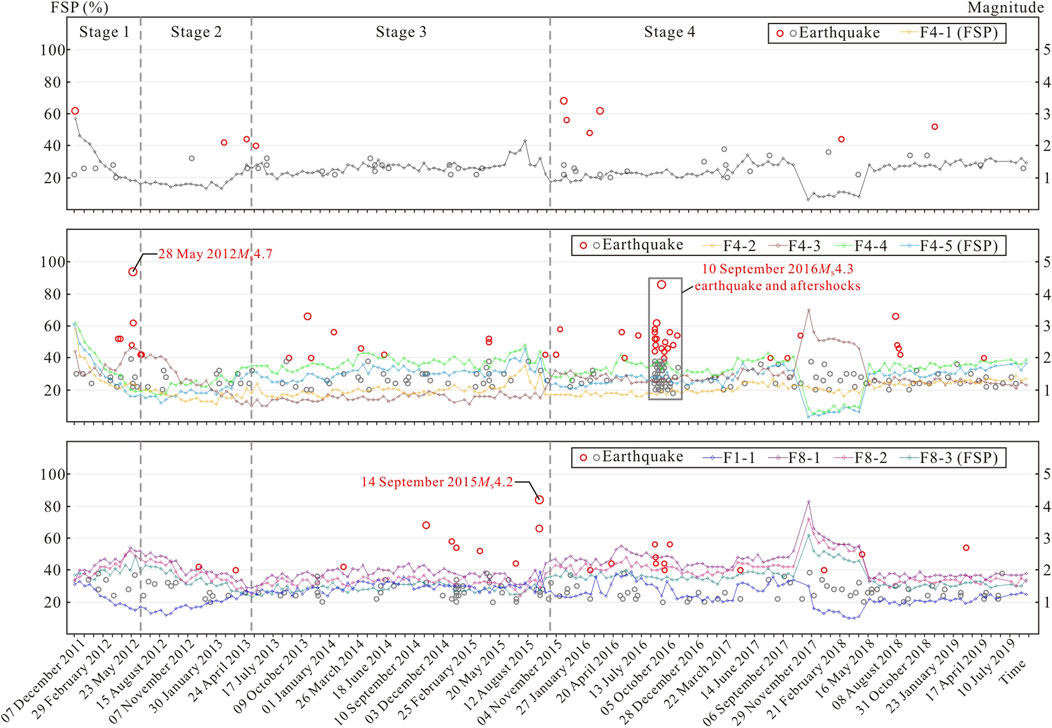
FIGURE 11. Variation of FSP value of major seismogenic faults with time.
The change of FSP value of each fault subsection with time shown that in the stage 1, affected by the fault strike, the FSP value of the NW-trending fault subsections increased while the NE-trending fault subsections generally decreased. In the stage 2, the stress accumulation in the seismic region was further released, and the FSP value of each fault subsection generally decreased. In the stage 3 and stage 4, the stress accumulation level of the seismic region gradually increased, and the FSP value of each fault subsection maintained a trend of continuous increased. The earthquake distribution showed that the earthquakes were relatively dense in the stage 3 and stage 4, while in the stage 2, the stress accumulation level in the seismic region was relatively low, and the number of earthquakes was relatively small. The earthquakes were relatively dense in the time period when the FSP value was relatively high and the stress release stage when the FSP value changed from high to low.
We noticed that the distribution of some earthquakes did not conform to the above laws. The main reason was the complexity of the change of the in situ stress field before the earthquake. Previous studies have found that due to the dual effects of the regional stress field and the local stress field, the abnormal changes of the in situ stress monitoring curve before the earthquake were relatively complex. Common pre-earthquake anomalies were that the monitoring value first increased and then decreased within a certain period of time, or first decreased and then increased, or the monitoring value increased rapidly within a day (Huang et al., 2009; Tan et al., 2019). The in situ stress monitoring data at Changli station also conformed to this law. When the fault occurrence was determined, the FSP value was affected by the in situ stress monitoring data. Therefore, earthquakes were not always distributed in time periods with high FSP values. However, in general, the FSP value was relatively high in the time period when earthquakes occur intensively.
Based on the in situ stress monitoring data at Changli Station, we used FSP v.1.0 software package to analyze the dynamic changes of the fault activity in the Tangshan seismic region after the 3.11 earthquake (March 2011-August 2019), and compared with the seismic data. The analysis results revealed that before the 3.11 earthquake, the stress accumulation level of the main faults in the seismic region was high, the FSP values of the main faults were 30–60%. After the 3.11 earthquake, under the influence of the stress release caused by the nearly-EW tensile effect after the earthquake, the stress accumulation level of the main faults in the Tangshan seismic region continued to decrease, and it remained until May 2013, the FSP values of the main faults were 10–35%. Then, the stress accumulation level of the main faults in the Tangshan seismic region began to gradually increase, but as of September 2019, the FSP values of the main faults were mainly concentrated at 23–37%, and was still lower than the pre-earthquake level. The comprehensive analysis of the FSP results and earthquake distribution showed that the stress accumulation level of NW-trending faults in the Tangshan seismic region was higher than that of NE-trending faults. The fault activity in the north-central part of the seismic region was the strongest, followed by the south and west, and the fault activity in the east was the weakest. There were mainly three areas with strong fault activity in the Tangshan seismic region, namely, the intersection of the Tangshan fault belt and the Lulong fault, the Luanxian-Laoting fault, the intersection of the Tangshan fault belt and the Jiyunhe fault, and the intersection of the Jiyunhe fault and the Yejituo fault.
We also noticed that the stress accumulation levels of the Cangdong fault and the Lengkou fault were higher, but the earthquakes distribution around the fault were less. The Lengkou fault may be affected by the mechanical properties of Yanshan’s large-area rigid basement, such as high strength and small deformation, and belonged to a high-strength fracture. Geophysical surveys showed that the Cangdong fault extended at a shallow depth underground, and turned into a near-horizontal extension at a depth of about 10 km (Shao et al., 2020). The structural characteristic of the fault was an important reason for the few earthquakes along the fault.
Discussion
We analyzed the dynamic adjustment of the in situ stress field and fault stability in the Tangshan seismic region after the 3.11 earthquake based on the in situ stress monitoring data. The FSP analysis result showed that the fault stress accumulation level in the seismic region in the stage 2 was lower than that in the stage 1, it indicates that by June 2013, the nearly EW-trending extension in the seismic region may still exist. The FSP analysis results of the stage 3 and stage 4 showed that the stress accumulation level of faults in the seismic region gradually increased, indicating that the tectonic environment of the seismic region was dominated by the nearly EW-trending compression. The GPS observations near the Tangshan seismic region also reached similar conclusions. Wang et al. (2013) extrapolated that the 3.11 earthquake may have stretched the Tancheng-Yingkou segment of the Tan-Lu Fault zone for decades based on a post-earthquake creep model and GPS observation data for 1 year after the earthquake. Hao et al. (2020) used observation data from continuous and mobile GPS stations from 1999 to 2017 to calculate the far-field coseismic and post-earthquake deformation displacement fields, and their results showed that the area affected by far-field coseismic deformation was obviously smaller than that affected by post-earthquake deformation. These areas mainly included the southeastern part of Northeast China and the Shandong Peninsula, and the relaxation time after the 3.11 earthquake was 1–11 years Zhu (2020) analyzed the crustal strain in the Bohai Rim region before and after the 3.11 earthquake based on GPS observation data and found that the 3.11 earthquake had a significant impact on the crustal deformation in the Bohai Rim region within 3 years after the earthquake. This region began to recover to the pre-earthquake state after 2014. The research on the focal mechanism in the Tangshan seismic region mainly focused on the interpretation of the aftershock sequence of the 1976 Tangshan earthquake and the seismogenic characteristics of moderate and strong earthquakes (Li and Wang, 2008; Li et al., 2021). However, there were few research results on the time-varying characteristics of the focal mechanism in the seismic region. Yang et al. (2016) used 255 focal mechanism solutions of earthquakes with ML≥2.5 in Tangshan area from January 2002 to November 2015 to segment the seismogenic faults of the Tangshan earthquake sequence, the result showed that the directions of the maximum principal compressive stress in each section were nearly the EW orientation. Fan et al. (2019) studied the temporal and spatial variation characteristics of the tectonic stress field in the capital area based on the focal mechanism solution of small and medium earthquakes from January 2009 to November 2017. The results show that the direction of the maximum principal compressive stress in the strong earthquake area in Tangshan is the NEE orientation. In summary, the existing research results of the focal mechanism solutions in the seismic region cannot indicate whether the tectonic stress field in the strong earthquake area changed before and after the 3.11 earthquake, and it was in poor agreement with the analysis results of the in situ stress monitoring data, this may be caused by the difference between the shallow and deep in situ stress fields of the crust.
Limited by the placement depth of the monitoring instrument, the Changli Station can only obtain monitoring data at a depth of 100.0 m, which is far less than the buried depth of the faults in the Tangshan seismic region. Although the in situ stress data at the buried depth of the faults cannot be obtained, we assumed that the fault plane extends to the monitoring depth and combined the monitoring data and the Mohr-Coulomb failure criterion to analyze the faults activity. The analysis results still play a role in judging the activity of the deep fault. This has been proven feasible in previous studies (Wang et al., 2012; Feng et al., 2014; Fan et al., 2021). The analysis results of fault activity showed that the fault activity was the strongest in the central-northern part of the seismic region, and the earthquakes were mainly distributed in front of the Yanshan Mountain. The reason may be that under the influence of the large-area rigid basement in Yanshan, the Tangshan seismic region was prone to the concentration of stress and energy. while the activities of the Lulong fault, the Tangshan fault belt and the Luanxian-Laoting fault were blocked in front of Yanshan Mountain, the energy accumulated on the fault plane cannot be transmitted and dissipated normally, thus causing a large number of earthquakes.
There are some issues that still remain in this paper. We did not consider the difference in the gravitational field in the Tangshan seismic region when we analyzed the in situ stress field and fault stability. Due to the lack of survey data of active faults in the seismic region, the dip angle of each fault was selected as a fixed value without showing the difference of each fault subsection. It can be seen from Figure 3 that many strong earthquakes greater than magnitude six occurred near Japan after the 3.11 earthquake. However, by analyzing the monitoring data, we found that the monitoring data did not respond well to these strong earthquakes. The monitoring instrument did not monitor the changes in situ stress before and after these strong earthquakes, so we could not analyze the impact of the strong earthquakes near Japan after the 3.11 earthquake on the in situ stress field and faults stability in the Tangshan seismic region.
The ultimate purpose of in situ stress monitoring is to predict earthquakes. There are differences between the regional stress field and the local stress field affected by the factors like the internal structural plane, lithology, underground fluid, topography and other factors of the block. At the same time, it is affected by the factors like sensitivity of monitoring instruments, monitoring depth, groundwater, temperature, geomagnetic field, resulting in errors in monitoring data. Moreover, the current monitoring instruments are deployed at a shallow depth, generally within 100 m, it is difficult to obtain the stress changes in the deep crust. Therefore, although there are successful cases of earthquake prediction through in situ stress monitoring (Huang et al., 2009), the existing in situ stress monitoring research cannot meet the requirements of earthquake prediction. Earthquake prediction requires the comprehensive use of multiple methods, and the monitoring and analysis of in-situ stress is one of the methods that can most directly reflect the dynamic characteristics of fault stability. In this paper, the analysis of fault stability combined with in situ stress monitoring data is an exploration of earthquake prediction. In a follow-up study, it is necessary to increase the work in the areas like the research and development of instruments, theoretical research of in situ stress field, and numerical simulation of in situ stress field.
Conclusion
Based on the in situ stress monitoring data from Changli Station, in this study, the dynamic adjustment of the in situ stress field in the Tangshan seismic region after the 3.11 earthquake was investigated, and the stability of the main faults in the seismic region was assessed. The main conclusions of this study are as follows.
(1) After the 3.11 earthquake in Japan, the in situ stress field in the seismic region changed from nearly EW extrusion to nearly EW extension, the SH orientation was adjusted from the NEE direction to the NNE–NE direction. This state was maintained until June 2012, after which it began to gradually adjust back to the pre-earthquake state, The SH orientation was also gradually adjusted to the NEE direction.
(2) Before the 3.11 earthquake, the stress accumulation level of the main faults in the seismic region was relatively high, and the FSP values were mainly distributed in 30–60%. After the 3.11 earthquake, under the influence of the stress release caused by the nearly EW-trending tensile effect after the earthquake, the stress accumulation level of the main faults in the seismic region continued to decrease, and it remained until May 2013. Subsequently, the stress accumulation level of major faults in the seismic region began to gradually increase.
(3) The stress accumulation level of NW-trending faults in the Tangshan seismic region was generally higher than that of NE-trending faults. The fault activity in the central and northern parts of the seismic region was the strongest, followed by the southern part and western part, and the fault activity in the eastern part was the weakest. There were mainly three areas with strong fault activity in the seismic region. Namely, the intersection area of the Tangshan fault belt and the Lulong fault and the Luanxian-Laoting fault, the intersection area of the Tangshan fault belt and the Jiyunhe fault, and the intersection area of the Jiyunhe fault and the Yejituo fault.
Data availability statement
The original contributions presented in the study are included in the article/supplementary material further inquiries can be directed to the corresponding author.
Author contributions
YF and PZ analyzed, writing, and dealing with data; CF provided opinions on paper writing; JM participated in calculations; BQ and JW participated in the field survey; JM and CT modified the formats. All authors have read and agreed to the published version of the manuscript.
Funding
This research was funded by the China Geological Survey, grant numbers: DD20190317 and DD20221738. The authors would like to give sincere thanks to the funding agencies that supported this research.
Acknowledgments
We thank the reviewers for their comments and the editorial department for their strong support. We also thank the Stanford Center for Induced and Triggered Seismicity of Stanford University for the FSP v.1.0 software package, which is a freely available tool that allows users to estimate the changes in the fault slip potential in a given area.
Conflict of interest
Author JW was employed by China United Engineering Corporation Limited.
The remaining authors declare that the research was conducted in the absence of any commercial or financial relationships that could be construed as a potential conflict of interest.
Publisher’s note
All claims expressed in this article are solely those of the authors and do not necessarily represent those of their affiliated organizations, or those of the publisher, the editors and the reviewers. Any product that may be evaluated in this article, or claim that may be made by its manufacturer, is not guaranteed or endorsed by the publisher.
References
Byerlee, J. (1978). “Friction of rocks,” in Rock friction and earthquake prediction. Editors J. D. Byerlee, and M. Wyss (Basel: Birkhäuser), 615–626.
Cao, R. N. (2016). Framework and evolution of cambrian sedimentary sequence in tangshan area and ajacent region. Master’s thesis (Beijing: China University of Geosciences).
Chen, W. B., Song, Y. S., and Li, X. J. (2020). Discussion on the “luanxian-Laoting fault”. Prog. Earthq. Sci. 50, 31–39. doi:10.3969/j.issn.2096-7780.2020.07.006
Chen, X. Z., Li, Y. E., and Chen, L. J. (2021). Anomalies of the b value prior to the MS7.8 tangshan earthquake of 1976. Chin. J. Geophys. 64, 3612–3618. doi:10.6038/cjg2021O0476
Ding, J. M., and Liang, G. P. (1984). On stress field in epicentral areas of 1976 tangshan earthquake and 1679 sanhe-pinggu earthquake. Acta Seismol. Sin. 6, 195–202.
Ellsworth, W. L. (2013). Injection-Induced earthquakes. Science 341, 1225942. doi:10.1126/science.1225942
Fan, W. J., Cui, X. F., Hu, X. P., and Chen, J. W. (2019). Focal mechanism solutions and spatio-temporal variations of the present tectonic stress field in capital circle region. Acta Seismol. Sin. 41, 33–45.
Fan, Y. L., Zhang, P., Gao, Y., Tan, C. X., Qi, B. S., Feng, C. J., et al. (2021). Study of in-situ stress state and tectonic stability of liyang seismic area in the yangtze river delta region. Prog. Geophys. 36, 1842–1852. doi:10.6038/pg2021EE0368
Feng, C. J., Chen, Q. C., Tan, C. X., Wu, M. L., Qin, X. H., and Meng, W. (2013). Analysis on current in-situ stress state in northern segment of Longmenshan fault belt. Prog. Geophys. 28, 1109–1121.
Feng, C. J., Qi, B. S., Wang, X. S., Zhang, P., Sun, M. Q., Meng, J., et al. (2019). Study of fault activity risk in typical strong seismic regions in northern China by in-situ stress measurements and the influence on the xiong’an new area. Earth Sci. Front. 26, 170–190. doi:10.13745/j.esf.sf.2019.4.17
Feng, C. J., Zhang, P., Meng, J., Qi, B. S., Qin, X. H., Niu, L. L., et al. (2017). In situ stress measurement at deep boreholes along the Tanlu fault zone and its seismological and geological significance. Prog. Geophys. (in Chinese) 32, 946–967. doi:10.6038/pg20170302
Feng, C. J., Zhang, P., Sun, W. F., and Tan, C. X. (2014). The application of in situ stress measuring and real-time monitoring results to analyzing The fault activity hazard at ming Tombs borehole in changping district, beijing. Acta Geosci. Sin. 35, 345–354. doi:10.3975/cagsb.2014.03.10
Haimson, B., and Cornet, F. (2003). ISRM suggested methods for rock stress estimation—Part 3: Hydraulic fracturing (HF) and/or hydraulic testing of pre-existing fractures (HTPF). Int. J. Rock Mech. Min. Sci. 40, 1011–1020. doi:10.1016/j.ijrmms.2003.08.002
Hao, M., and Zhuang, W. Q. (2020). The impact of the great 2011 tohoku-oki earthquake on crustal deformation in eastern China. J. Geod. Geodyn. 40, 555–564. doi:10.14075/j.jgg.2020.06.002
Healy, J. H., Rubey, W. W., Griggs, D. T., and Raleigh, C. B. (1968). The denver earthquakes. Science 161, 1301–1310. doi:10.1126/science.161.3848.1301
Hickman, S., and Zoback, M. D. (2004). Stress orientations and magnitudes in the SAFOD pilot hole. Geophys. Res. Lett. 31, L15S12. doi:10.1029/2004GL020043
Huang, L. Y., Yang, S. X., Cui, X. F., Chen, Q. C., and Yao, R. (2013). Analysis of characteristics of measured stress and stability of faults in North China. Rock Soil Mechanics 34, 204–213. doi:10.16285/j.rsm.2013.s1.012
Huang, X. N., Wang, L. J., and Ge, L. M. (2009). A discussion on the relative variation of crustal stress measured by piezomagnetic stress gauge. Bulletin of the Institute of Crustal Dynamics 00, 40–57.
Jamison, D., and Cook, N. G. W. (1980). Note on measured values for the state of stress in the earth’s crust. J. Geophys. Res. 85, 1833–1838. doi:10.1029/jb085ib04p01833
Ji, J., Guo, L. Q., and Chen, J. Z. (2016). Zhangjiakou-bohai seismic belt deformation based on GPS observation. North China Earthquake Sciences 34, 37–41. doi:10.3969/j.issn.1003-1375.2016.03.007
Li, D. S., Wang, X., Cai, L. L., Jia, J., Li, X. J., and Wang, Y. L. (2021). Source parameter changes before the 2020 tangshan M5.1 earthquake in Hebei province. Earthquake Research in China 37, 117–126.
Li, G. F. (2005). The sssessment of regional crustal stability in tangshan. Master’s thesis (Tangshan: Hebei Polytechnic University).
Li, T. L., Yin, S. Y., and Li, T. J. (2016). Elastic-plastic mechanics. Wuhan: China University of Geosciences Press.
Li, Y. Q., and Wang, J. (2008). The preliminary study on focal mechanism of small and moderate earthquakes in divided zones around tangshan. Earthquake Research in China 24, 150–158.
Liao, C. T., Zhang, C. S., Wu, M. L., Ma, Y. S., and Ou, M. Y. (2003). Stress change near the kunlun fault before and after the MS8.1 kunlun earthquake. Geophys. Res. Lett. 30, 2003GL018106. doi:10.1029/2003GL018106
Liu, B. J., Qu, G. S., Sun, M. X., Liu, K., Zhao, C. B., Xu, X. W., et al. (2011). Crustal structures and tectonics of tangshan earthquake area: Results from deep seismic reflection profiling. Seismology and Geology 33, 901–912. doi:10.3969/j.issn.0253-4967.2011.04.014
Liu, H. Y., Chen, Y. K., Yan, C. G., and Fei, Y. (2013). Seismic risk evaluation on blind faults in Tianjin offshore areas. Technology for Earthquake Disaster Prevention 8, 146–155.
Liu, K., Zhang, X. W., Li, J. J., Ma, C. Q., Zhang, Y., and Wang, J. P. (2014). Variations among rice cultivars in subcellular distribution of Cd: The relationship between translocation and grain accumulation. Environ. Exp. Bot. 29, 25–31. doi:10.1016/j.envexpbot.2014.05.004
Long, Z. (2010). Quaternary lithostratigraphy and chronostratigraphy division and correlation in tangshan urban area. Master’s thesis (Beijing: China University of Geosciences).
Ma, H. S., Zhang, G. M., Liu, J., Li, L., and Chen, H. R. (2003). Correlation between strong earthquake activity and active crustal-block in China mainland and its adjacent regions. Earth Sci. Front. S1, 74–80.
Norman, H. S. (1999). Rate- and state-dependent friction of intact rock and gouge. J. Geophys. Res. 104, 17847–17855. doi:10.1029/1999jb900185
Peng, Y. Q., and Meng, L. P. (2017). Seismic structures of Hebei province, China. Shijiazhuang: The Hebei people’s Publishing House.
Qiu, J., Wu, M. L., Fan, T. Y., Zhang, C. Y., Li, R., and Chen, L. Z. (2017). Comparative analysis of in-situ stress in the southwestern segment of Longmenshan fault zone before and after lushan earthquake. Acta Geologica Sinica 91, 969–978.
Raleigh, C. B., Healy, J. H., and Bredehoeft, J. D. (1976). An experiment in earthquake control at rangely, Colorado. Science 191, 1230–1237. doi:10.1126/science.191.4233.1230
Shao, Y. X., Ren, F., Chen, Y. K., and Wang, Z. S. (2020). Exploration results of quaternary activities along the Cangdong fault. China Earthquake Engineering Journal 42, 927–933. doi:10.3969/j.issn.1000-0844.2020.04.927
Shi, F. Q., Zhang, H., Shao, Z. G., Xu, J., Shao, H. C., and Li, Y. J. (2020). Coulomb stress evolution and stress interaction among strong earthquakes in North China. Chinese J. Geophys. 63, 3338–3354. doi:10.6038/cjg2020O0094
Shi, Y. L., Yin, D., Ren, T. X., Qiu, Z. H., and Chi, S. L. (2021). The variation of coseismic static stress deviation consistent with theoretical prediction was observed for the first time—observation of borehole strain of the yuanping ML4.7 earthquake in shanxi on April 7, 2016. Chin. J. Geophys. 64, 1937–1948. doi:10.6038/cjg2021O0398
Snee, J. E. L., and Zoback, M. D. (2018). State of stress in the permian basin, Texas and new Mexico: Implications for induced seismicity. Lead. Edge 37, 127–134. doi:10.1190/tle37020127.1
Sun, X. L., Wang, G. C., and Yang, X. H. (2015). Coseismic response of water level in changping well, China, to the MW 9.0 Tohoku earthquake. J. Hydrol. X. 531, 1028–1039. doi:10.1016/j.jhydrol.2015.11.005
Tan, C. X., Hu, Q. Y., Zhang, P., Feng, C. J., and Qin, X. H. (2015). Present tectonic stress adjustment process before and after Japan mw 9.0 earthquake in North and Northeast China and its research significance. Earth Sci. Front. 22, 345–359. doi:10.13745/j.esf.2015.01.030
Tan, C. X., Qin, X. H., Wang, R. J., Long, C. X., Deng, N. G., Sun, Y., et al. (2010). Preliminary analysis of earthquake occurrence backgrounds of MS≥8.0 catastrophic earthquakes in middle and east parts of Chinese continent. Chinese Journal of Rock Mechanics and Engineering 29, 3598–3607.
Tan, C. X., Yang, W. M., Zhang, C. S., Feng, C. J., Zhang, P., Qi, B. S., et al. (2020). Geological survey of active tectonics and regional crustal stability in the beijing-tianjin-hebei coordinated development zone. Beijing: Geology Press.
Tan, C. X., Zhang, P., Feng, C. J., Qin, X. H., Sun, W. F., Chen, Q. C., et al. (2014). An approach on deep borehole crustal stress measuring and real-time monitoring and its application in seismogeology research in capital beijing region. Acta Geol. Sin. 88, 1436–1452.
Tan, C. X., Zhang, P., Lu, S. L., Zhu, J. Z., Feng, C. J., Qin, X. H., et al. (2019). Significance and role of in-situ crustal stress measuring and real-time monitoring in earthquake prediction research. J. Geomech. 25, 866–876. doi:10.12090/j.issn.1006-6616.2019.25.05.071
Tan, D., Zhang, Y. P., Li, X., Cai, Q., Wei, Y. F., and Zhao, J. W. (2021). Response characteristics of CSAMT around fengtai-yejituo buried fault. Journal of Hebei Geo University 44, 106–109. doi:10.13937/j.cnki.hbdzdxxb.2021.03.019
Tanaka, Y., Fujimori, K., and Otsuka, S. (1998). Prediction of large earthquake occurrence based on measurements of crustal stress and observations of changes in crustal stress and strain. Earthquake 50, 201–208. doi:10.4294/zisin1948.50.appendix_201
Townend, J., and Zoback, M. D. (2000). How faulting keeps the crust strong. Geology 28, 399–402. doi:10.1130/0091-7613(2000)028<0399:hfktcs>2.3.co;2
Townend, J., and Zoback, M. D. (2004). Regional tectonic stress near the san Andreas fault in central and southern California. Geophys. Res. Lett. 31, L15S11. doi:10.1029/2003GL018918
Walsh, F. R., and Zoback, M. D. (2016). Probabilistic assessment of potential fault slip related to injection-induced earthquakes: Application to north-central Oklahoma, USA. Geology 44, 991–994. doi:10.1130/g38275.1
Walsh, R., Zoback, M. D., Pais, D., Weingarten, M., and Tyrrell, T. (2017). FSP1.0: A program for probabilistic estimation of fault slip potential resulting form fluid injection. Free at SCITS.stanford.edu/software.
Wang, C. H., Ding, L. F., Li, F. Q., Song, C. K., and Mao, J. Z. (2012). Characteristics of in-situ stress measurement in northwest sichuan basin with timespan of 23 years and its crustal dynamics significance. Chin. J. Rock Mech. Eng. 31, 2171–2181.
Wang, C. H., Song, C. K., Guo, Q. L., Zhang, Y. S., and Ding, J. M. (2014). Stress build-up in the shallow crust before the lushan earthquake based on the in situ stress measurements. Chin. J. Geophs. 57, 102–114. doi:10.6038/cjg20140110
Wang, C. Y., Wu, Q. J., Duan, Y. H., Wang, Z. S., and Lou, H. (2017). Crustal and upper mantle structure and deep tectonic Genesis of large earthquakes in North China. Sci. China Earth Sci. 60, 821–857. doi:10.1007/s11430-016-9009-1
Wang, J., Gao, Z. W., Liu, F. X., Wang, W. H., Zhao, G. C., and Xu, W. (2020). Study on tangshan-hejian-cixian earthquake fault zone by shallow seismic exploration method. Seismology and Geology 42, 866–880. doi:10.3969/j.issn.0253-4967.2020.04.006
Wang, L. F., Liu, J., Zhao, J. G., and Zhao, J. (2013). Coseismic slip and post-seismic relaxation of the 2011 M9.0 tohoku-oki earthquake and its influence on China mainland. Earthquake 33, 238–247.
Wang, M., Li, Q., Wang, F., Zhang, R., Wang, Y., Shi, H., et al. (2011). Far-field coseismic displacements associated with the 2011 Tohoku-oki earthquake in Japan observed by Global Positioning System. Chin. Sci. Bull. 56, 2419–2424. doi:10.1007/s11434-011-4588-7
Wang, X., Wang, Y. R., Guo, L., and Wang, X. S. (2016). The comprehensive analysis of earthquake precursors significance of the luanxian ML 3.3 earthquake swarm on january 11, 2015. Seismological and Geomagnetic Observation and Research 37, 41–47. doi:10.3969/j.issn.1003-3246.2016.02.007
Wang, Y. L., Cai, L. L., Li, D. S., Wang, L. C., Zhao, Y. P., and Wang, X. S. (2021). The seismogenic structure of the Hebei tangshan MS5.1 earthquake on july 12, 2020 and three-dimensional modeling of Tangshan fault zone. North China Earthquake Sciences 39, 83–91. doi:10.3969/j.issn.1003−1375.2021.03.013
Wu, F., Xu, Y., Zhu, R., and Zhang, G. (2014). Thinning and destruction of the cratonic lithosphere: A global perspective. Sci. China Earth Sci. 57, 2878–2890. doi:10.1007/s11430-014-4995-0
Wu, M. L., Zhang, C. Y., and Fan, T. Y. (2016). Stress state of the baoxing segment of the southwestern Longmenshan fault zone before and after the MS 7.0 lushan earthquake. J. Asian Earth Sci. 121, 9–19. doi:10.1016/j.jseaes.2016.02.004
Yan, C. G., Wang, Z. S., Chen, Y. K., Ren, F., and Gao, W. P. (2014). Comprehensive survery and investigation on the exact spatial location and activity of the Hangu fault in Tianjin. Earthquake Research in China 30, 501–513.
Yang, S. M., Nie, Z. S., Jia, Z. G., and Peng, M. L. (2011). Far-field coseismic surface displacement caused by the MW9.0 tohuku earthquake. Geomat. Inf. Sci. Wuhan Univ. 36, 1336–1339.
Yang, Y. Q., Wang, X. S., Wan, Y. G., Sheng, S. Z., and Chen, T. (2016). seismogenic fault segmentation of tangshan earthquake sequence derived from focal mechanism solutions. Acta Seismologica Sinica 38, 632–643. doi:10.11939/jass.2016.04.009
Zeng, R. S., Lu, H. X., and Ding, Z. F. (1987). Seismic refraction and reflection profilings across tangshan epicentral region and their implication to seismogenic processes. Chin. J. Geophs. 31, 383–398.
Zhang, P., Qu, Y. M., Guo, C. B., Feng, C. J., Meng, W., Fan, Y. L., et al. (2017). Analysis of in-situ stress measurement and real-time monitoring results in nyching of Tibetan plateau and its response to Nepal MS8.1 earthquake. Geoscience 31, 900–910.
Zhang, S. X., Bian, Q. K., Zhang, Z. G., Wang, X. S., Cao, J., and Li, Y. Q. (2020). Seismic distribution and tectonic significance of the northern segment of the Tangshan fault. Journal of Seismological Research 43, 270–277.
Zheng, Y. P., Wang, Y., Chen, Y. K., and Han, G. Z. (2006). Shallow tectonic characteristics of the Haihe fault in Tanggu area, Tianjin municipality. Advances in Marine Science 24, 307–313. doi:10.1016/S1001-8042(06)60021-3
Zhong, Q., and Shi, B. P. (2012). Aftershock duration of the 1976 MS7.8 tangshan earthquake and implication for seismic hazard estimation. Acta Seismologica Sinica 34, 494–508. doi:10.3969/J.issn.0253-3782.2012.04.007
Zhou, Y., Wang, X., and Sun, L. N. (2022). Source parameters and seismogenic structure analysis of the july 12, 2020 tangshan MS5.1 earthquake. Journal of Geodesy and Geodynamics 42, 172–220. doi:10.14075/j.jgg.2022.02.012
Zhu, C. L. (2020). Analysis of crustal deformation and seismic risk around the yishu segment of Tanlu active fault zone. Ph.D. Thesis (Beijing: Institute of Geology, China Earthquake Administration).
Zhu, C. L., Gan, W. J., Li, J., Jia, Y., Wang, Q., and Yin, H. T. (2018). Relative motion between the two blocks on either side of the yishu fault zone after the 2011 Japan MW9.0 earthquake and its effect on seismic activity. Chin. J. Geophys. 61, 988–999. doi:10.28.6038/cjg2018K0687
Zhu, K. J., Peng, Y. Q., and Zhou, Y. L. (2019). Research on the ninghe-changli fault based on data from shallow seismic exploration. China Earthquake Engineering Journal 41, 1242–1250. doi:10.3969/j.issn.1000-0844.2019.05.1242
Zhu, R. X., and Xu, Y. G. (2019). The subduction of the west Pacific plate and the destruction of the North China Craton. Sci. China Earth Sci. 62, 1340–1350. doi:10.1007/s11430-018-9356-y
Zoback, M. D., and Gorelick, S. M. (2012). Earthquake triggering and large-scale geologic storage of carbon dioxide. Proc. Natl. Acad. Sci. U. S. A. 109, 10164–10168. doi:10.1073/pnas.1202473109
Zoback, M. D., and Healy, J. H. (1992). In-situ stress measurements to 3.5 km depth in the cajon. Pass scientific research borehole: Implications for the mechanics of crustal faulting. J. Geophys. Res. 97, 5039–5057. doi:10.1029/91jb02175
Keywords: Tangshan seismic region, Tohoku-Oki 3.11 M9.0 earthquake, in situ stress monitoring, in situ stress field, fault slip potential, Mohr-Coulomb failure criteria, Byerlee's law
Citation: Fan Y, Zhang P, Feng C, Meng J, Qi B, Wang J and Tan C (2022) Analysis of fault slip potential of active faults in Tangshan seismic region after the Tohoku-Oki 3.11 M9.0 earthquake based on in situ stress monitoring data. Front. Earth Sci. 10:970595. doi: 10.3389/feart.2022.970595
Received: 16 June 2022; Accepted: 29 August 2022;
Published: 14 September 2022.
Edited by:
Xiaoping Zhou, Chongqing University, ChinaReviewed by:
Peng Li, University of Science and Technology Beijing, ChinaJiancang Zhuang, Institute of Statistical Mathematics (ISM), Japan
Copyright © 2022 Fan, Zhang, Feng, Meng, Qi, Wang and Tan. This is an open-access article distributed under the terms of the Creative Commons Attribution License (CC BY). The use, distribution or reproduction in other forums is permitted, provided the original author(s) and the copyright owner(s) are credited and that the original publication in this journal is cited, in accordance with accepted academic practice. No use, distribution or reproduction is permitted which does not comply with these terms.
*Correspondence: Peng Zhang, emhhbmdwZW5nMDcxM0AxNjMuY29t