- 1Department of Earth and Environmental Sciences, Bahria University, Islamabad, Pakistan
- 2Institute of Geology, University of the Punjab, Lahore, Pakistan
- 3Oil and Gas Development Company Limited, Islamabad, Pakistan
- 4School of Physics, Geophysics Section, Universiti Sains Malaysia, Gelugor, Penang, Malaysia
- 5The Faculty of Biosciences, Fisheries and Economics, UiT The Arctic University of Norway, Tromsø, Norway
- 6Department of Earth Sciences, Faculty of Sciences, Ibn Zohr University, Agadir, Morocco
Assessment of organic carbon content (TOC) by geophysical logs has been a challenging task in the formation evaluation of shale gas. This research is conducted to estimate the unconventional hydrocarbon (shale-gas) potential of Talhar Shale in the Southern Indus Basin (SIB), Pakistan. In this study, total organic carbon content (%) was estimated through well logs by different methods and then correlated with well cuttings/core data to determine the best method for estimation of TOC content especially when well cuttings/core data are not available. The Talhar Shale’s thermal maturity, as well as the organic content, were assessed from geochemical analyses. Talhar Shale of Dangi-01 well has good to very good source potential whereas Chak7A-01 well has fair-good. According to Ven Krevalen cross-plot, Talhar Shale of Dangi-01 well has type III kerogen; it can only produce gas while Chak7A-01 has type II/III kerogen which produces both oil and gas. The TOC was estimated using two methods i.e., Schmoker’s and Hester’s and Multivariate Fitting methods. The estimated TOC is then correlated with well cuttings data and concluded that the Multivariate Fitting method is selected as an optimized method for estimation of TOC because it shows strong correlation values of 0.93 and 0.91 in both wells respectively for Talhar Shale SIB, Pakistan.
Introduction
Exploration of hydrocarbon is essential for a country’s prosperity and economy. The unconventional hydrocarbon resources had been explored at a large scale due to the depletion of conventional hydrocarbon resources. The source rock potential, depositional environment, thermal maturation, and biodegradation of ejected hydrocarbons can all be determined via organic geochemistry (Tissot and Welte, 1984; Imtiaz et al., 2017). Rock-Eval pyrolysis is a more comprehensive method that can measure useful geochemical parameters in the process of source rock geochemical assessment (i.e., determination of kerogen type and maturity). Nowadays, shale-gas exploration is a debate among geoscientists. Geochemical analysis (e.g., Rock-Eval) is the most widely used approach for evaluating unconventional hydrocarbons, however, it is expensive and time-consuming. Academics and geoscientists are attempting to create new methodologies for estimating TOC using well logs that are both easier and less costly (Nazir et al., 2012; Ehsan et al., 2018; Mahmoud et al., 2019; Ali et al., 2021; Kassem et al., 2021b).
Due to the rapid depletion of conventional hydrocarbon resources, an increase in the exploration of unconventional resources has been observed during the last 15 years that redesigning the entire petroleum industry and global energy mix with over hundred-thousand horizontal wells drilled in the United States only (EIA, 2018). The unconventional exploration activity in an area is usually driven by a large number of unconventional resources (McGlade et al., 2013; Evenick, 2020). In recent years, exclusive datasets such as source rock and geochemical data are primarily generated by either internal or external laboratories. These datasets are highly expensive and time-consuming as well as challenging to manage and investigate due to geographic constraints or statistical (Evenick, 2020).
Exploring tight shale oil or gas has become very popular around the world in recent years due to the shortage of alternative energy resources (Jarvie, 2012). The TOC content is not only considered an essential parameter for estimation of the potential shale-gas reservoir, but it also affects rock quality, hydraulic fracture modeling, and shale gas-in-place assessment (Passey et al., 2010; Sondergeld et al., 2010). Organic matter, which is also the constituent of the rock matrix, mainly controls the geomechanical properties of shale formations (Altowairqi et al., 2015). It is made up of two components: bitumen, which is relatively simple, and kerogen, which is a vast and complex structured chemical compound that is insoluble in organic solvents. Under the influence of temperature and pressure conditions, organic matter passes through several concurrent and uninterrupted chemical reactions. The conditions at each reservoir location can be very variable, and the ratios of the various OM change from place to place. Consequently, the chemical composition and characteristics of the petroleum extracted from the different source rocks vary (Tissot and Welte 1984; Speight 2001; Nazir et al., 2020). Other influential parameters include thermal maturity and organic carbon content within the organic matter that primarily control the organic porosity and the absorbed gas within shale-gas reservoirs (Montgomery et al., 2005; Ross and Marc Bustin, 2007).
Unconventional energy sources have surpassed conventional energy sources as the primary source of energy (Chopra et al., 2012; Zou et al., 2013). The world’s recoverable shale-gas resources are approximately 141259 TCF, which is eight times bigger than conventional gas resources (EIA, 2009). Pakistan’s conventional gas reserves are expected to be 52 TCF, with 23 TCF remaining, and no gas by 2025 if the current scenario continues. Pakistan’s unconventional gas resources are estimated to be 586 TCF shale gas (Ali and Siddiqui, 2017). Talhar Shale can be considered to be an unconventional formation (Ehsan et al., 2019; Ehsan and Gu, 2020). Talhar Shale is considered an important source rock that bears the generation potential of hydrocarbons in SIB (Nazir and Fazeelat, 2017; Ehsan et al., 2021).
The estimated TOC is determined through well-logs by using different methods. To validate this estimated TOC well cuttings/core of the same wells are analyzed in the laboratory to determine measured TOC and other Rock-Eval parameters i.e., quantity, quality, type of organic matter and thermal maturity. In this study, the focus is to correlate calculated TOC from well-cutting data with estimated TOC from well-logs to evaluate the source rock potential of Talhar Shale of Cretaceous, especially when well-cutting/core data is not available. Talhar Shale has the same geochemical properties as Sembar Formation (Cretaceous). Therefore, it is considered an unconventional source rock. Correlation is made between estimated TOC and well-cutting TOC, which gives a very close result.
Geological setting
The Southern Indus Basin (SIB) is 550 km long and 250 km in width, and it is an extensional basin that is formed due to upwarping on the western side of the Indian continental plate (Kadri, 1995) (Figure 1). It is a sedimentary basin extending in the north-south direction and contains important structural features such as Jaccobabad, Mari-Khandkot, Hyderabad, and Khairpur highs. Indian Shield lies in the east while the Kirthar Fold-and-Thrust belts are in the west. The southward extension of this basin is delimited by the offshore fracture plate boundary (Zaigham and Mallick, 2000).
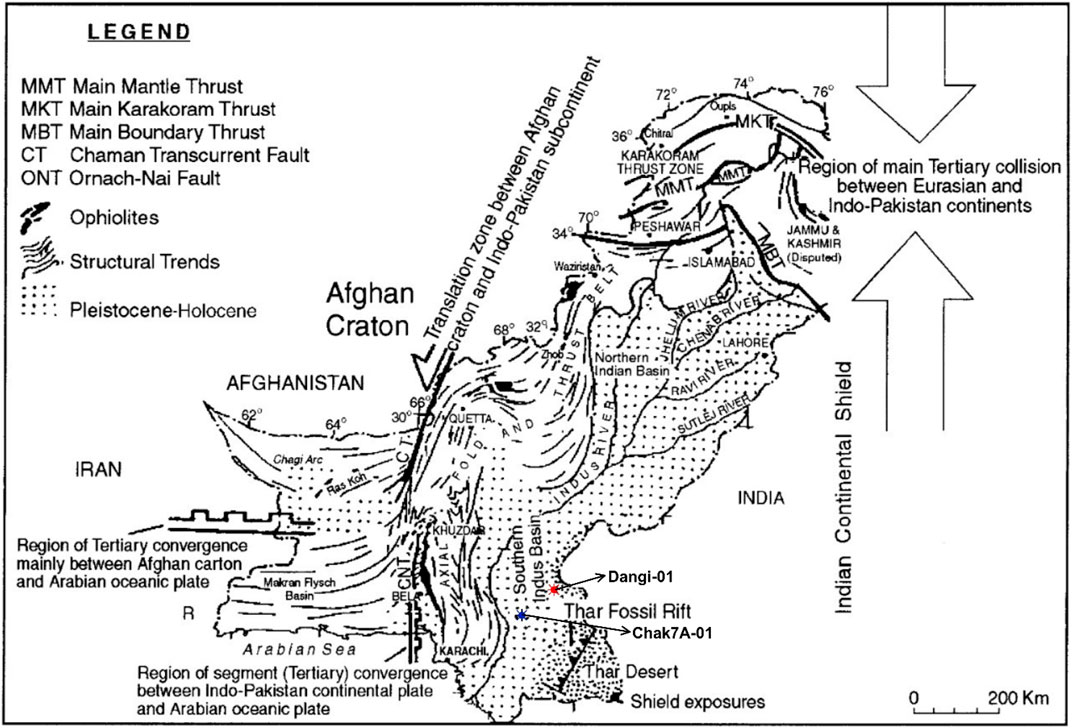
FIGURE 1. Tectonic map which shows major tectonic features with prospective shale-gas basins (Northern and Southern Lower Indus Basin) of Pakistan and marks well locations (Zaigham and Mallick, 2000; EIA, 2013).
Tectonic features of the Indian Plate on the western side are the result of a convergence of the Arabian Plate and the Afghan Block and between a portion of the Arabian Plate and the rifted margin of the Indian Plate (Figure 1). In the Southern Indus Basin (SIB), due to the divergence of the plates a rifted protocontinent and new oceanic plate was formed due to the plate divergence (Zaigham and Mallick, 2000). The rifts are made up of a series of horst and graben that exist under the Paleocene unconformity. During the Late Cretaceous, rifting between Seychelles and the Indian Plate resulted in the formation of these features (Khan et al., 2013; Ashraf et al., 2021). The rifting and fragmentation of Gondwanaland are linked to the SIB’s basin history during the Jurassic. Overall, the Southern Indus Basin (SIB) was comparatively tectonically stable but during Tertiary, the intense folding and faulting events occurred (Kemal et al., 1992; Ashraf et al., 2019; Ashraf et al., 2020).
Apparently, the Indus River is somehow following the trend of an axis of the basin. The SIB is comprised of thick sedimentary (Tertiary) cover that is underlain by marine Mesozoic rocks and overlain by Quaternary sediments. Generally, clastic sediments deposited in the SIB as thinner units compare to carbonate units. Several researchers have reported that rocks deposited during the Mesozoic mostly include shallow marine to continental clastics (Bender and Raza, 1995; Kadri, 1995).
Cretaceous source rocks are widely distributed in the Lower Indus Basin of Pakistan and the environment of deposition of these rocks varies a lot (Ihsan et al., 2022). The predominant lithologies of the cretaceous rocks present in the SIB include shale, limestone, and conglomerates etc. Chiltan Limestone dominantly consists of massive limestone (Figure 2). Cretaceous sedimentary strata are predominantly comprised of shale, sandstone, limestone, and conglomerate. Sembar Formation dominantly includes shale while siltstone and sandstones with minor limestone exist as a trace. Another important formation of the Cretaceous is Goru Formation which includes two different parts i.e., upper and lower parts. Sandstone units are dominant in the lower part than the upper part of the Goru Formation which was deposited in a deep marine environment. Parh Limestone of Late Cretaceous which is mainly composed of fine-grained limestone occurred more widely. The Pab Sandstone is dominantly composed of regressive sandstone deposited during the shelf environment during the Late Cretaceous on the western side (Wandrey et al., 2004).
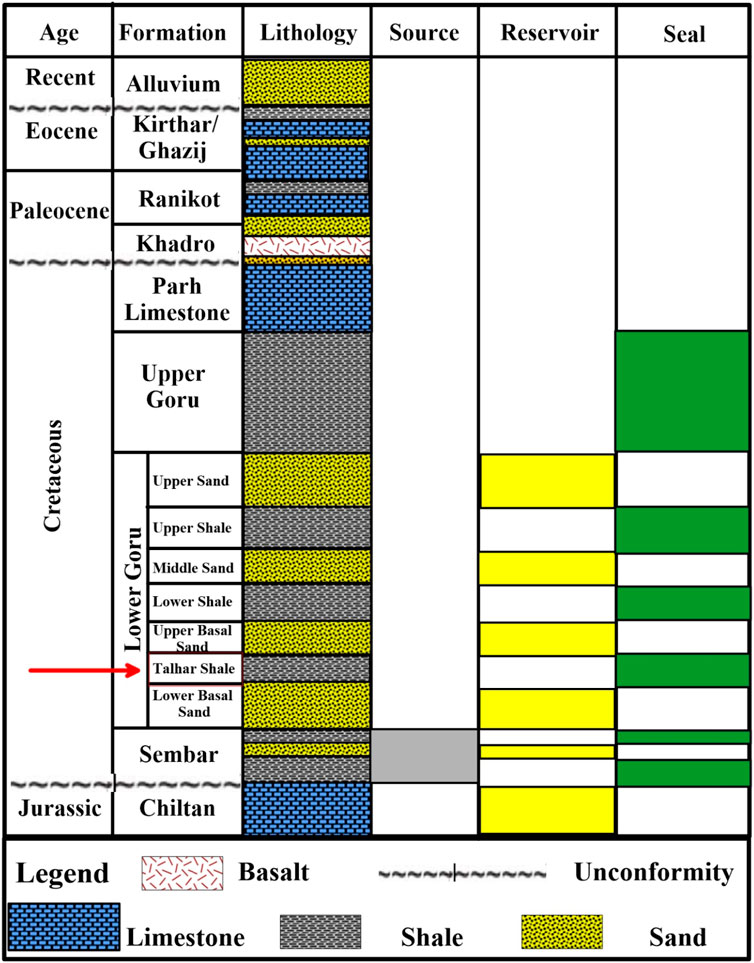
FIGURE 2. The stratigraphic column of the study area. The Talhar Shale is marked by a red arrow in the column (Alam et al., 2002).
Thick rock units of Cenozoic strata are exposed on the western side of the SIB. Paleocene rock units comprised Khadro and Ranikot formations, while Eocene rocks include Kirthar and Ghazij formations. The outcrop of the Ranikot, Laki (limestone), and Kirthar formations are primarily located onshore (Alam et al., 2002). During the wells’ drilling in the basin, basement rocks are not encountered as such rocks are overlain by the thick strata of Mesozoic and Cenozoic.
Materials and methods
The data set used in this study was well logging data and well-cutting data. A total of sixteen (16) well-cutting samples of the Talhar Shale were obtained from the Oil and Gas Development Company Limited (OGDCL) of Pakistan which includes nine (9) samples of the Dangi-01 well and seven samples of Chak7A-01 well to obtain geochemical parameters. The complete suite of logs of these wells was utilized in this study.
Well-log curves that are sensitive to the presence of organic matter primarily include natural gamma ray, resistivity, density, neutron, and sonic logs as reported in several studies. Rapid data variation in the log curves marks the presence of a rich organic matter zone. Based on this approach, source rock identification, and estimates of TOC, S1, and S2 content are quite possible. A single log method is mostly affected by variations in the mineral composition, and other variables such as water, pressure, and mud. Consequently, the multi-log technique is a better choice to calculate TOC content (Wang et al., 2019).
TOC obtained from the well-cutting samples or core samples is limited, the researchers have made many achievements in predicting TOC from well-log data (Guangyou et al., 2003; Jarvie et al., 2015). Well-logging data gives continuous data throughout the drilling. Different well-log values i.e., neutron log, natural gamma log, density, resistivity, and acoustic time difference, are used to estimate TOC. Source rock has special logging response characteristics and organic matter has some specific geophysical logging responses (Mao, 2001; Yang et al., 2012).
Organic matter is commonly identified using well logging techniques and other representative methods are used to estimate TOC in a shale-gas reservoir. Such methods include the bulk density method (Schmoker and Hester, 1983), which estimates TOC using an inverse proportional relationship between TOC and bulk density when the bulk density is not affected by geological or reservoir parameters (Schmoker, 1979; Schmoker and Hester, 1983). Another method used to estimate the TOC content is based on the porosity (sonic, density, and neutron) and resistivity log curves (Passey et al., 1990; Aziz et al., 2020). This method is also represented with ∆logR which is applied to a wide range of maturities to estimate the TOC content in shale-gas reservoirs. Nowadays, the ∆logR technique is universally employed as the baseline for logs are properly demarcated and resistivity and porosity logs are scaled. However, the ∆logR technique has drawbacks such as the assumption that composition, level of compaction, and texture remained the same and variation of baseline from one well to another (Yu et al., 2017).
Currently, two proven techniques of estimating TOC from well-log data were used; these methods are Schmoker and Haster (1983) method and the Multivariate Fitting method (Renchun et al., 2015). The Multivariate Fitting approach determines the correlation between each variable and the corresponding well-logging data in the potential source rocks. Also, a correlation between TOC content and uranium content information derived from natural gamma ray spectroscopy (energy spectrum logging) can be utilized (Kamali and Allah Mirshady, 2004), particularly in marine source rocks (Yanran et al., 2019). The ΔlogR approach cannot be used to estimate the TOC as a measurement of the resistivity was not carried out within the zone of interest.
Different techniques are used for the estimation of TOC content. Schmoker (1979) estimated the TOC content using the natural gamma well log in Appalachian Devonian shales. According to Schmoker (1981), organic matter is mostly associated with high values of gamma-ray activity. Later, Schmoker realized that this method could only be used for the specific region of Appalachian Devonian shales because the gamma-ray log response is not for kerogen but uranium content. The uranium content is also dependent on the chemistry of water, type of kerogen, and rate of sedimentation. So, one cannot assume exactly whether the high gamma-ray log response is associated with high TOC or not.
Schmoker and Hester (1983) observed that there is an inverse relationship between the formation of rock density and total organic carbon (TOC) in carbonaceous shales of Assam Basin in India. Later, they introduced an empirical relationship for estimating total organic carbon (TOC) from the density log. The relationship introduced by Schmoker and Hestler (1983) can estimate TOC in clay-poor shales that are thermally mature. Basically, this relationship needs calibration with the lithology type. However, results may be ambiguous with either underestimation of TOC in clay-rich or carbonate-rich shales or overestimation in thermally immature shales. The multivariate fitting method was proposed by Renchun et al. (2015) to estimate TOC by using a well-log.
The rock chips from both Dangi-01 and Chak7A-01 wells were examined in the laboratory at OGDCL Islamabad, Pakistan. TOC was calculated through well-logs by using Schmoker and Hester (1983) and the Multivariate Fitting method as indicated in Eqs 1, 2 respectively. Well-logs data were used to estimate TOC. Rock-Eval pyrolysis was performed using the “Rock-Eval 6” machine for the evaluation of the source rock. Schmoker’s and Hester’s (1983) method is one of the easiest methods of TOC calculation because there is only one well logging curve involved in the calculation of TOC i.e., the bulk density log curve.
Where TOC represents total organic carbon and
TOCMV represents total organic carbon (TOC) content computed from the multivariate fitting method while w(U) is the uranium curve values and
The type of organic matter was determined through the cross-plot between hydrogen index (HI) and oxygen index (OI). The petroleum generation potential and organic richness were determined using TOC versus S2 cross-plot. The maturity of organic matter was determined using a maximum temperature (Tmax) versus production index (PI) cross-plot. The generation potential was determined using a generation potential versus total organic carbon contents cross-plot.
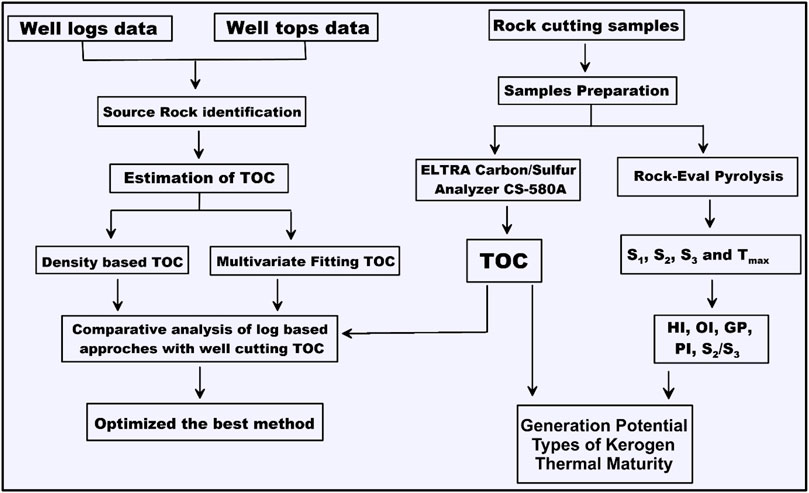
For validation well-cutting, TOC was determined in the laboratory using ELTRA Carbon/Sulfur Analyzer CS-580A. The estimated TOC from the well-log was then correlated with well-cutting TOC to validate the TOC assessment method through well logs. This study was done to determine TOC using well logs by a faster and cheaper method. The workflow is shown in Figure 3.
Results and discussions
Several kinds of research have been conducted to find an optimum relationship that better explains the variation of geochemical with petrophysical and geomechanical data (e.g., Schmoker and Hester, 1983; Passey et al., 1990; Shukla et al., 2013; Leila et al., 2021; Sen et al., 2021; Abdel-Fattah et al., 2022; Fea et al., 2022). Relationships of geochemical data with other datasets are very important to validate the field data and estimates of different properties from one to another and develop a continuous geochemical model (Abarghani et al., 2019).
In general, a sufficient dataset regarding the rock cuttings of potential source rock of a basin might not be easily accessible, or sufficient details in the available literature which encompass the data related to the source rock in the entire basin as published literature (Dembicki, 2016). Well-log will be an alternative to overcome such constraints to understand better and estimate the different source rock-related parameters. Geochemical results of Dangi-01 and Chak7A-01 wells show dissimilarities in organic content due to differences in burial depth.
The well-cuttings were obtained from the Dangi-01 well (3,340–3,432 m) at a level of 10 m having a thickness of 2 m, and seven (07) samples were obtained from Chak7A-01 well (2,850–2,915 m) with samples thickness of 5 m. The ELTRA Carbon/Sulfur Analyzer CS-580A machine was used to determine TOC levels. The Rock-Eval pyrolysis data (S1, S2, S3, and Tmax) were calculated indirectly using the Rock-Eval 6 machine, whereas the remaining parameters (GP, PI, HI, OI, and S2/S3) were determined directly using the Rock-Eval 6 machine. Then, measured values of different source rock parameters from each well were cross-plotted to determine the generation potential, type of kerogen, and the maturity of organic matter of Talhar Shale (source rock) (Table 1).
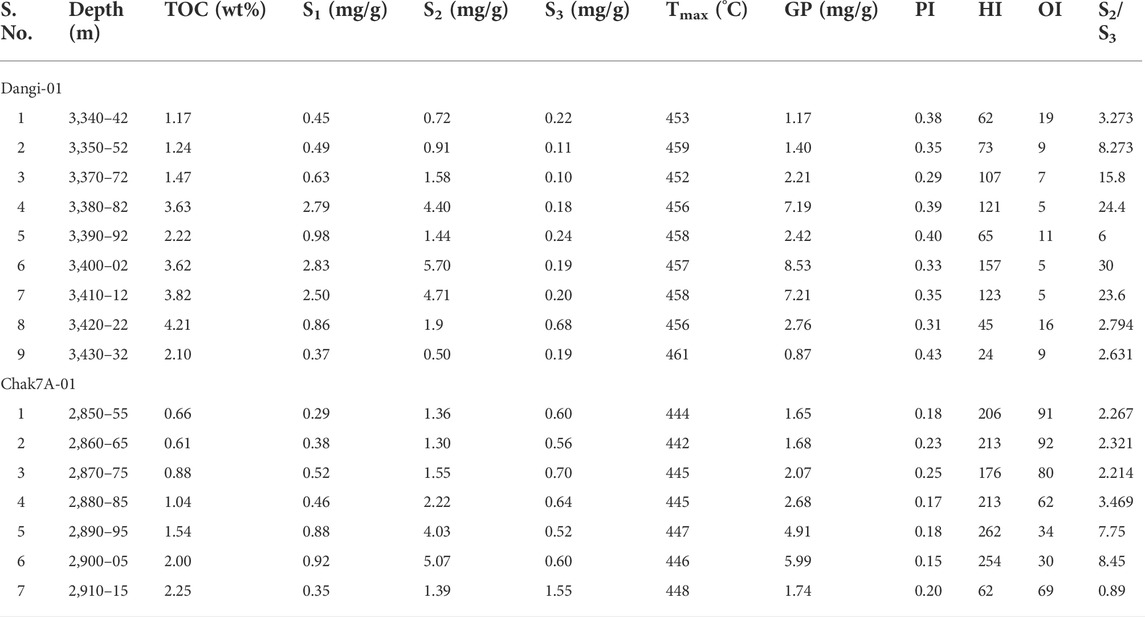
TABLE 1. Data from the Talhar Shale of the Dangi-01 and Chak7A-01 wells, including TOC and Rock-Eval.
Organic richness
At first, the organic richness of any source rock can primarily be determined by estimating TOC content. Further, thermal maturity is investigated to understand the hydrocarbon generation from a source rock (Abarghani et al., 2019). To assess the hydrocarbon generation potential and TOC content of the designated rock sample, the S2 peak and TOC were quantified by Rock-Eval pyrolysis and C/S-Analyzer. The TOC and Rock-Eval data for the Talhar Shale in both wells are shown in Table 1. The TOC readings in the Dangi-01 well range between 1.17 and 4.21, according to the geochemical analysis (wt%).
The distribution of the source rock based on organic richness is reflected in the plot of depth against TOC (Figure 4). The organic richness of the well-cutting samples from the Dangi-01 well ranges from good and very good, with only a single sample, falling into the zone of outstanding source rock. Organic matter content is lower in samples from comparatively shallower depths of the formation, whereas samples from greater depths (>3,375 m) have higher organic carbon content, which may be due to the difference in organic matter input, deposition of the shale, and variation in organic matter preservation.
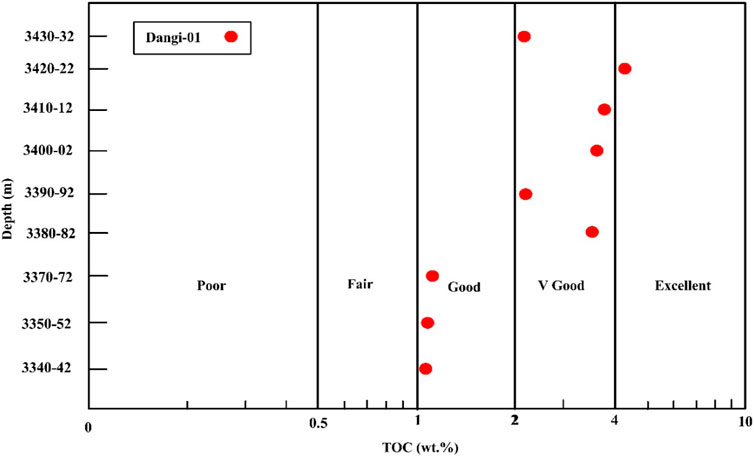
FIGURE 4. The cross-plot of TOC (wt%) versus depth (m) to describe the organic richness of samples of Dangi-01 well criteria adopted by Peter and Cassa (1994).
The TOC readings in the Chak7A-01 well varied from 0.66–2.25 wt%. According to the cross-plot, all of the samples are of medium to good organic-rich source rock, with only one sample having very good organic richness (Figure 5). The change in organic content of the Talhar Shale follows a comparable with that of the Dangi-01. The cross-plot shows that samples at depths of 2,850–2,875 m have fair potential and have strong potential at depths of 2,880–2,895 m, while samples at greater depths of the rock have very good organic content (2,900–2,915 m).
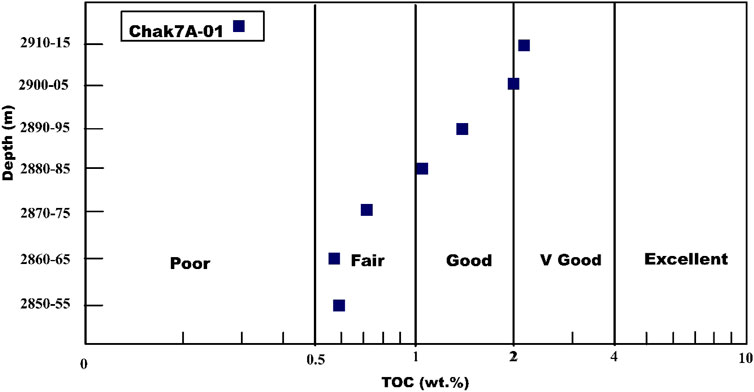
FIGURE 5. The cross-plot of TOC against depth to describe the organic richness of samples of Chak7A-01 well criteria adopted by Peter and Cassa (1994).
Hydrocarbon generation potential
The presence of effective source rock is critical, especially at earlier stages of hydrocarbon exploration. The plot between TOC and generation potential (GP) can be employed to fulfill the purpose. Generation potential (GP) can be determined by adding S1 and S2 together. Source rock with GP values lower than 2 bears poor potential, samples with GP values between two to four have fair potential, samples with GP values between 5 and 10 have good potential, and samples with GP values greater than 10 have strong source potential (Hunt, 1996).
GP versus TOC cross-plot represents that the samples from the Dangi-01 well are of good to very good source generation potential whereas a single sample (GP: 0.87–8.53 mg/g) falls into the excellent source rock potential zone (Figure 6). All the samples in the Chak7A-01 well are deemed to have fair to excellent generation potential, with GP values are 1.65–5.99 mg/g.
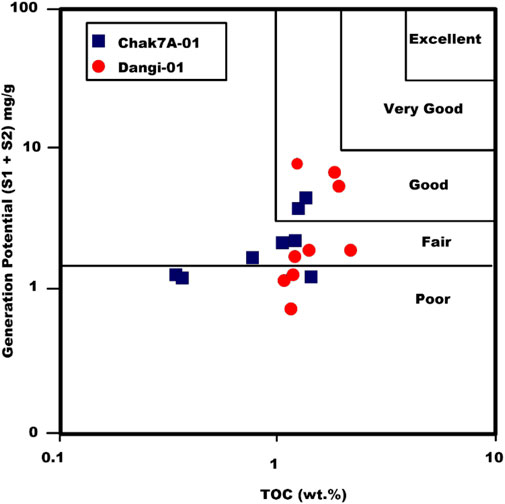
FIGURE 6. GP vs. TOC cross-plot indicating generation potential of the rock from Dangi-01 and Chak7A-01 wells criteria adopted by El Nady et al. (2015).
Organic matter types
The type of organic matter present in a rock is crucial in determining the type of hydrocarbon produced. A cross-plot of the hydrogen and oxygen indexes was constructed to identify the fluid type. It's used to figure out what kind of organic matter and organic input there is. According to Walpes (1985), hydrogen index (HI) values <50 mg HC/g represent no production zone and it is classified as type IV kerogen while higher HI (<250 mg HC/g) indicates gas production region and is designated as type III kerogen. On the other hand, HI values between 250 and 400 mg HC/g indicate is a mixed type II/III kerogen that has gas generation potential. HI values higher than 400 specify a source rock that produces oil (type II kerogen) and its greater values (HI > 650) specify a source rock that has the potential to produce oil (type I kerogen).
Van Krevelen cross-plot between HI and OI as shown in Figure 7 shows that the samples from Talhar Shale in Dangi-01 well indicate low HI values (type III/IV kerogen) which may be due to higher thermal maturity or poor preservation if not predominantly terrestrial input. In Chak 7A-01 well, HI values lie within the range of 150–300, which represents type II or III kerogen. Talhar Shale is possibly formed by mixed marine and terrestrial input. Among the other samples from Chak7A-01 well, a single sample represents the type III kerogen zone which could be due to the weathering or oxidation processes. The ratio of pristane to phytane (Pr/Ph) is a good indicator of the depositional environments. Higher values of Pr/Ph ratios indicate that Talhar Shale was deposited with a terrigenous input under anoxic environment (Nazir and Fazeelat, 2017). The present study corresponds well with the previous studies. Additionally, the biomarker study reveals that Talhar shale bears a strong potential to act as a source rock (Nazir et al., 2015).
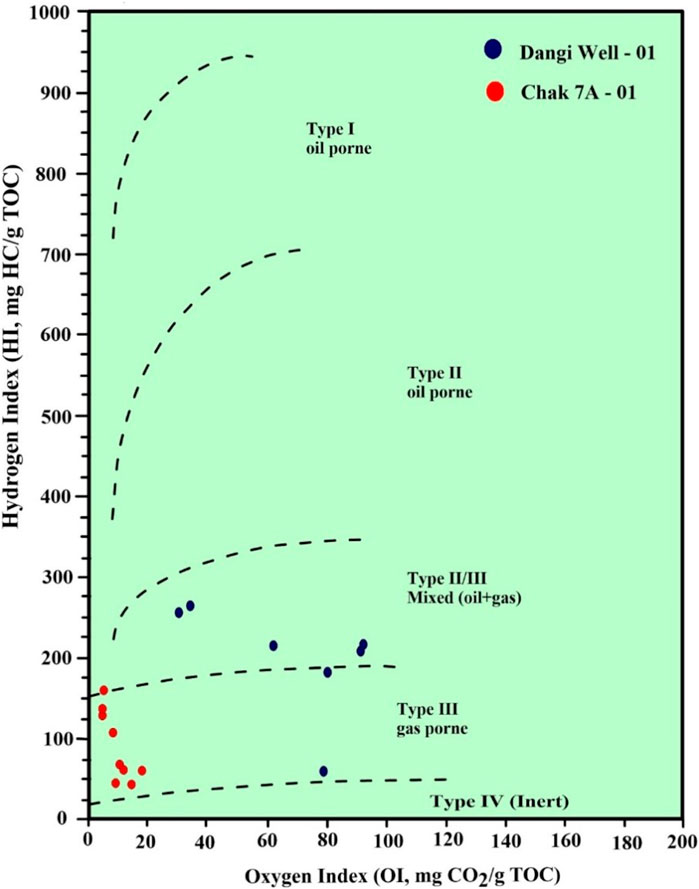
FIGURE 7. Van Krevelen diagram (modified) between HI and OI to identify kerogen type from both wells criteria adopted by Peter and Cassa (1994).
Thermal maturity of organic matter
Thermal maturity is one of the most important factors to estimate the source rock potential (Nazir and Fazeelat, 2014). As the complex geopolymers get mature, thermal alteration processes controlled by microbes, temperature, pressure, and time result in a permanent compositional alteration (Glombitza et al., 2009). The diagenetic properties of the organic matter in the subsurface are mainly controlled by the burial depth and temperature (Kassem et al., 2021a). Because of the geochemical events that occur during organic matter transformation, the level of thermal maturity of organic matter increases as Tmax increases. Vitrinite reflectance (Ro) is the most widely used tool for estimating thermal maturity. It is regarded as one of the most accurate predictors of organic matter maturity.
The production index (PI) can also be used to assess organic matter’s thermal maturity. The cross-plot of PI vs. Tmax (Figure 8) and Peter and Cassa (1994) classification show that the Dangi-01 samples are adequately mature and generate wet gas, with only the sample being late mature. On the other hand, all the samples from Chak7A-01 well are early mature and lie in the oil window. Higher maturity of organic matter in Talhar Shale present in Dangi-01 well than Chak7A-01 well primarily corresponds to greater burial depth.
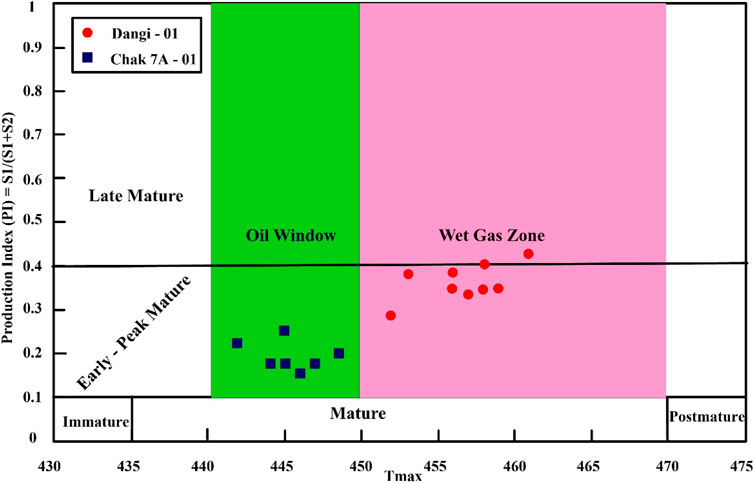
FIGURE 8. Cross-plot Tmax vs. PI indicating the maturity of Organic matter present within rocks of Dangi-01 and Chak7A-01 wells. The Tmax and PI criteria were followed in the present study after Espitalié et al. (1985) and Peter and Cassa (1994), respectively.
Adequate organic maturity of the organic matter of the Talhar Shale at both of these wells is validated through values of Tmax and PI. Also, the values of organic richness and thermal maturity mark that the Talhar Shale contains the zones which bear the potential to produce both oil and gas. Biomarker maturity and Rock-Eval parameters correspond well which validates the above interpretation and analysis (Nazir and Fazeelat, 2016). The thermal maturity difference between Dangi-01 and Chak7A-01 wells is related to the depth of the Talhar Shale as shown in Figures 4, 5. Talhar Shale is more mature in Dangi-01 well as compared to Chak7A-01 well due to the deep burial depth of organic matter (Nazir and Fazeelat, 2017).
Total organic carbon estimation through well logs
In shale-gas reservoirs, the reservoir characteristics such as permeability, porosity, texture, and micro-structures are controlled by the total organic content present (Zhang et al., 2012; Sone and Zoback, 2013; Altowairqi et al., 2015). Therefore, an accurate estimate of TOC content and reliable shale reservoir characterization is significantly crucial for the exploration of shale-gas reservoirs (Wang et al., 2016). TOC is typically assessed in a geochemical laboratory using source rock evaluation equipment on well cuttings and sidewall cores. Because the core sample is extracted only from a zone of interest, the data produced using these approaches is not continuous and has restricted availability. These procedures are both costly and time-consuming. Well logging, which provides high-resolution and continuous data, may be a solution to such issues. Schmoker and Hester and the Multivariate Fitting method were used to estimate TOC in the Talhar Shale of the Dangi-01 and Chak7A-01 wells, as illustrated in Figures 9, 10, respectively.
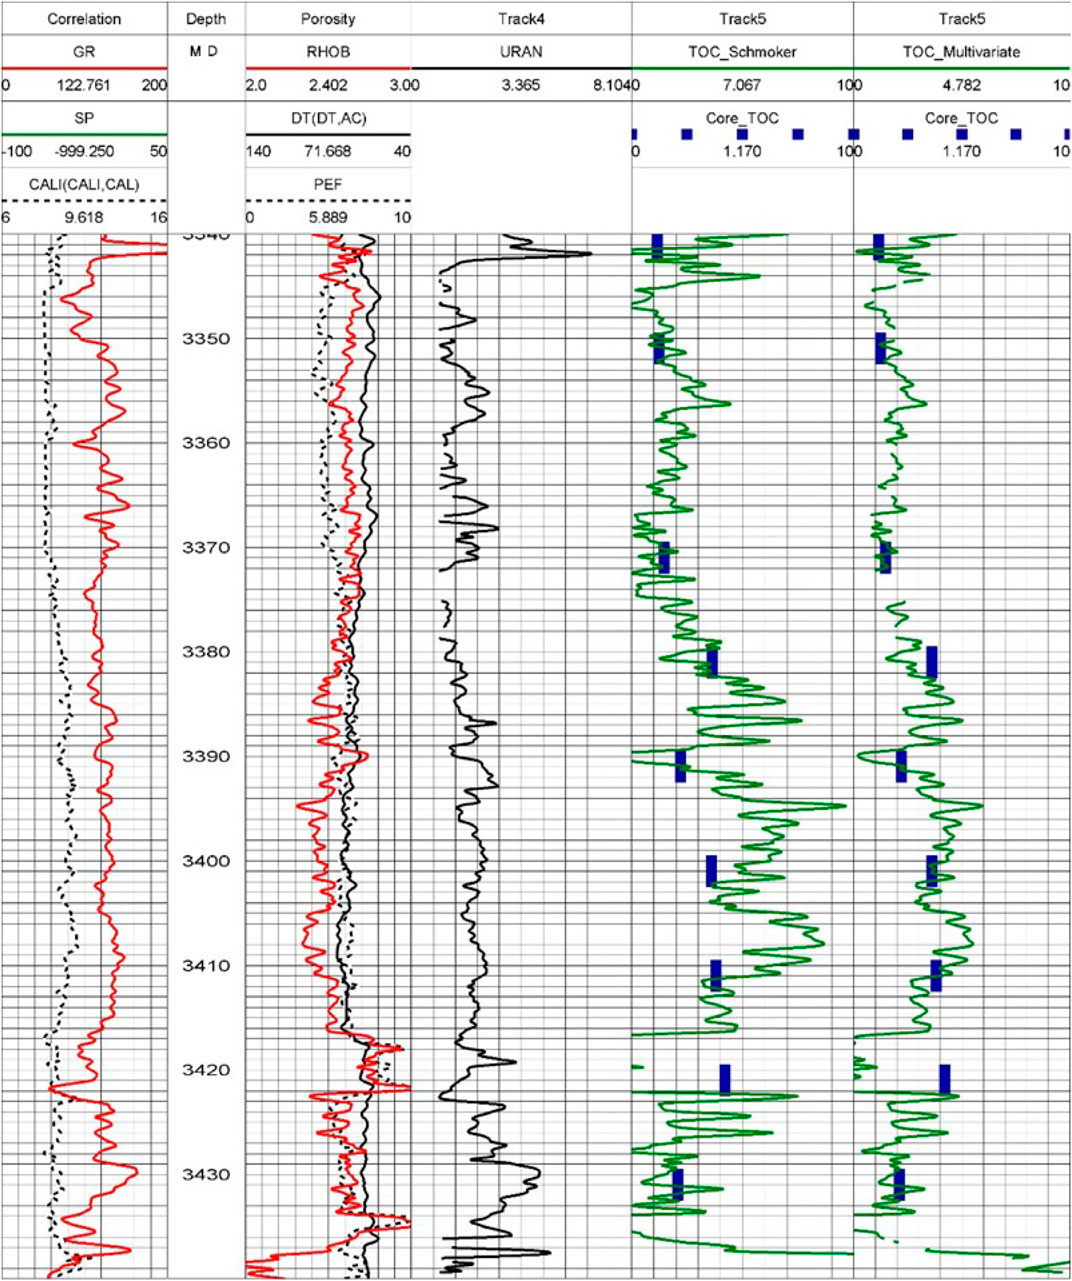
FIGURE 9. Well logs used in the present research and Estimated TOC curves overlay with well cutting TOC of Talhar Shale in Dangi-01 well at depth 3,340–3,432 m.
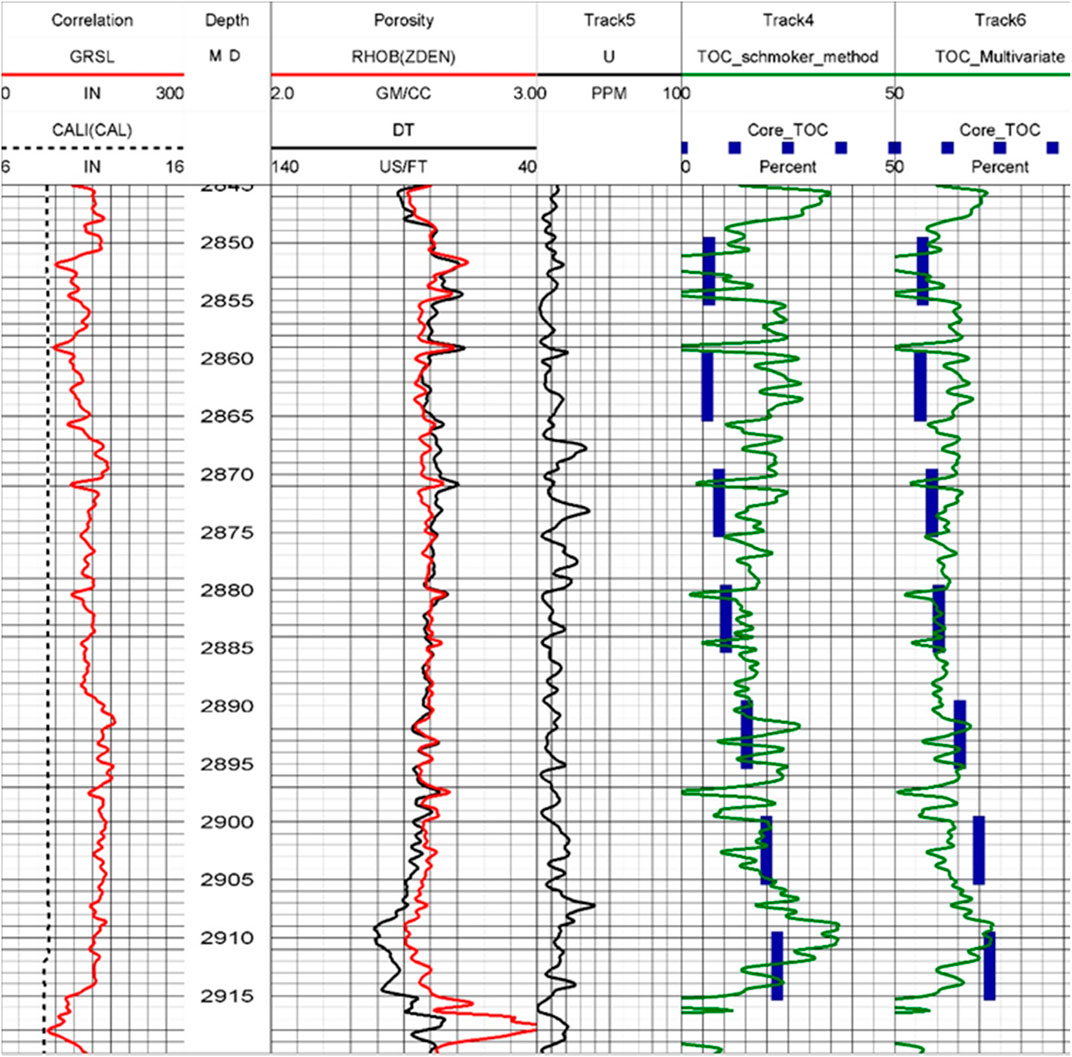
FIGURE 10. Well logs used in the present research and Estimated TOC curves overlay with well cutting TOC of Talhar Shale in Chak7A-01 well at depth 2,850–2,915 m.
Correlation between measured and estimated total organic carbons
After identifying the measured and estimated TOCs, the data is correlated to determine which approach is better for estimating TOC in the absence of well-cutting/core data. The linear equation is derived which provides a value represented by the coefficient of determination (R2).
A correlation was performed for validation of the specific method for the estimation of TOC in Talhar Shale. The result shows that the Multivariate Fitting method has a coefficient of determination of 0.87 and 0.83 with well cutting/core TOC in Dangi-01 and Chak7A-01 wells respectively. Figures 11A,C illustrate the coefficient of determination of well cutting tested TOC and estimated TOC of Dangi-01 and Chak7A-01 wells, respectively, using the Multivariate Fitting approach. The correlation coefficient for the Multivariate Fitting method shows good reliability in both Dangi-01 (0.93) and Chak7A-01 (0.91) wells. The resultant TOC values by multivariate fitting method showed excellent correlation to the TOC measurements and suggested work for Talhar Shale. The coefficient of determination values for Dangi-01 (Figure 11B) and Chak7A-01 (Figure 11D) wells by the Schmoker and Hester method are 0.37 and 0.58, respectively, which is not good enough for a best-fit technique for calculating TOC.
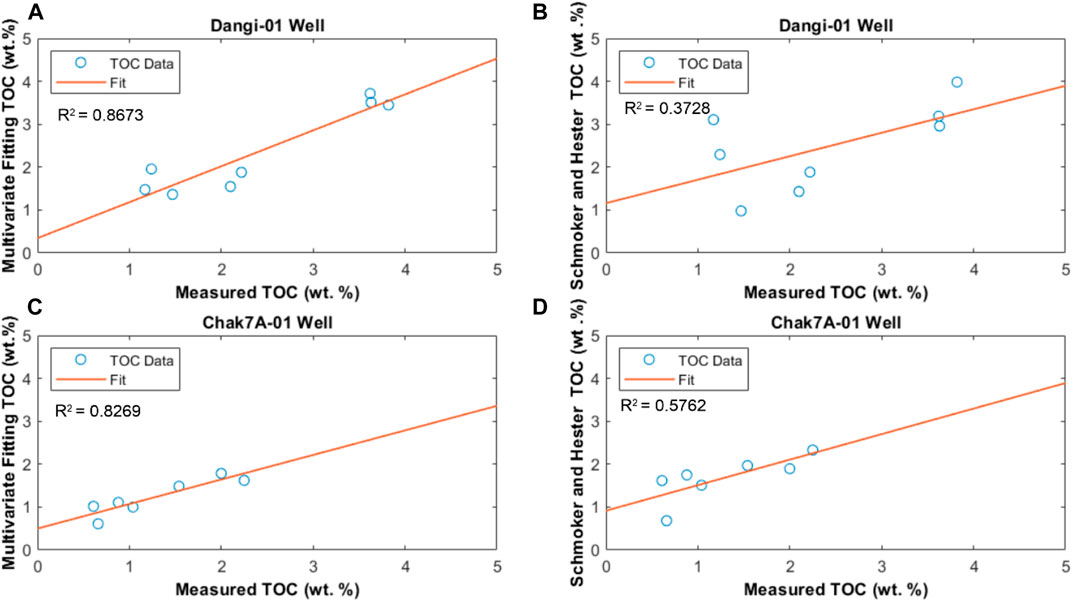
FIGURE 11. Coefficient of determination (R2) of well cutting TOC and estimated TOC of Dangi-01 (A,B) and Chak7A-01 (C,D) wells by Multivariate Fitting method as well as Schmoker and Hester method, respectively.
Conclusion
The well-cuttings sample result of geochemical analysis and well logging data following conclusion has been made:
The organic richness and generation potential values of Talhar Shale samples from the Dangi-01 well are good to very good. Similarly, based on geochemical data, samples from the Chak7A-01 well have a fair to good organic richness and generation potential (GP). In the Dangi-01 well, the Talhar Shale can only generate gas, whereas the Chak7A-01 well can produce both oil and gas. The results of the geochemical investigation suggest that the Talhar Shale is thermally mature and capable of producing hydrocarbons.
On well logging data from the Dangi-01 and Chak7A-01 wells, Schmoker and Hester’s approach was used to estimate TOC, which was then compared to well-cutting TOC, which revealed a poor correlation. As a result, Schmoker and Hester can’t be utilized to determine TOC in the Talhar Shale (Lower Goru Formation). On both well data, the Multivariate Fitting approach was used to estimate TOC, and the correlation of this method is excellent enough to consider it an appropriate method for calculating TOC in the study area when core TOC is not available, i.e., 0.93 and 0.91.
Data availability statement
The original contributions presented in the study are included in the article/Supplementary Material, further inquiries can be directed to the corresponding authors.
Author contributions
All authors contributed to the literature review, methodology, formal analysis, data interpretation, writing, and reviewing of the manuscript.
Funding
Open access funding is provided by UiT The Arctic University of Norway.
Acknowledgments
We thank Directorate General Petroleum Concession (DGPC), Pakistan and for providing Well Logs Data for this research. We greatly acknowledge the Oil and Gas Development Company Limited (OGDCL) Islamabad Pakistan, for providing samples for the study. The authors are also thankful to Oil and Gas Development Company Limited (G and R labs) Islamabad for providing permission to use laboratory facilities. This paper was produced from the MS thesis of HK (First Author) which is submitted to the Higher Education Commission (HEC), Pakistan repository for awarding MS degree.
Conflict of interest
Authors MA and AK were employed by Oil and Gas Development Company Limited.
The remaining authors declare that the research was conducted in the absence of any commercial or financial relationships that could be construed as a potential conflict of interest.
Publisher’s note
All claims expressed in this article are solely those of the authors and do not necessarily represent those of their affiliated organizations, or those of the publisher, the editors and the reviewers. Any product that may be evaluated in this article, or claim that may be made by its manufacturer, is not guaranteed or endorsed by the publisher.
References
Abarghani, A., Ostadhassan, M., Bubach, B., and Zhao, P. (2019). Estimation of thermal maturity in the Bakken source rock from a combination of well logs, North Dakota, USA. Mar. Pet. Geol. 105, 32–44. doi:10.1016/j.marpetgeo.2019.04.005
Abdel-Fattah, M. I., Sen, S., Abuzied, S. M., Abioui, M., Radwan, A. A., and Benssaou, M. (2022). Facies analysis and petrophysical investigation of the late miocene abu madi sandstones gas reservoirs from offshore baltim east field (nile delta, Egypt). Mar. Pet. Geol. 137, 105501. doi:10.1016/j.marpetgeo.2021.105501
Alam, S. M., Wasimuddin, M., and Ahmad, S. S. (2002). “Zaur structure: A complex trap in a poor seismic data area,” in PAPG/SPE annual technical conference (Islamabad, Pakistan: AAPG Search and Discovery Article), 2–4.
Ali, S. H., Abdullatif, O. M., Abioui, M., Bashir, Y., Wahid, A., and Yasin, Q. (2021). Dolomitization and paleoenvironment of deposition of the lower and middle rus formation (early Eocene, dammam dome, eastern Saudi arabia). J. Sediment. Environ. 6 (2), 267–285. doi:10.1007/s43217-021-00057-4
Ali, S. H., and Siddiqui, T. F. (2017). An overview on unconventional gas resources: Future of Pakistan. Bahria Univ. Res. J. Earth Sci. 2 (1), 52–60.
Altowairqi, Y., Rezaee, R., Evans, B., and Urosevic, M. (2015). Shale elastic property relationships as a function of total organic carbon content using synthetic samples. J. Pet. Sci. Eng. 133, 392–400. doi:10.1016/j.petrol.2015.06.028
Ashraf, U., Zhang, H., Anees, A., Ali, M., Zhang, X., Shakeel Abbasi, S., et al. (2020). Controls on reservoir heterogeneity of a shallow-marine reservoir in sawan gas field, SE Pakistan: Implications for reservoir quality prediction using acoustic impedance inversion. Water 12 (11), 2972. doi:10.3390/w12112972
Ashraf, U., Zhang, H., Anees, A., Mangi, H. N., Ali, M., Zhang, X., et al. (2021). A core logging, machine learning and geostatistical modeling interactive approach for subsurface imaging of lenticular geobodies in a clastic depositional system, SE Pakistan. Nat. Resour. Res. 30 (3), 2807–2830. doi:10.1007/s11053-021-09849-x
Ashraf, U., Zhu, P., Yasin, Q., Anees, A., Imraz, M., Mangi, H. N., et al. (2019). Classification of reservoir facies using well log and 3D seismic attributes for prospect evaluation and field development: A case study of sawan gas field, Pakistan. J. Pet. Sci. Eng. 175, 338–351. doi:10.1016/j.petrol.2018.12.060
Aziz, H., Ehsan, M., Ali, A., Khan, H. K., and Khan, A. (2020). Hydrocarbon source rock evaluation and quantification of organic richness from correlation of well logs and geochemical data: A case study from the Sembar Formation, southern Indus Basin, Pakistan. J. Nat. Gas. Sci. Eng. 81, 103433. doi:10.1016/j.jngse.2020.103433
Bender, F. K., and Raza, H. A. (1995). Geology of Pakistan. Stuttgart, Berlin: Gebrüder Borntraeger Verlagsbuchhandlung.
Chopra, S., Sharma, R. K., Keay, J., and Marfurt, K. J. (2012). “Shale gas reservoir characterization workflows,” in SEG technical program expanded abstracts (AAPG) (Las Vegas: Society of Exploration Geophysicists). doi:10.1190/segam2012-1344.1
Dembicki, H. (2016). Practical petroleum geochemistry for exploration and production. Amsterdam: Elsevier.
Ehsan, M., Gu, H., Ahmad, Z., Akhtar, M. M., and Abbasi, S. S. (2019). A modified approach for volumetric evaluation of shaly sand formations from conventional well logs: A case study from the talhar shale, Pakistan. Arab. J. Sci. Eng. 44 (1), 417–428. doi:10.1007/s13369-018-3476-8
Ehsan, M., Gu, H., Akhtar, M. M., Abbasi, S. S., and Ullah, Z. (2018). Identification of hydrocarbon potential of talhar shale: Member of lower Goru Formation using well logs derived parameters, southern lower Indus Basin, Pakistan. J. Earth Sci. 29 (3), 587–593. doi:10.1007/s12583-016-0910-2
Ehsan, M., Gu, H., Ali, A., Akhtar, M. M., Abbasi, S. S., Miraj, M. A. F., et al. (2021). An integrated approach to evaluate the unconventional hydrocarbon generation potential of the lower Goru Formation (cretaceous) in southern lower Indus Basin, Pakistan. J. Earth Syst. Sci. 130 (2), 90. doi:10.1007/s12040-021-01584-4
Ehsan, M., and Gu, H. (2020). An integrated approach for the identification of lithofacies and clay mineralogy through Neuro-Fuzzy, cross plot, and statistical analyses, from well log data. J. Earth Syst. Sci. 129 (1), 101. doi:10.1007/s12040-020-1365-5
EIA (2018). “Hydraulically fractured horizontal wells account for most new oil and natural gas wells,” in Today in energy U.S (Energy Information Administration) (Washington, DC: U.S. Department of Energy).
EIA (2013). Technically recoverable shale oil and shale gas resources: India and Pakistan. Washington, DC: U.S. Department of Energy.
El Nady, M. M., Ramadan, F. S., Hammad, M. M., and Lotfy, N. M. (2015). Evaluation of organic matters, hydrocarbon potential and thermal maturity of source rocks based on geochemical and statistical methods: Case study of source rocks in Ras Gharib oilfield, central Gulf of Suez, Egypt. Egypt. J. Pet. 24 (2), 203–211. doi:10.1016/j.ejpe.2015.05.012
Espitalié, J., Deroo, G., and Marquis, F. (1985). La pyrolyse Rock-Eval et ses applications. Deuxième partie. Rev. Inst. Fr. Pét. 40 (6), 755–784. doi:10.2516/ogst:1985045
Evenick, J. C. (2020). Late Cretaceous (Cenomanian and Turonian) organofacies and TOC maps: Example of leveraging the global rise in public-domain geochemical source rock data. Mar. Pet. Geol. 111, 301–308. doi:10.1016/j.marpetgeo.2019.08.037
Fea, I., Abioui, M., Nabawy, B. S., Jain, S., Bruno, D. Z., Kassem, A. A., et al. (2022). Reservoir quality discrimination of the albian-cenomanian reservoir sequences in the ivorian basin: A lithological and petrophysical study. Geomech. Geophys. Geo-energ. Geo-resour. 8 (1), 1. doi:10.1007/s40948-021-00297-8
Glombitza, C., Mangelsdorf, K., and Horsfield, B. (2009). Maturation related changes in the distribution of ester bound fatty acids and alcohols in a coal series from the New Zealand Coal Band covering diagenetic to catagenetic coalification levels. Org. Geochem. 40 (10), 1063–1073. doi:10.1016/j.orggeochem.2009.07.008
Guangyou, Z., Qiang, J., and Linye, Z. (2003). Using log information to analyse the geochemical characteristics of source rocks in Jiyang depression. Well Log. Technol. 27 (2), 104–109.
Ihsan, S., Fazeelat, T., Imtiaz, F., and Nazir, A. (2022). Geochemical characteristics and hydrocarbon potential of cretaceous upper shale unit, lower Indus Basin, Pakistan. Pet. Sci. Technol. 40 (3), 257–269. doi:10.1080/10916466.2021.1993913
Imtiaz, F., Fazeelat, T., Nazir, A., and Ihsan, S. (2017). Geochemical characterization of sediments samples of Sembar Formation from three different wells of Southern Indus Basin. Pet. Sci. Technol. 35 (7), 633–640. doi:10.1080/10916466.2016.1274757
Jarvie, D. M., Jarvie, B. M., Weldon, W. D., and Maende, A. (2015). “Geochemical assessment of in situ petroleum in unconventional resource systems,” in Unconventional resources technology conference (San Antonio, Texas: Unconventional Resources Technology), 2020p–22.
Jarvie, D. M. (2012). “Shale resource systems for oil and gas: Part 2—shale-oil resource systems,” in Shale reservoirs—giant resources for the 21st century. Editor J. A. Breyer (Tulsa, Oklahoma: AAPG Memoir), 69–87.
Kamali, M. R., and Allah Mirshady, A. (2004). Total organic carbon content determined from well logs using ΔlogR and neuro fuzzy techniques. J. Pet. Sci. Eng. 45 (3-4), 141–148. doi:10.1016/j.petrol.2004.08.005
Kassem, A. A., Hussein, W. S., Radwan, A. E., Anani, N., Abioui, M., Jain, S., et al. (2021a). Petrographic and diagenetic study of siliciclastic jurassic sediments from the northeastern margin of africa: Implication for reservoir quality. J. Pet. Sci. Eng. 200, 108340. doi:10.1016/j.petrol.2020.108340
Kassem, A. A., Sen, S., Radwan, A. E., Kassem, W. A., and Abioui, M. (2021b). Effect of depletion and fluid injection in the mesozoic and paleozoic sandstone reservoirs of the october oil field, central gulf of suez basin: Implications on drilling, production and reservoir stability. Nat. Resour. Res. 30 (3), 2587–2606. doi:10.1007/s11053-021-09830-8
Kemal, A., Balkwill, H., and Stoakes, F. (1992). “Indus Basin hydrocarbon plays,” in New directions and strategies for accelerating petroleum exploration and production in Pakistan. Editors G. Ahmed, A. Kemal, A. S. H. Zaman, and M. Humayon (Islamabad: Ministry of Petroleum and Natural Resources), 6–105.
Khan, M. R., Iqbal, M., Ahmad, A., Murtaza, G., and Khan, W. A. (2013). “An integrated approach for assessment of lower Goru reservoir quality in western part of badin area, lower Indus Basin, Pakistan,” in PAPG/SPE annual technical conference (Islamabad, Pakistan: Search and Discovery Article), 26–27.
Leila, M., Sen, S., Abioui, M., and Moscariello, A. (2021). Investigation of pore pressure, in-situ stress state and borehole stability in the West and South Al-Khilala hydrocarbon fields, Nile Delta, Egypt. Geomech. Geophys. Geo-energ. Geo-resour. 7 (3), 56. doi:10.1007/s40948-021-00256-3
Mahmoud, A. A., Elkatatny, S., Ali, A. Z., Abouelresh, M., and Abdulraheem, A. (2019). Evaluation of the total organic carbon (TOC) using different artificial intelligence techniques. Sustainability 11 (20), 5643. doi:10.3390/su11205643
Mao, Z.-Q. (2001). The physical dependence and the correlation characteristics of density and neutron logs. Petrophysics 42 (5), 438–443.
McGlade, C., Speirs, J., and Sorrell, S. (2013). Unconventional gas–a review of regional and global resource estimates. Energy 55, 571–584. doi:10.1016/j.energy.2013.01.048
Montgomery, S. L., Jarvie, D. M., Bowker, K. A., and Pollastro, R. M. (2005). Mississippian Barnett Shale, Fort Worth basin, north-central Texas: Gas-shale play with multi-trillion cubic foot potential. Am. Assoc. Pet. Geol. Bull. 89 (2), 155–175. doi:10.1306/09170404042
Nazir, A., Fazeelat, T., and Asif, M. (2015). Petroleum geochemistry of lower Indus Basin, Pakistan: II. Oil-Oil and oil-source rock correlation. Pet. Sci. Technol. 33 (12), 1295–1304. doi:10.1080/10916466.2015.1060502
Nazir, A., Fazeelat, T., and Asif, M. (2012). The geochemical characterization of sediments from early cretaceous sembar formation. Pet. Sci. Technol. 30 (23), 2460–2470. doi:10.1080/10916466.2010.519756
Nazir, A., and Fazeelat, T. (2017). Geochemical characterization of cretaceous sediments—sindh basin, Pakistan. Energ. Source Part A Recovery Util. Environ. Eff. 39 (4), 406–413. doi:10.1080/15567036.2016.1219791
Nazir, A., and Fazeelat, T. (2016). Hydrocarbon potential of cretaceous sediments from lower Indus Basin, Pakistan. Energ. Source Part A Recovery Util. Environ. Eff. 38 (23), 3504–3513. doi:10.1080/15567036.2016.1193570
Nazir, A., and Fazeelat, T. (2014). Petroleum geochemistry of lower Indus Basin, Pakistan: I. Geochemical interpretation and origin of crude oils. J. Petroleum Sci. Eng. 122, 173–179. doi:10.1016/j.petrol.2014.07.008
Nazir, A., Iqbal, M., Siddique, A., and Ahmed, W. (2020). Evaluation of source, depositional environment, thermal maturity and biodegradation of organic matter from Kohat-Potwar Basin, Pakistan. Pet. Sci. Technol. 38 (2), 106–115. doi:10.1080/10916466.2019.1684946
Passey, Q., Creaney, S., Kulla, J., Moretti, F., and Stroud, J. (1990). A practical model for organic richness from porosity and resistivity logs. Am. Assoc. Pet. Geol. Bull. 74 (12), 1777–1794. doi:10.1306/0C9B25C9-1710-11D7-8645000102C1865D
Passey, Q. R., Bohacs, K., Esch, W. L., Klimentidis, R., and Sinha, S. (2010). “From oil-prone source rock to gas-producing shale reservoir–geologic and petrophysical characterization of unconventional shale-gas reservoirs,” in International Oil and Gas Conference and Exhibition in China, 8-10 June 2010 (Beijing, China: OnePetro). doi:10.2118/131350-MS
Peters, K. E., and Cassa, M. R. (1994). “Applied source rock geochemistry,” in The petroleum system: From source to trap. Editors L. B. Magoon, and W. G. Dow (Tulsa, Oklahoma: AAPG Memoir), 93–120.
Renchun, H., Wang, Y., Cheng, S., Liu, S., and Cheng, L. (2015). Selection of logging-based TOC calculation methods for shale reservoirs: A case study of the jiaoshiba shale gas field in the sichuan basin. Nat. Gas. Ind. B 2 (2-3), 155–161. doi:10.1016/j.ngib.2015.07.004
Ross, D. J. K., and Marc Bustin, R. (2007). Impact of mass balance calculations on adsorption capacities in microporous shale gas reservoirs. Fuel 86 (17), 2696–2706. doi:10.1016/j.fuel.2007.02.036
Schmoker, J. W. (1979). Determination of organic content of appalachian devonian shales from formation-density logs: Geologic notes. Am. Assoc. Pet. Geol. Bull. 63 (9), 1504–1509. doi:10.1306/2F9185D1-16CE-11D7-8645000102C1865D
Schmoker, J. W. (1981). Determination of organic-matter content of Appalachian Devonian shales from gamma-ray logs. Am. Assoc. Pet. Geol. Bull. 65 (7), 1285–1298. doi:10.1306/03B5949A-16D1-11D7-8645000102C1865D
Schmoker, J. W., and Hester, T. C. (1983). Organic carbon in Bakken formation, United States portion of Williston basin. Am. Assoc. Pet. Geol. Bull. 67 (12), 2165–2174. doi:10.1306/AD460931-16F7-11D7-8645000102C1865D
Sen, S., Abioui, M., Ganguli, S. S., Elsheikh, A., Debnath, A., Benssaou, M., et al. (2021). Petrophysical heterogeneity of the early Cretaceous Alamein dolomite reservoir from North Razzak oil field, Egypt integrating well logs, core measurements, and machine learning approach. Fuel 306, 121698. doi:10.1016/j.fuel.2021.121698
Shukla, P., Kumar, V., Curtis, M., Sondergeld, C. H., and Rai, C. S. (2013). “Nanoindentation studies on shales,” in 47th US Rock Mechanics/Geomechanics Symposium, 23-26 June 2013 (San Francisco, California: ARMA-2013-578).
Sondergeld, C. H., Newsham, K. E., Comisky, J. T., Rice, M. C., and Rai, C. S. (2010). “Petrophysical considerations in evaluating and producing shale gas resources,” in SPE Unconventional Gas Conference, February 2010 (Pennsylvania, USA: OnePetro). doi:10.2118/131768-MS
Sone, H., and Zoback, M. D. (2013). Mechanical properties of shale-gas reservoir rocks—Part 1: Static and dynamic elastic properties and anisotropy. Geophysics 78 (5), D381–D392. doi:10.1190/geo2013-0050.1
Tissot, B. P., and Welte, D. H. (1984). Petroleum formation and occurrence. 2nd edn. New York: Springer-Verlag.
Wandrey, C. J., Law, B., and Shah, H. A. (2004). “Sembar Goru/Ghazij composite total petroleum system, Indus and Sulaiman-Kirthar geologic provinces, Pakistan and India,” in Petroleum systems and related geologic studies in region 8, south asia. Editor C. J. Wandrey (Reston, Virginie: US Geological Survey), 1–23.
Wang, H., Wu, W., Chen, T., Dong, X., and Wang, G. (2019). An improved neural network for TOC, S1 and S2 estimation based on conventional well logs. J. Pet. Sci. Eng. 176, 664–678. doi:10.1016/j.petrol.2019.01.096
Wang, J., Luo, H., Liu, H., Lin, J., Li, L., and Lin, W. (2016). Influences of adsorption/desorption of shale gas on the apparent properties of matrix pores. Petroleum Explor. Dev. 43 (1), 158–165. doi:10.1016/S1876-3804(16)30019-2
Yang, X., Yang, Z., Xie, B., Xie, G., and Zhang, Z. (2012). Log interpretation and evaluation of shale gas reservoirs. Nat. Gas. Ind. 32 (9), 33–36. doi:10.3787/j.issn.1000-0976.2012.09.007
Yanran, H., Zhenhui, X., Li, D., Ye, Y., and Taotao, C. (2019). Mathematical modeling for total organic carbon content prediction with logging parameters by neural networks: A case study of shale gas well in south China. Interpretation 7 (2), T283–T292. doi:10.1190/INT-2018-0134.1
Yu, H., Rezaee, R., Wang, Z., Han, T., Zhang, Y., Arif, M., et al. (2017). A new method for TOC estimation in tight shale gas reservoirs. Int. J. Coal Geol. 179, 269–277. doi:10.1016/j.coal.2017.06.011
Zaigham, N. A., and Mallick, K. A. (2000). Prospect of hydrocarbon associated with fossil-rift structures of the southern Indus basin, Pakistan. Am. Assoc. Pet. Geol. Bull. 84 (11), 1833–1848. doi:10.1306/8626C3A7-173B-11D7-8645000102C1865D
Zhang, T., Ellis, G. S., Ruppel, S. C., Milliken, K., and Yang, R. (2012). Effect of organic-matter type and thermal maturity on methane adsorption in shale-gas systems. Org. Geochem. 47, 120–131. doi:10.1016/j.orggeochem.2012.03.012
Keywords: total organic carbon (TOC) content, organic richness, thermal maturity, logging data, Schmoker and Hester’s method, multivariate fitting method
Citation: Khalil Khan H, Ehsan M, Ali A, Amer MA, Aziz H, Khan A, Bashir Y, Abu-Alam T and Abioui M (2022) Source rock geochemical assessment and estimation of TOC using well logs and geochemical data of Talhar Shale, Southern Indus Basin, Pakistan. Front. Earth Sci. 10:969936. doi: 10.3389/feart.2022.969936
Received: 15 June 2022; Accepted: 10 August 2022;
Published: 01 September 2022.
Edited by:
Yihuai Zhang, Imperial College London, United KingdomCopyright © 2022 Khalil Khan, Ehsan, Ali, Amer, Aziz, Khan, Bashir, Abu-Alam and Abioui. This is an open-access article distributed under the terms of the Creative Commons Attribution License (CC BY). The use, distribution or reproduction in other forums is permitted, provided the original author(s) and the copyright owner(s) are credited and that the original publication in this journal is cited, in accordance with accepted academic practice. No use, distribution or reproduction is permitted which does not comply with these terms.
*Correspondence: Muhsan Ehsan, bXVoc2FuZWhzYW45OEBob3RtYWlsLmNvbQ==; Tamer Abu-Alam, dGFtZXIuYWJ1LWFsYW1AdWl0Lm5v
 Humayun Khalil Khan1
 Muhsan Ehsan
 Abid Ali
 Tamer Abu-Alam
 Mohamed Abioui