 Anne Obermann1*
 Sin-Mei Wu1
 Thorbjörg Ágústsdóttir2
 Alejandro Duran1
 Tobias Diehl1
 Pilar Sánchez-Pastor1Sigridur Kristjansdóttir2,3
 Vala Hjörleifsdóttir4Stefan Wiemer1Gylfi Páll Hersir5
- 1Swiss Seismological Service ETH Zurich, Zurich, Switzerland
- 2ÍSOR Iceland GeoSurvey Reykjavìk, Reykjavìk, Iceland
- 3IMO Icelandic Meteorological Office, Reykjavìk, Iceland
- 4Reykjavìk Energy (OR), Reykjavìk, Iceland
- 5Retired, Reykjavik, Iceland
We image shallow crustal structures and analyze seismicity patterns in the Hengill high-enthalpy geothermal area in SW Iceland, exploiting a temporary densification of the seismic network 2018 to 2020. Using a subset of 6,300 high-quality manually picked P- and S-phases, we compute a minimum 1-D model for the region. Our results suggest that the most consistent and accurate hypocenter locations are derived from a joint inversion of P and S arrival times for the Hengill area. We demonstrate that this minimum 1-D model in combination with SeisComP detection and location algorithms can be used to produce fully-automated yet high-quality earthquake catalogs. Our analysis established that both the induced and natural seismicity in the Hengill area occurs in several distinct, spatially constrained clusters. In production and injection areas, the depth of the clusters is at about 2 km, near the bottom of the production and injection wells. These are most likely triggered by the injection and induced by the production, respectively. Outside of these clusters, the seismicity is generally deeper, with the depth of the deepest seismicity indicating the brittle-ductile transition zone. This zone is encountered at about 4 km near the center of the Hengill volcanic area and deepens with increasing distance from its volcanic center, to about 7 km in the southernmost region. A spatial analysis of b-values shows slightly increased values in areas with numerous injection wells and slightly decreased values in production areas. Three-dimensional crustal imaging of VP, VS, VP/VS shows a SE-NW trending fast velocity that extends, at 1–3 km depth between the extinct Grensdalur volcanic center and the presently active Hengill volcanic center. The fastest velocities are found in the NW corner of the Grensdalur volcanic center coinciding with a gravity high and probably reflecting dense solidified magmatic intrusion(s). This trend coincides with traces of geothermal surface manifestations, a shallow lying low resistivity anomaly and an aero-magnetic low. All these anomalies are caused by high temperature at some point in the geological history of the area and are most likely due to migration of the crustal accretion and volcanic activity between the two volcanic centers. Below-average VP/VS ratios at similar depth, coincide with the main production field. We suggest that this anomaly is caused by the extensive fluid extraction, which lowers the pore-pressure in the field and consequently increases the steam dominated zone, leading to lower Vp/Vs ratios. Most of the earthquakes are within the Vp/Vs low and at the boundary of the high and low Vp/Vs anomalies, which might indicate a region of good permeability.
1 Introduction
The Hengill volcano and associated geothermal fields cover 110 km2 and are Iceland’s largest utilized high-enthalpy geothermal area. Three known volcanic systems are in the area (Figure 1A), each composed of a central volcano and intersecting fault swarm characterized by hyaloclastite ridges. The Hengill system is the youngest one, intersected by a swarm of young crater rows, fissures and faults. The Hveragerði or Grensdalur central volcano and the Hrómundartindur system are underlain by solidifying magma chambers within the crust which maintain the geothermal fields (Sæmundsson, 1967; Árnason et al., 1986, 1987). The Hengill area is located about 30 km east of Reykjavík (Figure 1B), at the triple junction of three segments of the N-America-Eurasia plate boundary: The Western Volcanic Zone (WVZ), the South Icelandic Seismic Zone (SISZ), and the Reykjanes Peninsula Oblique Rift (RP) (Figure 1C). This location results in the regional abundance of seismic, volcanic and geothermal activity. The seismicity is grouped into several clusters dispersed over the whole Hengill area, with both natural and induced seismicity observed. Seismic activity was very high from 1994–1999 likely due to a magmatic intrusion (Sigmundsson et al., 1997; Feigl et al., 2000; Pedersen et al., 2007). Even though seismicity in the area remains high, it has not reached comparable rates since the 90s.
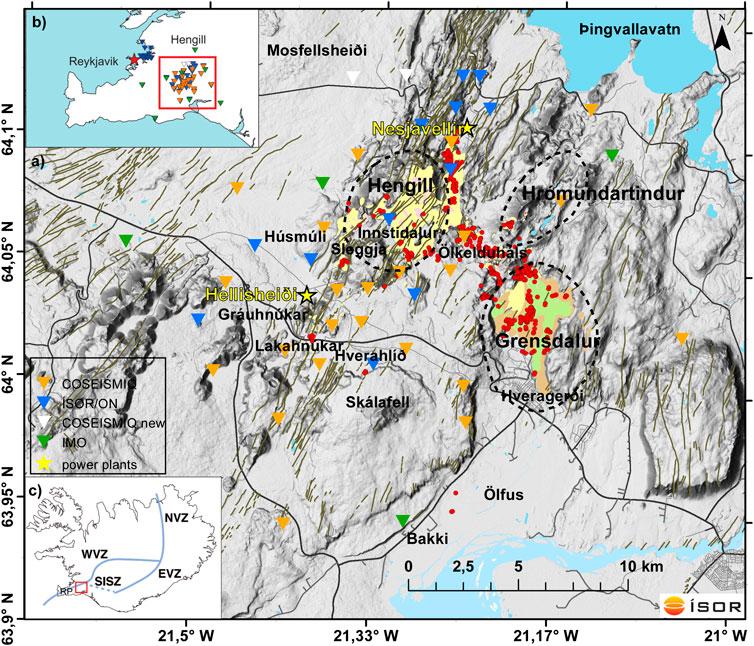
FIGURE 1. (A) The Hengill high-temperature geothermal area including the location of all names that appear in this paper overlaid on a topographic map. Seismic stations from the permanent OR (blue) and VI (green) networks and the temporary 2C network (orange) are shown as inverted triangles. White triangles are late deployed 2C stations that are not included in the tomographic analysis. Red dots are fumaroles; regions with surface geothermal alteration are shown in yellow (Sæmundsson et al., 2016). Black dotted lines mark the three volcanic centers (Árnason et al., 1986). Fault and fractures are shown in grey (Sæmundsson et al., 2016), roads as black lines and yellow stars are the power plants at Hellisheiði (south) and Nesjavellir (north). The inset figures show (B) a zoom into the study area giving an overview of the extended seismic network and in (C) the location of the study area in the Hengill volcanic complex (red rectangle) at the triple junction of the Western Volcanic Zone (WVZ), the South Icelandic Seismic Zone (SISZ), and the Reykjanes Peninsula Oblique Rift (RP).
Surface expressions of the geothermal activity are observed in the form of hydrothermal alterations, hot springs and fumaroles (red dots, Figure 1). The first extensive surface exploration studies in Hengill were performed in 1947–1949, followed by drilling eight deep wells in Hveragerði, the extinct and exhumed volcanic center to the southeast of Hengill (also referred to as Grensdalur). Geological mapping was carried out in the 1960s (Sæmundsson, 1967). Later various surface exploration studies were carried out by the National Energy Authority of Iceland, Reykjavík Energy, University of Iceland and individuals including geochemistry, geology, resistivity, gravity, aero-magnetics, hydrology and seismic studies (Björnsson and Hersir, 1981; Björnsson et al., 1986; Hersir et al., 1990 and references therein). Extensive surface exploration studies in the northeast part of Hengill, the Nesjavellir and Ölkelduháls high-temperature sub-areas were performed in 1985–1986 including detailed geological mapping, gravity and resistivity measurements (Árnason et al., 1986, 1987). More recently 3D inversion of MT resistivity data has been published (Árnason et al., 2010; Benediktsdóttir et al., 2021).
Currently, the two largest power plants in Iceland, and some of the biggest in the world (Paulillo et al., 2019) are operated in the Hengill area by ON Power, a subsidiary of OR-Reykjavík Energy: The Nesjavellir plant to the north (120 MWe, 350 MWt) commissioned in 1990 and the Hellisheiði plant to the southwest of the volcano (303 MWe, 210 MWt), commissioned in 2006 (yellow stars on Figure 1A). Very powerful wells have been drilled in the Hverahlíð area, indicating reservoir temperature in the range of 270–320°C and an enthalpy between 1,350 and 1700 kJ/kg (Biru, 2020).
Over the past decades, the Hengill volcanic complex has been studied with different geophysical methods. A Bouguer gravity map and an aeromagnetic map have been published and interpreted qualitatively (Björnsson et al., 1986; Hersir et al., 1990). GPS and satellite images have been used to observe surface deformation related to pressure changes in geothermal reservoirs (e.g., Budzinska, 2014; Juncu et al., 2017; Ducrocq et al., 2021). Surface faults are defined from field mapping and aerial photographs (e.g., Sæmundsson, 1992; Clifton et al., 2002; Sæmundsson et al., 2016). Resistivity methods have identified a shallow up-doming low resistivity layer, in the uppermost 1 km of the crust, related to smectite; a low temperature hydrothermal alteration mineral forming at 100–230°C (Árnason et al., 1986, 1987; Hersir et al., 1990; Árnason et al., 2010; Benediktsdóttir et al., 2021). Beneath this conductive clay cap, a high-resistivity core is associated with high-temperature alteration minerals (chlorite, epidote; formed at temperature >230°C). A deep conductive layer is observed in most, but not all, of the area (Árnason et al., 2010; Benediktsdóttir et al., 2021). The layer is shallow under and around the Hengill volcano (∼3 km), stretching to the southeast. The anomaly is about 3.5 km wide and correlates well with a relatively positive residual Bouguer gravity anomaly reflecting high density at depth (Hersir et al., 1990). The deep conductor is believed to be due to hot solidified intrusions, related to the heat sources for the geothermal system above (Árnason et al., 2010).
Several local earthquake tomography studies have been performed in this region (Foulger, 1984; Foulger and Toomey, 1989; Toomey and Foulger, 1989; Foulger and Miller 1995; Miller et al., 1998; Tryggvason et al., 2002; Jousset et al., 2011; Wagner, 2019), revealing the main structures of the volcanic complex. These studies found positive Vp and Vs anomalies and low Vp/Vs ratios beneath the central volcanoes at shallow depth (around 0–2 km), interpreted as solidified magmatic intrusions. Close to the surface, high Vp and low Vp/Vs anomalies correlate well with geothermal surface manifestation such as steaming ground, hot and boiling springs, hydrothermal clay alteration at different temperatures, and travertine deposits (Wagner, 2019).
Tryggvason et al., 2002 additionally found large low velocity anomalies at 4–10 km depth below the Hengill volcanic center (for both P- and S-waves) - interpreted as the presence of supercritical fluid, meteoric water and fluids of magmatic origin within a heavily fractured volcanic fissure system (not due to partial melt as the reduction of P-wave velocity is larger than for the S-waves). They are confident that no magma chamber exists in the Hengill area according to their data. A different explanation could be the presence of steam (Husen et al., 2004). However, the resolution of these studies does not allow to unambiguously determine the shape of the intrusions. Furthermore, Tryggvason et al., 2002 did not observe the low Vp/Vs ratio that could indicate supercritical water (for pure water T > 374°C at about 221 bar pressure) until at 3–4 km depth. Borehole measurements show 200–300°C (subcritical) at 1–2 km depth. A joint interpretation of seismic velocity anomalies, Vp/Vs ratios, gravity and resistivity anomalies hint at the existence of hot, solidified intrusions at around 3 km depth that are the heat source for the geothermal system (Árnason et al., 2010; Jousset et al., 2011).
From October 2018 to July 2021, the permanent seismic network in the Hengill area consisting of 15 stations was temporarily densified with 23 additional seismic stations, as part of the EU funded project COntrol SEISmicity and Manage Induced earthQuakes (COSEISMIQ, http://www.coseismiq.ethz.ch/en/home/). During this period, a total of 38 stations were operating in the Hengill area. In this study, we first estimate the absolute 1-D and 3-D P- and S-wave velocity models of the area, using the local seismic network of the COSEISMIQ project by computing a local earthquake tomography.
We observe a strong impact of the strong ocean-generated microseisms on magnitude estimations for events with ML<1.0 and propose a correction procedure. Then, we implement the 1-D velocity models and the improved magnitude estimation in a state-of-the-art automatic detection and location procedure (Grigoli et al., 2022), to provide a consistent catalog of the seismicity in the Hengill region. This procedure results in accurate absolute and high-precision relative hypocenter locations. We jointly interpret the subsurface velocity structure and the spatio-temporal distribution of seismicity and associated b-values across the Hengill area. Finally, we compare our results with other published geophysical data sets in the area.
2 The Hengill volcano and associated geothermal fields
2.1 Geology
The youngest volcanic system in the Hengill region is the Hengill volcanic system (803 m a.s.l). It is dissected by an array of fissures and normal faults crossing with a strike of N30°E (Sæmundsson, 1992), reaching into Lake Þingvallavatn to the north, see Figure 1. It last erupted around 5,000 and 2,000 years ago (Sæmundsson, 1967) and consists of several small shield volcanoes occupying the Hengill fissure swarm. Hrómundartindur (540 m a.s.l.) is a small volcanic system located south of Lake Þingvallavatn and immediately east of the Hengill volcanic system (Figure 1A). Hrómundartindur was last active about 11,000 years ago, and displays vigorous geothermal activity at the Ölkelduháls geothermal field (Árnason et al., 1987). Grensdalur (497 m a.s.), furthest to the southeast, is the oldest of the three volcanic systems in the Hengill region and was last active during the Pleistocene (Sæmundsson, 1967).
The Hengill region is characterized by highly fractured basaltic rocks dating from 0.12 Myr to 11,500 yr (Sæmundsson et al., 2016) and relatively shallow cooling magmatic intrusions, which are the energy source of its geothermal activity. In the central part of the region (around −21.4°W, 64.03°N), basaltic and intermediate lavas range from 11,000 to 11,500 years. In the northeast (around−21.1°W, 64.05°N) there are basaltic and intermediate hyaloclastite, pillow lava and associated sediments with an older age, dating to 0.12–0.8 Myr (Sæmundsson et al., 2016). Hyaloclastite formed during glacial times at Hrómundartindur and Hengill volcanoes are in large part uneroded (Sæmundsson, 1967). The triple junction of RP, WVZ, and SISZ, where the Hengill volcano is located, promotes the rise of magma pulses and associated heat, resulting in local temperatures of up to 200°C at 500 m depth and 320°C at 1 km depth (Franzson et al., 2010), falling within the range of high-temperature geothermal systems, according to the definition of Bödvarsson et al., 1999.
2.2 Seismicity
The Hengill area is also characterized by elevated seismic and geothermal activity. Episodes of increased seismic activity were observed 1952–1955, culminating in a magnitude 5.5 earthquake in 1955, and in 1994–1999 (Rögnvaldsson et al., 1998; Feigl et al., 2000). The activity in the 1990s was recorded on the newly installed national seismic network (SIL) (Stefánsson et al., 1993; Böðvarsson et al., 1999; Jakobsdóttir, 2008). From 1994–1999 the activity was mainly concentrated around the Hrómundartindur region (Figure 1) but increased activity was also observed in Ölfus, about 15 km to the south of Hrómundartindur, and on faults in between the two. The seismicity outlined several fault lines striking NNE-SSW and ENE-WSW (Vogfjörð et al., 2012; Li et al., 2019; Parameswaran et al., 2020). Some earthquakes were also recorded in Húsmúli (H1), Nesjavellir (H4) and Hverahlíð (H2). The seismic episode in the 90s was likely triggered by a minor magmatic intrusion at 7 km depth, just south of the Hrómundartindur volcano (Feigl et al., 2000; Pedersen et al., 2007). An older seismic survey carried out in the summer of 1981, revealed a pattern of seismicity also concentrated around Hrómundartindur (Foulger, 1984). In addition, Foulger (1984) also observed smaller swarms of activity south of Skálafell in Ölfus, Nesjavellir, Hverahlíð and Mosfellsheiði. This survey reveals that already prior to the harnessing of geothermal energy, which extensively started in the nineties, the seismicity tends to occur in clusters. This is one of the characteristic features of the seismicity in the Hengill area, observed in e.g. Foulger and Toomey. (1989), Ágústsson and Halldórsson (2005).
From 2010–2020 the Icelandic Meteorological Office recorded on average 2,300 events per year, spanning magnitudes up to 4.6, with a rough completeness of 0.5.
3 Earthquake data and methodology
3.1 Seismic network
The permanent seismic network in the Hengill area consists of 10 stations operated by the Iceland GeoSurvey (ÍSOR) for ON Power (FDSN network code OR, 10.7914/SN/OR), and 5 stations from the countrywide hazard monitoring network of the Icelandic Meteorological Office (IMO) (FDSN network code VI). The ON/ÍSOR stations are 1 Hz short period instruments (Lennartz LE-3DliteMKIll) and the IMO stations are 5 s Lennartz LE-3D. From October 2018 to July 2021, the permanent seismic network in the Hengill area was temporarily densified with additional 23 mainly broadband stations (Figure 1B, ten 120 s STS-2, five 30 s Guralp 6D and eight 5 s Lennartz LE-3D seismometers; FSDN network code 2C, 10.12686/sed/networks/2c). The sensors were deployed according to ÍSOR standards and placed in insulated barrels with a cement base at a depth of about 50 cm. The seismic data were transmitted in real-time. Each site was equipped with a power and telecommunication mast holding two solar panels and a windmill at 50 m distance from the vault. The majority of stations operated with a sampling rate of 200 sps, with a handful at 100 sps (VI network). The COSEISMIQ network is described in more detail in Grigoli et al., 2022 and Obermann et al., 2022.
3.2 Event detection and location algorithms
In order to create an automatically generated but quality event catalog we used the SeisComP approach of Grigoli et al. (2022). The association of automatically picked phases and corresponding event detection is performed with the waveform-based SeisComP module SCANLOC (e.g., Grigoli et al., 2018), while a refined absolute location is derived with the SCRELOC module as described by Grigoli et al. (2022). This module makes use of the probabilistic NonLinLoc location algorithm (Lomax et al., 2000, 2014), combined with minimum 1-D velocity models (e.g., Kissling, 1988; Kissling et al., 1994). A challenge in the case of automated catalogs is to identify poor locations, intense earthquake swarms or even false detections. A quality score was therefore designed for the automatic catalog that combines multiple key parameters of the event origin, such as the azimuthal gap; the number of P- and S-phases, the distribution of arrival-time residuals and the origin RMS (see Grigoli et al., 2022 for details). To further improve the precision of the automatic locations, we add as a post-processing step, a double-difference relocation of the entire automatic catalog as described by Grigoli et al. (2022). Our final catalog is the High-Quality (HQ) automatic catalog fulfilling the high-quality criteria (SED-HQ catalog; RMS <0.09 s, azimuthal gap <180°, number observations per event ≥10 and an event quality score >-1, Grigoli et al., 2022).
We then compare the performance of the HQ catalog with the routinely computed catalog from ÍSOR (Figure 2A). ÍSOR uses a standard pick-based SeisComP monitoring system for the automatic detection and location of earthquakes in real time. All automatic locations are subsequently manually revised. With the manual revision, ÍSOR cleans the catalog of erroneous triggers and detections. Double-difference locations are not performed, unless requested by OR. Within the COSEISMIQ project, the existing ON/ÍSOR automated monitoring system was improved and fine-tuned for the local seismicity in the Hengill area in a similar way as Grigoli et al., 2022. In early 2020, ÍSOR implemented the SCANLOC profile of Grigoli et al. (2022), for improved event detection. Since the termination of the COSEISMIQ project ÍSOR has further tuned and developed their internal monitoring system for each of their geothermal areas, for example with unique SCANLOC profiles for each area.
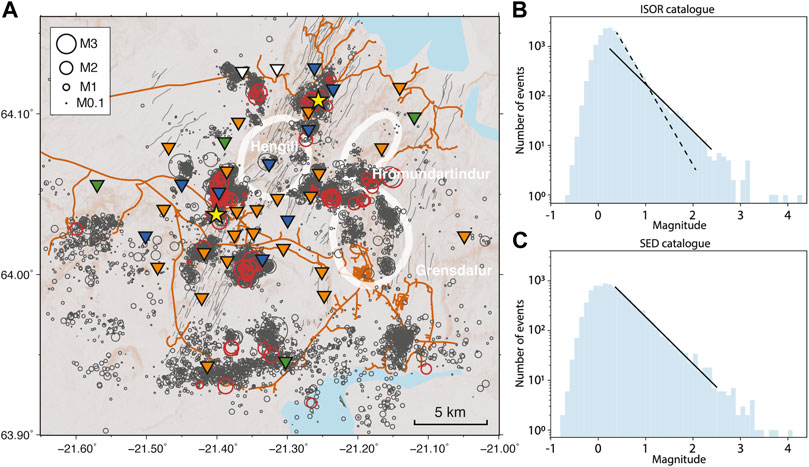
FIGURE 2. (A) Seismic network and seismicity across the Hengill high-temperature geothermal area. From December 2018 to January 2021, about 15,640 earthquakes were reported by ÍSOR (gray circles), forming several clusters. The thin gray lines in the SW-NE direction represent fissures (Sæmundsson et al., 2016) and the orange lines delineate the main roads. The red events are used to compute the travel-time tomography. The white lines mark the three major volcanic centers. Richter local magnitude (ML) distribution of the ÍSOR (B) and SED-HQ (C) catalogs. The lines indicate the b-value(s) that result from the distribution. The ÍSOR catalog shows a bias of ML for events <1.0 introduced by the strong microseisms that can be mitigated with an additional band-pass filter (C).
During October 2018-January 2021 ÍSOR reported a total of 15,640 events in the Hengill region (Figure 2A), 87 of them with local magnitudes (ML) larger than 2.0. Our automatic detection and location procedure found 12,423 events, out of which about 8,704 fulfilled the high-quality criteria and 134 have ML larger than 2.0.
3.3 Consistent micro-seismic magnitude estimation
Iceland is surrounded by strong atmospheric and oceanic activity resulting in strong ground oscillations in the period of 0.05–12 s (Friedrich et al., 1998; Gudmundsson et al., 2007; McNamara and Boaz, 2019; Obermann and Hillers, 2019; Rossi et al., 2020). The frequency range of these microseisms partly overlaps with the Wood-Anderson pass-band and can, therefore, bias the Richter ML estimates. In particular, for micro-seismic events smaller than ML ∼1.0, the energy content of the noise is larger than the event itself (see e.g., Grigoli et al., 2022), leading to an overestimation of the local magnitude (Figure 2B), especially using broadband instruments. In such cases, an additional high-frequency pass filter (5 Hz cut-off) can mitigate the effect. However, for larger magnitude events (ML above ∼3.0) such static high-pass filter would lead to an underestimation of the magnitude, as a considerable amount of the event’s energy is cut off. We achieved a good compromise in our SeisComP automatic processing scheme by implementing a cosine taper between the min/max frequencies of 2–50 Hz in addition to the Wood-Anderson filter. This taper has a similar effect as a fourth order Butterworth band-pass BP filter. In Figure 2B,C, we compare the magnitudes for our HQ and the ÍSOR catalog and clearly see that the application of this additional filter eliminates the artificial kink present in the ÍSOR catalog for ML ∼1.0 earthquakes, resulting in a consistent magnitude scale. In June 2019, ÍSOR updated their magnitude calculation scheme, and since then, their calculations are comparable to IMO and Grigoli et al. (2022). It should be noted that most ÍSOR instruments are short period, and therefore not as sensitive to the microseism as broad-band instruments. For ÍSOR, it is important to have a ML scale comparable to the IMO for hazard monitoring, therefore a narrow high-pass filter of 1 Hz was chosen, which introduces the kink to the frequency-magnitude distribution.
3.4 High-quality subset of manually picked events
We manually picked arrival times of a spatially well distributed subset of 130 events detected by our automatic monitoring system, between November 2018 and July 2020 (Figure 2A, red circles) that included all earthquakes with ML ≥1.5 reported in the ÍSOR catalog during this period. Arrivals of these events could be observed at the majority of the seismic stations and are, therefore, essential for the tomographic inversion. The uncertainties assigned to all manually picked arrival times were categorized into five quality classes as defined in Table 1. All manually-picked events were then located with the regional 1-D model from Tryggvason et al. (2002) that updated the SIL model from Bjarnason et al., 1987. The same regional 1-D model is also used for routine location procedures of ÍSOR (Figure 2A, gray circles).
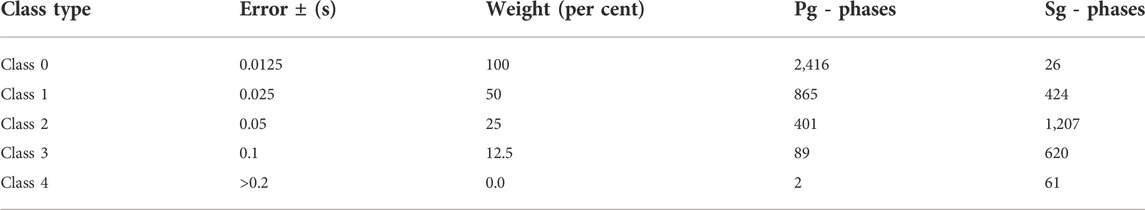
TABLE 1. Pick-quality weighting scheme and number of manual picks used for the computation of the minimum 1-D and 3-D velocity models, respectively, of the Hengill geothermal field.
The magnitudes of the manually-picked events were recomputed consistently using the two-sided cosine-taper as described in Section 3.3. We obtained 3,773 Pg-phases (130 events with an average picking error of ±0.02 s) and 2,338 Sg-phases (99 events, average picking error of ± 0.06 s) in the magnitude range of 0–3.0 ML. The events of this manually picked subset have an azimuthal gap <180° and at least eight observations and were used to compute 1-D and 3-D velocity models for accurate relocation of seismicity and structural interpretation. For the P + S inversions, we selected events with clear P and S-phases, which reduced the dataset to 91 events (3,003 Pg-phases and 2,212 Sg-phases).
3.5 Minimum 1-D Vp and Vs models
From the high-quality manual catalog, we compute minimum 1-D Vp and Vs models (Figure 3) using the VELEST software (Kissling et al., 1994, 1995), an inversion code that simultaneously accounts for the 3-D hypocentral parameters, the 1-D velocity structure and associated station delays. The models represent the 1-D average velocity structure of the region, as sampled by the ray-paths. Individual station delays relate to site-specific deviations from the 1-D average. These 1-D models are then used to relocate the entire HQ earthquake catalog and as an initial model for the 3-D local earthquake tomography.
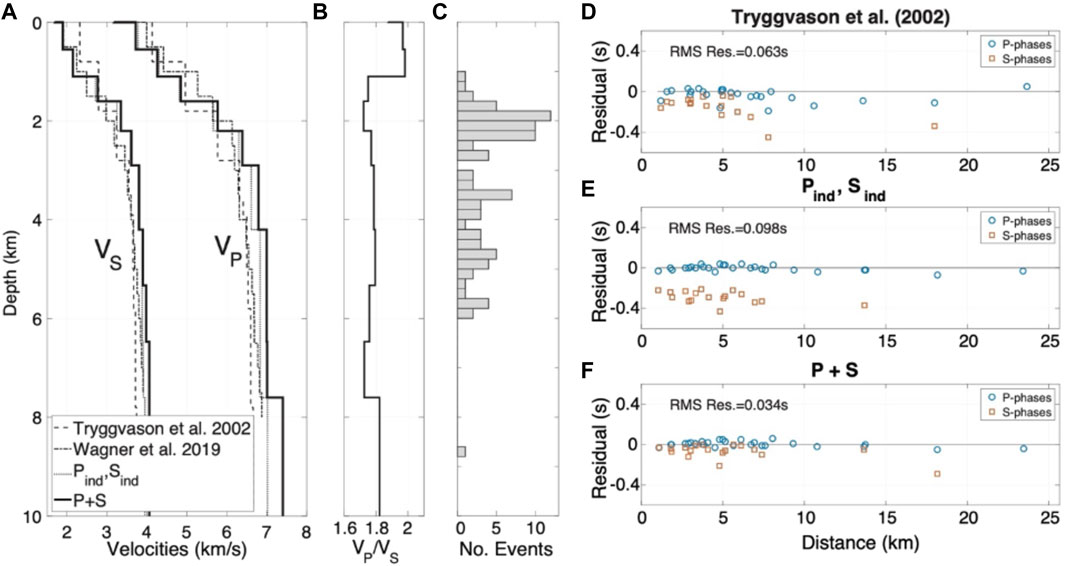
FIGURE 3. (A) Minimum 1-D P- and S-wave velocity models computed for the manually picked catalog. The individually inverted P-and S-wave models (Pind and Sind) are shown together with the simultaneously inverted models (P+S) and the regional 1-D model that is used for routine locations by ÍSOR (Tryggvason et al. (2002)). (B) VP/VS ratio for the P+S model. (C) Focal-depth distributions derived from the simultaneous P+S inversion. Travel-time residuals for the relocation of an arbitrary event (17.06.2020 – 02:55:25, 1.4 ML) in the Hengill region, using the model of Tryggvason et al. (2002), (D) the independent Pind and Sind models (E) and the P+S models from joint inversion (F).
As a reference site, we chose a broadband station with a low power-spectral-density (PSD) noise level and a large number of arrival-time picks in the center of the network (station JAK25, green triangle in Figure 4, Grigoli et al., 2022). The initial model for the VP inversion, is the regional 1-D Vp model from Tryggvason et al. (2002) (Figure 3). The initial Vs model is obtained from our final minimum 1-D Vp model using a constant Vp/Vs ratio of 1.78 that was determined by Tryggvason et al., 2002 and Wagner., 2019 for the larger region. Sánchez-Pastor et al. (2020) obtained a lower ratio of 1.73 for the top 5 km of the central Hengill region constraining Vs. Here, we opted for the Tryggvason et al., 2002 ratio, since their VP/VS model was computed for larger depths. Trials with the lower ratio for the top 5 km show very similar results, confirming the stability of the inversions.
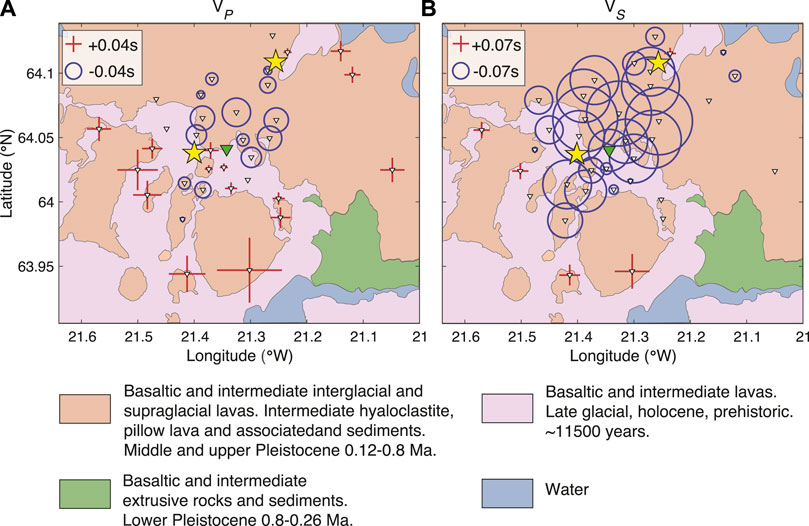
FIGURE 4. Station delays for (A) P- and (B) S-waves as obtained from the joint P+S inversion with VELEST. Red crosses indicate delayed arrival times with respect to the average 1-D model, while blue circles indicate earlier arrivals. The green triangle indicates the reference station (zero delay). The S delay is scaled by 1/1.75 (the inverse of the average Vp/Vs ratio). The geological map in the background was modified from Sæmundsson et al., 2016.
After an independent inversion for P and S-wave velocities (Figure 3A, Pind, Sind), we jointly inverted the hypocenter-velocity for P- and S-wave parameters (Figure 3A, P+S). The inversions converged after at most 4 iterations to the final minimum P-wave and S-wave velocity models, with an RMS of 0.025 s and 0.047 s, respectively.
The final minimum 1-D velocity model represents a rather simple 1-D structure with near-surface velocities of about 3.8 km/s followed by a gradual increase in velocity to 7 km/s at 4 km depth for P-waves. S-wave velocities near the surface are about 2.0 km/s followed by a gradual increase in velocity to 4 km/s at 4 km depth. The velocities deeper than 4 km are almost constant, reaching 7.5 km/s and 4.2 km/s at 14 km depth, respectively. However, there is no resolution at depths >7 km due to the lack of earthquakes (Figure 3C). For the P+S model, we also show the resulting Vp/Vs ratio (Figure 3B) and the focal-depth distribution (Figure 3C). The Vp/Vs ratio is about 2.0 in the top 1 km. From 1 km down to 7 km, it varies between 1.7 and 1.78, and then is around 1.8 at greater depth (Figure 3B). The average Vp/Vs ratio is 1.75. We consider layers containing earthquakes or earthquake head-waves as well constrained, which corresponds to a depth range of about 1–6 km for this data set.
As summarized, for instance, by Diehl et al. (2021), different strategies (i.e., independent versus joint inversion of P and S data) exist to derive suitable Vp and Vs models for hypocenter determination. To evaluate the quality of the hypocenters derived from the different 1-D velocity models, we compare the arrival-time residuals after event relocation for an exemplary event. In Figure 3D–F, we show the residuals resulting from using the Tryggvason et al., 2002 model (Figure 3D), the Pind, Sind (Figure 3E) and the P+S 1-D models (Figure 3F) for locating an ML 1.4 event that occurred in the center of the network on 17 June 2020.
The lowest location RMS (0.034 s) is achieved using the 1-D models resulting from the joint inversion of P and S arrivals (P+S). Using the individual Pind and Sind models results in an excellent fit of the P-phases, however, the S-residuals show a systematic offset, indicating that the two independent models are likely not compatible when combined in a joint hypocenter relocation. The 1-D Vp model from Tryggvason et al. (2002) in combination with a constant Vp/Vs ratio result in an RMS of 0.063 s for this event, as well as a systematic offset for the S-phase residuals. We hence prefer the minimum 1-D models derived from the joint inversion (P+S) and use them for the discussion of station delays (Section 3.6), as initial models for the 3-D local earthquake tomography (Section 3.7) and as input for the automatic seismic catalog (Section 3.8).
3.6 Station-delay times
Figure 4 shows the station delays associated with the minimum 1-D P- and S-wave velocity model (P+S) overlaid on a geological map of the Hengill geothermal area and surroundings (Sæmundsson et al., 2016), including first-order geological units. Station delays accommodate deviations from the 1-D model due to 3-D structure with respect to a reference station that is defined as zero (e.g., Kissling, 1988) and can be indicative of lateral variations of the near-surface geology. Negative delays (blue circles) occur in regions with higher velocities compared to the reference station and positive delays (red crosses) indicate lower velocities.
In Figure 4, the station delays vary from -0.06 s to 0.09 s for P-waves and from −0.29 s to 1.3 s for S-waves. Half of the sites have small station delays with respect to the estimated picking uncertainty (Pg-phases: 87% events within class 1, <0.025 s; S-phases, 70% events within class 2, <0.05 s) and are hence close to the noise of our data and are, therefore, not interpreted.
The larger positive delay times observed for P-phases in the central and southwestern regions tend to coincide with Holocene basaltic and intermediate lavas. Negative delay times also show some correlation with older, consolidated basaltic and intermediate hyaloclastites and pillow lavas dating back to the Middle and Upper Pleistocene.
The S-wave station delays show a similar pattern although the delays are larger and a tendency towards negative values is present. To make the comparison easier, we scale the size of the S symbols by 1/(Vp/Vs) in Figure 4, with Vp/Vs=1.75 being the average ratio of the 1-D inversion. The southwestern region shows positive delay times, which agrees with results of an ambient noise Rayleigh-wave tomography of the area that indicates reduced shear-wave velocity anomalies South of Central Hengill (Sánchez-Pastor et al., 2020).
3.7 Local earthquake tomography
To obtain the 3-D velocity structure of the subsurface, we applied the tomographic inversion code SIMULPS14 (Eberhart-Phillips, 1993; Thurber, 1993; Evans and Eberhart-Phillips, 1994) to the well constrained seismic events from the manually-picked catalog. We decided to perform the inversion with this restricted, yet representative high-quality catalog, rather than using the less well constrained full dataset obtained from the automatic picker. SIMULPS14 inverts simultaneously for the earthquake source location and the subsurface velocity structure, using a linearized, iterative, damped least-squares approach (Thurber, 1993). We performed three sets of inversions. We used the P-phases for a Vp inversion, and used the S-phases for separate Vs inversion. The Vp/Vs results were then derived from an inversion for Vp+Vp/Vs (Thurber, 1993). The resultant Vp models are equivalent and are hence not discussed separately (compare Figures 5A–C and Supplementary Figure S1).
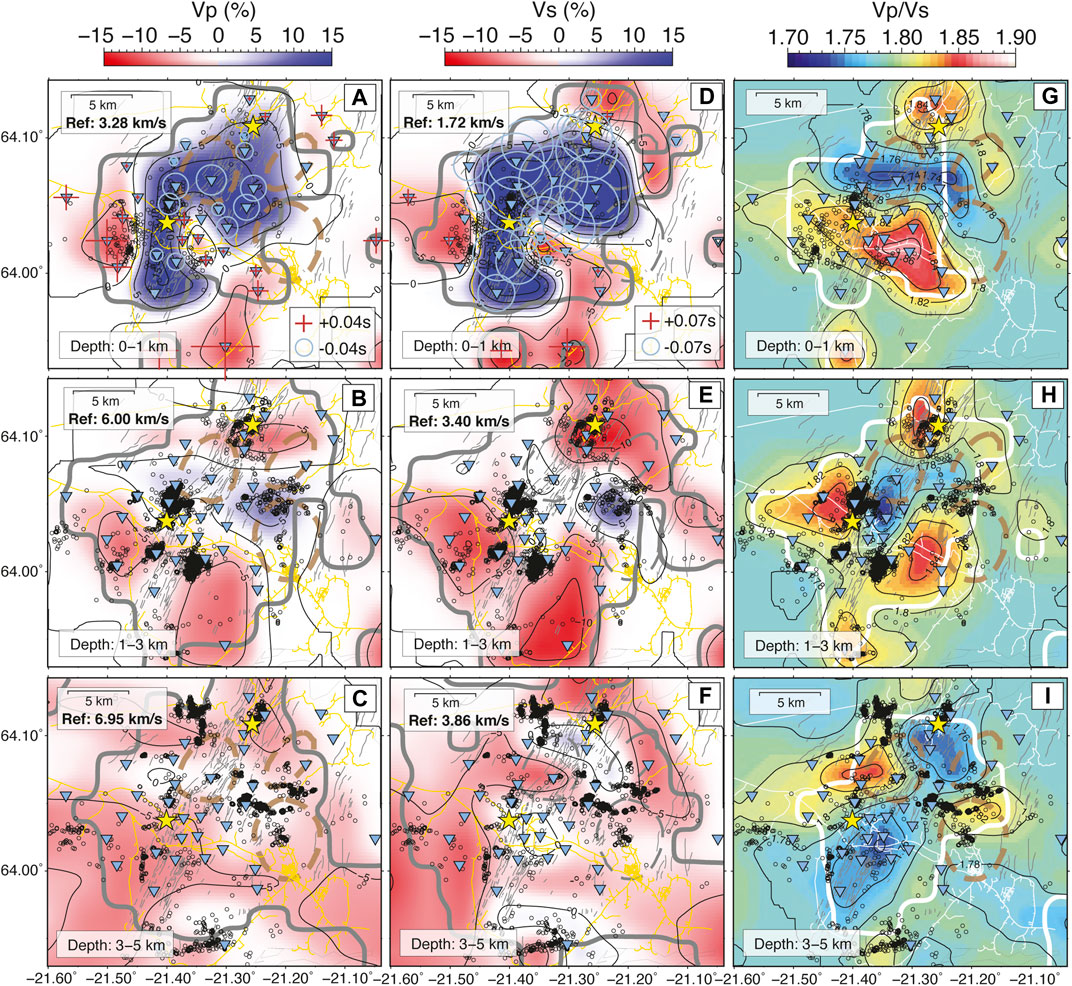
FIGURE 5. Horizontal cross-sections of the Vp (A–C), Vs (D,–F) and Vp/Vs (G–I) velocity models at 0, 2 and 4 km depth presented as relative change (in %) with respect to reference 1-D model. The reference velocity of each layer is shown on the upper left-hand side of each figure. The average Vp/Vs is 1.79 in the study area.
We used a horizontal grid spacing of 3x3 km and vertical grid spacing of 2 km and approximated the velocity gradient from the 1-D P+S model to the 3-D grid, for the 1-D Vp and 1-D Vs models respectively. The input Vp/Vs ratio model has a constant value of 1.78 for all depths. Following the approach of Eberhart-Phillips (1986) and Diehl et al. (2009), we performed a series of inversions, to establish the trade-off curve between data variance and model complexity with damping values ranging from 1 to 1,000. Based on the weighted RMS and the data variance, we chose a damping value of eight for all inversions that correspond to the strongest kink in the trade-off curve (Supplementary Figure S2) obtained after three iterations. Since the trade-off curves are similar, we chose these values for all sets of inversions (Vp, Vs and Vp/Vs).
To evaluate the resolution and robustness of our tomographic results, we compute the derivative weight sum (DWS) and the model resolution via the resolution diagonal elements (RDE) at different depths (e.g., Humphreys and Clayton, 1988; Husen et al., 2000) (Supplementary Figure S3). The DWS is a weighted measure of the total ray length through a cell in the inversion grid; the RDE is an indicator of the independence between model parameters. A region with uniform and relatively high DWS and RDE values is considered well resolved in the tomography inversion (e.g., Toomey and Foulger, 1989; Kissling et al., 2001). The definition of appropriate absolute cut-off values of these parameters, however, requires calibration with synthetic resolution tests. We performed two such synthetic tests. A first one in form of checkerboard tests (Supplementary Figure S4) and a second one by introducing ±10% Vp velocity anomalies at two depth levels into an otherwise homogeneous velocity model (Supplementary Figure S5). The checkerboard tests with ±5% Vs and Vp velocity anomalies, respectively, extend laterally over 4 grid points, with a depth extent of ±0.5 km around the indicated value. For both velocities, the tests indicate a good resolution (extent and amplitude of the anomalies) in the central region. Vertical smearing is present at shallow depth (Supplementary Figure S6).
The second synthetic test uses a “characteristic model” (see Haslinger et al. (1999) and Husen et al. (2000)), i.e., a model which shows similar characteristics of the real data but with slightly changed geometry and signs to be sure that inversion does not result in the same local minimum as for the real data. At 0–1 km depth, we introduced an elongated high velocity anomaly and a perpendicular low velocity anomaly. At 3–5 km depth, we introduced an additional high and low velocity anomaly. The inversion shows that the structures at 0 and 4 km depth are fairly well recovered in regions associated with RDE values ≥0.07 (areas outlined by black lines in Supplementary Figure S5B), while we observed leakage of the positive velocity anomaly at 3–5 km depth to shallower depth (2 km) (Supplementary Figure S5B).
As described by Diehl et al. (2021), absolute RDE values depend on cell size and damping parameters and, therefore, even low values of 0.07 can provide reasonable resolution (Supplementary Figure S3). Our results indicate good to fairly-good resolution in the center of the Hengill area for the uppermost 4 km of the crust, for both the Vp and Vs models (Figure 5). This corresponds to the depth range, where most of the seismicity occurs (Figure 6). The resolution towards the borders of the Hengill region is limited.
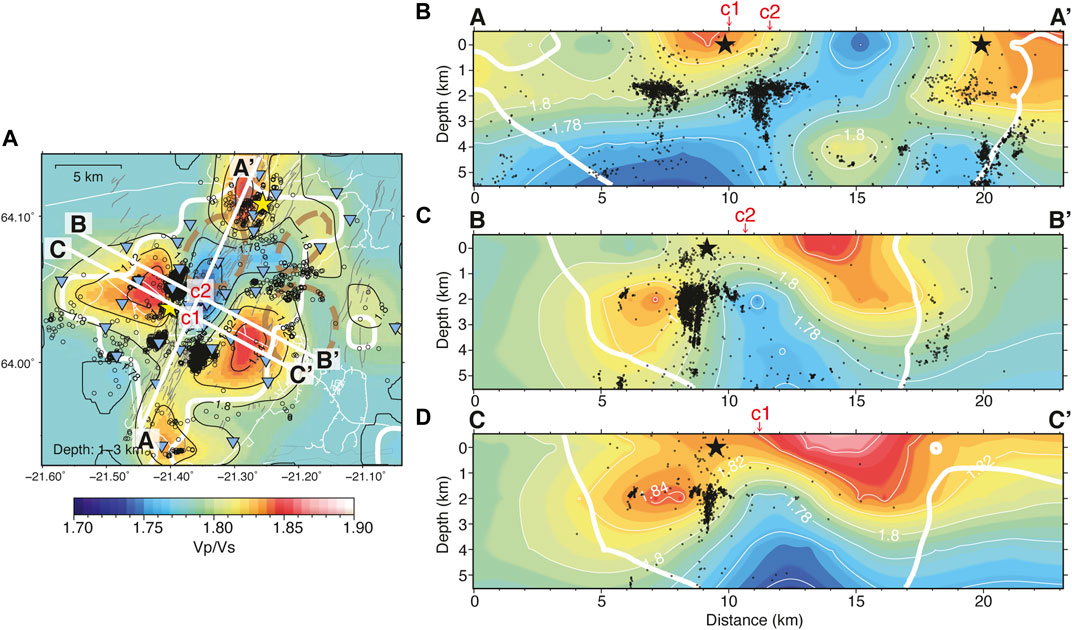
FIGURE 6. Vertical cross-sections through the Vp/Vs model along the paths shown in (A). The stars mark the location of the power plants. The seismicity 2 km around each transect is superimposed on the figures and shown as black dots. The white thick lines mark the well resolved area with an RDE>0.7.
The results of the travel-time inversion are presented as horizontal slices at 0, 2 and 4 km depth (Figure 5) for P and S-wave velocities and the Vp/Vs ratio. Each of these layers is sensitive to a depth range of ±1 km. The velocities are shown in percentage with respect to the initial minimum 1-D reference velocities (Figure 3A) at their corresponding depths.
The thin black lines show velocity contour lines. Dashed lines outline the central volcanoes: Hengill, Hrómundartindur and Grensdalur. Crosses (red) and circles (blue) in a) and d) correspond to station-delay times of the minimum 1-D model for Vp and Vs, respectively (Figure 4). Black circles indicate seismicity according to the automatic HQ catalog located within the indicated depth ranges. The yellow and white lines mark the major roads that are important for orientation. The thick line marks the well-resolved areas with an RDE>0.7.
For the layer at 0 km, we overlay the P-wave and S-wave station delays (Figure 5A,D). Positive P-wave station delays are located in low-velocity areas such as in Hverahlíð, Gráuhnúkar and north of Mt. Hrómundartindur. Negative delays can be seen in areas characterized by high velocities, for instance, at Mt. Hengill. At this shallow depth, the spatial distribution of the Vp and Vs anomalies is very similar, even though they were computed from independent data-sets, and their values vary in the range of −5 to +15%. The Vp/Vs ratio results show a region of below average Vp/Vs ratios (1.74–1.78) striking perpendicular to the rift, from the NE corner of Grensdalur to the Hengill volcanic system (Figure 5G).
At 2 km depth, we can observe Vp (Figure 5B) and Vs (Figure 5E) anomalies of around +8%, striking perpendicular to the rift, the strongest anomaly is circular and located in the NE corner of Grensdalur central volcano. Along the rift, between the power plants the Vp/Vs ratio is low to average, with the lowest ratio s of 1.74 located at the main well field, NE of Hellisheiði power plant. A similar pattern is observed at greater depths (Figures 5C,F) with relatively high Vp and Vs anomalies perpendicular to the rift. At these depths, the below-average Vp/Vs ratios are present along the rift with values of around 1.74 (Figures 5H,I), more pronounced with greater depth.
In Figure 6, we present three vertical cross-sections through the Vp/Vs model, their location is shown on Figure 6A. Vertical cross-sections along the same paths for the Vp and Vs model are shown in Supplementary Figure S6. Cross-section AA’ is aligned along the fissure swarm and lies close to both power plants. Profile BB’ is perpendicular to AA’ and passes through the Húsmúli basalt shield and Sleggja reinjection field. Profile CC’ is parallel to BB’, and passes the Hellisheiði power plant. Cross-sections AA’ and CC’ correspond to cross-sections chosen by Sánchez-Pastor et al. (2020) for their Rayleigh-wave tomography. We observe a region of low Vp/Vs ratios in the central fissure swarm region of the Hengill area at the main production area that shows a rough 45° eastward inclination with depth (Figure 6B). Regions of high Vp/Vs are observed around the Nesjavellir power plant, reaching down to 1 km depth (Figure 6B). To both sides of the fissure swarms at the height of the Hellisheidi power plant, we observe high Vp/Vs ratios that extend down to 3 km depth (Figures 6C,D).
It is noteworthy that most of the earthquakes seem to line up at the intersection of the high and low Vp/Vs anomalies on all three profiles. The majority of the earthquakes are found where the Vp/Vs is lower than 1.82. Below the surroundings of the Hellisheiði power plant, they form a vertical lineament, indicating structural changes in the subsurface (Figures 6C,D). Furthermore, the Vp/Vs high in cross-section CC’ and BB’ correlate quite well with a low resistivity body at 1–3 km depth (Árnason et al., 2010).
3.8 Double difference relocation of HQ events
In Figure 7, we show the double-difference relocated HQ earthquake catalog of the Hengill region from October 2018 to August 2021.
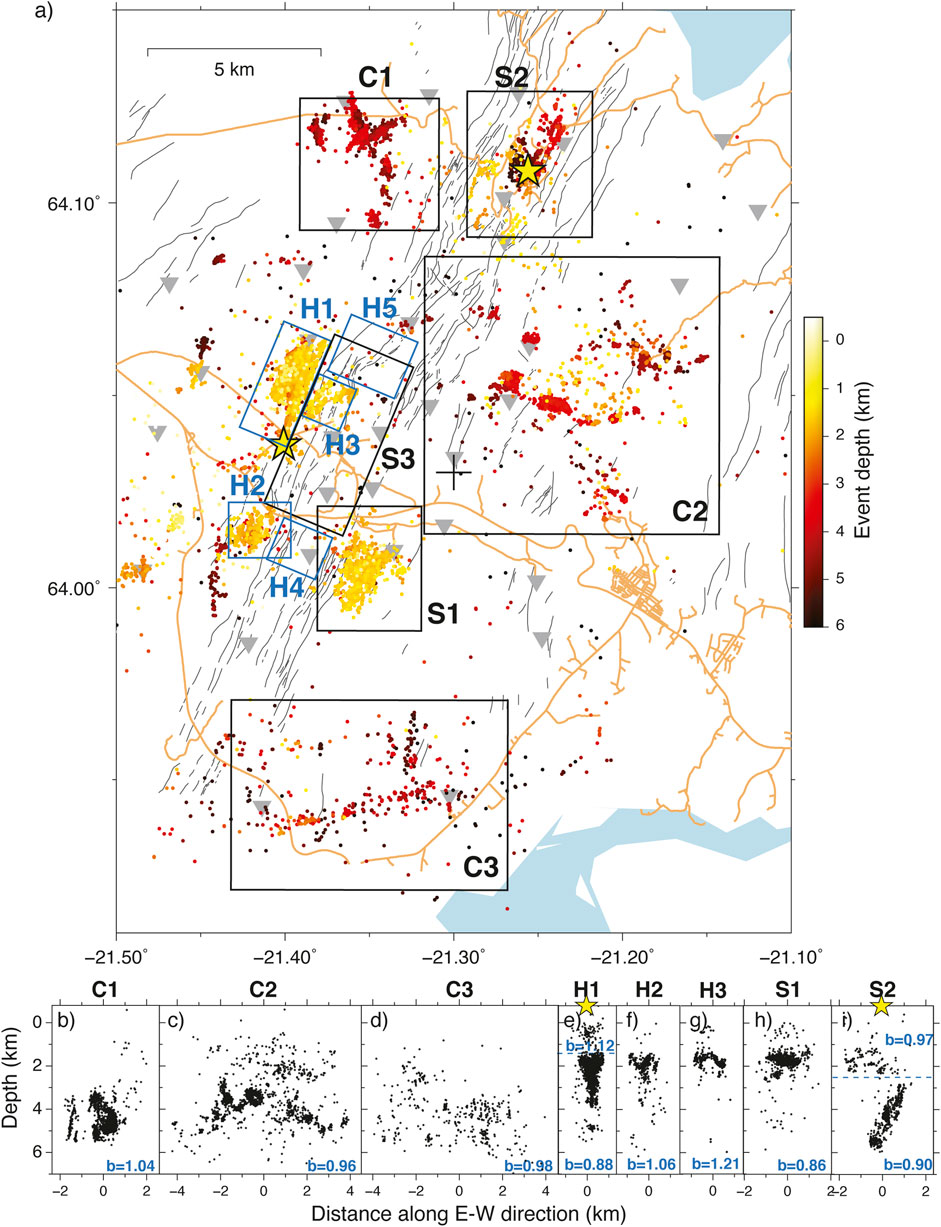
FIGURE 7. (A) Double-difference relocated HQ earthquake catalog of the Hengill region from December 2018 to August 2021. The event’s color indicates the focal depth. The seismicity occurs in clusters that we label as H1-H5 in the injection areas (Húsmúli, Gráuhnúkar, Sleggja, Lakahnúkar, Innstidalur) and S1-S3 in the production areas (Hverahlíð, Nesjavellir, Hellisheidi). Clusters C1-C3 (Mosfellsheiði, Hrómundartindur, Ölfus-Bakki) are outside the main production areas, where fewer boreholes are located. (B–I) Vertical distribution of seismicity along E-W direction and b-values for each cluster.
The double difference catalog was created using the new SeisComP module, rtDD (Scarabello, 2021; see also Grigoli et al., 2022). This new double-difference location module allows both real-time and offline data processing. In this study, we used the offline mode, which is similar to the original hypoDD method of Waldhauser and Ellsworth (2000) and applied the multi-event, double-difference relative relocation to the 8,700 events from the HQ catalog. We used differential times calculated from absolute, automatic arrival-time picks as well as differential times derived from waveform cross-correlation. The waveform cross-correlation method and the subsequent quality control of differential times follow the procedure described in Diehl et al. (2017). Seismograms were resampled with a sample interval of 1 ms and band passed in the frequency range of 5–25 HZ using a fourth-order filter. The waveform cross-correlation was performed for P- and S-phases The maximum inter-event distance during the initial selection of event pairs was 5 km. The velocity model used for the relative relocation is the minimum 1-D model shown in Figure 3A,B. Apart from 10 events, all events of the HQ catalog were successfully relocated. The median of the absolute differential-time residuals improves from an initial 35 ms–14 ms after the double-difference inversion. The clustering is significantly enhanced by the relative-relocation procedure and several earthquake lineaments can be identified in map view and depth cross-section in Figure 7. It should be noted that the current version of the module still lacks estimates of formal relative location uncertainties.
There are several active areas, with little seismicity in between them. Based on the earthquake distribution and the location of the production and injection areas, we group the seismicity into eight clusters shown in the bottom of Figure 7, as well as in the map view (Figure 7A). We label the clusters in the injection areas as H1-H3 (Húsmúli, Gráuhnúkar, Sleggja) and production areas as S1-S2 (Hverahlíð, Nesjavellir). Clusters C1-C3 (Mosfellsheiði, Hrómundartindur, Ölfus-Bakki) are outside the main production areas where fewer boreholes are located. The squares H4-H5 (Lakahnúkar, Innstidalur) mark the locations of two injection fields that do not show elevated seismicity. S3 marks the area of the main production field of the Hellisheidi power plant. In the Supplementary Figure S7 we show the earthquake rates and cumulative event numbers. Based on these figures, we briefly describe the harnessing activities and seismicity in each of the boxes.
3.8.1 Injection areas
Out of the five injection areas in operation for the Hellisheiði power plant, only three, Húsmúli (H1), Gráuhnúkar (H2), and the in-field injection area Sleggja (H3) show substantially elevated seismicity rates. The other two; Lakahnúkar (H4) and Innstidalur (H5) show relatively little seismicity. Injection rates are variable over time, with about 200–300 l/s going to each of Gráuhnúkar and Húsmúli, 0–200 l/s to Innstidalur, 0–200 l/s to in-field injection and 80–120 l/s to Lakahnúkar. There is only one deep injection well of 2 km in operation for the Nesjavellir power plant, receiving around 60–80 l/s and no change in seismicity has been observed after the start of injection in late 2018 (https://map.is/os/#). Nesjavellir is, therefore, treated as a production area for our purposes, although there is ongoing deep injection as well.
Cluster H1 - Húsmúli. The H1- Húsmúli injection field was commissioned in fall 2011. Immediately the seismic activity increased drastically, and although it has much diminished since the first year of injection, it has remained relatively high since.
Injection wells are deviated towards the north and west, with injection occurring at depths between 800–2000 m, targeting prominent normal faults. The seismicity clusters north of the wellheads, above and towards the north of the main feed zones. The seismicity distribution is divided into a shallow region (<1.5 km) and deep region between 1.5–4 km depth, reaching depths of 6 km in a handful of cases. A zone of updoming is observed in the seismicity in the area between the injection wells and the production wells. Cluster H1 has by far the highest earthquake rate (Supplementary Figure S7) with over 4,000 events during the study period, or around 50 events daily on average, although most of them occur in intense swarms. The largest swarms occured in 2020 and 2021 with over 200 events per day.
Cluster H2- Gráuhnúkar: The original injection area for the Hellisheiði power plant was commissioned in 2006. The seismicity rate has slowly increased since the commission, but the seismicity rates are still much lower than those at Húsmúli (H1), despite the injection rates into the two areas being similar. The seismicity in H2 displays a single cluster mainly located at 1–4 km depth. The activity is highly temporally clustered, with the most active swarm having almost 40 events registered in a day (Supplementary Figure S7). Some deeper seismicity is located on fissures SW of the main cluster, and is probably related to volcano-tectonic activity in that region.
Cluster H3 - Sleggja. Intermittent injection occurs within the production field, into wells previously used for production. The injection is highly variable, with values ranging from 0–200 l/s into this area. This injection has generated a cluster of shallow seismicity, with depths ranging from 1–2 km (Figure 7).
3.8.2 Production areas
The main production area for the Hellisheiði power plant (S3) has very little induced seismicity associated with it. However, there is substantial seismicity in both the secondary geothermal field of the Hellisheiði power plant, Hverahlíð (S1), as well as in the Nesjavellir geothermal field (S2).
Cluster S1 - Hverahlíð The area was seismically active in the unrest related to the magma intrusion in 1994–1999 but remained relatively quiet until production started in the Hverahlíð geothermal field in 2016. Since then, seismicity has persisted in the field. The seismicity is confined to one cluster at 0.5–2.5 km depth, mostly concentrated at 1.5–2.0 km depth, and does not follow any clear lineations. Notably, the seismicity is relatively uniform in time, with the highest daily count reaching 15 events.
Cluster S2 - Nesjavellir In the southern part of the production area for the Nesjavellir power plant there is a cluster of distributed seismicity at depths between 1–2.5 km. Further towards the northeast, the seismicity appears to line up on a north-northeast striking and northwest dipping plane, extending from about 3–6 km. The seismicity rate is relatively constant with 5–10 events per day on average, with the exception of occasional swarms. The largest swarm of the study period occurred in April 2020, with almost 80 events in a single day.
3.8.3 Non-harnessed geothermal areas
The location of the active Hengill volcano at a triple junction, makes it a center of natural seismic activity. The seismicity focuses on several areas, some more persistent, whereas others change over time. During the recording of the COSEISMIQ network, several areas had substantial seismicity. Here we focus on the three main clusters.
Cluster C1 - Mosfellsheiði To the west of Nesjavellir, out on the Mosfellsheiði plains, the seismicity rate was relatively high during the survey period, considering that the area is not within the volcanic fissure swarm. In early 2021 there was a period of very elevated activity (Supplementary Figure S7). The seismicity is limited to 4–6 km depth and appears to align on several faults, striking either NE or NNW. We note that these orientations are rotated about 30° anticlockwise to the most common strike-slip fractures in the Hengill fissure swarm, and they do therefore not coincide with the orientation of the volcanic fissure swarms.
Cluster C2 - Hrómundartindur To the east of Hengill, in the volcanic center Hrómundartindur and Ölkelduháls, an area of extensive surface activity, the seismicity occurs in multiple small clusters. The clusters occur at depths from 1–6 km, with most of the activity below 3 km. The seismicity rate is rather stable with around 5 events daily on average, with small swarms occurring regularly. The seismicity rate in C2, as well as in C1, is higher than in the harnessed areas H2-H4.
Cluster C3 - Ölfus-Bakki: Is a low-temperature geothermal area (100–120°C) that produces hot water for the surrounding neighborhood. The seismicity is located at 2–6 km depth, with most events occurring between 4 and 6 km. In C3 the seismicity is the most diffuse in depth and occurs at a lower rate (the lowest rate of the analyzed areas). However, the detection rate in this cluster could be affected by a sparser network on the outskirts of the study area. The bulk of the seismicity follows a general ENE-WSW trend, with a few N-S intersecting faults/clusters. Separated in space from the ENE striking band of seismicity, an M 4.2 event occurred in December 2018, with associated aftershock activity, delineating two parallel N-S striking faults.
3.9 Analysing the relative earthquake size distribution
The relative frequency-magnitude distribution (FMD) of earthquakes, typically described by the b-value of the relationship log N = a - bM, is a key ingredient of seismic hazard assessment. Because the b-value is also related to the local stressing condition and to fluid pressures, analysing b-value can be a useful tool complementing seismic imaging (e.g., van Stiphout et al., 2009. For each of the seismic clusters we compute first the overall b-values, using the maximum likelihood technique as described in Wiemer and Wyss (2000) and Shi and Bolt (1982). We use a magnitude binning of ∆M=0.1 ML and estimate the magnitude of completeness (Mc) for each seismic cluster using the maximum curvature approach (Wiemer and Wyss, 2000; Mignan and Woessner 2012). The results are summarized in Table 2. The Mc is about 0.4 ML for the entire Hengill region, and as low as 0.2 ML in the central clusters (C1, C2, S1). The overall b-value is around 0.9 for the Hengill field. The highest values with 1.21 and 1.12 are found at shallow depth (1.5–2 km and <1.5 km) in the Sleggja (H3) and Húsmúli injection areas (H1). Clusters containing mainly production wells, Hverahlíð and Nesjavellir (S1, S2) show lower b-values (0.86, 0.93).
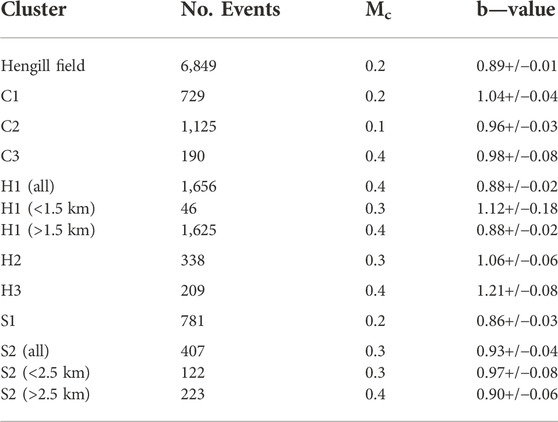
TABLE 2. Cluster sizes, Mc and b-values for each selected cluster in the Hengill area as shown in Figure 7.
We then spatially map Mc and b-values using Zmap (Wiemer, 2001, Figure 8). For this computation we used the medium quality catalog (MQ) since it preserves better low-magnitude events. Large magnitude events that are more sensitive for the b-value estimation are consistent between MQ and HQ catalogs (Supplementary Figure S8). The grid spacing is 200 m. Each area for b-value calculation must contain 150 earthquakes. We observe a prominent region of high b-values East of the Hellisheidi power plant (Figure 8B) that is dominated by the H3 cluster and appears slightly shifted to the East with respect to the cluster location. This effect results from the lack of events to the East of H3 and the consequent increase (by radius) of the considered area until 150 events are included. In Supplementary Figure S9, we show a map with the spatial extension of the radius used to select 150 events and the error associated to b-value estimation.
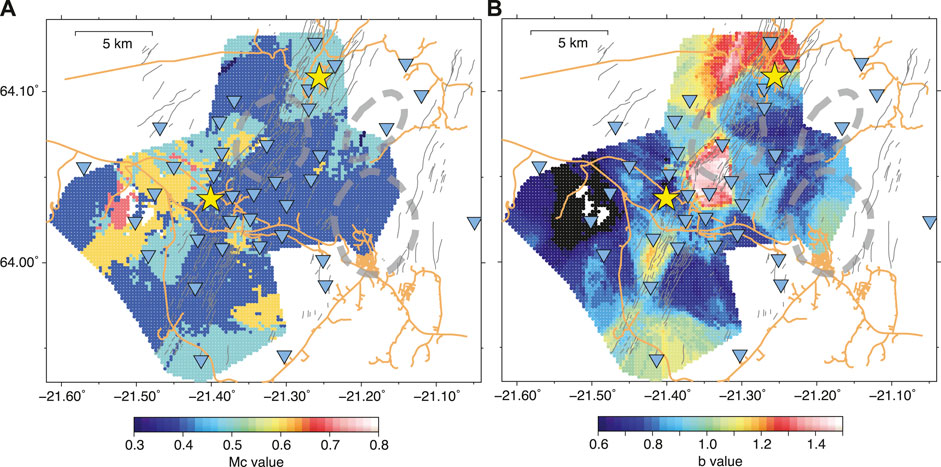
FIGURE 8. Map of the Hengill geothermal area. Color-coded is to the left (A); the minimum magnitude of completeness, Mc, estimated from the MQ catalog to nodes of a grid spaced 0.2 km apart. To the right (B); b-value map using the same events. Roads are shown as brown lines and yellow stars mark the power plants at Hellisheiði (south) and Nesjavellir (north). Gray dotted lines mark the three volcanic centers (Árnason et al., 1986).
4 Discussion
4.1 3-D seismic velocity models in the Hengill region in the context of other geophysical observations
After a discussion of the 3D seismic velocity models, we compare the highest resolution tomographic results (at 1–3 km depth, Figure 5D) to other geoscientific data, such as aero-magnetics, geothermal surface manifestations, resistivity and gravity data (Figure 9) to deepen our understanding of the Hengill geothermal area.
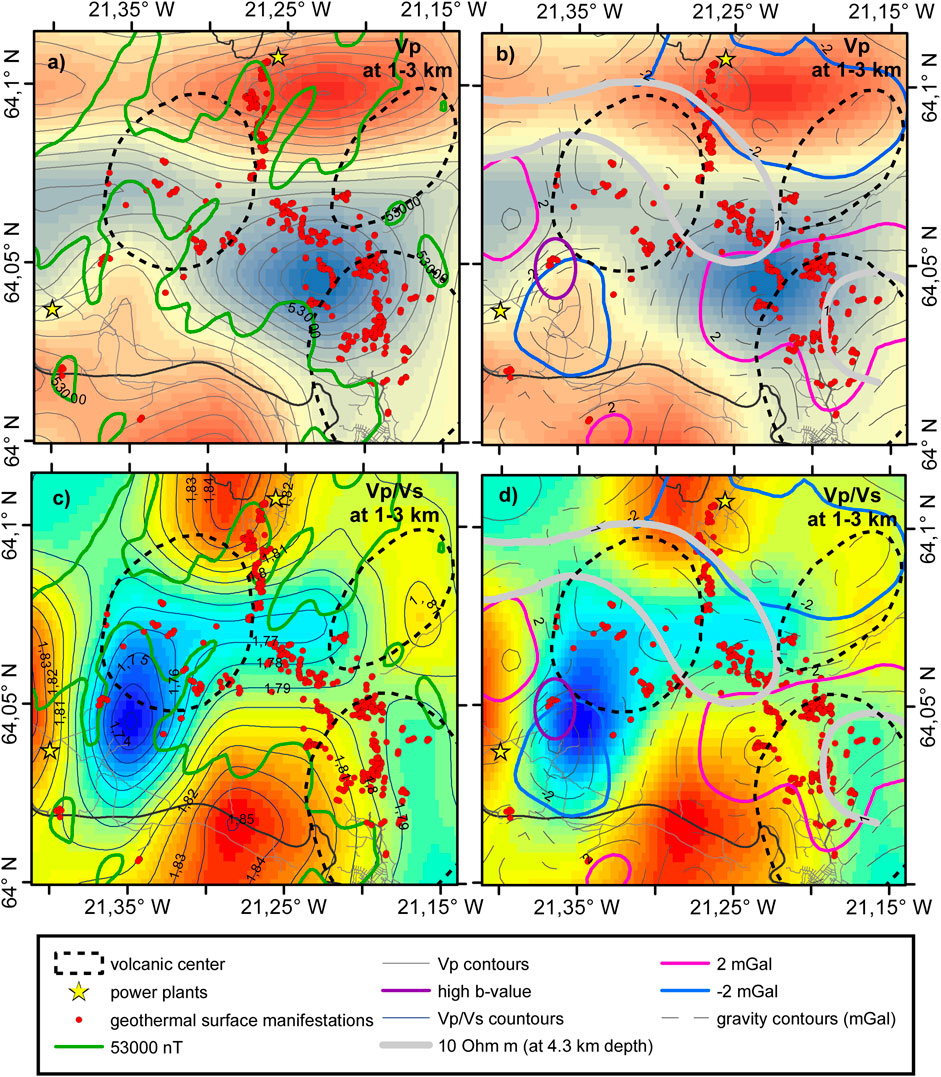
FIGURE 9. Comparison of the Vp (upper rows) and Vp/Vs (lower rows) model at 2 km depth with other geoscientific research from the Hengill geothermal areas and surroundings. Fumaroles (red dots) and volcanic centers (black broken lines), as well as the power plants (yellow stars) are drawn for orientation in all subfigures. On the velocity models we overlay: (A) Vp contour lines. (C) Vp/Vs contour lines. (A,C) aero-magnetic low (< 53.000 gamma) shown as green thick lines (Björnsson and Hersir, 1981; Hersir et al., 1990). (B,D) a resistivity low (< 10 Ωm) at 4.3 km depth as white thick lines (Árnason et al., 2010) and residual Bouguer gravity with pink lines encircling gravity high and blue gravity low; Björnsson et al., 1986; Hersir et al., 1990). The area in Sleggja with a high b-value is outlined by the purple line.
Overall, the seismic velocity models of Vp and Vs show a similar spatial distribution of low and high-velocity regions (Figure 5). Close to the surface at 0–1 km depth (Figures 5A,D), we observe fast velocities along the postglacial fissure swarm and in the SE-NW trend towards Hverahlíð and the Grensdalur volcanic center, which can be interpreted as a result of solidified magma bodies between the Hengill and Grensdalur volcanic systems and stretching towards Hverahlíð. Our observations in this shallow layer are in overall agreement with observations from earthquake tomographies by Jousset et al. (2011) and Wagner (2019). However, there are some differences to the results of the ambient noise surface-wave tomography from Sánchez-Pastor et al. (2020) that are largest near the power plant Nesjavellir in the North (Figures 5A,D). Here, we need to keep in mind that the resolution in earthquake tomography is determined by the spatial distribution of the seismicity. In Hengill, the typical depth of the seismicity is between 2 and 6 km (Figures 3, 7) and therefore, the rays arrive at the seismic stations with small incidence angles. The resolution of the presented velocity model within the top 1 km of the crust is hence dominated by the local geology as shown in Figure 4. The velocity model from surface wave tomography in Sánchez-Pastor et al., 2020 is independent of the seismicity distribution and has a more spatially homogeneous sensitivity that is due to the frequency depth sensitivity, which is particularly strong in the shallow crust. Nevertheless, the most prominent features are similar between both velocity models; such as the fast anomaly perpendicular to the fissure swarm, the slow anomaly near the Nesjavellir power plant and the slow anomaly located to the southwest of the Hellisheiði power plant. The two later anomalies appear translated to the west for Sánchez-Pastor et al. (2020), which is likely an effect of the seismic network geometry with a limited resolution capacity for both models in this area.
At 1–3 km depth, the fast velocity anomalies are not as pronounced (Figures 5B,E), there the trend of the Vp anomalies is more in the E-W direction. The fastest Vp and Vs velocities at this depth are in the NW corner of the Grensdalur volcanic center and local low Vp and Vs velocity anomalies at Nesjavellir, Skálafell just south of Hverahlíð and at Gráuhnúkar. This applies especially for Vs, resulting in a relatively high Vp/Vs ratio in these areas, as determined in the inversion. Close to the surface, low Vp/Vs ratios of 1.74 are observed cutting through the Hengill volcanic center and trending W-E (Figure 5G). Tryggvason et al. (2002) found variations of the Vp/Vs ratio in the range 1.71–1.83 for the Hengill area at 0–1 km depth.
At greater depth the low Vp/Vs ratios are found along the fissure swarm (Figures 5H,I), possibly indicating structural changes in the subsurface, facilitating improved permeability. At 4 km depth (Figure 5G), low Vp/Vs ratios of 1.74 still follow the fissure swarm. This is also where the highest formation temperatures are found (Steingrímsson, 2013) and where the main production for the Hellisheiði power plant takes place. One explanation for the low Vp/Vs ratio could be that the extensive extraction lowers the pressure, and consequently increases the steam zone. Since steam is more compressible than water, the bulk moduli decrease and so does the seismic velocity of P-waves and hence the Vp/Vs ratio. Alternatively, this anomaly could be due to seismic anisotropy. In the inversion, we assume isotropic velocity, however, effects of anisotropy are likely present with the faster propagating waves oriented along the fissures, rift parallel, (NE-SW) and the slower propagating waves in the perpendicular direction (NW-SE) (Bacon et al., 2022). Interestingly, the most productive wells in the study area, located in Hverahlíð, are on the intersection between high and low Vp/Vs ratio, slightly to the SE of the Hengill fissure swarm.
Additionally, there is a slight Vp/Vs minimum around the Nesjavellir and Hverahlíð production fields. The Vp/Vs ratio may be affected by supercritical fluids within the volcanic fissure swarm that cause a reduced Vp velocity as well as the heavily fractured medium (e.g. Heath et al., 2022). These observations are in good agreement with previous tomography studies (Wagner, 2019; Sánchez-Pastor et al., 2020). Also, laboratory measurements show that P-wave velocities decrease with increasing temperature in a systematic way that generally fits the predictions of the Gassmann equation, implying that fluid characteristics, with modifications that allow for the presence of bubbles and microfracturing, account for much of the seismic velocity reduction (Jaya et al., 2010).
In Figure 9, we plot the Vp (a,b) and Vp/Vs ratio (c,d) tomographic models at 2 km depth with geothermal surface manifestations such as fumaroles (red dots; Sæmundsson et al., 2016), volcanic centers (black broken lines, Árnason et al., 1986), low aero-magnetic anomaly (<53.000 nT, green line, Figure 9A,C, Björnsson and Hersir, 1981; Hersir et al., 1990), the <10 Ωm resistivity anomaly at 4.3 km depth (gray thick line, Figure 9B,D, Árnason et al., 2010), residual Bouguer gravity (−2 mGal are blue lines and +2 mGal are pink lines, Figure 9B,D, Björnsson et al., 1986; Hersir et al., 1990). These different methods and the resulting anomalies represent various physical parameters caused by common causative bodies. In relation to the nature of the various methods, the anomalies are revealed at different depths. They all relate to the crustal structure and the processes and properties of the geothermal area and are thought to be the result of a deep-seated heat source. The SE-NW trending aero-magnetic low (caused by demagnetization because of hydrothermal alteration) and fumaroles (see also Figure 1) correlate nicely, and so does a shallow (less than a couple of hundred meters deep) low resistivity anomaly caused by the smectite low temperature alteration clay cap (Hersir et al., 1990; Árnason et al., 2010). These reflect the same phenomenon, relatively high temperature at shallow depth, most likely a result of the migration of the crustal accretion and volcanic activity from the extinct Grensdalur volcanic system to the active Hengill volcano as discussed above.
These anomalies correlate quite well with the high Vp velocity across the Hengill fissure swarm. This perpendicular trend has been observed before (Björnsson et al., 1986; Hersir et al., 1990; Árnason et al., 2010; Jousset et al., 2011). The deep-seated resistivity-low at 4.3 km depth (gray line, Figure 9B), imaged by MT data using a 3D model (Árnason et al., 2010) is thought to represent the core of the geothermal area/system. As attenuation of S-waves has not been observed, the resistivity-low is proposed to reflect hot, solidified intrusions that are heat sources for the geothermal system above (Árnason et al., 2010). The residual gravity (gray lines, Figure 9B) are long wavelength gravity anomalies showing the broad crustal structure, and show good correlation with the Vp at 1–3 km depth, where positive gravity (pink lines, +2 mGal), caused by high density rocks, falls within the high Vp areas and negative gravity (blue lines, −2 mGal), caused by low density rocks, within the lower Vp areas.
The area containing the anomalously high b-value earthquakes we observed in H3 (Sleggja) (purple line, Figures 9B,D), coincides with some fumarole activity and lies within a relatively slow Vp and low Vp/Vs ratio (Figure 9D), and is bordering the negative gravity anomaly. Elevated b-values (above 1) can be expected to be found in volcanic areas and is normally thought to relate to elevated temperatures and high pore-fluid pressure (Wyss, 1973; Wiemer and Wyss, 2000). In the Sleggja area, a high temperature anomaly is present, with temperatures reaching around 275°C at only 0.5 km depth (Björnsson et al., 2006). In this area, higher rates of steam can be expected (however, the presence of steam is also pressure dependent), which in combination with the high temperatures could explain the low Vp/Vs ratios and the low gravity anomaly. Sleggja area is not an area of intense seismic swarms, quite the opposite, and it is likely that the recorded seismicity located at 1–2 km depth is mainly induced. It is therefore of interest that the Sleggja seismicity has the highest observed b-value of 1.2 (Table 2). The area is located within the Hengill fissure swarm with considerable surface alteration and some fumaroles (Figure 1) likely due to good permeability and upwelling of fluids, which could explain the rather low Vp value. The gravity low suggests a relatively lower density compared to the surroundings.
Over the past years, the Hellisheiði and Nesjavellir production fields have seen substantial subsidence linked to the power plant operations (Ducrocq et al., 2021). Sleggja, an area with intermittent injection within the production field, lies at the northern end of the subsidence signal (in 2018–2019). The continuous extraction of fluids in the direct surroundings of the production field contributes to a decrease of the pore fluid pressure that increases the effective stress of this highly fractured area that could inhibit fault slip in the producing layer and hence result in higher b-values (Segall, 1989). The irregular reinjection in Sleggja does likely not counteract the decrease of the pore fluid pressure sufficiently to change that process.
To the north and northwest of Nesjavellir power plant the Vp/Vs ratio is high, 1.82–1.85, at depths shallower than 3 km (north of 64.1°N in Figures 5,6), but below 3 km the Vp/Vs ratio is lower, around the average 1.75. The main production area of Nesjavellir power plant lies on the periphery of the high and low Vp/Vs anomalies. The Nesjavellir area is at the northern edge of our seismic network, and therefore we cannot exclude that we are lacking the resolution power to observe small Vp/Vs anomalies, and that our model is conditioned by the strong neighboring anomalies. We do observe higher b-values in this area (Figure 8), but again, the spatial location is not well constrained. The production area of the Nesjavellir valley, around the Nesjavellir power plant, does not show as clear or similar correlation with other geophysical anomalies. In the Nesjavellir area, the gravity-low correlates with low Vp and high Vp/Vs (Figure 9). Although the low resistivity, <10 Ωm, of Árnason et al. (2010) is located at 6 km depth, they lack resolution in the area.
The comparison of our new observations with the older geoscientific data shows that different data sets are all important pieces to the big picture and our enhanced understanding of the Hengill geothermal area.
4.2 Seismicity in the Hengill region
The eight identified clusters in Hengill exhibit distinctly contrasting behaviors.
4.2.1 Injection areas
The seismicity in clusters H1-Húsmúli, H2-Gráuhnúkar, and H3-Sleggja is not only clustered in space, but also in time, with most of the activity occurring in intense swarms. The seismicity seems to mostly align on faults, especially in H1-Húsmúli. The depth distribution is almost entirely bounded between 1–4 km. In H1-Húsmúli, the injection wells target prominent normal faults that have been active in the past but the intensity has significantly increased since the injection started, and has remained high since. Here, seismicity on preexisting, stressed faults is likely triggered by the injections as the resulting increase in pore pressure reduces the normal stress. H2-Gráuhnúkar has seen very similar injection rates as Húsmúli since 2006, but unexpectedly, the level of seismicity remained low. The injection rate in H3-Sleggja is lower and so is the seismicity rate. Finally, the injection in Innstidalur, Lakahnúkar and Nesjavellir does not seem to cause any significant seismicity.
It is not clear what causes the different response of the various injection fields. Here we will briefly consider some potential explanations, such as injection rate, volume and pressure, prestress, geological formation, temperature of the injected fluid, rock formation and their difference.
Injection rate: The injection rate in H1-Húsmúli and H2-Gráuhnúkar is similar and that of H5-Innstidalur is about 60% of that, whereas the seismicity rates are very different. Therefore, although the injection rate must be an important factor, we need additional variables to explain the variability.
Injection volumes: Seismicity has been triggered in several wells during drilling, associated with drill-fluid loss into the formation, whereas in other regions ongoing injection over long periods of time does not produce triggering. Therefore, although injection volume may be important in any given system, this does not explain the difference between injection fields.
Injection pressure: The pressure in the pipes to the injection wells is relatively low or close to 0.9 MPa for all the injection fields so this does not explain the difference in seismicity between fields.
Prestress: The fields are close to each other and would be expected to be under the same tectonic stress. However, there may be some variation in stress caused by the production, as evidenced by the deformation (subsidence) above the fields (Juncu et al., 2017, 2020; Ducrocq et al., 2021). Considering this further is beyond the scope of this paper, but should be analyzed in a future publication.
Geological formation: The general geology is not very different between injection fields, as they are all composed of interlaced layers of hyaloclastite, basalt, and intrusive material (Franzson et al., 2010). However, there may be some variability in the relative abundance of these rock types and could be investigated further by a study of the drill logs. This is also a consideration for future publications.
Temperature of injected fluid: The temperature of the injected fluid in H5-Innstidalur is much higher than in the other regions (about 200°C). There, we observe almost no triggered seismicity. In S2-Nesjavellir the temperature of the injected fluid is also high, or about 90–100°C. There we also see almost no triggered seismicity. However, the temperature of the fluid injected in H1-Húsmúli, H2-Gráuhnúkar and H4-Lakahnúkar is the same, typically around 60°C, whereas the seismicity rates are very different. Therefore, we conclude that the temperature of the injected fluid is not alone responsible for the differences in seismicity rates.
Temperature of rock formation: For a rough comparison of seismicity rates and formation temperature, we assume that the estimated formation temperature at 1,500 m depth for each group of wells is representative of the temperature in the interval, as it is close to the center of the production interval in many of the injections. For each of the areas the formation temperature is estimated from temperature measurements in the wells as; H1-Húsmúli: 260°C, H2-Gráuhnúkar: 280–290°C, H3-Sleggja: 260–300°C, H4-Lakahnúkar: 230–280°C H5-Innstidalur: 250°C (Gunnarsson et al., 2022). We observe that the area most susceptible to seismicity, H1-Húsmúli, has an intermediate temperature. The areas that have the lowest rate of seismicity, H4-Lakahnúkar and H5-Innstidalur, have relatively lower temperatures. However, the H2-Gráuhnúkar and H3-Sleggja with intermediate rates of seismicity show the highest temperatures. We therefore do not observe a direct relationship between formation temperature and seismicity rates by this rough comparison. For a better comparison an estimate of formation temperature at the depths, where the feed zones are located, would be needed, which is out of the scope of this study.
4.2.1.1 Difference in temperature between rock formation and injected fluid
The difference in temperature between injected fluid and the rock formation at 1,500 m depth is: H1-Húsmúli: 200°C, H2-Gráuhnúkar: 220–230°C, H3-Sleggja: 200–240°C, H4-Lakahnúkar: 170–220°C and H5-Innstidalur: 190°C. Here the area with the highest seismicity rate has intermediate difference in temperature between rock formation and injected fluid. Therefore, again, there is not a direct relationship between these two variables.
4.2.2 Production areas
The activity in clusters S1-Hverahlíð and the southern shallow seismicity within S2- Nesjavellir is diffuse, with the seismicity seemingly distributed throughout the geothermal reservoir, as opposed to aligning on faults as the seismicity triggered by injection. The events occur at shallower depths compared to the injection areas, mostly between 1–2.5 km. In addition to being more diffuse in space compared to the seismicity associated with injection, the activity also appears more diffuse in time. In S2-Nesjavellir there is an additional deeper cluster that appears to fall on a fault that dips steeply to the west (Figure 7). Due to its separation from the cluster that coincides in space with the geothermal extraction and as it appears to align on a fault, we suggest that this seismicity is of tectonic origin.
The activity in clusters S1-Hverahlíð and S2-Nesjavellir is diffuse, with the seismicity seemingly distributed throughout the geothermal reservoir, as opposed to aligning on faults as the seismicity triggered by injection. We see almost no induced seismicity in H3, the main production area of the Hellisheiði power plant. The events occur at shallower depths compared to the injection areas, mostly between 1–2.5 km. In addition to being more diffuse in space compared to the seismicity associated with injection, the activity also appears more diffuse in time.
It would be expected that as opposed to injection, production would reduce the seismicity rates, as extracting fluid from faults would increase the normal stress on them, causing them to not slip. However, we see significantly elevated rates of seismicity, especially in S1-Hverahlíð, where seismicity rates increased dramatically, immediately at the onset of production. We therefore do not consider this seismicity triggered in the same sense as in the injection areas, but rather induced seismicity as has been observed in other geothermal production areas as well as in for example gas fields (van Thienen-Visser and Breunese, 2015; Green et al., 2019). In these fields the seismicity has been attributed to slip on surfaces within a volume that experiences compaction.
4.2.3 Non-harnessed geothermal areas
Cluster C1 is outside the main fissure swarm. The events in this cluster occur at 4–6 km depth, deeper than the seismicity in the injection and production areas. The seismicity outlines NNW and NE trending lineaments, with strike rotated compared to the NNE/SSW and NE-SW orientation observed for most of the faults and eruptive fissures in the Hengill region (Figure 1).
Cluster C2, includes a relatively large area of geothermal surface manifestations. The depth distribution of the seismicity is rather large with events occurring from 1–5 km. However, the seismicity rate is relatively constant, making it more similar to the production areas than the injection areas. The C3 Ölfus-Bakki seismic belt has been previously studied in detail by several researchers (e.g., Parameswaran et al., 2020). Similar to previous studies we see relatively constant low-rate and relatively deep activity that is likely linked to the plate boundary activity.
4.2.4 Depth distributions
Outside of the production and injection areas, the earthquake clusters in the Hengill region show differences in focal depths with deeper clusters occurring around the edges of Hengill volcano, at 3–6 km towards the west (C1), north (S2), east (C2) and south (C3). The depth of 4–6 km corresponds well with the estimated depth of the brittle-ductile transition in the north (Tryggvason et al. (2002); Li et al. (2019)). In the southwest (C3), we find the deepest events located at 7 km. This is in good agreement with a deeper brittle-ductile boundary in this region (7–8 km, Li et al. (2019)).
4.2.5 Variable seismicity rates between areas experiencing similar harnessing
There are very contrasting levels of seismicity between the different injection and production areas. The Hellisheiði main production field (S3) has the largest rate of fluid extraction, however, the seismic activity in the nearby S1-Hverahlíð region, where significantly less fluid is being extracted, is much larger. Similarly, the seismicity in H1-Húsmúli is much more intense than in the nearby H2-Gráuhnúkar area, despite the rate of fluid injection into the two fields being similar. The intensity of the triggered seismicity is hence likely linked to the combination of the pre-existing natural stress-field and its alteration by injection and mass removal. This interpretation is supported by the study of the frequency magnitude distribution across the Hengill geothermal region. On average, the region shows a b-value of 1. This value is typically associated with natural tectonic earthquakes. The spatial distribution of b-values for selected clusters shows b-values range from 0.85 to 1.18, without a particular distinction between natural or induced seismicity regions. A possible interpretation is that a part of the induced events is the result of triggered tectonic faults during injection and production operations.
The location of the earthquake clusters tends to occur in areas of lower Vp/Vs ratios. However, the northwest-southeast structure perpendicular to the fissure swarm seen in Vp, Vs, and Vp/Vs slices is not reflected in the seismic activity. Most of the seismic clusters are situated outside or on the outer edges of the rift system. The seismicity in Hverahlíð is found in the same spot as a shallow, low Vp and low S-wave anomaly, but no universal similarities are discerned in the overall Hengill area.
5 Conclusion
We present a comprehensive seismic catalog of the greater Hengill geothermal region for the period of December 2018—January 2021, during which 38 seismometers monitored an area of 110 km2. We create a manual catalog to assess the quality of the automatically detected events and also to create minimum 1-D velocity models of the Hengill geothermal region. We show that accurate hypocenter locations are achieved by a joint inversion of P and S travel times for this data set.
In areas of geothermal harnessing, induced seismicity is located at depths between 1.5 and 3 km, whereas tectonic events typically occur at depths of 4–6 km, defining the brittle-ductile boundary. Seismicity related to injection is more clustered in time and aligns on faults, whereas production-related seismicity appears more diffuse in both time and space. In regions of naturally occurring geothermal activity, the seismicity has similar diffuse temporal behavior as in the production areas. Regions that experience similar rates of fluid extraction and injection may exhibit contrasting levels of seismicity. This is likely linked to the combination of the pre-existing natural stress-field that is altered by injection and mass removal that can then trigger seismic events. This interpretation is supported by the study of the frequency magnitude distribution across the Hengill geothermal region. On average, the region shows a b-value of 1. This value is typically associated with natural tectonic earthquakes. The spatial distribution of b-values for selected clusters shows b-values range from 0.85 to 1.21, without a particular distinction between natural or induced seismicity regions. A possible interpretation is that the induced events are the result of triggered pre-existing tectonic faults during injection and production operations.
We performed a Vp, Vs and Vp/Vs local earthquake tomography. At shallow depths (0–1 km), the Vp and Vs tomographic models indicate fast velocities along the postglacial fissure swarm as well as a SE-NW trend towards the Grensdalur volcanic center. At greater depth these anomalies are not as pronounced. At 1–3 km, the relatively fastest velocity is observed in the NW corner of the Grensdalur volcanic center coinciding with a gravity high, likely reflecting dense solidified magmatic intrusion(s) in the volcanic center. This SE-NW anomalous velocity feature extending between the extinct Grensdalur volcanic center and the presently active Hengill volcanic center is also reflected in traces of geothermal surface manifestations, a shallow lying low resistivity anomaly and an aero-magnetic low—all three due to high temperature at some point in the geological history of the area and most likely caused by the migration of the crustal accretion and volcanic activity between the two volcanic centers. At greater depth (>4 km) a deep lying resistivity low is seen cutting through the northern part of the Hengill volcanic center and trending towards Grensdalur. It presumably reflects hot, solidified intrusions that are heat sources for the geothermal system.
At 0–1 km depth, a zone of relatively low Vp/Vs ratios cuts through the Hengill volcanic center trending W-E, while at greater depth the low Vp/Vs ratio is mainly along the fissure swarm. At 1–3 km depth the low Vp/Vs anomaly coincides with the main production field, located slightly NE of the Hellisheiði power plant, possibly caused by the extensive extraction which lowers the pressure in the field, and consequently increases the steam zone leading to lower Vp/Vs ratios. Most of the earthquakes are located within the Vp/Vs low and at the boundary of the high and low Vp/Vs anomalies, which might indicate a region with good permeability.
Data availability statement
The datasets presented in this study can be found in online repositories. The names of the repository/repositories and accession number(s) can be found below: EIDA, FDSN code 2C. (https://www.fdsn.org/networks/detail/2C_2018/).
Author contributions
AO, AD, and TD conceived and designed the study. AD, TD, and AO organized the database. AD under supervision of TD and AO performed the initial analysis. S-MW reprocessed the data for the final manuscript. TA and GH digitized the older geoscientific data for comparison. SK and VH provided information about the different seismic clusters. All authors contributed to manuscript revision, read, and approved the submitted version.
Funding
The COSEISMIQ project has been subsidized through the ERANET Cofound GEOTHERMICA (Project no. 731117), from the European Commission, SFOE (SI/501721) and Rannís (170767–4,401). P.S-P. received funding from the European Research Council (ERC) under the European Union’s Horizon 2020 research and innovation program RISE (Real-Time Earthquake Risk Reduction for a Resilient Europe, No. 821115) and from the Swiss National Science Foundation (No. 200021–18196). Open access funding is provided by ETH Zurich.
Acknowledgments
AD acknowledges funding from the Centro de Estudios Interdisciplinarios Básicos y Aplicados en Complejidad (CeiBA), Bogota, Colombia in the form of a doctoral scholarship. TD acknowledges financial support from the Nationale Genossenschaft für die Lagerung radioaktiver Abfälle (Nagra). We thank all those who assisted in the field, often in harsh weather conditions, during the deployment of the 2C network, its maintenance and dismantling. A big thanks also to everybody involved in the IT support from ÍSOR and SED-side. Four reviewers helped to significantly improve the manuscript.
Conflict of interest
The authors declare that the research was conducted in the absence of any commercial or financial relationships that could be construed as a potential conflict of interest.
Publisher’s note
All claims expressed in this article are solely those of the authors and do not necessarily represent those of their affiliated organizations, or those of the publisher, the editors and the reviewers. Any product that may be evaluated in this article, or claim that may be made by its manufacturer, is not guaranteed or endorsed by the publisher.
Supplementary material
The Supplementary Material for this article can be found online at: https://www.frontiersin.org/articles/10.3389/feart.2022.969836/full#supplementary-material
References
Ágústsson, K., and Halldórsson, P. (2005). Seismic hazard in the Hengill area based on the SIL earthquake catalogue. Icelandic Meteorological Office.
Árnason, K., Eysteinsson, H., and Hersir, G. P. (2010). Joint 1-D inversion of TEM and MT data and 3D inversion of MT data in the Hengill area, SW Iceland. Geothermics 39 (1), 13–34. doi:10.1016/j.geothermics.2010.01.002
Árnason, K., Haraldsson, G. I., Johnsen, G. V., Thorbergsson, G., Hersir, G. P., Saemundsson, K., et al. (1987). Nesjavellir—Ölkelduháls. Surface investigation in 1986. Orkustofnun report. Icelandic, OS-87018/JHD-02, 112.
Árnason, K., Haraldsson, G. I., Johnsen, G. V., Thorbergsson, G., Hersir, G. P., Saemundsson, K., et al. (1986). Nesjavellir. Geological and geophysical surveys in 1985. Orkustofnun report. Icelandic, OS-86014JHD-02, 125.
Bacon, C. A., Johnson, J. H., White, R. S., and Rawlinson, N. (2022). On the origin of seismic anisotropy in the shallow crust of the Northern Volcanic Zone, Iceland. JGR. Solid Earth 127 (1), e2021JB022655. doi:10.1029/2021jb022655
Benediktsdóttir, Á., Árnason, K., Karlsdóttir, R., Vilhjálmsson, A. M., and Kristjánsson, B. R. (2021). Detailed resistivity models of sub-areas of the Hengill geothermal field, Iceland. Proc. World Geotherm. Congr. 2020+.
Biru, M. F. (2020). Well testing and power plant scenario analysis for hverahlid geothermal field, master’s thesis, faculty of industrial engineering, mechanical engineering and computer science. University of Iceland. http://hdl.handle.net/1946/35842.
Björnsson, A., Hersir, G. P., and Björnsson, G. (1986). The Hengill high temperature area, SW-Iceland: Regional geophysical survey. Trans. Geotherm. Counc. 10, 205
Björnsson, A., and Hersir, G. P. (1981). Geophysical reconnaissance study of the Hengill high temperature qeothermal area, SW-Iceland. Geotherm. Res. Counc. Trans. 5, 55
Björnsson, G., Gunnlaugsson, E., and Hjartarson, A. (2006). “Applying the Hengill geothermal reservoir model in power plant decision making and environmental impact studies,” in Proceedings, TOUGH symposium, 15–17.
Böðvarsson, R., Rögnvaldsson, S. T., Slunga, R., and Kjartansson, E. (1999). The SIL data acquisition system—At present and beyond year 2000. Phys. Earth Planet. Interiors 113 (1-4), 89–101. doi:10.1016/S0031-9201(99)00032-1
Budzinska, K. (2014). Man made deformation in the Hengill area between 2009-2013, M.Sc. thesis. Faculty of Earth Sciences, University of Iceland. Available at: https://skemman.is/bitstream/1946/19904/1/thesis1.pdf.
Clifton, A. E., Sigmundsson, F., Feigl, K. L., Guðmundsson, G., and Árnadóttir, T. (2002). Surface effects of faulting and deformation resulting from magma accumulation at the Hengill triple junction, SW Iceland, 1994–1998. J. Volcanol. Geotherm. Res. 115 (1-2), 233366–234255. doi:10.1016/s0377-0273(01)00319-5
Diehl, T., Husen, S., Kissling, E., and Deichmann, N. (2009). High-resolution 3-D P-wave model of the Alpine crust. Geophys. J. Int. 179 (2), 1133371–1141147. doi:10.1111/j.1365-246x.2009.04331.x
Diehl, T., Kissling, E., Herwegh, M., and Schmid, S. (2021). Improving absolute hypocenter accuracy with 3-D Pg and Sg body-wave inversion procedures and application to earthquakes in the central alps region. JGR. Solid Earth 126, e2021JB022155. doi:10.1029/2021JB022155
Diehl, T., Kraft, T., Kissling, E., and Wiemer, S. (2017). The induced earthquake sequence related to the St. Gallen deep geothermal project (Switzerland): Fault reactivation and fluid interactions imaged by micro-seismicity. J. Geophys. Res. Solid Earth 122 (9), 7272–7290. doi:10.1002/2017jb014473
Ducrocq, C., Geirsson, H., Árnadóttir, T., Juncu, D., Drouin, V., Gunnarsson, G., et al. (2021). Inflation-deflation episodes in the Hengill and hromundartindur volcanic complexes, SW Iceland. Front. Earth Sci. (Lausanne). 915, 725109. doi:10.3389/feart.2021.725109
Eberhart-Phillips, D. (1993). “Local earthquake tomography: Earthquake source regions,” in Seismic tomography: Theory and practice. Editors H. M. Iyer,, and K. Hirahara (Boca Raton, Fla: CRC Press), 613
Eberhart-Phillips, D. (1986). Three-dimensional velocity structure in northern California coast ranges from inversion of local earthquake arrival times. Bull. Seismol. Soc. Am. 76 (4), 1025
Evans, J., and Eberhart-Phillips, D. (1994). User’s manual guide for simulps 12 for imaging vp and vp/vs: A derivative of the “thurber” tomographic inversion simul3 for local earthquakes and explosions, open-file report 94-431. US Geol. Surv.
Feigl, K. L., Gasperi, J., Sigmundsson, F., and Rigo, A. (2000). Crustal deformation near Hengill volcano, Iceland 1993–1998: Coupling between magmatic activity and faulting inferred from elastic modeling of satellite radar interferograms. J. Geophys. Res. 105 (B11), 25655–25670. doi:10.1029/2000jb900209
Foulger, G., Miller, A., Julian, B. R., and Evans, J. R. (1995). Three-dimensional υp and υp/υsstructure of the Hengill triple junction and geothermal area, Iceland, and the repeatability of tomographic inversion. Geophys. Res. Lett. 22 (10), 1309–1312. doi:10.1029/94gl03387
Foulger, G. R. (1984). Seismological studies at the Hengill geothermal area SW Iceland. Durham theses, Durham University.
Foulger, G. R., and Toomey, D. R. (1989). Structure and evolution of the hengill-grensdalur volcanic complex, Iceland: Geology, geophysics, and seismic tomography. J. Geophys. Res. 94 (B12), 17511–17522. doi:10.1029/jb094ib12p17511
Franzson, H., Gunnlaugsson, E., Árnason, K., Sæmundsson, K., Steingrímsson, B., and Hardarson, B. S. (2010). The Hengill geothermal system, conceptual model and thermal evolution. Proc. World Geotherm. Congr. 25, 1
Friedrich, A., Krüger, F., and Klinge, K. (1998). Ocean-generated microseismic noise located with the Gräfenberg array. J. Seismol. 2 (1), 47–64. doi:10.1023/a:1009788904007
Green, R. A., Bommer, J. J., Rodriguez-Marek, A., Maurer, B. W., Stafford, P. J., Edwards, B., et al. (2019). Addressing limitations in existing ‘simplified’ liquefaction triggering evaluation procedures: Application to induced seismicity in the groningen gas field. Bull. Earthq. Eng. 17 (8), 4539–4557. doi:10.1007/s10518-018-0489-3
Grigoli, F., Clinton, J., Diehl, T., Kaestli, P., Scarabello, L., Ágústsdóttir, T., et al. (2022). Monitoring microseismicity of the Hengill geothermal field in Iceland. Sci. Data 9, 220. doi:10.1038/s41597-022-01339-w
Grigoli, F., Scarabello, L., Böse, M., Weber, B., Wiemer, S., and Clinton, J. F. (2018). Pick- and waveform-based techniques for real-time detection of induced seismicity. Geophys. J. Int. 213 (2), 868–884. doi:10.1093/gji/ggy019
Gudmundsson, O., Khan, A., and Voss, P. (2007). Rayleigh-wave group-velocity of the Icelandic crust from correlation of ambient seismic noise. Geophys. Res. Lett. 34 (14), L14314. doi:10.1029/2007gl030215
Gunnarsson, G., Fridriksson, T., Sigurðsson, P., Gunnarsson, I., Kristjánsson, B. R., Hjörleifsdóttir, V., et al. (2022). The Iceland deep drilling project (IDDP): Reaching into the roots of Iceland’s volcanic geothermal fields. GRC Trans. 46.
Haslinger, F., Kissling, E., Ansorge, J., Hatzfeld, D., Papadimitriou, E., Karakostas, V., et al. (1999). 3D crustal structure from local earthquake tomography around the Gulf of Arta (Ionian region, NW Greece). Tectonophysics 304 (3), 201–218. doi:10.1016/s0040-1951(98)00298-4
Heath, B. A., Eberhart-Phillips, D., Lanza, F., Thurber, C., Savage, M. K., Okada, T., et al. (2022). Fracturing and pore-fluid distribution in the Marlborough region, New Zealand from body-wave tomography: Implications for regional understanding of the Kaikōura area. Earth Planet. Sci. Lett. 593, 117666. doi:10.1016/j.epsl.2022.117666
Hersir, G. P., Björnsson, G., and Björnsson, A. (1990). Eldstöðvar og jarðhiti á Hengilssvæði. Jarðeðlisfræðileg könnun 13095 Orkustofnun OS-90031/JHD-06 93. (in Icelandic).
Humphreys, E., and Clayton, R. W. (1988). Adaptation of back projection tomography to seismic travel time problems. J. Geophys. Res. 93 (B2), 1073–1085. doi:10.1029/jb093ib02p01073
Husen, S., Kissling, E., and Flueh, E. R. (2000). Local earthquake tomography of shallow subduction in north Chile: A combined onshore and offshore study. J. Geophys. Res. 105 (B12), 28183–28198. doi:10.1029/2000jb900229
Husen, S., Smith, R. B., and Waite, G. P. (2004). Evidence for gas and magmatic sources beneath the Yellowstone volcanic field from seismic tomographic imaging. J. Volcanol. Geotherm. Res. 131 (3-4), 397–410. doi:10.1016/s0377-0273(03)00416-5
Jaya, M. S., Shapiro, S. A., Kristinsdóttir, L. H., Bruhn, D., Milsch, H., and Spangenberg, E. (2010). Temperature dependence of seismic properties in geothermal rocks at reservoir conditions. Geothermics 39, 115–123. doi:10.1016/j.geothermics.2009.12.002
Jousset, P., Haberland, C., Bauer, K., and Árnason, K. (2011). Hengill geothermal volcanic complex (Iceland) characterized by integrated geophysical observations. Geothermics 40, 1–24. doi:10.1016/j.geothermics.2010.12.008
Juncu, D., Árnadóttir, T., Geirsson, H., Guðmundsson, G. B., Lund, B., Gunnarsson, G., et al. (2020). Injection-induced surface deformation and seismicity at the Hellisheidi geothermal field, Iceland. J. Volcanol. Geotherm. Res. 391, 106337. doi:10.1016/j.jvolgeores.2018.03.019
Juncu, D., Árnadóttir, T., Hooper, A., and Gunnarsson, G. (2017). Anthropogenic and natural ground deformation in the Hengill geothermal area, Iceland. J. Geophys. Res. Solid Earth 122 (1), 692–709. doi:10.1002/2016jb013626
Kissling, E., Ellsworth, W., Eberhart-Phillips, D., and Kradolfer, U. (1994). Initial reference models in local earthquake tomography. J. Geophys. Res. 99 (B10), 19635–19646. doi:10.1029/93jb03138
Kissling, E. (1988). Geotomography with local earthquake data. Rev. Geophys. 26 (4), 659–698. doi:10.1029/rg026i004p00659
Kissling, E., Husen, S., and Haslinger, F. (2001). Model parametrization in seismic tomography: A choice of consequence for the solution quality. Phys. Earth Planet. Interiors 123 (2-4), 89–101. doi:10.1016/s0031-9201(00)00203-x
Kissling, E., Kradolfer, U., and Maurer, H. (1995). Program Velest user’s guide-short introduction. ETH Zurich: Institute of Geophysics.
Li, K. L., Abril, C., Gudmundsson, O., and Gudmundsson, G. B. (2019). Seismicity of the Hengill area, SW Iceland: Details revealed by catalog relocation and collapsing. J. Volcanol. Geotherm. Res. 376, 15–26. doi:10.1016/j.jvolgeores.2019.03.008
Lomax, A., Michelini, A., and Curtis, A. (2014). “Earthquake location, direct, global-search methods,” in Encyclopedia of complexity and systems science. Editor R. Meyers (New York, NY: Springer). doi:10.1007/978-3-642-27737-5_150-2
Lomax, A., Virieux, J., Volant, P., and Berge-Thierry, C. (2000). Probabilistic earthquake location in 3D and layered models. Dordrecht: Springer Netherlands, 101.
McNamara, D. E., and Boaz, R. I. (2019). Visualization of the seismic ambient noise spectrum. e: Seismic Ambient Nois, 1–29.
Mignan, A., and Woessner, J. (2012). “Theme IV—Understanding seismicity catalogs and their problems,” in Community online resource for statistical seismicity analysis. Technical Report. doi:10.5078/corssa-00180805
Miller, A., Julian, B., and Foulger, G. (1998). Three-dimensional seismic structure and moment tensors of non-double-couple earthquakes at the Hengill-Grensdalur volcanic complex, Iceland. Geophys. J. Int. 133 (2), 309–325. doi:10.1046/j.1365-246x.1998.00492.x
Obermann, A., and Hillers, G. (2019). Seismic time-lapse interferometry across scales. Adv. Geophys. 60, 65
Obermann, A., Sánchez-Pastor, P., Wu, S-M., Wollin, C., Baird, A. F., Isken, M. P., et al. (2022). Combined large-N seismic arrays and DAS fibre optic cables across the Hengill geothermal field. Icel and, SRL. doi:10.1785/0220220073
Parameswaran, R. M., Thorbjarnardóttir, B. S., Stefánsson, R., and Bjarnason, I. T. (2020). Seismicity on conjugate faults in Ölfus, South Iceland: Case study of the 1998 Hjalli-Ölfus earthquake. JGR. Solid Earth 125 (8), e2019JB019203. doi:10.1029/2019jb019203
Paulillo, A., Striolo, A., and Lettieri, P. (2019). The environmental impacts and the carbon intensity of geothermal energy: A case study on the Hellisheiði plant. Environ. Int. 133, 105226. doi:10.1016/j.envint.2019.105226
Pedersen, R., Sigmundsson, F., and Einarsson, P. (2007). Controlling factors on earthquake swarms associated with magmatic intrusions; Constraints from Iceland. J. Volcanol. Geotherm. Res. 162, 73–80. doi:10.1016/j.jvolgeores.2006.12.010
Rögnvaldsson, S. Th., Guðmundsson, G. B., Ágústsson, K., Jakobsdóttir, S. S., Slunga, R., and Stefánsson, R. (1998). Overview of the 1993-1996 seismicity near Hengill. Report ví-r98006-JA05, veðurstofa íslands. Reykjavík.
Rossi, C., Grigoli, F., Cesca, S., Heimann, S., Gasperini, P., Hjörleifsdóttir, V., et al. (2020). Full-waveform based methods for microseismic monitoring operations: An application to natural and induced seismicity in the Hengill geothermal area, Iceland. Adv. Geosci. 54, 129–136. doi:10.5194/adgeo-54-129-2020
Sæmundsson, K., and Saemundsson, K. (1992). Geology of the thingvallavatn area. OIKOS (a J. Nord. Ecol. Soc.) 64, 40–68. doi:10.2307/3545042
Sæmundsson, K., Sigurgeirsson, M. A., Hjartarson, A., Kaldal, I., and Kristinsson, S. G. (2016). Reykjavík: Iceland GeoSurvey. 2nd ed., 1. Geological Map of of Southweast Iceland, 100
Sæmundsson, K. (1967). Vulkanismus und Tektonik des Hengill-Gebietes in Sudwest-Island. Acta Nat. Isl. II-7, 195. (in German).
Sánchez-Pastor, P., Obermann, A., Reinsch, T., Ágústsdóttir, G., Gunnarsson, G., Tómasdóttir, S., et al. (2020). Imaging high-temperature geothermal reservoirs with ambient seismic noise tomography, a case study of the Hengill geothermal field, SW Iceland. Geothermics 96. doi:10.101H/j.geothermics.2021.102207
Segall, P. (1989). Earthquakes triggered by fluid extraction. Geol. 17 (10), 942–946. doi:10.1130/0091-7613(1989)017<0942:etbfe>2.3.co;2
Shi, Y., and Bolt, B. A. (1982). The standard error of the magnitude-frequency b value. Bull. Seismol. Soc. Am. 72 (5), 1677–1687. doi:10.1785/bssa0720051677
Sigmundsson, F., Einarsson, P., Rögnvaldsson, S. T., Foulger, G. R., Hodgkinson, K. M., and Thorbergsson, G. (1997). The 1994–1995 seismicity and deformation at the Hengill triple junction, Iceland: Triggering of earthquakes by minor magma injection in a zone of horizontal shear stress. J. Geophys. Res. 102 (B7), 15151–15161. doi:10.1029/97jb00892
Stefánsson, R., Bödvarsson, R., Slunga, R., Einarsson, P., Jakobsdóttir, S., Bungum, H., et al. (1993). Earthquake prediction research in the South Iceland seismic zone and the SIL project. Bull. Seismol. Soc. Am. 83, 696
Steingrimsson, B. (2013). Geothermal well logging: Temperature and pressure logs. Tutorial-Geothermal Training Programme.
Thurber, C. (1993). Local earthquake tomography: Velocities and vp/vs theory, seismic tomography: Theory and practice, 563
Toomey, D., and Foulger, G. (1989). Tomographic inversion of local earthquake data from the Hengill Grensdalur central volcano complex, Iceland. J. Geophys. Res. 94 (B12), 17497–17510. doi:10.1029/jb094ib12p17497
Tryggvason, A., Rögnvaldsson, S. T., and Flóvenz, O. G. (2002). Three-dimensional imaging of the P and S-wave velocity structure and earthquake locations beneath Southwest Iceland. Geophys. J. Int. 151 (3), 848–866. doi:10.1046/j.1365-246x.2002.01812.x
Van Stiphout, T., Kissling, E., Wiemer, S., and Ruppert, N. (2009). Magmatic processes in the Alaska subduction zone by combined 3-D b value imaging and targeted seismic tomography. J. Geophys. Res. 114 (B11), 5958. doi:10.1029/2008jb005958
van Thienen-Visser, K., and Breunese, J. N. (2015). Induced seismicity of the Groningen gas field: History and recent developments. Lead. Edge 346, 664–671. doi:10.1190/tle34060664.1
Vogfjörð, K. S., Hjaltadóttir, S., Kjartansson, E., Pétursson, G. G., Sveinbjörnsson, H., Ármanssdóttir, S., et al. (2012). Seismic Activity in the Hengill Region, Georg seminar on deep roots of geothermal systems. Available at: http://georg.hi.is/files/kristin.pdf.
Wagner, F. (2019). Toward fully automatic earthquake detection and processing for tomography in the Hengill area, doctoral dissertation. Acta Universitatis Upsaliensis.
Waldhauser, F., and Ellsworth, W. L. (2000). A double-difference earthquake location algorithm: Method and application to the northern Hayward fault, California. Bull. Seismol. Soc. Am. 90 (6), 1353–1368. doi:10.1785/0120000006
Wiemer, S. (2001). A software package to analyze seismicity: Zmap. Seismol. Res. Lett. 72 (3), 373–382. doi:10.1785/gssrl.72.3.373
Wiemer, S., and Wyss, M. (2000). Minimum magnitude of completeness in earthquake catalogs: Examples from Alaska, the Western United States, and Japan. Bull. Seismol. Soc. Am. 90 (4), 859–869. doi:10.1785/0119990114
Keywords: induced seismicity, geothermal, tomographic imaging, b-value, velocity model
Citation: Obermann A, Wu S-M, Ágústsdóttir T, Duran A, Diehl T, Sánchez-Pastor P, Kristjansdóttir S, Hjörleifsdóttir V, Wiemer S and Hersir GP (2022) Seismicity and 3-D body-wave velocity models across the Hengill geothermal area, SW Iceland. Front. Earth Sci. 10:969836. doi: 10.3389/feart.2022.969836
Received: 15 June 2022; Accepted: 01 November 2022;
Published: 20 December 2022.
Edited by:
Nicola Alessandro Pino, National Institute of Geophysics and Volcanology (INGV), ItalyReviewed by:
Christine Powell, University of Memphis, United StatesSimona Gabrielli, Istituto Nazionale di Geofisica e Vulcanologia (INGV), Italy
Pasquale De Gori, Istituto Nazionale di Geofisica e Vulcanologia (INGV), Italy
Copyright © 2022 Obermann, Wu, Ágústsdóttir, Duran, Diehl, Sánchez-Pastor, Kristjansdóttir, Hjörleifsdóttir, Wiemer and Hersir. This is an open-access article distributed under the terms of the Creative Commons Attribution License (CC BY). The use, distribution or reproduction in other forums is permitted, provided the original author(s) and the copyright owner(s) are credited and that the original publication in this journal is cited, in accordance with accepted academic practice. No use, distribution or reproduction is permitted which does not comply with these terms.
*Correspondence: Anne Obermann, YW5uZS5vYmVybWFubkBzZWQuZXRoei5jaA==