 Luying Ji
 Xiefei Zhi2*
 Shoupeng Zhu
- 1Key Laboratory of Transportation Meteorology of China Meteorological Administration, Nanjing Joint Institute for Atmospheric Sciences, Nanjing, China
- 2Key Laboratory of Meteorological Disasters, Ministry of Education (KLME)/Collaborative Innovation Center on Forecast and Evaluation of Meteorological Disasters (CIC-FEMD), Nanjing University of Information Science & Technology, Nanjing, China
- 3Institute for Geosciences—Section Meteorology, University of Bonn, Bonn, Germany
- 4Deutscher Wetterdienst, Offenbach, Germany
- 5Guangdong Meteorological Bureau, Guangzhou, China
- 6State Key Laboratory of Severe Weather, Chinese Academy of Meteorological Science, Beijing, China
In this study, the high-resolution ensemble prediction system COSMO (Consortium for Small Scale) EPS is used to predict the extreme rainstorm that occurred from 27 to 31 August 2018 in Guangdong Province, China, which leads to intensities exceeding historical extreme values. COSMO EPS is run with a 2.8-km grid spacing, allowing for an explicit treatment of deep convection, and 24 members of the EPS are initialized and laterally driven by the ICON (ICOsahedral Nonhydrostatic) global model. We compare the predictions of COSMO EPS against observations derived from the global precipitation measurement (GPM) and with ensemble forecasts of both mesoscale EPS and global EPS provided by GRAPES (Global and Regional Assimilation and PrEdiction System), and with the deterministic forecasts of global models ICON and ECMWF (European Centre for Medium-Range Weather Forecasts). Model performances are evaluated both by gridpoint-based scores, such as the equitable threat score (ETS), and by the Method for Object-based Diagnostic Evaluation (MODE) for spatial verification. According to our results, COSMO EPS could perform better forecasts for the rainstorms taken place in eastern Guangdong than other models. However, the location and coverage area of its predicted rainstorm is eastward and smaller in contrast with the observations. Therefore, COSMO EPS exhibits relative high performance by object-based spatial evaluations, while it could not display evident superiority in terms of the gridpoint-based scores. The cause analysis of this extreme rainstorm shows that Guangdong Province of China is mainly affected by monsoon depression. Southwesterly and southerly winds continuously transport water vapor from the South China Sea to Guangdong Province. The southwest monsoon low-level jet advances northward over time, which promotes the occurrence and development of continuous heavy precipitation in the coastal areas of Guangdong. In an additional experiment, we investigate the benefit of assimilation of radar data, by applying the latent heat nudging (LHN) approach based on surface-based radar observations to the COSMO EPS. Subsequently, the prediction by assimilation of radar data more reasonably reproduces the spatial distribution of precipitation observations, while the coverage and intensity of the rainstorm in eastern Guangdong are still not reflected satisfactorily.
1 Introduction
During the period of 27–31 August 2018, a continuous, long-lasting, and heavy precipitation occurred in the Guangdong Province, especially over the southern part of the Pearl River Delta and eastern Guangdong. Both the total accumulated precipitation over 5 days and daily precipitation over the Huidong and Luhe regions exceeded historical maxima. From 21 UTC on 30 August to 21 UTC on 31 August, 1,057 mm of precipitation fell over Gaotan Town in Huidong, resetting the historical maximum for the whole Guangdong Province and for non-typhoon precipitation over mainland China. This extreme rainstorm event caused 23 reservoirs in Guangdong to exceed the flood limit, and many places suffered severe waterlogging lasting for more than a week. The lives of 1.9 million people were strongly affected, with two people dying and two missing. The direct economic loss exceeded 0.5 billion USD.
Guangdong Province is adjacent to the western Pacific Ocean, the South China Sea, and the Bay of Bengal. Thus, it is usually influenced by the East Asian monsoon, the Indian monsoon, the western Pacific subtropical high, and typhoons, resulting in abundant water vapor and frequent rainstorms (Wu et al., 2018). The monsoon depression usually brings heavy but not extreme precipitation to Guangdong. However, the extreme rainstorm that occurred at the end of summer 2018 in Guangdong was closely related to the monsoon depression. None of the numerical models such as ECMWF (European Centre for Medium-Range Weather Forecasts) used by the Guangdong (Provincial) Meteorological Bureau successfully predicted this event.
Extreme precipitation forecasting is one of the major challenges in numerical weather prediction (NWP). Many NWP models remain unable to predict the extreme weather resulting from small-scale processes to a satisfactory degree because of insufficient spatial resolution. Regional high-resolution (∼1 km) NWP (HR-NWP) models have been developed to improve the prediction skill of these events (Roberts et al., 2009; Mahoney et al., 2012; Sun et al., 2014; Hoogewind et al., 2016) by better and more explicitly describing the mesoscale processes based on their non-hydrostatic dynamics (Mass et al., 2002; Kain et al., 2008; Tang et al., 2013; Soares et al., 2017; Knist et al., 2020). Nowadays, many national meteorological centers operate HR-NWP models to provide guidance for extreme weather warnings (Saito et al., 2006; Skamarock and Klemp 2008; Staniforth and Wood 2008; Weisman et al., 2008; Bouttier 2009; Baldauf et al., 2011; Seity et al., 2011).
Since 2003, the Deutscher Wetterdienst (DWD; German national meteorological service) has developed the convective-scale HR-NWP model COSMO (Consortium for Small Scale Modeling) with a horizontal grid spacing of 2.8 km, which has been used for operational forecasts since April 2007. A detailed model description can be found in the studies by Doms and Schättler (1999), Steppeler et al. (2003), and Rockel et al. (2008). Many studies have indicated the capability of the COSMO model to simulate well severe weather events (Hohenegger et al., 2008; Seifert et al., 2008; Schlüter and Schädler 2010; Bentzien and Friederichs 2012; Kober et al., 2012; Sokol et al., 2014; Beck et al., 2016), and the model has been implemented as the atmospheric component in the regional Terrestrial System Modeling Platform (TerrSysMP, Shrestha et al., 2014; Simmer et al., 2014).
It is consensual that perfect numerical weather forecasts can never be achieved because even the small uncertainties associated with models and initial conditions will inevitably increase, eventually making any deterministic forecasts probably useless (Lorenz 1963, 1969). An ensemble prediction system (EPS) produces a limited number of ensemble forecasts to estimate the future atmospheric state instead of one deterministic forecast, which not only improves the forecast accuracy but also provides information about forecast uncertainty (Leith, 1974; Buizza et al., 2005; Bowler et al., 2008; Bouttier et al., 2012; Röpnack et al., 2013; Ben Bouallègue and Theis, 2014; Beck et al., 2016). COSMO-DE-EPS is a regional EPS with 20 ensemble members based on COSMO-DE and running operationally at DWD every 3 h with a resolution of 2.8 km, producing 27-h forecasts (up to 45 h at 03 UTC) since May 2012. The uncertainties of the COSMO-DE-EPS are described by perturbations of the initial state, lateral boundary conditions, and model physics (Gebhardt et al., 2011; Peralta et al., 2012; Kühnlein et al., 2014). On 15 May 2018, COSMO-DE-EPS was upgraded with the horizontal resolution increasing from 2.8 to 2.2 km, and now it is called COSMO-D2-EPS (Hess, 2020).
In this study, we apply the COSMO EPS under the framework of TerrSysMP to South China and verify its ability to predict the heavy precipitation event over the Guangdong Province, evaluating its performance against other models. In Section 2, we describe the experiment design including the study region, model configuration, observations, and the other model datasets that are compared with the COSMO forecasts. A subsection introduces the adopted gridpoint-based and object-based verification techniques. The comparisons among COSMO predictions, observations, and other model predictions as well as the impact of mesoscale data assimilation on COSMO forecasts are presented in Section 3. A summary and discussion are provided in Section 4.
2 Data and methods
2.1 Experiment design
2.1.1 Study region
Guangdong Province is located in the southernmost part of mainland China, which is located between 20°13′N–25°31′N and 109°39′E–117°19′E. It is mostly characterized by a subtropical monsoon climate with hot and rainy summers and mild and dry winters. The annual mean precipitation in this province is 1,774 mm, and its annual mean temperature is 21.9°C. The terrain is high in the north and low in the south, with an average altitude of 100 m and a maximum altitude of 1,902 m. The province is the one most affected by typhoons in China. Figure 1 shows the model domain used for COSMO in this study (dashed line), which has a spatial extension of roughly 2,240 × 1,176 km2.
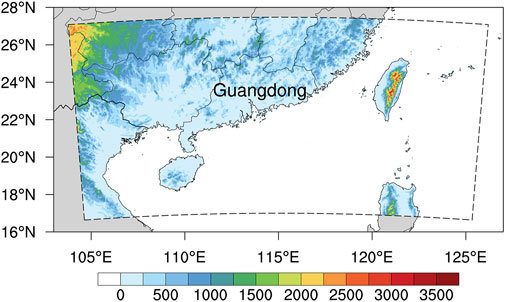
FIGURE 1. The study region encompasses the Guangdong Province. The model domain of COSMO is indicated by the black dashed line with its elevations above sea level displayed according to the color bar. Thin black lines indicate the coastline and borders between Chinese provinces; the full black line indicates the continental Chinese–Vietnamese border.
2.1.2 COSMO model configuration
All our predictions are performed with the COSMO model, version 5.01. The model is constructed based on the primitive thermo-hydrodynamical equations describing the compressible flow of a moist atmosphere. The model equations are formulated in rotated geographical coordinates with a generalized terrain following a height coordinate (http://www.cosmo-model.org/). The north pole is shifted in order to allow for similar grid area extensions within the model area. The grid specifications for our experiments are summarized in Table 1.
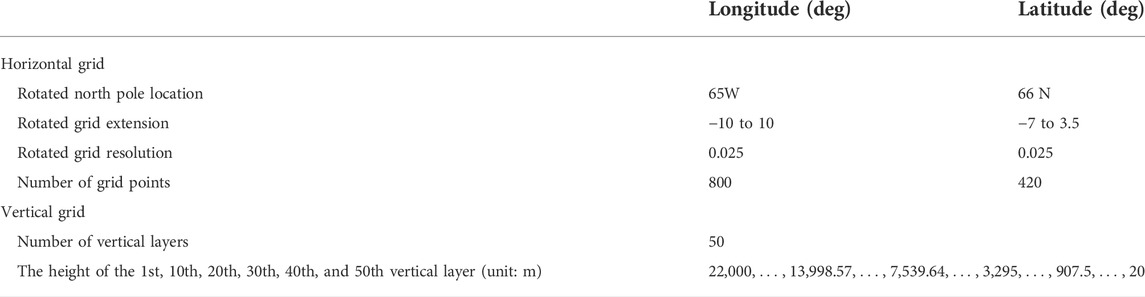
TABLE 1. Grid specifications of the COSMO model.
The regional model COSMO (2.8 km) uses predictions from the global model ICON (ICOsahedral Nonhydrostatic; Zängl et al., 2015) with the horizontal resolution of 13 km as initial and lateral boundary conditions in our experiments. While the boundary conditions for COSMO are only available every 3 h, the model automatically (linearly) interpolates between these times so that boundary conditions are available at any time. Table 2 provides the basic model configuration parameters we used for the COSMO predictions. Since tropical and sub-tropical regions, as well as rough mountainous regions, are contained in the model domain, the bottom height from which the Rayleigh sponge layer extends to the top of the model domain needs to be adjusted from its default value of 11–14 km (Wang et al., 2013). The width of the lateral boundary relaxation layer is recommended to be 10 to 15 times the grid mesh size; thus, it is set to 28 km. The COSMO predictions are initialized daily at 00 UTC and run for 24 h from 27 to 31 August 2018.
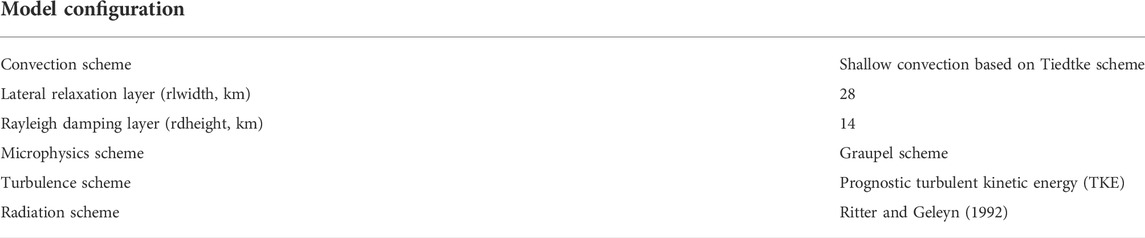
TABLE 2. Basic model configuration parameters for COSMO.
The COSMO EPS used in our study is a multi-physics ensemble. The different parameter values of the COSMO model physics package used in our experiments are set following the COSMO-DE-EPS guidance document (Kühnlein et al., 2014) and are listed in Table 3. For the EPS, four parameters are perturbed: the scaling factor for the thickness of the laminar boundary layer for heat rlam_heat, the mean entrainment rate for shallow convection entr_sc, the critical value for normalized over-saturation q_crit, and the asymptotic maximal turbulent distance tur_len. To perturb the parameters equally and taking the dependencies between the various parameters into account, the product of the perturbation parameters rlam_heat and rat_sea (ratio of laminar scaling factors for heat over sea and land) should be kept constant (Theis et al., 2017). Thus, a total of 24 ensemble members are finally obtained by using all possible combinations of default and perturbed values of the four parameters listed in Table 3.
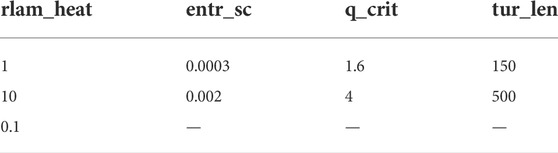
TABLE 3. Parameter values of the COSMO model physics package used for the ensemble members of the COSMO EPS. Parameter rlam_heat is the scaling factor for the thickness of the laminar boundary layer for heat; entr_sc is the mean entrainment rate for shallow convection; q_crit is the critical value for normalized over-saturation; and tur_len is the asymptotic maximal turbulent distance. The first line of numbers gives the default values also used in the EPS.
2.2 Forecasts from other operational prediction systems
We compare the COSMO EPS precipitation forecasts with the deterministic forecasts of its global driving model ICON, the deterministic forecasts of the European Centre for Medium-Range Weather Forecasts (ECMWF), and the ensemble forecasts of two GRAPES (Global and Regional Assimilation and PrEdiction System) EPSs, which are running operationally at China Meteorological Administration (CMA) (for details, see Table 4).
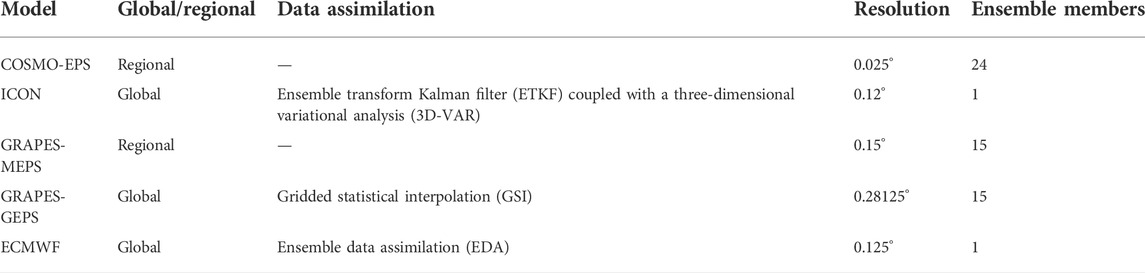
TABLE 4. Various models used for comparisons in this study.
The GRAPES model has a fully compressible dynamical core based on the non-hydrostatic approximation, a semi-implicit and semi-Lagrangian scheme for time integration, and a height-based terrain-following sigma coordinate system (Chen et al., 2019). GRAPES mesoscale EPS (GRAPES MEPS) has 15 ensemble members covering all regions of China, for which the initial conditions and lateral boundary conditions are downscaled from the corresponding members of the GRAPES global EPS (GRAPES GEPS; Zhang et al., 2014; Xia et al., 2019). GRAPES GEPS uses gridded statistical interpolation (GSI) for the operational data assimilation, while ensemble data assimilation (EDA) is employed by ECMWF. The global model ICON running operationally at DWD adopts a hybrid method with an assimilation cycle of 3 h, which consists of an ensemble transform Kalman filter (ETKF) coupled with a three-dimensional variational analysis (3D-VAR).
2.3 Verifying data
The global precipitation measurement (GPM) with a horizontal resolution of 0.1° × 0.1° provided by the new generation of precipitation observation satellites is used as the observation. The GPM satellite was launched on 27 February 2017. It inherits and improves the algorithm and the detection technology of the TRMM (Tropical Rainfall Measuring Mission) satellite. The dual-frequency radar observation system is first adopted to provide precipitation data with higher spatiotemporal resolution over a wider spatial area, contributing to more accurate descriptions of the precipitation distribution (Liu et al., 2017; Huffman et al., 2019). All forecast data are regridded to the observation grid.
In addition, the estimated precipitation rates derived from ten S-band Doppler radars covering the Guangdong Province via classic Z–R relations are used for latent heat nudging (LHN) experiments, which are further discussed in Section 3.3. The average separation of these radars is 100–150 km, and the maximum observed range is 230 km.
2.4 Verification methods
2.4.1 Gridpoint-based evaluation
The pattern correlation coefficient (PCC), the mean absolute error (MAE), and the equitable threat score (ETS) are used to compare the model forecasts with the observations grid point by grid point; they are defined by
with
2.4.2 Object-based evaluation
The gridpoint-based verification techniques introduced earlier may not satisfactorily reflect the forecast spatial features at convective scales because even small spatial displacements between forecast and observation resulting from the random components of the precipitation patterns will strongly deteriorate these measures by double punishment. Spatial verification methods such as the method for object-based diagnostic evaluation (MODE, Davis et al., 2006; 2009; Johnson et al., 2013; Mittermaier and Bullock, 2013), the fractions skill score (FSS, Roberts, 2008; Mittermaier and Roberts, 2009), the intensity scale (IS, Casati et al., 2004; Casati 2009), and image warping (IW, Gilleland et al., 2010) have been proposed and are in use to account for these circumstances. In this study, the MODE is used to assess the spatial features of the model forecasts.
The MODE first identifies precipitation objects by applying an intensity threshold to the spatially filtered observed and forecast precipitation fields. Second, several attributes of the precipitation objects are determined. We use, similar to Ji et al. (2020), the area coverage (the number of grid points covered by the object), the orientation angle (the orientation of the major axis in degrees counted clockwise starting at zonal orientation), the aspect ratio (the ratio of the minor axis to the major axis, i.e., 1.0 for a circular object and < 1 otherwise), and the zonal (east-west) and meridional (south-north) centroid location in this study. Third, an object from the forecast field will be matched to an object in the observed field when the centroid distance between these two objects is smaller than their average size. If matched successfully, these two objects are marked as one “object pair.” Finally, the fuzzy object-based threat score (OTS) is calculated to quantify the similarity between all observed and forecast objects (including matched or not matched objects) based on their attribute differences.
where
3 Results and analysis
3.1 Evaluations and comparisons of different models
The spatial distribution of observed precipitation is compared with different model forecasts in Figure 2. For an EPS such as COSMO, the precipitation distribution is represented by its ensemble median forecast in Figure 2. The precipitation caused by the extreme storm event that accumulated over the period 27–31 August 2018 is mainly concentrated in the southeast coastal areas and gradually decreases from southeast to northwest. Only COSMO EPS and ECMWF predict the heavy precipitation over the eastern coastal regions where the 5-day total precipitation exceeds 250 mm, but the location of the heavy precipitation in both of them exhibits a larger eastward bias than the observations. The coverage area of heavy precipitation predicted by ECMWF is relatively small, while COSMO EPS’ prediction is closer to the reality. However, COSMO EPS also predicts a second heavy precipitation center in the northern inland, which is not observed. In other regions of Guangdong Province, the precipitation predicted by COSMO EPS is much weaker than the observations, especially in the southern Pearl River Delta. ICON and GRAPES MEPS both underestimate the precipitation in eastern Guangdong while predicting well in the central and northern inland regions. GRAPES GEPS overforecasts precipitation in most regions of Guangdong. The corresponding gridpoint-based scores of different model forecasts are consistent with the visual appearance (not shown). Although ICON and GRAPES MEPS have the smallest MAE and largest PCC values, their ETS values for heavy precipitation above 250 mm are almost zero because they both underforecast the extreme precipitation. In contrast, COSMO EPS obtains the largest MAE and smallest PCC values, but it performs best for heavy precipitation exceeding 250 mm by showing the highest ETS value among all models.
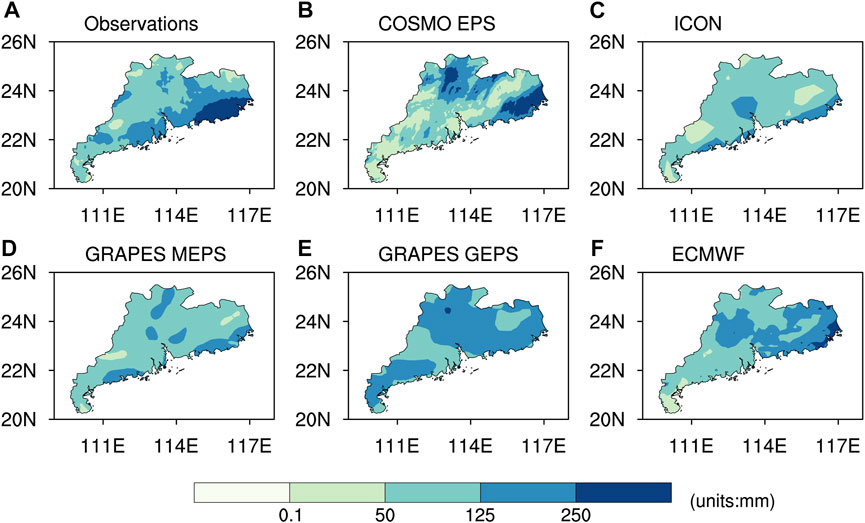
FIGURE 2. Spatial distributions of cumulative precipitation in Guangdong Province during the period of 27–31 August 2018 for (A) the observations; (B) the ensemble median forecast of COSMO EPS based on the COSMO-noLHN experiment (i.e., pure downscaling of ICON global predictions); (C) the deterministic forecast of the ICON global model; (D–E) the ensemble median forecast of GRAPES MEPS and GRAPES GEPS, respectively; (F) the deterministic forecast of ECMWF global model.
The occurrence frequency of daily precipitation according to its amount as quantified by the cumulative distribution function (CDF) varies considerably between model forecasts and observations (Figure 3). During the period of 27–31 August 2018, the CDFs of GRAPES MEPS and GRAPES GEPS increased rapidly with the increase of the precipitation amount, which are quite different from the observed distributions. The CDFs will reach 1 when the daily precipitation predicted by GRAPES MEPS is just around 40–60 mm, and GRAPES GEPS forecasts are generally below 80 mm. This phenomenon reflects the fact that both GRAPES models (including regional and global EPS) underpredict this extreme rainstorm event in Guangdong. ICON and ECMWF perform similarly, with both models underestimating the occurrence of the lower precipitation amounts and overestimating the occurrence of precipitation amounts above 60 mm, especially on 29 and 30 August 2018. Compared with these four models, the CDF curves of COSMO EPS are much closer to the observations, except for 31 August 2018. Especially for higher precipitation amounts, COSMO EPS CDFs almost coincide with the observed CDFs, but it overestimates the occurrence of precipitation below 40 mm. Visually and also quantified by the non-parametric two-sample Kolmogorov–Smirnov test, which does not require restrictive assumptions about the distribution of the test statistic (Orskaug et al., 2011), COSMO EPS reproduces the observed CDF best. But none of the model CDFs—including the one produced by COSMO EPS—stands the test for similarity with the observations (not shown). The gridpoint-based statistics (i.e., MAE, PCC, and ETS) for daily precipitation verification are shown in Figures 5A–D. COSMO EPS performs again only below average compared to the other models in terms of MAE and PCC, but shows the best forecasts for the daily heavy precipitation above 50 mm during 27–29 August 2018. GRAPES GEPS performs well for the heavy precipitation that occurred on 30 and 31 August 2018. ICON and GRAPES GEPS exhibit relatively high performance for daily precipitation above 25 mm, but have almost no forecasting skill for heavy precipitation.
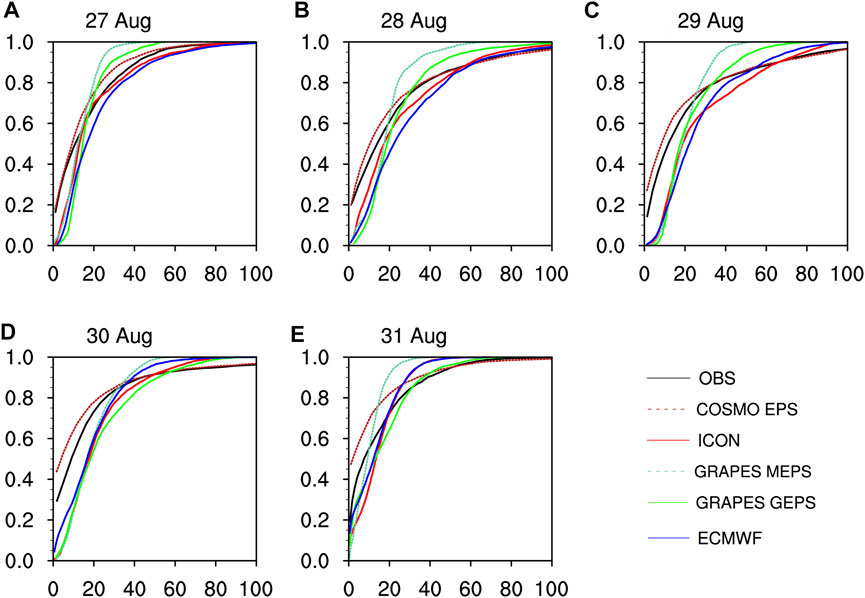
FIGURE 3. Cumulative distribution functions (CDF) of daily accumulated precipitation for the observations (the black solid line) and all model predictions (the colored lines) used in this study. The horizontal axis represents the precipitation amount. The dashed lines represent the results of the regional models (i.e., COSMO EPS and GRAPES MEPS) and the colored solid lines represent the global models.
To focus on the heavy precipitation, Figure 4 only displays the daily precipitation objects with intensity exceeding 25 and 50 mm identified by the MODE. For the object identification, the precipitation field is spatially smoothed with a convolution radius of four grid points in our evaluations in order to account for an effective resolution of a model being about seven grid points (Skamarock 2004). The quantification of similarities between the forecast objects and the observed objects by OTS metric is shown in Figures 5E,F. The precipitation on 27 August 2018 is in the early stage of development. The observed areas with daily precipitation above 25 mm are mainly located in northern, western, and eastern Guangdong. Only ECMWF predicts the observed rain belt in northern Guangdong, contributing to its highest OTS value. COSMO EPS predicts heavy precipitation over the east coast, consistent with the observations, but with stronger intensities. The other three models all underpredict the precipitation. On 28 August, the heavy precipitation gradually concentrated in the Pearl River Delta. The precipitation distribution predicted by ICON is the one most similar to the observations. COSMO EPS predicts a wide range of heavy precipitation in coastal areas, most of which are not observed. The coverage area of heavy precipitation expands significantly on 29 August and is located in the coastal regions with the rain belt northeast–southwest oriented. To a certain extent, the heavy precipitation in eastern Guangdong has been predicted by COSMO EPS and ECMWF. In contrast, both ICON and GRAPES MEPS underestimate the precipitation above 50 mm but predict well the precipitation above 25 mm. Therefore, the former two models obtain the highest OTS values for the threshold of 50 mm, and the latter two models have the highest OTS values for the threshold of 25 mm. On 30 August, the heavy precipitation moves to eastern Guangdong. The distributions of heavy precipitation above 50 mm predicted by COSMO EPS and GRAPES GEPS are similar. Their forecast coverage area of heavy precipitation in eastern Guangdong is much smaller than the observations, and heavy precipitation predicted in other regions has not actually happened. The coverage area and intensity of heavy precipitation decrease on 31 August, which is mainly located in Heyuan city. All five models’ precipitation distributions are different from the observations. COSMO EPS and GRAPES GEPS predict some regions in which heavy precipitation occurs, but with incorrect locations.
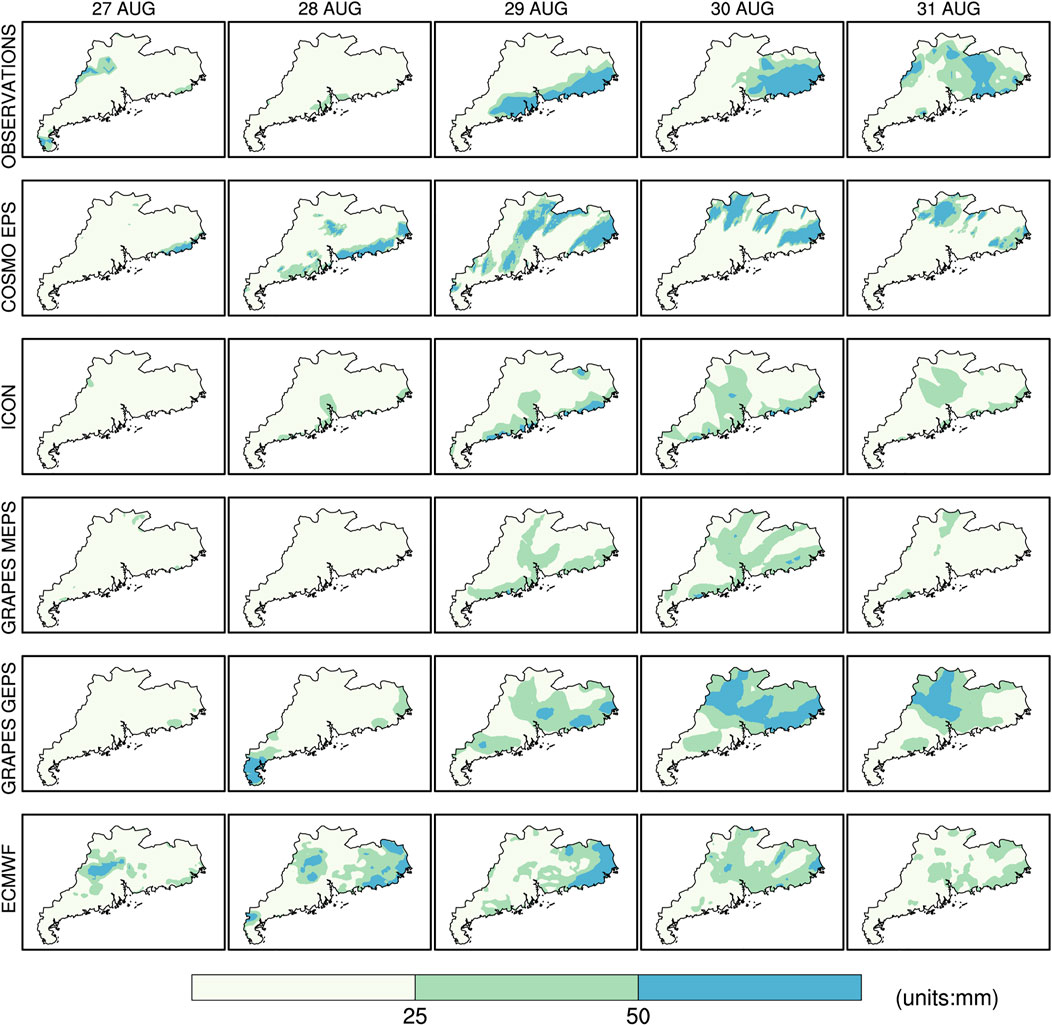
FIGURE 4. Daily precipitation objects identified by the MODE in the observed field and all models’ forecast fields (in the columns) during the period of 27–31 August 2018 (in the row) with a four-gridpoint averaging radius and thresholds of 25 and 50 mm.
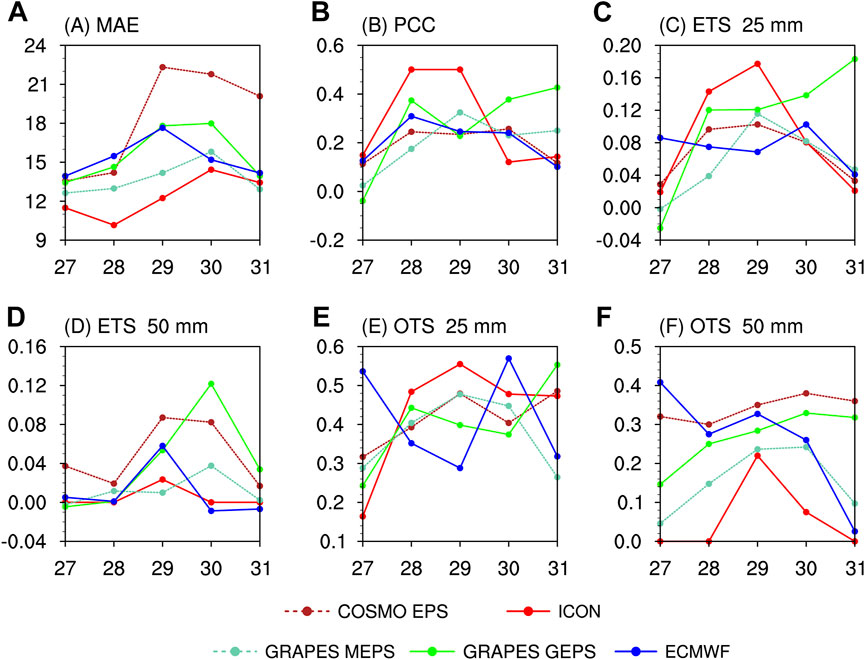
FIGURE 5. Gridpoint-based and object-based evaluations for daily accumulated precipitation obtained from different models during the period of 27–31 August 2018. (A) MAE (unit: mm); (B) PCC; (C,D) ETS for precipitation exceeding 25 and 50 mm; (E,F) OTS for precipitation exceeding 25 and 50 mm.
3.2 Cause analysis
In order to obtain multiple meteorological variables such as pressure, temperature, specific humidity, relative humidity, and wind, the ECMWF reanalysis data (ECMWF Reanalysis v5, ERA5) are used as the observations in this section. First, the large-scale circulation background during the occurrence and development of this extreme rainstorm event is analyzed, as shown in Figure 6. During the whole period, the South Asia high (200 hPa) is continuously and stably located over the Tibetan Plateau, and divergent airflow persists over South China. The middle and high latitudes of the middle troposphere (500 hPa) are controlled by the circulation of two troughs and one ridge. The high-pressure ridge is located on the west side of Lake Baikal and moves slowly. The western Pacific subtropical high exhibits an abnormal shape with double ridges, of which the north and south ridge line are, respectively, located at about 5°N and 30°N. Therefore, a belt-shaped high-pressure dam is formed between the Yangtze–Huaihe river basin and the Yellow-Huaihe river basin. The southwest monsoon is strong in the lower troposphere (850 hPa), but it is blocked by the high-pressure dam when advancing northward, causing it to mainly affect areas south of 30°N. The southwest monsoon continuously transports warm and moist airflow to the monsoon depression to strengthen its development. Coupled with the slow-moving large-scale weather systems, the monsoon depression has a lasting impact on Guangdong, providing favorable conditions for the occurrence and development of extreme rainstorms (Cai et al., 2019).
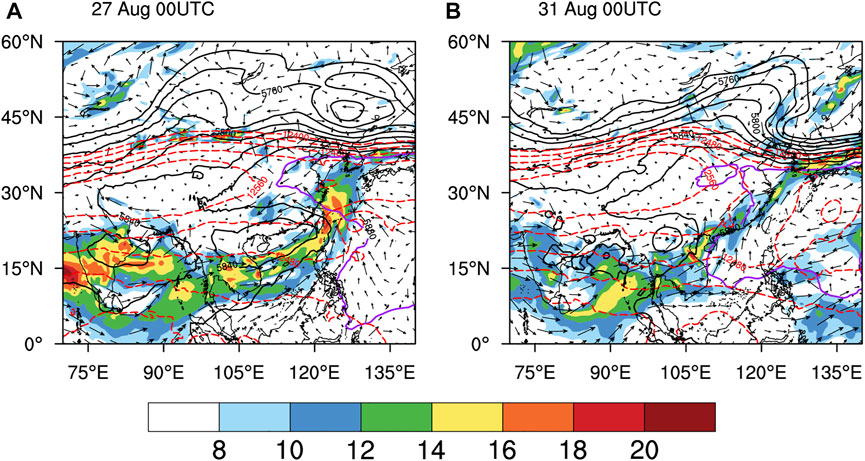
FIGURE 6. 200 hPa geopotential height (red dashed line, unit: gpm), 500 hPa geopotential height (thick black solid line, purple line denotes 5,880 gpm contour, unit: gpm), and 850 hPa wind (vector, unit: m·s−1, wind speed greater than 8 m s−1 is shaded) at (A) 00 UTC on 27 August 2018 and (B) 00 UTC on 31 August 2018.
Combined with the analysis of gridpoint-based (i.e., PCC, MAE, and ETS) and object-based (i.e., MODE) evaluations, the regional model COSMO EPS and the global model ECMWF, respectively, predict well the precipitation above 50 and 25 mm. Therefore, a more in-depth comparative analysis of these two models from the aspects of circulation background and water vapor conditions will be conducted. Figure 7 shows the distributions of wind flow and relative humidity in the lower troposphere (850 hPa). Guangdong Province is mainly under the control of the monsoon depression on 27–28 August. The southwest airflow in the southeast side of the monsoon depression transports water vapor from the South China Sea to Guangdong. The monsoon depression then moves westward, with low-level winds shifting from southwesterly to southerly. The southerly wind over the coastal areas has proven to be an important factor for the continuous extreme rainstorm (Li et al., 2020). The circulation distributions of COSMO EPS and ECMWF are roughly the same as the observations, while the water vapor distributions predicted by COSMO EPS are more similar to the observations.
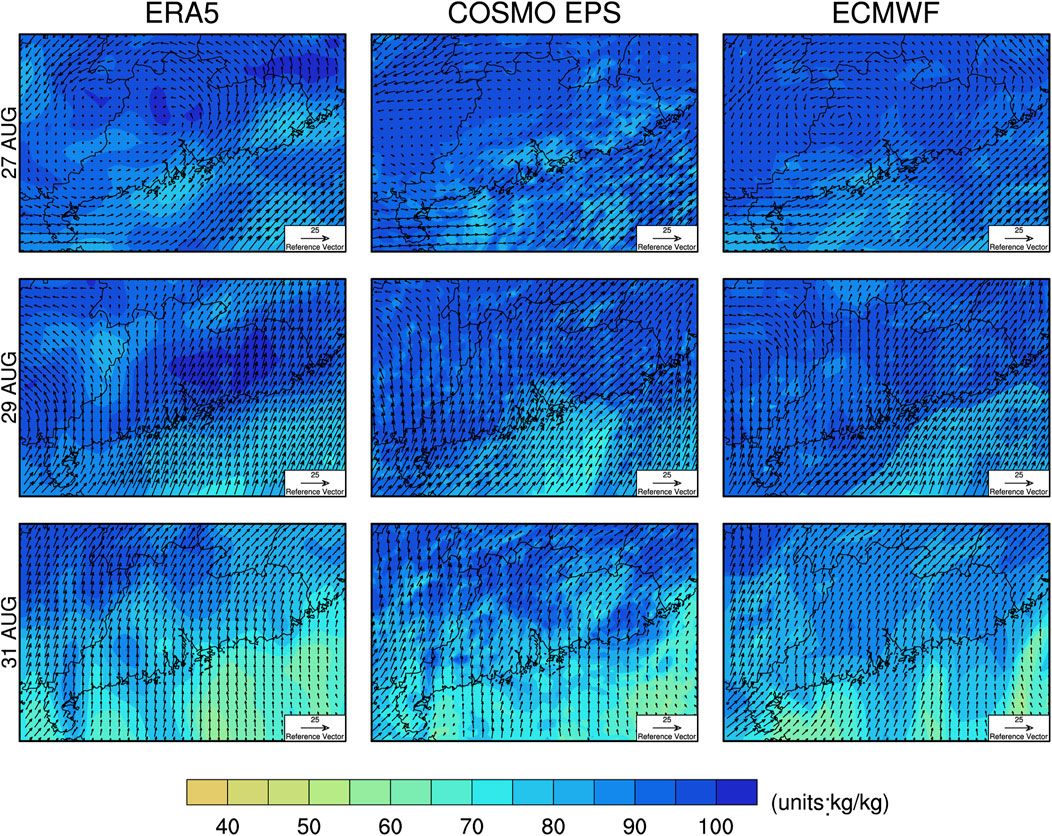
FIGURE 7. 850 hPa wind vector and relative humidity (contour, unit: %) obtained from the observations, ensemble median forecasts of COSMO EPS, and deterministic forecasts of ECMWF at 18 UTC on 27, 29, and 31 August 2018.
The evolution of the low-level jet (LLJ) over time in the northern South China Sea (113°E) is shown in Figure 8. From 00 UTC on 27 August to 18 UTC on 31 August, the LLJ progresses gradually northward and strengthens. The LLJ core front with a wind speed greater than 12 m s−1 on 850 hPa lands on the coastal areas of Guangdong at 00 UTC on 29 August. It is conducive to the convergence of water vapor and dynamic uplift here, and then promotes the occurrence and development of the extreme rainstorm. Subsequently, the LLJ intensifies to above 14 m s−1 and is located over the southern Pearl River Delta, contributing to the heavy precipitation occurring in most of the coastal areas. After 06 UTC on 30 August, the monsoon depression begins to weaken; thus, the LLJ weakens and then the precipitation in the coastal areas gradually disappears. COSMO EPS predicts the evolution and intensity of LLJ more closely to the reality than ECMWF.
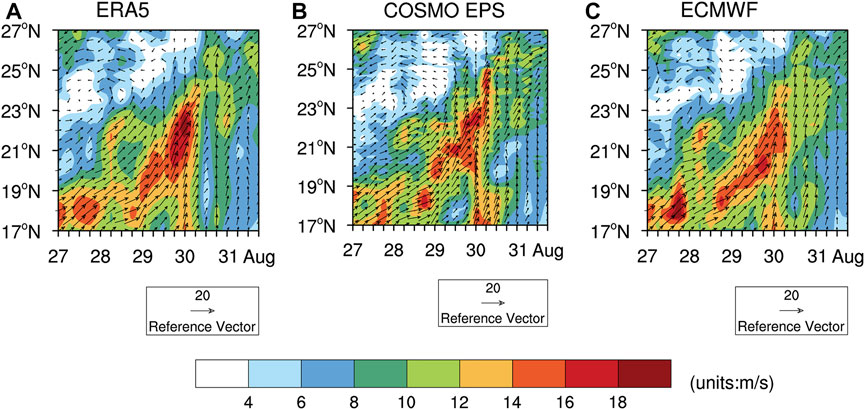
FIGURE 8. Time-latitude cross sections of 850 hPa wind (vector, unit: m·s−1, wind speed greater than 4 m s−1 is shaded) along 113°E from 00 UTC on 27 August to 18 UTC on 31 August 2018 for (A) the observations, (B) the ensemble median forecast of COSMO EPS, and (C) the deterministic forecast of ECMWF.
The transport of water vapor is necessary to maintain continuous precipitation; thus, Figure 9 calculates the integrated atmosphere (1,000–200 hPa) water vapor flux divergence. The observed convergence at 18 UTC on 29 and 30 August are significantly stronger than that at 06 UTC, which is related to the characteristics of monsoon precipitation (Guo et al., 2019). However, both COSMO EPS and ECMWF do not capture this feature. Starting from 06 UTC on 29 August, the observed water vapor flux convergence occurs in the coastal areas of Guangdong Province, and the maximum convergence exceeds 70 × 10−6 g cm−2·s−1. At 18 UTC on 31 August, the water vapor flux convergence significantly weakens, and the maximum center is shifted westward. The area with strong convergence on 29 August predicted by COSMO EPS is located in the coastal area, and then it mainly appears in the eastern and northern parts of Guangdong. ECMWF predicts that there will be strong convergence in eastern Guangdong on 29 August and the convergence intensity will weaken in the following 2 days. The distributions of water vapor flux convergence predicted by both COSMO EPS and ECMWF are quite different from the observations, while the convergence intensity predicted by COSMO EPS is generally stronger than that of ECMWF.
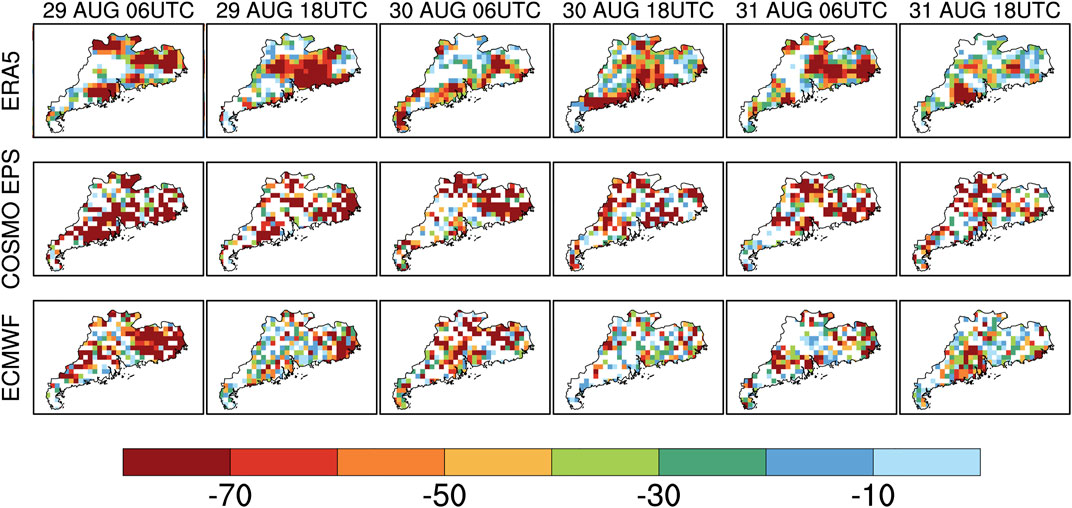
FIGURE 9. Integrated atmosphere (1,000–200 hPa) water vapor flux divergence (unit: 10−6 g cm−2·s−1) from the observations, ensemble median forecasts of COSMO EPS, and deterministic forecasts of ECMWF at 06 UTC and 18 UTC on 29–31 August 2018.
3.3 COSMO LHN experiments
The regional model forecasts by COSMO EPS and GRAPES MEPS compared so far are initialized and driven at the boundaries by the predictions of their global models. Thus, there are no mesoscale data assimilation involved. However, several COSMO experiments with different initial conditions show that the forecasts of this extreme rainstorm event in Guangdong Province are very sensitive to the initial conditions (not shown). Therefore, in this section, we feed the in-built LHN scheme of COSMO with the precipitation rate retrieved by radar in order to explore its impact on the forecast quality of COSMO EPS. The LHN scheme is developed for a 2.8-km resolution and introduces increments in temperature and moisture to the thermodynamic equation, which is expected to enable the model dynamic to react in generating similar precipitation patterns as observed (Stephan et al., 2008). It assumes that the latent heat release is proportional to the model surface rain rate (Jones and Macpherson, 1997). Accordingly, the LHN scheme adds positive temperature increments to increase model precipitation and negative increments to decrease it. We run COSMO LHN experiments with two setups. The results of the EPS without LHN (COSMO-noLHN EPS, first setup) have been already discussed in Section 3.1. For the second setup, we stop LHN each day after an analysis window of 3 h (COSMO-3hrLHN EPS). Thus, we have each day a 21-h free (not nudged) forecast.
The results of two setups for the 21 h of the free forecast from the LHN runs are summarized in Figure 10. Without LHN (Figure 10C), the results are similar to the ones discussed already in the previous subsection. Note that differences between Figure 2B and Figure 10C relate to the shorter periods—21 instead of 24 h/day—for the latter. COSMO-3hrLHN EPS reproduces the overall observed precipitation pattern for amounts above 50 mm, which significantly improves the gridpoint-based scores compared to the COSMO-noLHN experiment (not shown). Although the precipitation intensity in eastern Guangdong predicted by COSMO-3hrLHN EPS is still too weak, its location has moved westward compared with COSMO-noLHN EPS, which is closer to the observations. The daily precipitation (21 h/day) is spatially evaluated by the MODE with thresholds of 25 and 50 mm, and the OTS values are listed in Table 5. For the threshold of 25 mm, the OTS values of COSMO-3hrLHN EPS are generally higher than those of COSMO-noLHN EPS, indicating the forecast skill improvements by LHN. However, there are no obvious differences between the COSMO-3hrLHN EPS and COSMO-noLHN EPS predictions for the threshold of 50 mm.
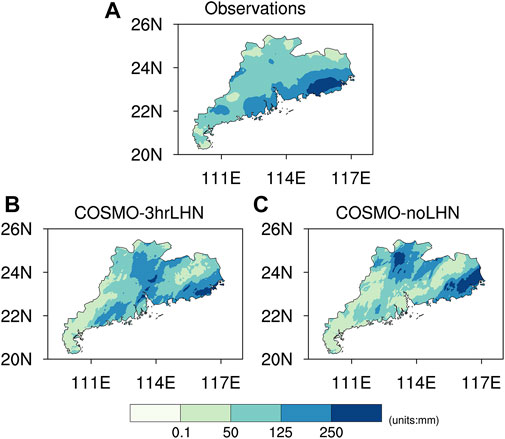
FIGURE 10. Spatial distributions of cumulative precipitation in Guangdong Province during the period of 27–31 August 2018 (precipitation of the first 3 h are removed of each day) for (A) the observations, (B) the ensemble median forecast of COSMO-3hrLHN EPS, and (C) the ensemble median forecast of COSMO-noLHN EPS.
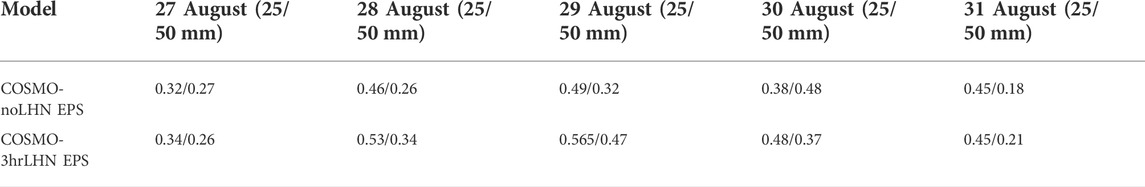
TABLE 5. OTS values of COSMO-noLHN EPS and COSMO-3hrLHN EPS at a precipitation threshold of 25 and 50 mm, respectively.
4 Conclusion and discussions
In this study, an ensemble system of the high-resolution regional model COSMO, obtained by variations of parameters in its physics package, is used to predict an extreme rainstorm event, which occurred over the Guangdong Province during 27–31 August 2018. Predictions are performed first without and then with the in-built latent heat nudging scheme driven by the observed precipitation. The COSMO predictions are compared against observations and also with the forecasts of several regional and global models/EPSs.
In this extreme rainstorm event, the precipitation was mainly concentrated in the coastal areas of Guangdong Province, and precipitation intensity decreased from south to north. According to the gridpoint-based and object-based evaluations, COSMO EPS has the best forecast for the heavy precipitation that occurred in eastern Guangdong among all numerical models. However, its forecast location is easterly and the coverage area is smaller when than the observations. The deterministic forecasts of the global models (i.e., ECMWF and ICON) perform well for daily precipitation above 25 mm, but have limited ability to predict heavy precipitation exceeding 50 mm. GRAPES MEPS underestimates the precipitation amount during the whole period. The forecast skill of GRAPES GEPS for this extreme rainstorm event is generally higher than that of GRAPES MEPS, and it has certain forecast ability for heavy precipitation above 50 mm. Global models such as ECMWF generally perform better than regional models (i.e., COSMO EPS and GRAPES MEPS) for daily precipitation below 50 mm. Since the regional versions are simply downscaled versions of global predictions, this result may be a consequence of independent weather development in the regional model because predictions are not constrained by data assimilation in the inner model regions. The predicted intensity distributions by all models are significantly different from the observed ones, but the statistics of the two-sample Kolmogorov–Smirnov test suggest that the COSMO EPS CDF is clearly closest to the observations.
The cause analysis shows that Guangdong Province is under the control of the monsoon depression southwesterly airflow in the early stage. The southwesterly monsoon low-level jet lands on the coastal regions on 29 August, and then strengthens, promoting the occurrence and development of continuous heavy precipitation there. As the monsoon depression slowly moves westward, the strong southerly wind dominates in the Guangdong Province. Strong water vapor flux persists in the South China Sea, and southwesterly and southerly winds transport a large amount of water vapor to Guangdong. The predictions of COSMO are much closer to the observations than those of ECMWF.
An additional experiment with the in-built latent heat nudging scheme switched on for the first 3 h of the forecast shows that these predictions indeed lead to significant improvements, especially in terms of the spatial distribution, but the heavy precipitation intensity still remains too weak compared to the observations.
Since the forecast capabilities of various models are different, if the forecast information of multiple models is integrated, the advantages of each model may be fully utilized to reduce forecast deviation and then improve forecasting skills. Therefore, the multimodel ensemble forecast will be compared with the dynamic downscaling forecasts in the next work. We also observed that the spread of the COSMO EPS is rather small compared to the spread of other EPSs (not shown). This is because only one lateral boundary condition is available from the ICON global model. In the future, we will use the ICON EPS as the driving ensemble for COSMO EPS, which will, however, need an intermediate downscaling step because the global ICON EPS has a resolution of only 40 km.
The COSMO EPS in our experiment is constructed based on varying physics packages. The multi-physical process parameterization method was first proposed by Houtekamer et al. (1996) by combining different physical parameters to reflect the model uncertainty in ensemble forecasts. The multi-physics EPS favors providing a larger ensemble spread and improving probabilistic forecast skills, and it has been widely used in regional EPSs (Stensrud et al., 2000; Berner et al., 2011; Gebhardt et al., 2011; Zhang et al., 2017). However, multi-physics ensembles usually result in an inconsistent distribution and thus are contrary to the assumptions of statistical post-processing. Each ensemble member has different climate characteristics and forecast bias by using multi-physics, which is one reason why the multi-physics parameterization scheme can improve the ensemble spread (Eckel and Mass, 2005). But this result contradicts the fundamentals of forecast errors, where forecast uncertainty is a stochastic rather than a systematic component. Preliminary research shows that the combination of multi-physical process parameterizations with initial condition perturbations can further improve the ensemble spread and significantly improve the forecast accuracy of precipitation (Huang et al., 2016), which is worthy of further investigation.
Data availability statement
The original contributions presented in the study are included in the article/Supplementary Material; further inquiries can be directed to the corresponding author.
Author contributions
LJ, XZ, CS, and SZ conceived the study; BS provided help for the numerical experiments; KS analyzed the radar data and provided the guidance for latent heat nudging experiments; ZW and CW provided the radar data.
Funding
This study was supported by the National Key Research and Development Project of China (Grant 2017YFC1502000 and 2018YFC1507200), the Basic Research Fund of CAMS (Grant 2022Y017), and the Deutsche Forschungsgemeinschaft (DFG) via FOR2131: “Data Assimilation for Improved Characterization of Fluxes across Compartmental Interfaces,” subproject P2.
Acknowledgments
The computing time for this study has been provided by the Gauss Centre for Supercomputing (http://www.gauss-centre.eu/gauss-centre/EN/Home/home_node.html) operated by the Juelich Supercomputing Centre (http://www.fz-juelich.de/ias/jsc/EN/Home/home_node.html).
Conflict of interest
The authors declare that the research was conducted in the absence of any commercial or financial relationships that could be construed as a potential conflict of interest.
Publisher’s note
All claims expressed in this article are solely those of the authors and do not necessarily represent those of their affiliated organizations, or those of the publisher, the editors, and the reviewers. Any product that may be evaluated in this article, or claim that may be made by its manufacturer, is not guaranteed or endorsed by the publisher.
References
Baldauf, M., Seifert, A., Förstner, J., Majewski, D., Raschendorfer, M., and Reinhardt, T. (2011). Operational convective-scale numerical weather prediction with the COSMO model: Description and sensitivities. Mon. Wea. Rev. 139, 3887–3905. doi:10.1175/mwr-d-10-05013.1
Beck, J., Bouttier, F., Wiegand, L., Gebhardt, C., Eagle, C., and Roberts, N. (2016). Development and verification of two convection-allowing multi-model ensembles over Western Europe. Q.J.R. Meteorol. Soc. 142, 2808–2826. doi:10.1002/qj.2870
Ben Bouallègue, Z., and Theis, S. E. (2014). Spatial techniques applied to precipitation ensemble forecasts: From verification results to probabilistic products. Meteorol. Appl. 21, 922–929.
Bentzien, S., and Friederichs, P. (2012). Generating and calibrating probabilistic quantitative precipitation forecasts from the high-resolution NWP model COSMO-DE. Wea Forecast. 27, 988–1002. doi:10.1175/waf-d-11-00101.1
Berner, J., Ha, S. Y., Hacker, J. P., Fournier, A., and Snyder, C. (2011). Model uncertainty in a mesoscale ensemble prediction system: Stochastic versus multiphysics representations. Mon. Wea. Rev. 139, 1972–1995. doi:10.1175/2010mwr3595.1
Bouttier, F. (2009). AROME system documentation. CNRM/GAME, Météo-France. Available at: http://www.cnrm.meteo.fr/gmap.
Bouttier, F., Vié, B., Nuissier, O., and Raynaud, L. (2012). Impact of stochastic physics in a convection-permitting ensemble. Mon. Wea. Rev. 140, 3706–3721. doi:10.1175/mwr-d-12-00031.1
Bowler, N. E., Arribas, A., Mylne, K. R., Robertson, K. B., and Beare, S. E. (2008). The MOGREPS short-range ensemble prediction system. Q.J.R. Meteorol. Soc. 134, 703–722. doi:10.1002/qj.234
Buizza, R., Houtekamer, P. L., Pellerin, Z., Toth, Z., Zhu, Y., and Wei, M. (2005). A comparison of the ECMWF, MSC, and NCEP global ensemble prediction systems. Mon. Weather Rev. 133, 1076–1097. doi:10.1175/mwr2905.1
Cai, J. J., Wu, Z. F., Chen, X. Q., et al. (2019). Cause analysis of persistent torrential rain associated with monsoon depression occurring in Guangdong on August 2018. Torrential Rain Disaster 38, 576–586. (in Chinese).
Casati, B., Ross, G., and Stephenson, D. B. (2004). A new intensity-scale approach for the verification of spatial precipitation forecasts. Meteorol. Appl. 11, 141–154. doi:10.1017/s1350482704001239
Casati, B. (2009). New developments of the intensity-scale technique within the spatial verification methods inter-comparison Project. Wea. Forecast. 25, 113–143.
Chen, J., Wang, J. Z., Du, J., et al. (2019). Forecast bias correction through model integration: A dynamical wholesale approach. Quart. J. Roy. Meteor. Soc. 146, 1149–1168.
Davis, C. A., Brown, B. G., Bullock, R. G., and Halley-Gotway, J. (2009). The method for object-based diagnostic evaluation (MODE) applied to numerical forecasts from the 2005 NSSL/SPC spring program. Wea. Forecast. 24, 1252–1267. doi:10.1175/2009waf2222241.1
Davis, C. A., Brown, B. G., and Bullock, R. G. (2006). Object-based verification of precipitation forecasts. Part I: Methodology and application to mesoscale rain areas. Mon. Wea. Rev. 134, 1772–1784. doi:10.1175/mwr3145.1
Doms, G., and Schättler, U. (1999). The nonhydrostatic limited-area model LM (Lokal Modell) of DWD. Part I: Scientific documentation. Dtsch. Wetterd. Tech. Rep. LM F90 135, 172. Available at: http://www.cosmo-model.org/content/model/documentation/core/default.htm.
Eckel, F. A., and Mass, C. F. (2005). Aspects of effective mesoscale, short-range ensemble forecasting. Wea. Forecast. 20, 328–350. doi:10.1175/waf843.1
Gebhardt, C., Theis, S. E., Paulat, M., and Ben Bouallègue, Z. (2011). Uncertainties in COSMO-DE precipitation forecasts introduced by model perturbations and variation of lateral boundaries. Atmos. Res. 100, 168–177. doi:10.1016/j.atmosres.2010.12.008
Gilleland, E., Lindström, J., and Lindgren, F. (2010). Analyzing the image warp forecast verification method on precipitation fields from the ICP. Wea. Forecast. 25, 1249–1262. doi:10.1175/2010waf2222365.1
Guo, Z. Y., Wu, Z. F., and Cai, J. J. (2019). Analysis of water vapor transport characteristics of a monsoon low-pressure continuous heavy rain event at the end of August 2018 in Guangdong area. Torrential Rain Disaster 38, 587–596. (in Chinese).
Hess, R. (2020). Statistical postprocessing of ensemble forecasts for severe weather at Deutscher Wetterdienst. Nonlin. Process. Geophys. Discuss. 1–20. doi:10.5194/npg-27-473-2020
Hohenegger, C., Walser, A., Langhans, W., and Schär, C. (2008). Cloud‐resolving ensemble simulations of the August 2005 Alpine flood. Q.J.R. Meteorol. Soc. 134, 889–904. doi:10.1002/qj.252
Hoogewind, K. A., Baldwin, M. E., and Trapp, R. J. (2016). The impact of climate change on hazardous convective weather in the United States: Insight from high-resolution dynamical downscaling. J. Clim. 30, 10081–10100.
Houtekamer, P. L., Lefaivre, L., Derome, J., Ritchie, H., and Mitchell, H. L. (1996). A system simulation approach to ensemble prediction. Mon. Wea. Rev. 124, 1225–1242. doi:10.1175/1520-0493(1996)124<1225:assate>2.0.co;2
Huang, H. Y., Qi, L. L., and Liu, J. W. (2016). Preliminary application of a multi-physical ensemble transform Kalman filter in precipitation ensemble prediction. Chin. J. Atmos. Sci. 40, 657–668. (in Chinese).
Huffman, G. J., Stocker, E. F., Bolvin, D. T., et al. (2019). “GPM IMERG final precipitation L3 1 day 0.1 degree x 0.1 degree V06,” in Goddard Earth sciences data and information services center (GES DISC). Editors Andrey Savtchenko, and M. D. Greenbelt. doi:10.5067/GPM/IMERGDF/DAY/06
Ji, L. Y., Zhi, X. F., Simmer, C., Zhu, S., and Ji, Y. (2020). Multimodel ensemble forecasts of precipitation based on an object-based diagnostic evaluation. Mon. Wea. Rev. 148, 2591–2606. doi:10.1175/mwr-d-19-0266.1
Johnson, A., Wang, X., Kong, F., and Xue, M. (2013). Object-based evaluation of the impact of horizontal grid spacing on convection-allowing forecasts. Mon. Wea. Rev. 141, 3413–3425. doi:10.1175/mwr-d-13-00027.1
Jones, C. D., and Macpherson, B. (1997). A latent heat nudging scheme for the assimilation of precipitation data into an operational mesoscale model. Meteorol. App. 4 (3), 269–277. doi:10.1017/s1350482797000522
Kain, J. S., Weiss, S. J., Bright, D. R., Baldwin, M. E., Levit, J. J., Carbin, G. W., et al. (2008). Some practical considerations regarding horizontal resolution in the first generation of operational convection-allowing NWP. Wea. Forecast. 23, 931–952. doi:10.1175/waf2007106.1
Knist, S., Goergen, K., and Simmer, C. (2020). Evaluation and projected changes of precipitation statistics in convection-permitting WRF climate simulations over Central Europe. Clim. Dyn. 55, 325–341. doi:10.1007/s00382-018-4147-x
Kober, K., Craig, G. C., Keil, C., and Dörnbrack, A. (2012). Blending a probabilistic nowcasting method with a high-resolution numerical weather prediction ensemble for convective precipitation forecasts. Q.J.R. Meteorol. Soc. 138, 755–768. doi:10.1002/qj.939
Kopparla, P., Fischer, E. M., Hannay, C., and Knutti, R. (2013). Improved simulation of extreme precipitation in a high-resolution atmosphere model. Geophys. Res. Lett. 40, 5803–5808. doi:10.1002/2013gl057866
Kühnlein, C., Keil, C., and Craig, G. C. (2014). The impact of downscaled initial condition perturbations on convective-scale ensemble forecasts of precipitation. Q. J. R. Meteorol. Soc. 140, 1552–1562.
Leith, C. E. (1974). Theoretical skill of Monte Carlo forecasts. Mon. Wea. Rev. 102, 409–418. doi:10.1175/1520-0493(1974)102<0409:tsomcf>2.0.co;2
Li, H. Q., Wan, Q., Peng, D. D., Liu, X., and Xiao, H. (2020). Multiscale analysis of a record-breaking heavy rainfall event in Guangdong, China. Atmos. Res. 232, 104703. doi:10.1016/j.atmosres.2019.104703
Liu, Z., Ostrenga, D., Vollmer, B., Deshong, B., Macritchie, K., Greene, M., et al. (2017). Global precipitation measurement mission products and services at the NASA GES DISC. Bull. Amer. Meteor. Soc. 98, 437–444. doi:10.1175/bams-d-16-0023.1
Lorenz, E. N. (1969). Atmospheric predictability as revealed by naturally occurring analogues. J. Atmos. Sci. 26, 636–646. doi:10.1175/1520-0469(1969)26<636:aparbn>2.0.co;2
Lorenz, E. N. (1963). Deterministic nonperiodic flow. J. Atmos. Sci. 20, 130–141. doi:10.1175/1520-0469(1963)020<0130:dnf>2.0.co;2
Mahoney, K., Alexander, M. A., Thompson, G., Barsugli, J. J., and Scott, J. D. (2012). Changes in hail and flood risk in high-resolution simulations over Colorado's mountains. Nat. Clim. Change 2, 125–131. doi:10.1038/nclimate1344
Mass, C. F., Ovens, D., Westrick, K., and Colle, B. A. (2002). Does increasing horizontal resolution produce more skillful forecasts? Bull. Amer. Meteor. Soc. 83, 407–430. doi:10.1175/1520-0477(2002)083<0407:dihrpm>2.3.co;2
Mittermaier, M. P., and Bullock, R. (2013). Using MODE to explore the spatial and temporal characteristics of cloud cover forecasts from high-resolution NWP models. Mater. Apps 20, 187–196. doi:10.1002/met.1393
Mittermaier, M., and Roberts, N. (2009). Intercomparison of spatial forecast verification methods: Identifying skillful spatial scales using the fractions skill score. Wea. Forecast. 25, 343–354.
Orskaug, E., Scheel, I., Frigessi, A., Guttorp, P., Haugen, J. E., Tveito, O. E., et al. (2011). Evaluation of a dynamic downscaling of precipitation over the Norwegian mainland. Tellus A Dyn. Meteorology Oceanogr. 63, 746–756. doi:10.1111/j.1600-0870.2011.00525.x
Peralta, C., Ben Bouallègue, Z., and Theis, S. E. (2012). Accounting for initial condition uncertainties in COSMO-DE-EPS. J. Geophys. Res. Atmos. 117, D07108. doi:10.1029/2011jd016581
Roberts, N. (2008). Assessing the spatial and temporal variation in the skill of precipitation forecasts from an NWP model. Mater. Apps 15, 163–169. doi:10.1002/met.57
Roberts, N. M., Cole, S. J., Forbes, R. M., Moore, R. J., and Boswell, D. (2009). Use of high-resolution NWP rainfall and river flow forecasts for advance warning of the Carlisle flood, north-west England. Mater. Apps 16, 23–34. doi:10.1002/met.94
Rockel, B., Will, A., and Hense, A. (2008). The regional climate model COSMO-CLM (CCLM). metz 17, 347–348. doi:10.1127/0941-2948/2008/0309
Röpnack, A., Hense, A., and Gebhardt, C. (2013). Bayesian model verification of NWP ensemble forecasts. Mon. Wea. Rev. 141, 375–387.
Saito, K., Fujita, T., Yamada, Y., Ishida, J.-i., Kumagai, Y., Aranami, K., et al. (2006). The operational JMA nonhydrostatic mesoscale model. Mon. Wea. Rev. 134, 1266–1298. doi:10.1175/mwr3120.1
Schlüter, I., and Schädler, G. (2010). Sensitivity of heavy precipitation forecasts to small modifications of large-scale weather patterns for the Elbe River. J. Hydrometeor. 11, 770–780.
Seifert, A., Baldauf, M., and Stephan, K. (2008). “The challenge of convective-scale quantitative precipitation forecasting,” in 15th int. Conf. On clouds and precipitation, Cancun, Mexico, centro de Ciencias de la Atmósfera (Cancun: Universidad Nacional Autónoma de México CCA-UNAM).
Seity, Y., Brousseau, P., Malardel, S., Hello, G., Bénard, P., Bouttier, F., et al. (2011). The AROME-France convective-scale operational model. Mon. Wea. Rev. 139, 976–991. doi:10.1175/2010mwr3425.1
Shrestha, P., Sulis, M., Masbou, M., Kollet, S., and Simmer, C. (2014). A scale-consistent terrestrial systems modeling Platform based on COSMO, CLM, and ParFlow. Mon. Wea. Rev. 142, 3466–3483. doi:10.1175/mwr-d-14-00029.1
Simmer, C., Thiele-Eich, I., and Masbou, M. (2014). Monitoring and modeling the terrestrial system from pores to catchments–the transregional collaborative research center on patterns in the soil-vegetation-atmosphere system. Bull. Amer. Meteor. Soc. 96, 1765–1787.
Skamarock, W. C. (2004). Evaluating mesoscale NWP models using kinetic energy spectra. Mon. Wea. Rev. 132, 3019–3032. doi:10.1175/mwr2830.1
Skamarock, W. C., and Klemp, J. B. (2008). A time-split nonhydrostatic atmospheric model for weather research and forecasting applications. J. Comput. Phys. 227, 3465–3485. doi:10.1016/j.jcp.2007.01.037
Soares, P. M. M., Cardoso, R. M., Lima, D. C. A., and Miranda, P. M. A. (2017). Future precipitation in Portugal: High-resolution projections using WRF model and EURO-CORDEX multi-model ensembles. Clim. Dyn. 49, 2503–2530. doi:10.1007/s00382-016-3455-2
Sokol, Z., Zacharov, P., and Skripniková, K. (2014). Simulation of the storm on 15 August, 2010, using a high resolution COSMO NWP model. Atmos. Res. 137, 100–111. doi:10.1016/j.atmosres.2013.09.015
Staniforth, A., and Wood, N. (2008). Aspects of the dynamical core of a nonhydrostatic, deep-atmosphere, unified weather and climate-prediction model. J. Comput. Phys. 227, 3445–3464. doi:10.1016/j.jcp.2006.11.009
Stensrud, D. J., Bao, J. W., and Warner, T. T. (2000). Using initial condition and model physics perturbations in short-range ensemble simulations of mesoscale convective systems. Mon. Wea. Rev. 128, 2077–2107. doi:10.1175/1520-0493(2000)128<2077:uicamp>2.0.co;2
Stephan., K., Klink., S., and Schraff, C. (2008). Assimilation of radar-derived rain rates into the convective-scale model COSMO-DE at DWD. Q.J.R. Meteorol. Soc. 134, 1315–1326. doi:10.1002/qj.269
Steppeler, J., Doms, G., Schuttler, U., Bitzer, H. W., Gassmann, A., Damrath, U., et al. (2003). Meso-gamma scale forecasts using the nonhydrostatic model LM. Meteorology Atmos. Phys. 82, 75–96. doi:10.1007/s00703-001-0592-9
Sun, J. Z., Xue, M., Wilson, J. W., Zawadzki, I., Ballard, S. P., Onvlee-Hooimeyer, J., et al. (2014). Use of NWP for nowcasting convective precipitation: Recent progress and challenges. Bull. Amer. Meteor. Soc. 95, 409–426. doi:10.1175/bams-d-11-00263.1
Tang, Y. M., Lean, H. W., and Bornemann, J. (2013). The benefits of the Met Office variable resolution NWP model for forecasting convection. Mater. Apps 20, 417–426. doi:10.1002/met.1300
Theis, S., Gebhardt, C., and Ben Bouallègue, Z. (2017). Beschreibung des COSMO-DE-EPS und seiner Ausgabe in die Datenbanken des DWD. Available at: https://www.dwd.de/SharedDocs/downloads/DE/modelldokumentationen/nwv/cosmo_de_eps/cosmo_de_eps_dbbeschr_20170321.pdf?__blob=publicationFile&v=3.
Wang, D., Menz, C., Simon, T., Simmer, C., and Ohlwein, C. (2013). Regional dynamical downscaling with CCLM over east Asia. Meteorol. Atmos. Phys. 121, 39–53. doi:10.1007/s00703-013-0250-z
Weisman, M. L., Davis, C., Wang, W., Manning, K. W., and Klemp, J. B. (2008). Experiences with 0-36-h explicit convective forecasts with the WRF-ARW model. Wea. Forecast. 23, 407–437. doi:10.1175/2007waf2007005.1
Wu, Z. F., Cai, J. J., and Lin, L. X., (2018). Analysis of mesoscale systems and predictability of the torrential rain process in Guangzhou on 7 May 2017. Meteorol. Mon. 44, 485–499. (in Chinese).
Xia, Y., Chen, J., Du, J., Zhi, X., Wang, J., and Li, X. (2019). A unified scheme of stochastic physics and bias correction in an ensemble model to reduce both random and systematic errors. Wea. Forecast. 34, 1675–1691. doi:10.1175/waf-d-19-0032.1
Zängl, G., Reinert, D., and Rípodas, P. (2015). The ICON (ICOsahedral Non-hydrostatic) modelling framework of DWD and MPI-M: Description of the non-hydrostatic dynamical core. Quart. J. Roy. Meteor. Soc. 141, 563–579.
Zhang, H. B., Chen, J., and Zhi, X. F. (2014). Study on the application of GRAPES regional ensemble prediction system. Meteor. Mon. 40, 1076–1087.
Keywords: extreme weather events, regional high-resolution model, ensemble prediction system, latent heat nudging, dynamic downscaling
Citation: Ji L, Zhi X, Schalge B, Stephan K, Wu Z, Wu C, Simmer C and Zhu S (2022) Dynamic downscaling ensemble forecast of an extreme rainstorm event in South China by COSMO EPS. Front. Earth Sci. 10:969742. doi: 10.3389/feart.2022.969742
Received: 15 June 2022; Accepted: 09 August 2022;
Published: 01 September 2022.
Edited by:
Jingyu Wang, Nanyang Technological University, SingaporeReviewed by:
Xiaoming Shi, Hong Kong University of Science and Technology, Hong Kong SAR, ChinaJosé Pedro Matos, Universidade de Lisboa, Portugal
Copyright © 2022 Ji, Zhi, Schalge, Stephan, Wu, Wu, Simmer and Zhu. This is an open-access article distributed under the terms of the Creative Commons Attribution License (CC BY). The use, distribution or reproduction in other forums is permitted, provided the original author(s) and the copyright owner(s) are credited and that the original publication in this journal is cited, in accordance with accepted academic practice. No use, distribution or reproduction is permitted which does not comply with these terms.
*Correspondence: Xiefei Zhi, emhpQG51aXN0LmVkdS5jbg==