
95% of researchers rate our articles as excellent or good
Learn more about the work of our research integrity team to safeguard the quality of each article we publish.
Find out more
REVIEW article
Front. Earth Sci. , 01 September 2022
Sec. Structural Geology and Tectonics
Volume 10 - 2022 | https://doi.org/10.3389/feart.2022.967529
This article is part of the Research Topic Active Faults and Earthquake due to Continental Deformation View all 25 articles
 Jin Ge1,2
 Xuhua Shi1,2,3*
 Hanlin Chen1,2*
 Xiubin Lin1,2Weipeng Ge4Xiaochun Wei1,2
 Feng Li1,2
 Jie Chen3,5
 Haibing Li6Xiaogan Cheng1,2
 Fengqi Zhang1,2
The Pamir salient is a key part of the Himalayan–Tibetan Plateau orogenic system and has undergone intense tectonic deformation during the India–Asian collision. Delineating the Cenozoic kinematics and geodynamics of the Pamir salient requires a comprehensive understanding of the active arcuate structures along its frontal margin, from the perspective of the multi-spatiotemporal evolution of deformation patterns. Here, we reviewed the deformation rates of the major structures at different timescales, reanalyzed the published Global Positioning System velocities, and examined the present-day seismicity to constrain the kinematics of the Pamir salient since the Late Cenozoic. Integrated with the crustal evolution history during the Middle–Late Cenozoic and the deep structure, we proposed a new model to explain the multi-stage kinematics and associated geodynamics of the Pamir salient. During ∼37–24 Ma, the initial Pamir salient moved northward via radial thrusting that rotated the basins on both sides, which was driven by the continuous compression of the Indian slab after the breakoff of its oceanic part. During ∼23–12 Ma, the gravitational collapse of the Central and South Pamir crusts, which was induced by the breakoff of the continental part of the Indian slab, triggered the extension within the Pamir and foreland-ward movement of the upper crust. The upper crustal materials moved in varying directions due to the differential strength of the foreland areas, transforming the crustal kinematics from radial thrusting into a combination of radial thrusting and transfer faulting. Since the coupling of the Indian and Pamir slabs at ∼12–11 Ma, the deformation propagation towards the forelands accelerated, after which the kinematics of the Pamir salient exhibited asymmetric radial thrusting that has been sustained until the present. The asymmetric radial thrusting was likely driven by the compressive stress effect of the lithospheric basal shear generated by the underthrusting of the cratonic Indian lithosphere, which further led to the rollback of the Pamir slab and the consequent migratory extension in the South Pamir.
The Cenozoic India–Asia collision has driven the growth of the Pamir Plateau, at the western tip of the Himalayan–Tibetan orogen (Burtman and Molnar, 1993; Yin and Harrison, 2000). The Pamir Plateau, convexing northward and known as the Pamir salient, consists of a series of arcuate structures that extend for hundreds of kilometers and straddles neighboring China, Kyrgyzstan, Pakistan, and Tajikistan (Figure 1). These active structures, including thrust, normal, and strike-slip faults, have played a significant role in the regional geodynamic evolution and pose major seismic and related hazards within and around the Pamir salient (Figure 1B).
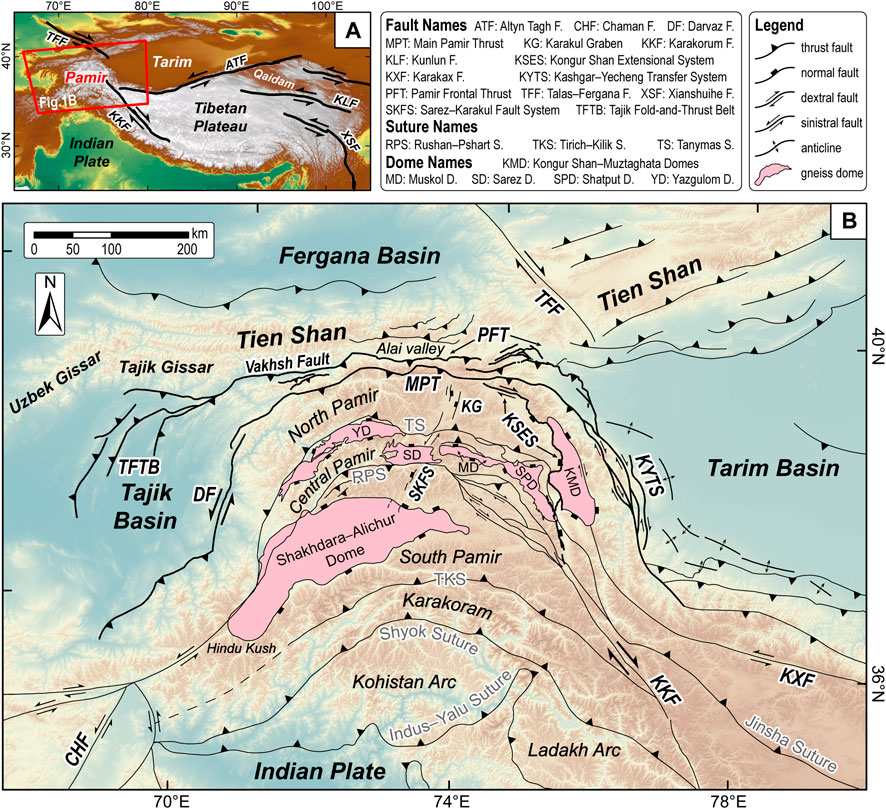
FIGURE 1. Tectonic setting of the study area and its surrounding regions. (A) The location of the Pamir salient within the tectonic context of the Himalayan–Tibetan orogen. (B) Tectonic map of the Pamir salient and its adjacent areas (modified from Wei et al. (2018) after Robinson et al. (2004), Robinson et al. (2007), Cowgill (2010), and Stübner et al. (2013a)). The bold black lines denote the arc-like active structures along the frontal Pamir salient. The pink-filled polygons define the Cenozoic gneiss domes.
Numerous studies have been conducted on these structures to explore how the Pamir salient evolved during the Cenozoic. Currently, two main end-member models exist to explain its formation. One argues that the arcuate shape developed as a result of the large-scale (∼300 km) northward overthrusting of the Pamir upon the foreland areas (e.g., Burtman and Molnar, 1993; Cowgill, 2010; Sobel et al., 2013); and the other proposes that the arcuate shape was mostly inherited from pre-Cenozoic tectonics with <110 km northward movement during the Cenozoic (e.g., Chen et al., 2018; Li et al., 2020a).
Based on these two end-member models, several kinematic models have been proposed to describe the dynamic evolution of the Pamir salient (Figure 2). In early research, some of these models were established to explain the origin of E–W extension within the Pamir, with different predictions on the distribution and timing of extension. Brunel et al. (1994) proposed the synorogenic extension model, suggesting that the extension in the NE Pamir developed coevally with frontal thrusting to accommodate the topographic rise in the Kongur Shan–Muztaghata area. The model predicts the extension to propagate both northwesterly and southeasterly from the center (Figure 2A). Strecker et al. (1995) proposed the “radial thrusting” model, in which the Pamir salient moves northward by radial thrusting. Such a process may generate two southward-propagating extension zones in the plateau interior and drive anticlockwise and clockwise rotations on the west and east sides of the Pamir, respectively (Figure 2B). Yin et al. (2001) proposed that the oroclinal bending of the Pamir synchronously drove the extension within the Pamir and compression in the Nanga Parbat region (Figure 2C). In comparison with the radial thrusting model, this model predicts a similar extension mode, but its extension mechanic is different. A fourth kinematic model proposed that the extension in the NE Pamir was caused by the northward propagation of the dextral-slip Karakoram Fault, hence the northward propagation of the extension (Figure 2D) (e.g., Ratschbacher et al., 1994; Strecker et al., 1995; Murphy et al., 2000). Recent research has proposed two hybrid models to reconcile the diverse kinematics of the Pamir. One is the radial thrusting and dextral transfer faulting model (Figure 2E). This model argues that the combined faulting may explain the tectonic transformation after the Miocene in the eastern flank of the Pamir, where the large-scale dextral slip initiated while the rotation of the Tarim Basin ceased (Cowgill, 2010; Bosboom et al., 2014). The other hybrid model is the northward indentation and westward extrusion model (Figure 2F). It proposes that the eastern Pamir moves northward en bloc, while the western Pamir shows bulk northward movement accompanying gravitational collapse and westward extrusion of Pamir’s western flank. This model has been used to explain observations from the Global Positioning System (GPS) velocity field and modern seismicity (Schurr et al., 2014; Metzger et al., 2020).
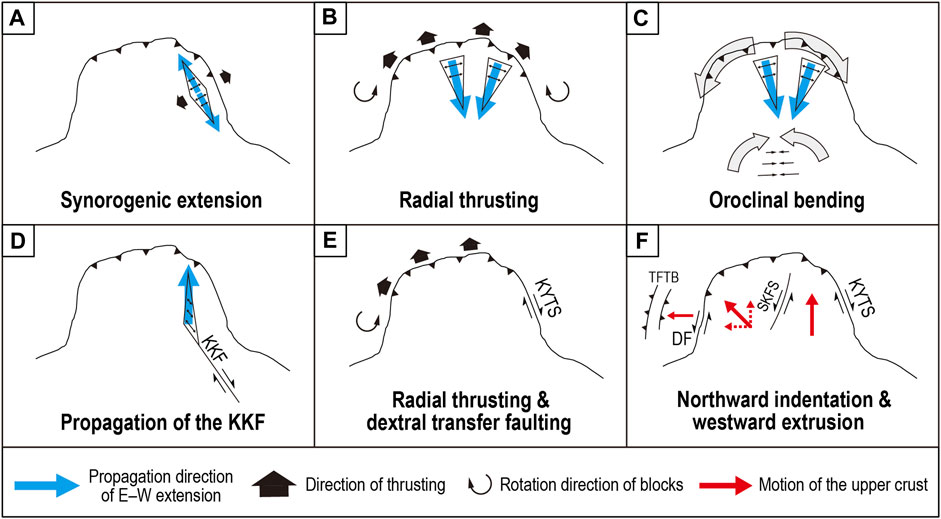
FIGURE 2. Previously proposed kinematic models of the Pamir salient (modified from Robinson et al. (2004), Cowgill (2010), Bosboom et al. (2014); Schurr et al. (2014)). See detailed description of these models in the text. Fault names same as Figure 1.
Despite significant progress, the above models for depicting the kinematic evolution of the Pamir salient are typically used to explain the formation of a certain structure or the kinematics of the Pamir salient during a particular period. Moreover, the relationship between most of these models and underlying geodynamic processes has rarely been discussed. All these hinder our comprehensive understanding of the complex tectonic evolution of the Pamir salient during the Cenozoic, highlighting the need for a multi-timescale, interdisciplinary analysis of the regional tectonics.
Here, we targeted the frontal Pamir, attempting to examine its multi-timescale (million-year, millennial, and decadal) deformation and infer the regional tectonic evolution. First, we reviewed and evaluated the multi-timescale deformation rates of the main structures along the frontal Pamir salient. We then collated and reanalyzed the published GPS data to constrain the crustal kinematics of the Pamir salient and its adjacent regions and present deformation rates across the major structures. We also analyzed the modern shallow seismicity to observe the deformation characteristics. Finally, by integrating the multi-timescale data and the burial and exhumation history of the Cenozoic gneiss domes and the deep structure under the Pamir, we examined the spatiotemporal pattern of fault kinematics and associated geodynamics of the Pamir salient since the Middle Cenozoic.
The Pamir salient consists of three terranes (North, Central, and South Pamir) that evolved along or accreted to the southern margin of Asia during the Late Paleozoic–Mesozoic (Burtman and Molnar, 1993; Schwab et al., 2004; Robinson et al., 2012). During the Cenozoic evolution of the Pamir, significant crustal deformation and complex deep geodynamic processes occurred within the continent, (e.g., Burtman and Molnar, 1993; Chapman et al., 2017). These processes established the present tectonic framework and subcrustal structure of the Pamir salient. In this section, we summarize the main structures, burial and exhumation history of the Cenozoic gneiss domes, and deep structure of the Pamir, which provide a general context for analyzing the crustal kinematics and related geodynamic mechanisms.
The northern front of the Pamir is defined by thrust faulting, namely the south-dipping Pamir Thrust System (PTS), which has absorbed the major N–S shortening across the system (Coutand et al., 2002; Zubovich et al., 2010). The PTS is divided from south to north into the Main Pamir Thrust (MPT) and Pamir Frontal Thrust (PFT). The MPT has been thrusting the North Pamir over the Trans-Alai Range since its initiation at ∼25–20 Ma (Sobel and Dumitru, 1997; Coutand et al., 2002; Bershaw et al., 2012). In places, this fault appears to have been inactive during the Quaternary (Sobel et al., 2013; Thompson et al., 2015), and most deformation across the northern Pamir front is now being accommodated by the PFT, which initiated at ∼6–5 Ma and is the latest deformation front of the northward propagation of the Pamir (Thompson et al., 2015; Chen et al., 2019; Chen et al., 2021). The PFT lies north of the MPT and thrusts the Trans-Alai Range over the Alai Valley and consists of segmented thrust faults and dextral transfer zones (Arrowsmith and Strecker, 1999; Li et al., 2012; Patyniak et al., 2021). The western section of the PFT (hereafter referred to as the western PFT) stretches along the southern margin of the Alai Valley between 72°E and 73.8°E, while the eastern section (hereafter referred to as the eastern PFT) is located in the northeastern corner of the Pamir, with strikes varying from E–W to NW–SE (Figure 1B).
Along both flanks of the Pamir, two large strike-slip fault systems accommodate the northward motion of the Pamir with respect to its adjacent blocks. In the west, the sinistral-slip Darvaz Fault (DF) marks the boundary between the Pamir and Tajik Basin. The DF has displaced the Panj River sinistrally by ∼100 km, where the river cuts across the DF, compared to the reconstruction of the river at ∼10 Ma (Brookfield, 2008). To the west, the Tajik Fold-and-Thrust Belt (TFTB) has absorbed the major shortening in the Tajik Basin, which has been generated by the foreland-ward expansion of the Pamir (e.g., Chapman et al., 2017; Gągała et al., 2020). In the east, the dextral-slip Kashgar–Yecheng Transfer System (KYTS) separates the Tarim Basin from the eastern Pamir. The KYTS comprises four nearly parallel faults: the Kusilaf, Kumtag, Yarkand, and Aertashi Faults (Cowgill, 2010; Sobel et al., 2011). The dextral slip of the KYTS commenced at ∼25–18 Ma, based on sediment provenance, magnetostratigraphic, and thermochronological analyses (Sobel and Dumitru, 1997; Blayney et al., 2016; Blayney et al., 2019).
The interior of the Pamir is characterized by the extension of normal fault systems and domes during the Cenozoic. The normal fault systems dominated by E–W extension are mainly represented by the Karakul Graben (KG) in the north, and the Kongur Shan Extensional System (KSES) in the northeast (Figure 1B).
The NNE–SSW-trending KG is bounded by high-angle (∼60°) normal faults on its western and eastern sides with weak tectonic activity (Strecker et al., 1995). The total extension across the KG may not exceed ∼3 km, and the estimated extension rate is ∼0.5–1 mm/yr, implying that the extension may have started between 9 and 3 Ma (Amidon and Hynek, 2010). The normal faults in the KG, together with sinistral-slip and oblique normal faults in the south, form the Sarez–Karakul Fault System (SKFS, Figure 1B) (Schurr et al., 2014).
The ∼250 km-long KSES consists of, along its strike from NWW to SSE, the Muji dextral-slip fault, the Kongur Shan normal fault, the Taheman normal fault, and the Tashkurgan normal fault (Arnaud et al., 1993; Robinson et al., 2004). Previous thermochronology research on the Kongur Shan and Tashkurgan Faults suggested that the KSES started to develop in the Late Miocene. In the north, the Kongur Shan Fault along the Kongur Shan Dome initiated at ∼7 Ma (Robinson et al., 2010) or ∼6–5.5 Ma (Cao et al., 2013a); in the middle, the fault along the Muztaghata Dome began to be active at ∼6–5 Ma (Robinson et al., 2007; Cao et al., 2013a; Cao et al., 2013b; Thiede et al., 2013); and in the south, the Tashkurgan Fault initiated coevally with the Kongur Shan Fault, whose initiation age is ∼10–5 Ma, most likely ∼6–5 Ma (Chen and Chen, 2020).
The Cenozoic gneiss domes are widely exposed throughout the Pamir, occupying ∼1/3 of its surface area (Figure 1B) (Stübner et al., 2013a). These gneiss domes are bounded by normal-sense shear zones and have been exhumed from depths of 30–40 km (e.g., Robinson et al., 2004; Schmidt et al., 2011), recording the deep crustal processes to be discussed in this paper. Therefore, we briefly summarize the burial and exhumation history of these domes below.
The burial and exhumation processes of the gneiss domes may be related to regional crustal thickening and thinning (e.g., Stearns et al., 2015). The gneiss domes in the Pamir include the 1) Yazgolom, Sarez, and Muskol–Shatput Domes in the Central Pamir, 2) Shakhdara–Alichur Domes in the South Pamir, and 3) Kongur Shan–Muztaghata Domes in the eastern Pamir (Figure 1B). The extension direction of the Central and South Pamir domes is nearly N–S, whereas the exhumation of the Kongur Shan Dome has been accommodated by the E–W extension of the KSES. The Muztaghata Dome, considered the eastern continuation of the Muskol–Shatput doming (Robinson et al., 2007; Cao et al., 2013b; Thiede et al., 2013), records both the earlier N–S extension of the Central Pamir domes and the later E–W extension along the KSES (e.g., Robinson et al., 2007; Cao et al., 2013b).
The Central and South Pamir domes experienced coeval prograde metamorphism in the middle–lower crust during ∼37–18 Ma (e.g., Schmidt et al., 2011; Stearns et al., 2013; Smit et al., 2014; Stearns et al., 2015). The Yazgolom Dome was buried to start prograde metamorphism at ∼35 Ma, reaching the peak metamorphism at ∼22 Ma and lasting until ∼18 Ma (Stearns et al., 2015; Hacker et al., 2017). The other Central Pamir domes began to experience prograde burial from depths of 15–20 km at 35–27 Ma to 25–30 km by 22–19 Ma (Hacker et al., 2017). In the South Pamir, the prograde metamorphism of the Shakhdara Dome started at ∼37 Ma and reached its peak at ∼19 Ma when the maximum burial depth was over 50 km (Smit et al., 2014; Hacker et al., 2017).
The initial exhumation of the Central and South Pamir domes was also almost synchronous, and the synorogenic extension of these domes started at ∼23–20 Ma (Lukens et al., 2012; Stübner et al., 2013b; Stearns et al., 2015; Rutte et al., 2017a; Worthington et al., 2020). However, the duration of exhumation differs between the Central and South Pamir domes: the doming in the South Pamir was longer lasting. The Central Pamir domes experienced rapid extensional exhumation at an average rate of ∼3 mm/yr before 12 Ma, which was followed by a phase of slow cooling (Rutte et al., 2017a). The total amount of ∼N–S extension in the Central Pamir ranges from 17 to 75 km (Rutte et al., 2017b). In detail, the bulk exhumation of the Shakhdara Dome lasted from ∼18 to 15 Ma to ∼2 Ma at rates of 1–3 mm/yr, resulting in ∼90 km of ∼N–S extension (Stübner et al., 2013a; Stübner et al., 2013b). In comparison, the neighboring Alichur Dome lasted until ∼4 Ma at rates of ∼1.1 mm/yr, and the total ∼ N–S extension is much smaller, at 27–41 km (Worthington et al., 2020).
The formation of the Kongur Shan–Muztaghata Domes occurred later than those in the Central and South Pamir. The Muztaghata Dome experienced prograde metamorphism during ∼30–12 Ma due to crustal thickening in the northeastern Pamir (Robinson et al., 2007; Cai et al., 2017; Li et al., 2020b). The dome then underwent two stages of exhumation. The first-stage rapid exhumation occurred during ∼12–8 Ma, reflecting ∼N–S extension driven by the south-dipping Shen-ti normal fault (Robinson et al., 2007; Cao et al., 2013b). The second-stage exhumation slowed and has continued to the present, relating to the E–W extension along the KSES since ∼6–5 Ma and focused glacial and fluvial erosion since ∼4–3 Ma (Robinson et al., 2007; Sobel et al., 2011; Cao et al., 2013a; Cao et al., 2013b; Thiede et al., 2013). The Kongur Shan Dome was buried at a crustal depth of ∼30 km at ∼9 Ma, when it experienced peak metamorphism (Robinson et al., 2004). In contrast to the Muztaghata Dome, the Kongur Shan Dome is characterized by rapid exhumation at a rate of >3 mm/yr due to the onset of the KSES at ∼7 or ∼6–5 Ma (Robinson et al., 2010; Cao et al., 2013a; Thiede et al., 2013). This dome experienced another phase of enhanced exhumation during ∼3–1 Ma, caused by glaciation and/or fluvial incision and erosion in response to the continuous extension of the KSES (Cao et al., 2013a).
Beneath the Pamir–Hindu Kush region, a ∼500-km-long belt of intermediate-depth earthquakes extends from the Hindu Kush northeastward into the Central Pamir and then bends eastward into the eastern Pamir (Kufner et al., 2018; Bloch et al., 2021). Recent studies on the intermediate-depth earthquakes and teleseismic tomography have distinctly depicted the lithospheric configuration of the Pamir (e.g., Sippl et al., 2013b; Kufner et al., 2016; Schneider et al., 2019; Liang et al., 2020; Xu Q. et al., 2021). The intermediate-depth earthquakes characterize two separate continental Wadati–Benioff zones: the Hindu Kush seismic zone and the Pamir seismic zone (e.g., Burtman and Molnar, 1993; Fan et al., 1994; Kufner et al., 2018).
Beneath the Hindu Kush, the seismicity-imaged slab has generally been interpreted as the northward-subducting Indian plate, with its dip steepening downward into sub-vertical or even overturned directions (Kufner et al., 2016; Kufner et al., 2017; Liang et al., 2020; Peng et al., 2020). Tomographic images show a low-velocity zone at ∼60–160 km depth and a high-velocity zone at ∼160–600 km depth, interpreted as the subducted crust overlying the lithospheric slab (Kufner et al., 2017; Kufner et al., 2021). The elongated shape of the deep-reaching lithospheric slab, together with high tension strains within it, suggests ongoing slab break-off and thinning of the subducting marginal Indian lithosphere (Lister et al., 2008; Kufner et al., 2017; Kufner et al., 2021).
Beneath the Pamir, receiver function images, local earthquake tomography, and observation of guided waves have revealed an arcuate Pamir slab (lower crust and upper mantle) with various dips (Sippl et al., 2013a; Sippl et al., 2013b; Schneider et al., 2013; Li et al., 2018; Mechie et al., 2019; Bloch et al., 2021; Xu Q. et al., 2021). The Pamir slab dips to the east under the western South Pamir and then bends south-dipping under the Central Pamir. To the east of a seismicity gap between 74.4°E and 74.9°E, the south-dipping slab abruptly overturns to the north. A slab tear may have occurred at the boundary, showing flipping of the slab dips (Bloch et al., 2021). Below the southern portion of the eastern Pamir, the observed double Moho structure, P-wave velocity structure, and seismicity distribution indicate that the Pamir slab has underthrusted eastward beneath the Tarim lithospheric mantle (Bloch et al., 2021; Xu Q. et al., 2021). South of the arcuate Pamir slab, the presence of a high-velocity anomaly was interpreted as the underthrusting cratonic Indian lithosphere (Sippl et al., 2013a; Li et al., 2018; Liang et al., 2020; Bloch et al., 2021). The northward-advancing cratonic Indian lithosphere, as an indenter, was inferred to have forced the delamination and rollback of the Pamir/Asian lithosphere, forming the arcuate Pamir slab (Kufner et al., 2016; Bloch et al., 2021). The slab tear or overturns underneath the eastern Pamir may be related to the along-strike variability of the indenter tip and/or lateral differences in the strength and density of the indented lithospheres (Bloch et al., 2021; Kelly and Beaumont, 2021). The collision of the cratonic Indian lithosphere and the Pamir slab could have started at ∼12–11 Ma, based on the India–Asia convergence rate of ∼34 mm/yr (Molnar and Stock, 2009) and ∼380–400 km delamination of the Pamir slab (Kufner et al., 2016).
The arcuate tectonic belt in the frontal Pamir salient consists of several main structures with different tectonic styles, including the DF, TFTB, PTS, KSES, and KYTS. We summarized the million-year, millennial, and decadal deformation rates of these structures (Table 1) based on previous research.
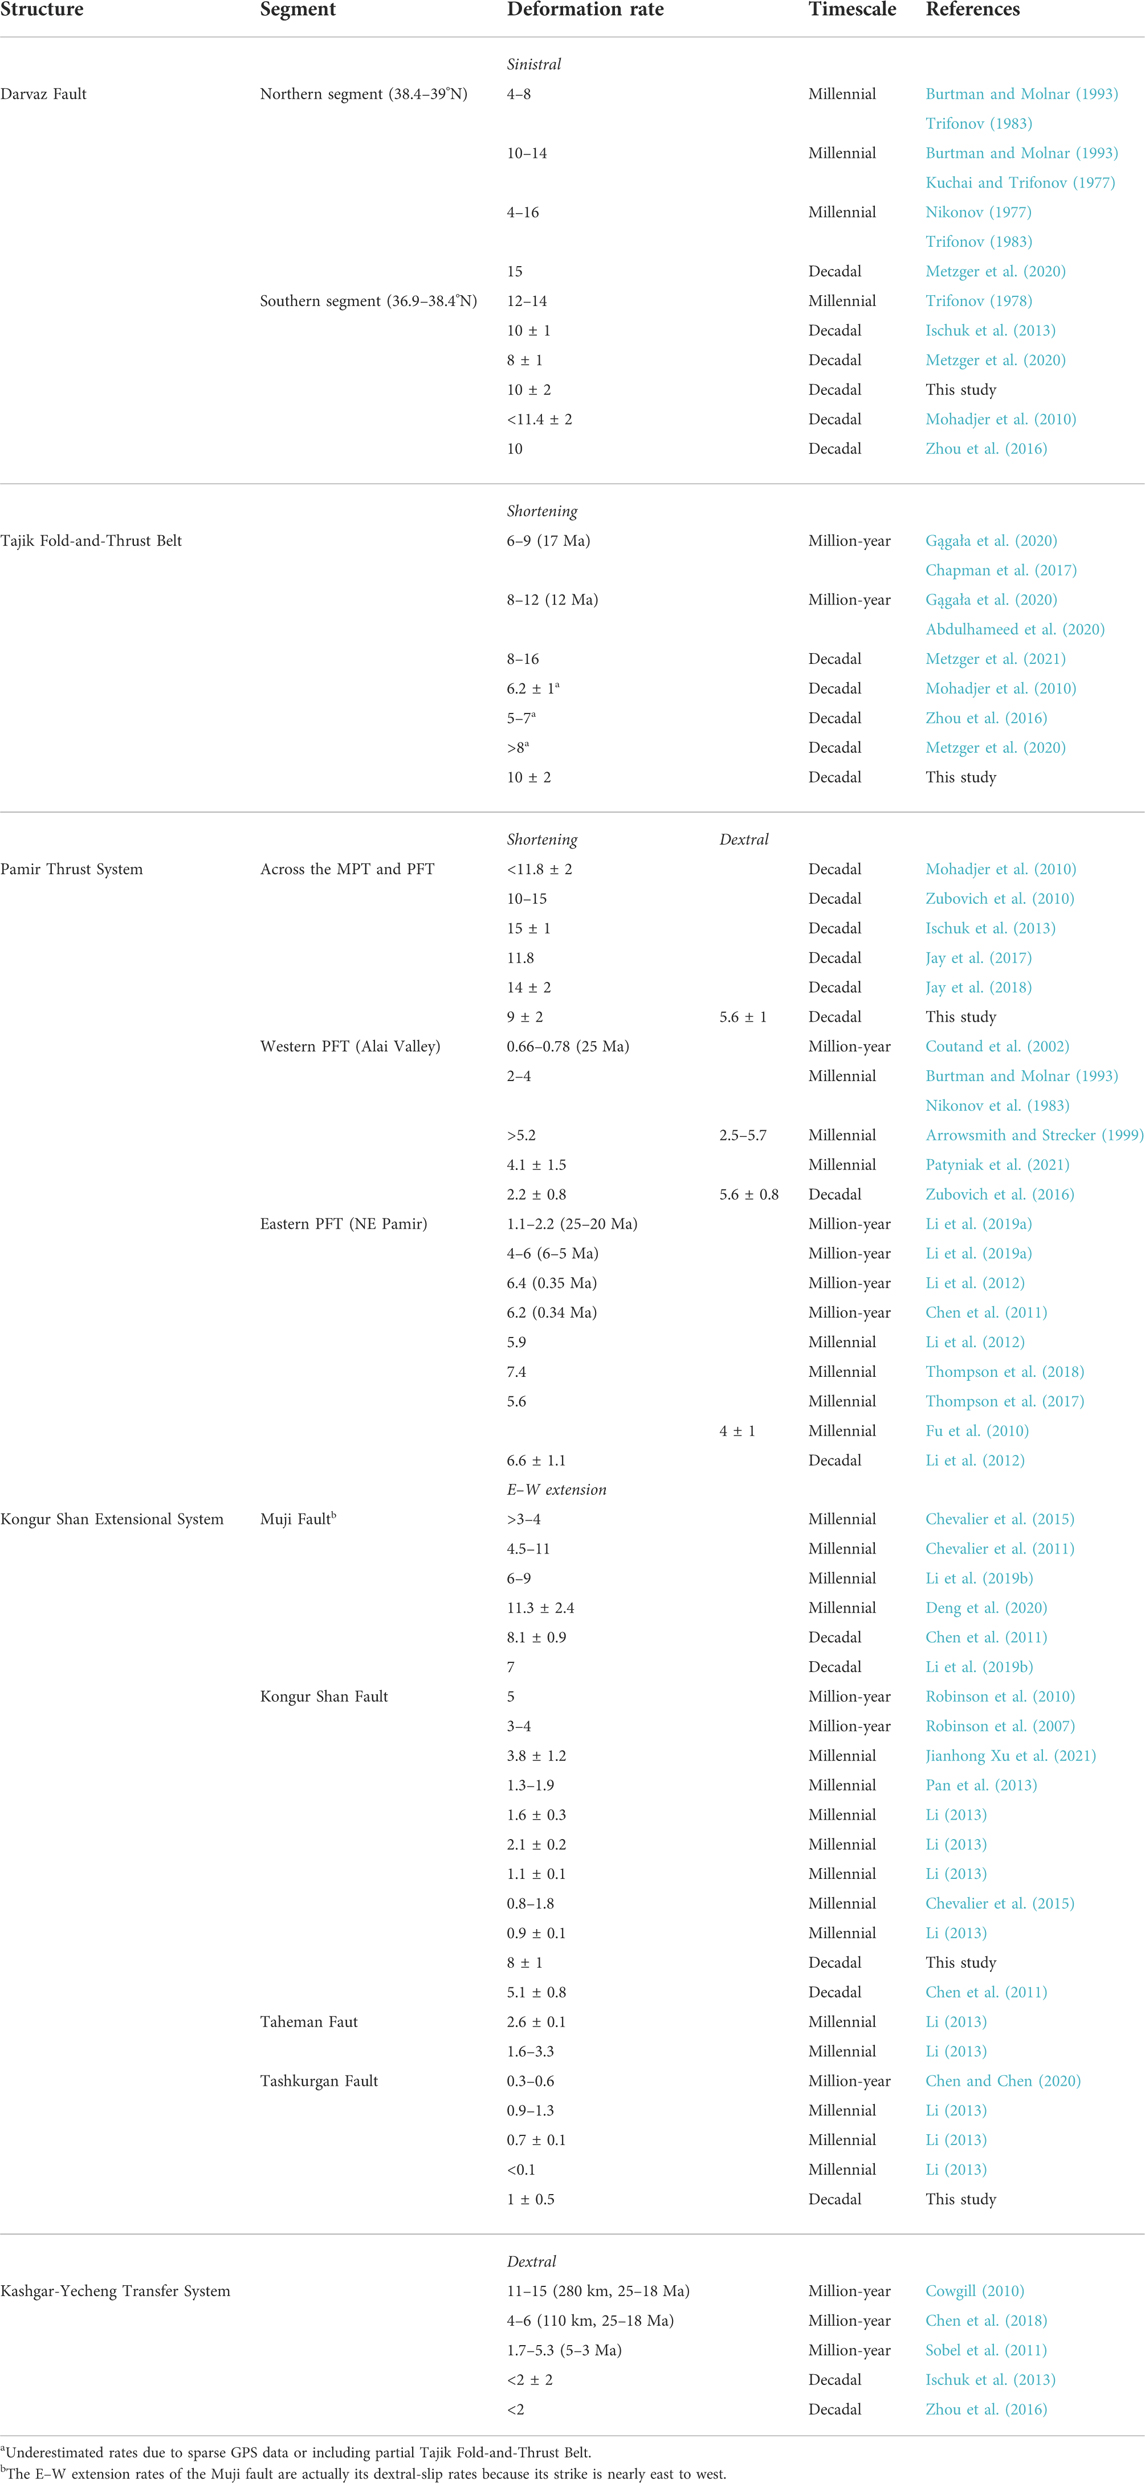
TABLE 1. Multi-timescale deformation rates of main structures along the frontal Pamir salient.
The timing, total displacement, and slip rates of the entire DF remain largely unquantified; in particular, there are few constraints on the million-year-averaged slip rate. The millennial sinistral-slip rates of the DF were mainly constrained based on Late Quaternary fault-displaced geomorphic markers. In the southern part of the DF (at ∼37.8°N), the offset geomorphic features inside a pull-apart basin (i.e., 20 m of Late Holocene landforms, 120–150 m of Early Holocene terraces and alluvial fans, and 300 m of Late Pleistocene landforms) suggest a sinistral slip rate of 12–14 mm/yr (Trifonov, 1978). Farther north, at ∼38.5–38.7°N, many Late Holocene dry gullies have been displaced left-laterally from a few meters to 100 m (Burtman and Molnar, 1993). Among these offsets, a 21 m displacement of a human-made wall with an inferred age of ∼1,500–2,100 years suggests a sinistral slip rate of 10–14 mm/yr (Kuchai and Trifonov, 1977; Burtman and Molnar, 1993). In the same region, Nikonov (1975) reported a 3 km offset of conglomerates deposited between 2.5 and 0.7 Ma, combined with offsets of Holocene (∼160 m) and Late Pleistocene (∼800 m) valleys, the slip rate along this part of the DF is estimated to be 4–16 mm/yr (Nikonov, 1977; Trifonov, 1983). Farther northeast, around 39°N and 71°20′E, two moraines, considered to have formed since the Last Glacial Maximum (LGM), have been displaced sinistrally by 50 and 170 m, respectively, implying 3–4 to 8 mm/yr sinistral-transpressive slip rates (Trifonov, 1983; Burtman and Molnar, 1993). In summary, most slip rates mentioned above were derived from offset geomorphic markers lacking solid-constrained ages. Burtman and Molnar (1993) inferred that the sinistral slip rate on the DF is 10–15 mm/yr based on three relatively reliable offset features.
The previous sparse GPS data showed the present-day sinistral slip rate of ∼10 mm/yr along the nearly N–S trending segment of the DF (Mohadjer et al., 2010; Ischuk et al., 2013; Zhou et al., 2016). More recently, denser GPS data have yielded rates of 8 ± 1 mm/yr and ∼15 mm/yr for the ∼N–S trending and NEE-trending segments, respectively (Metzger et al., 2020).
The Tajik Fold-and-Thrust Belt constitutes a series of westward-convex thrust faults and folds that are generally parallel to the western margin of the Pamir salient (Chapman et al., 2017). Due to the difference in the availability of subsurface data of the Tajik Basin in previous research, the resulting diverse structural models of the TFTB imply variable magnitudes of ∼E–W shortening, ranging from ∼70 to ∼240 km (Bourgeois et al., 1997; Burtman, 2000; Chapman et al., 2017; Gągała et al., 2020). A recent study (Gągała et al., 2020) defined the TFTB as a thin-skinned belt and showed an increase in the ∼E–W shortening, from ∼93 km in the south to ∼148 km in the north, based on analyses of rich boreholes and 2-D seismic data.
Regarding to the onset and rates of shortening across the TFTB, Chapman et al. (2017) reported the first low-temperature thermochronology data of the TFTB, indicating that its shortening started before 17 Ma. By utilizing new low-temperature thermochronology data, Abdulhameed et al. (2020) confirmed that the major shortening commenced at ∼12 Ma, which is also reflected in Chapman et al.’s (2017) thermokinematic modeling results. Therefore, with the newest estimate of the amount of total shortening, the average ∼E–W shortening rates of the TFTB since ∼17 Ma and ∼12 Ma are ∼6–9 mm/yr and ∼8–12 mm/yr, respectively.
In early studies, GPS velocity profiles across the western Pamir and Tajik Basin yielded ∼E–W shortening rates of ∼6 mm/yr within the basin (Mohadjer et al., 2010; Zhou et al., 2016). However, recent, denser GPS data has indicated a higher shortening rate of >8 mm/yr (Metzger et al., 2020), consistent with those of ∼8–16 mm/yr estimated from the InSAR rate map (Metzger et al., 2021). The denser GPS data also revealed a 2 ± 2 mm/yr extension of the DF, which cannot be detected in early research owing to the limited GPS sites. Therefore, these early studies involved the extension of the DF when calculating the shortening rates within the basin, resulting in smaller rates.
Deformation along the PTS (including both the MPT and PFT) is dominated by thrust faulting (with variable verging from N15°W in the west to N30°E in the east) and local dextral slip (Figure 1B) (Arrowsmith and Strecker, 1999; Sobel et al., 2013). Studies on the deformation rates have focused on the recent deformation front, the PFT, while the deformation rates of the MPT have rarely been constrained.
On the million-year timescale, structural restorations based on regional cross-sections and stratigraphy indicate two main deformation periods of the PTS (Coutand et al., 2002; Cheng et al., 2016; Li et al., 2019a). The total shortening across the Alai Valley in the northernmost Pamir was estimated to be 33–37 km, including two shortening events starting in the Late Oligocene–Early Miocene and Middle Miocene, respectively (Coutand et al., 2002). The estimated average shortening rate is 0.66–0.78 mm/yr over the past 25 Myr, which was largely underestimated, possibly due to the incomplete shortening restoration across parts of the PTS (Gągała et al., 2020). In the NE Pamir, the total shortening across the PTS decreases eastward, ranging from 43 to 29 km (Li et al., 2019a), which has also been accomplished by two key stages of shortening (Thompson et al., 2015). The first stage commenced at 25–20 Ma with average rates of 1.1–2.2 mm/yr, and the second stage started at 6–5 Ma with elevated average rates of 4–6 mm/yr (Thompson et al., 2015; Li et al., 2019a). The latter shortening rates are consistent with the rate since 0.35 Ma (6.2–6.4 mm/yr), which was constrained based on field mapping and magnetostratigraphy (Chen et al., 2011; Li et al., 2012).
On the millennial timescale, Arrowsmith and Strecker (1999) constrained the dip-slip rate of one central strand of the western PFT to >6 mm/yr (equivalent to >5.2 mm/yr shortening rate) by reconstructing the fault offset and associated chronology of a terrace at the Syrinadjar River. A recent detailed paleoseismic study on the same fault strand obtained a slightly lower rate of 4.1 ± 1.5 mm/yr over the past ∼5 kyrs (Patyniak et al., 2021). This slip rate is compatible with the other determination of a minimum of 2–4 mm/yr based on the overthrusting of Stone Age artifacts farther west (Nikonov et al., 1983; Burtman and Molnar, 1993). In the vicinity of the artifacts, Arrowsmith and Strecker (1999) also estimated the dextral-slip rate across the Altyndara River to be 2.5–5.7 mm/yr based on the offset channels that were assumed to have formed 10 kyrs ago. Along the eastern PFT, a terrace surface developed in the Mayikake Basin and in the fault’s footwall was displaced by ∼38 and ∼15 m along two fault strands, respectively. Li et al. (2012) suggested that the terrace was abandoned at ∼18.4 ka based on optically stimulated luminescence (OSL) dating and quantified PFT’s shortening rate to be ∼5.9 mm/yr. Thompson et al. (2018) dated the same terrace to be ∼14.2 ka using a 10Be depth profile, yielding a slightly higher rate of ∼7.4 mm/yr. To the southwest, the PFT deformed another three flights of terraces in the hanging wall, forming fold scarps. Thompson et al. (2017) calculated PFT’s total slip across these terraces based on the fault-bend fold scarp model (Li et al., 2015 and references therein). A fault slip of ∼540 m across the highest terrace, with its OSL age (∼97.9 ka), yielding a shortening rate of ∼5.6 mm/yr. Farther southeast, the eastmost segment of the eastern PFT shows 4 ± 1 mm/yr of dextral slip, as inferred from co-seismic channel offsets and average earthquake recurrence intervals (Fu et al., 2010).
On the decadal timescale, GPS measurements have shown that present-day ∼N–S shortening rates across the PTS range from 10 to 15 mm/yr (Zubovich et al., 2010; Ischuk et al., 2013; Zhou et al., 2016). The rates are consistent with the modeling rates (11.8–14.4 mm/yr) from a kinematic model based on recent GPS velocities and Quaternary fault slip rates (Jay et al., 2017; Jay et al., 2018). The velocities from four GPS stations across one strand of the western PFT indicated a shortening rate of 2.2 ± 0.8 mm/yr and dextral-slip rate of 5.6 ± 0.8 mm/yr near the Altyndara River (Zubovich et al., 2016). The latter rate is consistent with the estimated millennial rate. In the eastern PFT, Li et al. (2012) obtained a minimum shortening rate of 6.6 ± 1.1 mm/yr by analyzing previous GPS velocities (Yang et al., 2008; Zubovich et al., 2010), consistent with the InSAR observed rate of 6 ± 2.8 mm/yr (Bufe et al., 2017).
In comparison with the fault systems mentioned above, previous studies have made more substantial progress to quantify the kinematics of the KSES in the NE Pamir. Here, we summarize the published deformation rates of the KSES’s four major fault segments: the Muji, Kongur Shan, Taheman, and Tashkurgan Faults.
The WNW-trending Muji Fault belongs to the northernmost portion of the KSES, connecting with the Kongur Shan Fault in the east and nearly intersecting the MPT in the west. The fault can be divided into two segments based on its along-strike variations in slip sense: the eastern segment with dominant dextral slip and a significant normal-faulting component and the western segment characterized by pure dextral slip or dextral slip with a reverse-faulting component (Li et al., 2019b).
Along the Muji Fault, various landforms displaced by dextral slip provide opportunities to determine the millennial slip rates of the fault’s different segments. In the west segment at 39.272°N, 73.989°E, the dextral-slip rate was estimated to be > 3–4 mm/yr based on three offset channels that were assumed to be preserved during the maximum glacial advances at 8–10, 16, and 50–80 ka, respectively (Chevalier et al., 2015). In the eastern segment near the Akesayi village, Chevalier et al. (2011) constrained the dextral-slip rate to ∼4.5–11 mm/yr based on fault displacements across fluvial terrace risers and associated cosmogenic 10Be ages. Li et al. (2019b) dated the same terraces again using 10Be depth profiles and added a terrace’s surface age, refining the rate to ∼6–9 mm/yr. Approximately 20 km farther east, the dextral slip of the Muji Fault increases to 11.3 ± 2.4 mm/yr, based on the offsets and ages of moraines along the fault (Deng et al., 2020).
The present-day lateral slip rate of the Muji Fault is ∼7–8 mm/yr near Akesayi, as estimated from the published GPS velocity data (Yang et al., 2008; Zubovich et al., 2010; Zhou et al., 2016) by Chen et al. (2011) and Li et al. (2019b). The accuracy of the decadal-slip rate could be improved in the future when denser GPS sites are available in this region.
The Kongur Shan Fault generally trends NNW, dipping moderately (35°–45°) to the west and southwest (Robinson et al., 2004). It is characterized by dominant normal slip and minor dextral slip (Robinson et al., 2004; Chevalier et al., 2015).
On the million-year timescale, the thermo-kinematic modeling results showed that the fault’s constant rates of dip-slip and E–W extension along the Kongur Shan Dome have been 6.5 and 5 mm/yr, respectively, since ∼7 Ma (Robinson et al., 2010). To the south, Robinson et al. (2007) reported the E–W extension along the fault west of the Muztaghata Dome, ∼20 km since 6–5 Ma, yielding an average extension rate of 3–4 mm/yr.
On the millennial timescale, fault offsets reconstructed from an alluvial fan (38.912°N, 74.785°E) north of the Kongur Shan and associated 10Be surface exposure ages, suggest a Holocene vertical slip rate of 1.8–2.6 mm/yr (Pan et al., 2013). This slip rate is consistent with that obtained from an adjacent fluvial terrace (2.2 ± 0.7 mm/yr, Xu J. et al., 2021). The latter vertical rate corresponds to an E–W extension rate of 3.8 ± 1.2 mm/yr, for a fault dip of 30° (Robinson et al., 2004). In the southern piedmont of the Muztaghata Dome, a landslide body formed at ∼7 ka (Yuan et al., 2013) has been vertically displaced by ∼15 m, yielding a vertical slip rate of 2.2 ± 0.4 mm/yr; the E–W extension rate was determined to be 1.6 ± 0.3 mm/yr based on the fault strike (330°) and dip (50°) (Li, 2013). The adjacent debris flow fan also shows a dextral-slip rate of 0.9 ± 0.2 mm/yr for this fault segment (Chevalier et al., 2015). About 3 km farther southeast, the fault displaced an ∼62 ka-old moraine by ∼98 m, providing the vertical-slip and E–W extension rates of 1.8 ± 0.2 and 2.1 ± 0.2 mm/yr, respectively (Li, 2013). South of the Kongur Shan Fault’s junction with the Taheman Fault (37.982°N, 75.255°E), the fault’s vertical slip rate is ∼1.7–2.3 mm/yr (Li, 2013; Chevalier et al., 2015), based on alluvial fan scarp offsets (∼35 m) and chronology (∼15–20 ka). The corresponding E–W extension rate is ∼1.1–1.5 mm/yr with fault dip of 40° and strike of 304°. Farther south, the activity of the Kongur Shan Fault has been significantly reduced; its vertical-slip and E–W extension rates reach 0.7 ± 0.1 and 0.9 ± 0.1 mm/yr, respectively (Li, 2013).
On the decadal timescale, the velocity analysis from sparse GPS stations indicated that the E–W extension rate of the Kongur Shan Fault generally decreases from north to south (Zhou et al., 2016; Li et al., 2019b). Specifically, the E–W extension rate west of the Kongur Shan is 5.1 ± 0.8 mm/yr (Chen et al., 2011), consistent with the million-year-averaged rate.
The ∼20-km-long Taheman Fault has been interpreted as a transfer fault, linking the Kongur Shan and Tashkurgan Faults (Robinson et al., 2007). This transfer fault can be divided into two segments based on their orientations: the ∼13-km-long northern segment striking N25°E and the ∼7-km-long southern segment striking N5°E (Robinson et al., 2007).
To date, only millennial slip rates of the Taheman Fault have been published, constrained from two offset sites in alluvial fans on the northern segment (Li, 2013). The first alluvial fan (37.998°N, 75.235°E) is cut by multiple step-like fault scarps containing coseismic scarps of the 1895 Tashkurgan M7.0 earthquake (Li et al., 2011). The total offsets (∼32–37 m) and the fan’s exposure age (∼15 ka) together indicate that the fault’s vertical-slip and E–W extension rates are 2.2–2.7 and 2.2–3.1 mm/yr, respectively. The second alluvial fan (37.981°N, 75.219°E) exhibits a vertical offset of ∼22.6 m over the past ∼7–15 kyr, suggesting the vertical-slip and E–W extension rates of 1.5–3.1 and 1.6–3.3 mm/yr, respectively.
As the southernmost segment of the KSES, the Tashkurgan Fault strikes NNW and dips to the east. The low-temperature thermochronological analysis indicated that the fault’s footwall has been exhumed at an average rate of ∼0.6–0.9 mm/yr since ∼6–5 Ma (Chen and Chen, 2020). For the fault dipping 60° (Robinson et al., 2007) and striking 162°, the million-year-averaged E–W extension rate of this fault is ∼0.3–0.6 mm/yr.
The millennial fault slip rates were constrained by offset moraines at three sites from north to south (Li, 2013). At the mouth of the Kuzigun valley (37.652°N, 75.233°E), the vertical offsets (∼19.6–33.1 m) and the 10Be exposure ages (∼19–24 ka) of the moraines yield the vertical-slip and E–W extension rates of ∼1–1.4 and ∼0.9–1.3 mm/yr, respectively. Farther south, at the mouth of the Jialongqiete valley (37.550°N, 75.263°E), the moraines that formed ∼19 kyr ago have been offset by ∼11.5 m, yielding the vertical-slip and E–W extension rates of ∼0.6 and ∼0.7 mm/yr, respectively. In the southernmost portion of the fault (37.256°N, 75.382°E), an isolated moraine complex with a 10Be exposure age of ∼65 ka has been vertically offset by ∼8 m. These data suggest that the vertical-slip and E–W extension rates are 0.1 and <0.1 mm/yr, respectively. In general, the E–W extension rates of the Tashkurgan Fault decrease from north to south, consistent with the trend from the GPS velocity data (Zhou et al., 2016; Li et al., 2019b).
The total dextral-slip offset of the KYTS remains debated under two end-member models (see descriptions in Section 1). Cowgill (2010) estimated the cumulative dextral-slip offset to be ∼280 km based on the assumption that the North Pamir and the western Kunlun were situated at a linear belt before the Cenozoic indentation of the Pamir. The million-year-averaged slip rate was thus estimated to be ∼11–15 mm/yr since its initiation at 25–18 Ma (Cowgill, 2010). However, the magnitude of the dextral-slip offset is much lower (<110 km) in the inherited-arc model (Chen et al., 2018), yielding a lower million-year-averaged rate of ∼4–6 mm/yr. Recent thermochronological data and geomorphic observations suggest that the KYTS has been inactive, except for the Aertashi strand, with an average rate of 1.7–5.3 mm/yr since at least 5–3 Ma (Sobel et al., 2011). This rate range brackets the present-day rate of relative motion between the eastern Pamir and Tarim block (∼2 mm/yr), as revealed by GPS velocity analyses (Ischuk et al., 2013; Zhou et al., 2016).
To reveal the bulk pattern of the present-day deformation field of the Pamir salient, we collected and reanalyzed all previously published GPS velocity data and instrumental seismicity recorded from 1976 to 2021 (Global Centroid Moment Tensor Catalog; https://www.globalcmt.org/) within and around the Pamir.
The published GPS data in the Pamir and its surrounding regions (34–42°N, 66–79.4°E) (Zubovich et al., 2010; Li, 2012; Ischuk et al., 2013; Jouanne et al., 2014; Zhou et al., 2016; Metzger et al., 2020; Wang and Shen, 2020) were acquired using the updated dataset for the same sites. Most of the GPS velocities are based on the campaign mode, whereas the measurements of the continuous stations span at least 3 years. Because some of these velocity datasets are referenced to different reference frames, we combined them in the International Terrestrial Reference Frame 2008 (ITRF 2008, Altamimi et al., 2012) through an application of the rigid body rotation to each set using the VELROT program of GAMIT/GLOBK software (Herring et al., 2010). Then, we transformed the GPS velocity vectors from ITRF2008 to the Eurasia-fixed reference frame using the rotation Euler pole (54.23°, −98.85°, 0.257/Myr). Finally, the GPS velocities of 362 stations formed the integrated GPS velocity field relative to Eurasia (Figure 3; data are provided in the Supplementary Material).
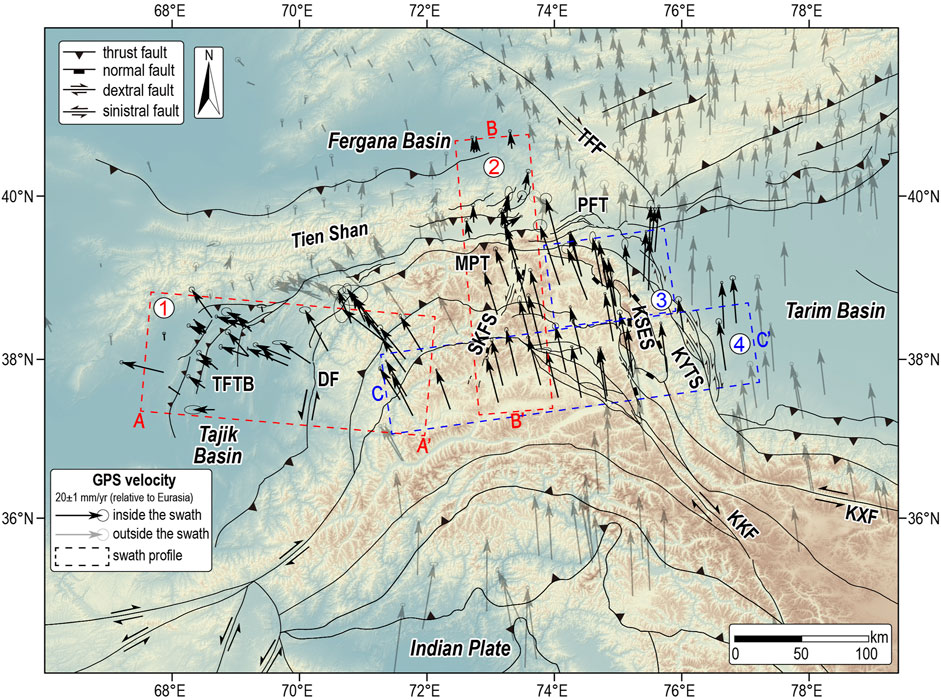
FIGURE 3. The GPS velocity field of the Pamir salient and its adjacent regions, relative to the Eurasian plate. Black arrows bounded by red and blue dashed swaths denote GPS velocity vectors used in this study to analyze decadal-scale deformation rates. Fault names same as Figure 1.
To constrain the deformation rates of the main structures in the Pamir, we selected 91 GPS stations that constitute four swath profiles: Swath 1 across the western Pamir and the Tajik Basin; Swath 2, crossing from the northern margin of the southwesternmost Tien Shan to the southern Pamir; Swath 3 across the northern KSES; and Swath 4 from the western Pamir to the southwestern Tarim Basin (Figure 3). The horizontal GPS velocity vectors within the four swaths were separately projected onto three directions in parallel with the swaths or perpendicular to the strikes of the main structures (Figure 3). In detail, the GPS velocity vectors in Swath 1 were projected on profile A–A’ striking 95°, those in Swath 2 were projected on profile B–B’ striking 175°, and those in Swaths 3 and 4 were projected on profile C–C’ striking 82°.
Two key kinematic patterns of the Pamir salient can be observed in the GPS velocity field. First, the GPS velocity vectors show bulk northward movement accompanied by an anticlockwise rotation of the Pamir salient (Figure 3), as has been noted in previous studies (e.g., Zhou et al., 2016; Pan et al., 2018). Second, the GPS velocity vectors radiate asymmetrically from the interior of the Pamir to its foreland. The vector directions change anticlockwise from NNW to NW or WNW in the west, while they rotate clockwise to NNE in the east with a much smaller magnitude of rotation.
The three GPS profiles reveal the present deformation of the Pamir salient. Along profile A–A’, the velocities parallel to the profile can be divided into two groups within the Tajik Basin: the −15.5 ± 1.3 mm/yr in the east of the TFTB and the −5.4 ± 0.5 mm/yr in the west (Figure 4A). The difference between the two groups suggests 10 ± 2 mm/yr of shortening of the TFTB. The velocities perpendicular to the profile decrease from 13.6 ± 1.5 mm/yr in the western Pamir to 3.9 ± 0.5 mm/yr in the Tajik Basin (Figure 4B), indicating the sinistral slip of 10 ± 2 mm/yr between the Pamir and the Tajik Basin, mainly accommodated by the DF.
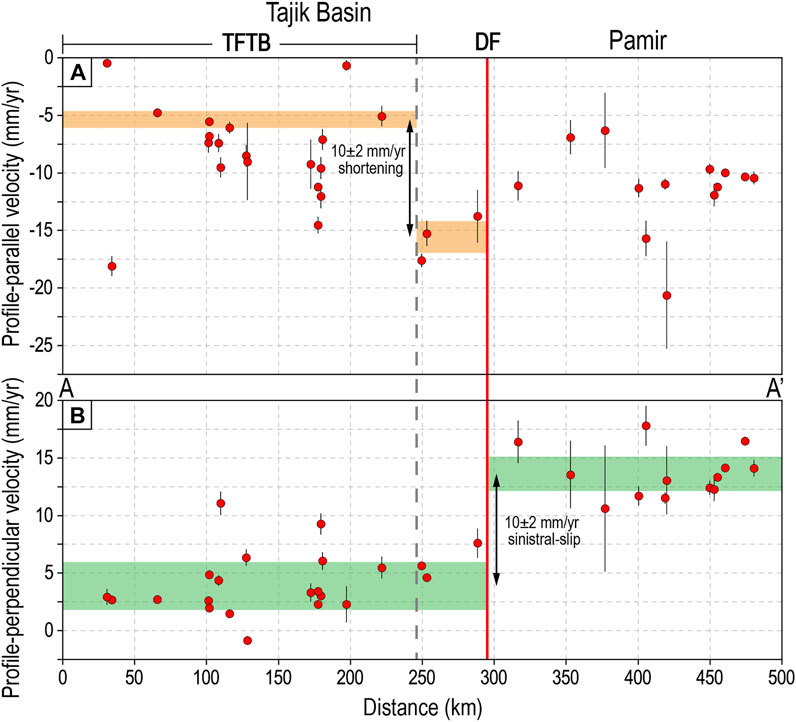
FIGURE 4. GPS velocity profile A–A’ (see location in Figure 3). (A) Velocities parallel to the profile. (B) Velocities perpendicular to the profile. Colored stripes show velocity ranges. The dark grey dashed line and bold red line mark the tectonic domain boundary and fault location, respectively. Fault names same as Figure 1.
Along profile B–B’, the velocities parallel to the profile increase significantly across the PTS from north to south (Figure 5A), indicating a crustal shortening of 9 ± 2 mm/yr. Within the South Pamir, the velocities exhibit a decreasing trend from north to south, suggesting a 1.8 ± 2 mm/yr N–S extension rate. The velocities perpendicular to the profile on both sides of the PTS show an obvious difference (Figure 5B), representing a dextral slip rate of 5.6 ± 1 mm/yr between the Pamir and Alai valley, which is mainly accommodated by the PTS.
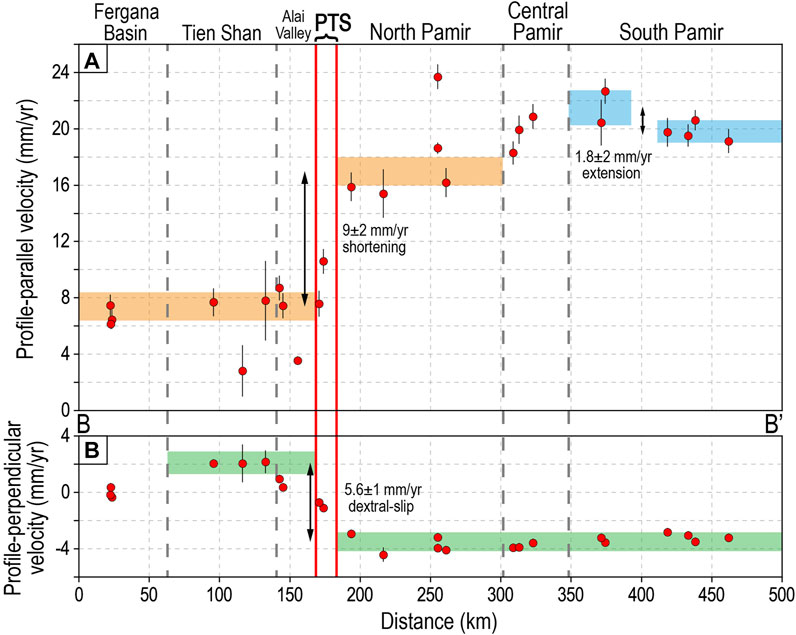
FIGURE 5. GPS velocity profile B–B’ (see location in Figure 3). (A) Velocities parallel to the profile. (B) Velocities perpendicular to the profile. Colored stripes show velocity ranges. The dark grey dashed lines and bold red lines mark the tectonic domain boundaries and fault locations, respectively. PTS: Pamir Thrust System. Other fault names same as Figure 1.
Along profile C–C’, the velocities parallel to the profile from Swath 3 indicate that the E–W extension rate of the northern KSES is 8 ± 1 mm/yr, while the velocities from Swath 4 show minor variations on both sides of the southern KSES, suggesting an extension rate of 1 ± 0.5 mm/yr (Figure 6A). West of the southern KSES, the E–W extension rate within the South Pamir is much larger, at 5 ± 1 mm/yr (Figure 6B).
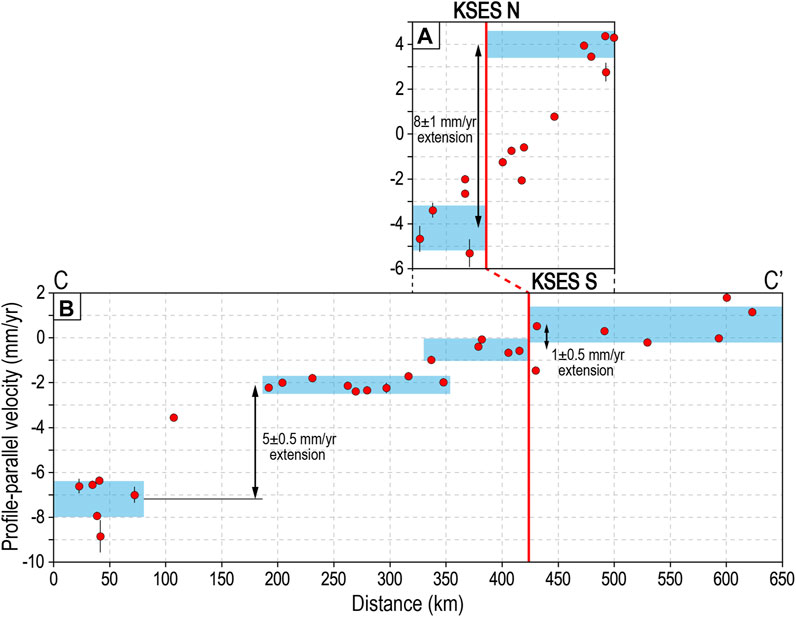
FIGURE 6. GPS velocities parallel to the profile C–C’ (see location in Figure 3). (A,B) show velocities in swaths 3 and 4, respectively. Colored stripes show velocity ranges. The red bold line denotes the fault location of the Kongur Shan Extensional System.
Seismic source parameters and their mechanism solutions can partly reflect the relationship between the tectonic deformation and lithospheric structure. We present depths and focal mechanism solutions from 632 earthquakes with magnitude >4 that occurred within and around the Pamir salient (34–40.8°N, 66–77.7°E) during 1976–2021 (Figure 7), to further understand the tectonic deformation field in this region.
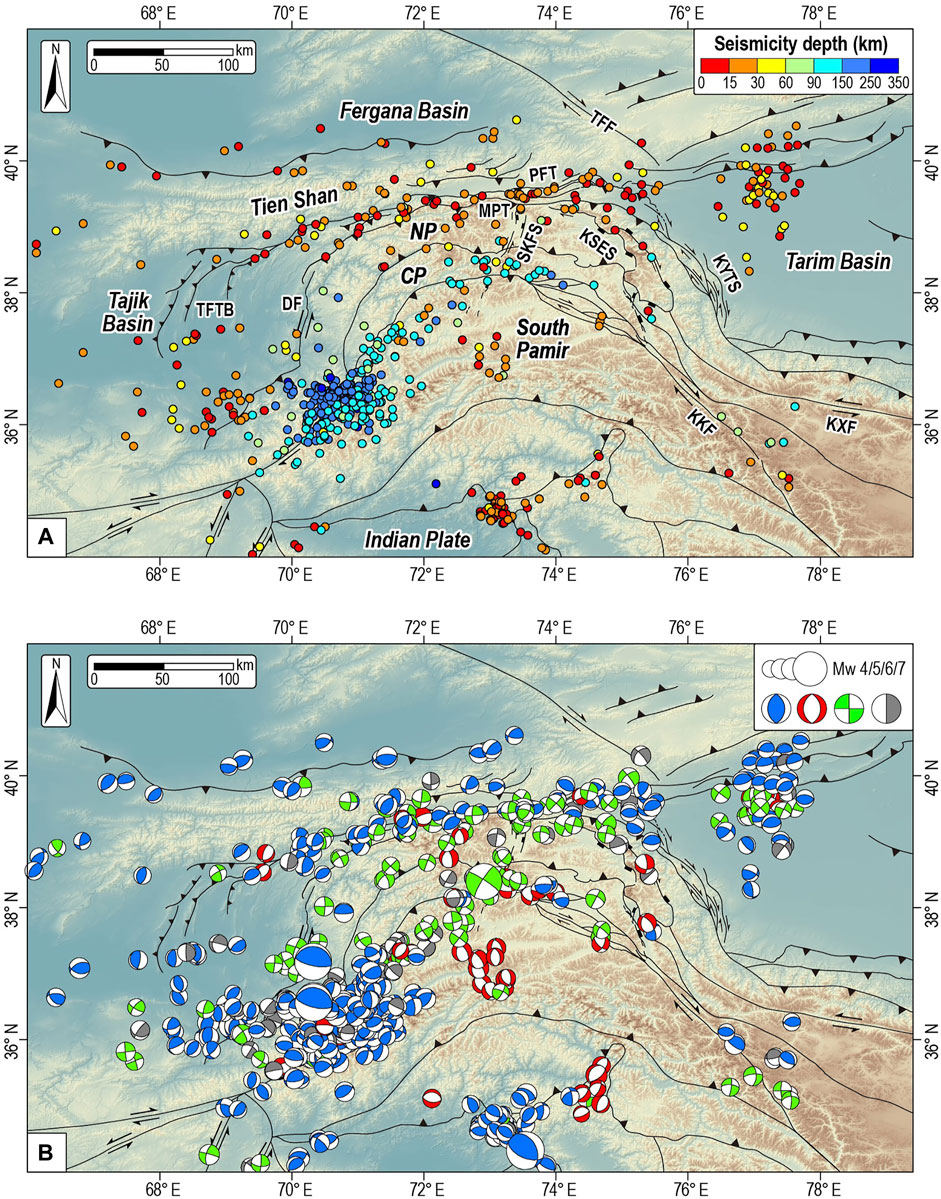
FIGURE 7. Seismicity of the Pamir salient and its adjacent regions. (A) Earthquake focal depth. (B) Focal mechanisms. Blue, red, and green beachballs represent the thrust, normal-fault, and strike-slip earthquakes, respectively. The earthquake data are from Global Centroid Moment Tensor Catalog (GCMT). Fault names same as Figure 1. NP, North Pamir; CP, Central Pamir.
The main seismicity in the Pamir salient can be classified into two categories according to depth: intermediate-depth (60–350 km depth) and shallow seismicity (>30 km depth) (Figure 7A). The deep tectonic settings revealed in the arcuate intermediate-depth earthquake zone are outlined in Section 2.3.
Shallow earthquakes above 30 km depth are mainly distributed along the edge and central axis of the Pamir. In the Tajik Basin to the west of the Pamir Plateau, N–S striking thrust earthquakes spreading in an E–W direction reflect the E–W shortening primarily absorbed by the TFTB within the basin. On the western edge of the Pamir, the earthquakes that occurred on the N–S-trending DF are predominantly strike-slip, while both strike-slip and thrusting earthquakes occurred on the NE-striking segment. This difference may indicate the transition in the kinematics of the DF from sinistral slip to oblique thrusting (Kufner et al., 2018). Most earthquakes cluster along the northern margin of the Pamir, predominantly thrust and strike-slip earthquakes, corresponding to the kinematic characteristics of the PTS (Figure 7B) and consistent with the GPS velocity-inferred observations of active N–S shortening and dextral slip. On the eastern edge of the Pamir, the KYTS has triggered very limited strong earthquakes since 1976, indicating its current weak activity (Sobel et al., 2011; Zhou et al., 2016). In addition to widespread thrust and strike-slip earthquakes, there exist a few E–W striking normal-fault earthquakes. In the interior of the Pamir, along the central axis of the Pamir, there are a series of N–S striking normal-fault earthquakes extending from the northernmost to the southernmost part of the Pamir. The earthquake clustering is conspicuous in the South Pamir. These nearly N–S striking earthquakes related to normal faulting occurred in the middle and upper crust according to their depths, but there appears to be no significant evidence of normal faulting or extensional activity on the surface. In contrast, the main extensional structures in the northern and northeastern Pamir, such as KG and KSES, generated fewer normal fault earthquakes.
The above summary of multi-timescale deformation rates of the main structures along the frontal Pamir salient allows for further analysis of the spatiotemporal variations in fault kinematics. To do this, we projected the rates onto an arcuate profile along the margin of the Pamir salient (Figure 8).
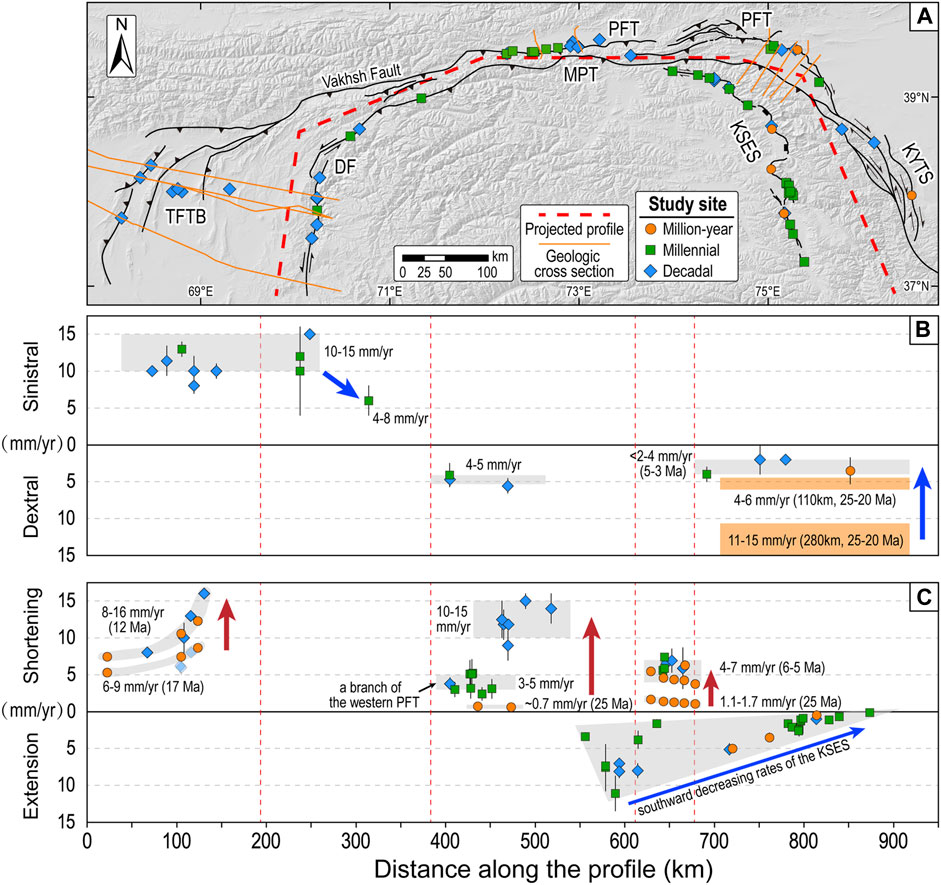
FIGURE 8. Projections of deformation rates at three timescales along the arcuate front of the Pamir salient (modified from Ge et al. (2022)). (A) Study locations of geologic cross-sections (thin, orange lines) and deformation rates at million-year, millennial and decadal timescales. (B) Deformation rates parallel to the profile denote strike-slip rates. (C) Deformation rates perpendicular to the profile denote shortening and extensional rates. The direction of extension rates is east to west. In Figures (B,C), the red dotted lines represent the turning points of the projected profile; the grey shadows show approximate ranges or trends of rates; the brownish-red and blue arrows show increasing and decreasing trends of rates across different timescales, respectively. The transparent blue diamonds in Figure C are the underestimated decadal rates of the TFTB. Fault names see Figure 1.
The strike-slip rates of each segment have remained stable since the Late Quaternary, and show an anticlockwise decrease along the arcuate profile (Figure 8B). The millennial and decadal left-slip rates of the main DF are generally consistent, within the range of 10–15 mm/yr (Burtman and Molnar, 1993). The millennial slip rate decreases to 4–8 mm/yr at the east end of the DF (Trifonov, 1983), indicating that the deformation along the DF zone may be partly accommodated by the thrusting at the location with changes in fault strikes (see Section 4.2). The millennial dextral-slip rate along the northern Pamir is also consistent with decadal rates of 4–5 mm/yr (Arrowsmith and Strecker, 1999; Zubovich et al., 2016). Along the eastern margin, the dextral-slip rate of the KYTS has remained at <2–4 mm/yr since 5–3 Ma (Fu et al., 2010; Sobel et al., 2011; Ischuk et al., 2013; Zhou et al., 2016). This rate is lower than the fault’s average dextral-slip rate since its initiation at 25–20 Ma, at 4–6 or 11–15 mm/yr, depending on different end-member models (see Section 3.5), suggesting a decrease in the dextral-slip rate. Such observation is consistent with thermochronologic and geomorphic evidence that also suggests the deceleration of the KYTS between the Late Miocene and Pliocene (Sobel et al., 2011).
The shortening rates along the western and northern Pamir were relatively lower during the early deformation stage of each structure, then experienced a significant increase, and have remained roughly constant until the present (Figure 8C). Spatially, the million-year-averaged and decadal shortening rates within the Tajik Basin both show a northward increasing trend. Temporally, the shortening accelerated during the Middle Miocene: the average rates since the onset of shortening at ∼17 Ma range from 6 to 9 mm/yr (Chapman et al., 2017; Gągała et al., 2020), while the rates after ∼12 Ma are larger, within the range of 8–16 mm/yr (Abdulhameed et al., 2020; Gągała et al., 2020; Metzger et al., 2021). Consistency can be seen between the million-year-averaged rates since ∼12 Ma and decadal rates when excluding the underestimated rates (transparent blue diamonds in Figure 8C; Section 3.2). Despite lacking millennial rates of the TFTB, considering the constant slip rate since the Late Quaternary of the DF, which has been experiencing similar kinematics in the western Pamir (Schurr et al., 2014; Metzger et al., 2020), we suggest that the shortening rate of the TFTB has remained stable at 8–16 mm/yr since ∼12 Ma. The average N–S shortening rate on the northern margin has been only ∼0.7 mm/yr during the past 25 Myr (Coutand et al., 2002), much smaller than current rates of 10–15 mm/yr (e.g., Zubovich et al., 2010). The millennial rates of a branch of the western PFT are 3–5 mm/yr (Arrowsmith and Strecker, 1999; Patyniak et al., 2021), consistent with the decadal rate of 3.8 ± 0.8 mm/yr for the same segment (Zubovich et al., 2016). Based on the relatively uniform slip rate of this branch fault, the millennial rate on the northern margin can be reasonably extrapolated as also 10–15 mm/yr based on the same context of thrust faulting along the northern margin. The jump in the rate between the million-year and millennial timescales may have begun after the Middle Miocene (Coutand et al., 2002). Along the northeastern margin, the average shortening rate since 25 Ma is 1.7–2.2 mm/yr, followed by an increase to 4–6 mm/yr since 6–5 Ma (Li et al., 2019a); the latter is compatible with the eastern PFT’s rate of ∼5–7 mm/yr since the Quaternary (e.g., Li et al., 2012; Thompson et al., 2017; Thompson et al., 2018).
The E–W extension rates of the KSES at three timescales all show an overall decrease from north to south, with similar trends for the change in rates (Figure 8C). Constraints on million-year-averaged extension rates only exist at several localities near the Kongur Shan Dome (∼5 mm/yr, Robinson et al., 2010), Muztaghata Dome (∼3.5 mm/yr, Robinson et al., 2007), and northern Tashkurgan Fault (∼0.5 mm/yr, Chen and Chen, 2020). In contrast, more abundant millennial rates, despite the gap in data of the middle segment of the KSES, show an overall rapid decrease in extension rates from ∼7 to 10 mm/yr on the Muji Fault (Chevalier et al., 2011; Li et al., 2019b) to ∼3.8 mm/yr on the northern Kongur Shan Fault (Xu J. et al., 2021), and then a gradual, southward decrease to ∼0.1 mm/yr on the southernmost Tashkurgan Fault (Li, 2013). The decadal rates are limited due to the sparse GPS stations installed in the region but are consistent with those on the other two timescales. The decadal rate of the central Muji Fault is 7–8 mm/yr (Chen et al., 2011), consistent with the millennial rate of 6–9 mm/yr (Li et al., 2019b), and the rate near the Kongur Shan Dome is the same as the million-year rate, at ∼5 mm/yr. In the southern KSES, the decadal rate of ∼1 mm/y is compatible with the millennial and million-year rates.
In summary, the limited deformation rate data indicates two deformation stages since the Late Oligocene–Early Miocene. The kinematics of most structures along the frontal Pamir salient have remained relatively stable since the Middle–Late Miocene.
The multistage deformation pattern (see Sections 4 and 5.1) denotes various kinematic models of the Pamir salient since the Late Oligocene–Early Miocene, which should have been driven by coeval geodynamic processes. Combined with the burial and exhumation history of the Cenozoic gneiss domes and deep structure under the Pamir, we depict the tectonic evolution of the Pamir salient as three main stages during the Middle–Late Cenozoic, with two tectonic transformations.
Following the breakoff of the Neo-Tethyan oceanic lithosphere at ∼45 Ma, the subduction of the buoyant Indian continental lithosphere forced the compression within the Pamir, and the sinking oceanic slab induced the asthenospheric upwelling beneath the Karakoram–Pamir region (Figure 9A) (Negredo et al., 2007; Mahéo et al., 2009). The consequent intense and sustained crustal thickening in the Central and South Pamir, together with heating by the asthenospheric heat flow, caused the prolonged metamorphism in the middle–lower crust during ∼37–20 Ma (Section 2.2). Meanwhile, the subduction of the Indian plate drove the northward expansion of the Pamir salient. Paleomagnetic studies have observed the anticlockwise rotation of the Tajik Basin and the clockwise rotation along the southwestern Tarim Basin that occurred during the Late Eocene to Late Oligocene (Bosboom et al., 2014 and references therein). The rotations on both sides of the nascent Pamir salient indicate that the deformation propagated from the Pamir towards the forelands by radial thrusting (Figure 9A) (Bosboom et al., 2014).
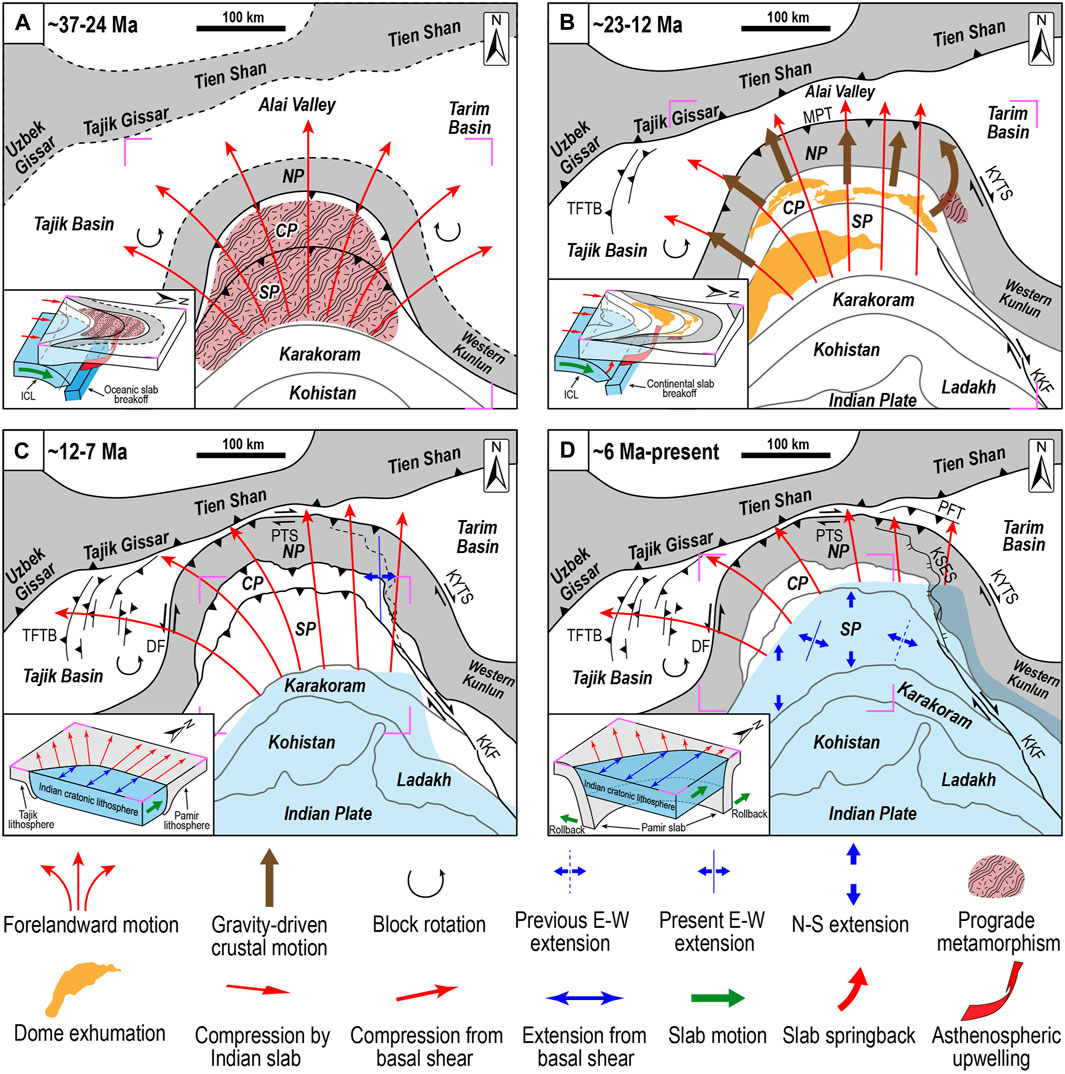
FIGURE 9. Tectonic evolution and associated geodynamic processes of the Pamir salient since the Middle–Late Cenozoic. Insets show schematic diagrams of geodynamic processes within pink boxes in corresponding plane graphs, based on Stearns et al. (2015), Kufner et al. (2016), and Rutte et al. (2017b). Insets in Figures (C,D) illustrate interactions between the Indian mantle lithosphere (blue-shaded polygons in plane graphs) and the Pamir slab. (A) ∼37–24 Ma: after the breakoff of the Neo-Tethyan oceanic lithosphere, the subduction of the buoyant Indian continental lithosphere (ICL) pushed the Pamir salient northward via radial thrusting, causing block rotations in the Tarim and Tajik basins; the crust in the Central Pamir (CP) and South Pamir (SP) experienced intense thickening and prograde metamorphism. (B) ∼23–12 Ma: the breakoff of the ICL caused asthenospheric upwelling and spring-back of the remainder, inducing the gravitational collapse in the CP and SP; the movement of the gravity-driven upper crust caused the migration of the deformation front to the North Pamir (NP) and kinematic transformation in the eastern Pamir into the large-scale dextral slip. (C) ∼12–7 Ma: the stress effects of basal shear imposed by the underthrusting of the cratonic ICL have governed the kinematics of the Pamir salient since ∼12 Ma; due to impedance of the rigid Tarim block in the east and the irregular shape of the Indian promontory, the compression induced by basal shear facilitated the foreland-ward expansion of the Pamir by asymmetric radial thrusting, generating ∼E–W extension in the northeastern Pamir that formed the KSES. (D) During ∼6 Ma–present: as the underthrusting continued, the earlier distributed deformation concentrated in the northern margin and propagated northward, forming the PFT; the extension resulting from basal shear and rollback of the Pamir slab also began to affect the SP, showing westward migration of the E–W extension. Fault names same as Figure 1.
When the subducted Indian continental lithosphere broke off during ∼25–20 Ma (Replumaz et al., 2010; DeCelles et al., 2011), the remainder was released from the slab pull force, and asthenospheric materials upwelled along the detachment zone (Figure 9B). These would not only cause a rapid topographic rise that built up local gravitational potential energy (GPE) in the South and Central Pamir, but also heat and weaken the crust. Given the existing thickened crust during the Oligocene in the two regions, the excess GPE generated a large gradient between the Pamir and its foreland areas. In addition, the lithosphere of the South and Central Pamir had been rheologically weakened before by a long history of subduction, arc formation, accretion, and tectonism (e.g., Schwab et al., 2004), and the asthenospheric heating further weakened their crust. These factors favor the gravitational collapse in the Central and South Pamir (Rey et al., 2010). There are two fundamental modes of gravitational collapse called “fixed-boundary collapse” and “free-boundary collapse”; the “fixed-boundary collapse” mode can be classified into three types based on various behaviors of crustal deformation accommodating gravitational collapse, including “upper crustal deformation only,” “lower crustal flow only,” and “both upper crustal deformation and lower crustal flow” (Rey et al., 2001).
Two lines of evidence point to the “both upper crustal deformation and lower crustal flow” mode of gravitational collapse in the South and Central Pamir. First, the extensional exhumation of the Central and South Pamir domes was synchronous with the onset of the shortening in the forelands. The exhumation of the domes started at ∼23–20 Ma (Section 2.2), while the MPT in the north and TFTB in the west initiated at ∼25–20 Ma and >17 Ma, respectively (Sections 2.1, 3.2). Second, many observations of ductile deformation in the detachment faults bounding the domes indicate abundant partial melting of the middle–lower crust (Stübner et al., 2013a; Rutte et al., 2017b; Worthington et al., 2020). In this mode of gravitational collapse, materials from the upper crust and the lower crustal flow are transferred towards the forelands driven by the GPE, contributing to the lateral growth of the orogen (Rey et al., 2001). The upper crustal materials moving towards the forelands would cause the shortening of the forelands and the extension of the orogen, which affects the horizontal deformation of the upper crust much more than the lower crustal flow (Rey et al., 2001 and references therein). Therefore, here we focus on the effects of the movement of upper crustal materials during gravitational collapse on the kinematics of the Pamir salient.
The different fault kinematics along the frontal Pamir during this period imply that the gravity-driven upper crust tended to move towards the northern and western forelands. Within the Tajik Basin in the west, the TFTB initiated before 17 Ma and absorbed ∼6–9 mm/yr of shortening (Section 3.2). The initiation of the MPT at ∼25–20 Ma (Section 2.1) and the accelerated exhumation in the central North Pamir during ∼25–16 Ma (Amidon and Hynek, 2010) suggest the shortening in the northern foreland. During the initiation of the MPT, the shortening rate on the northern margin was low (<1–2 mm/yr, Section 5.1), consistent with the limited exhumation of the North Pamir (Sobel et al., 2013). We ascribe this low rate of shortening to the fact that the major shortening was still accommodated by crust thickening around the Central–South Pamir, as reflected by syn-extensional peak metamorphism of the Central and South Pamir domes during ∼22–19 Ma, and long-lasting prograde metamorphism of the Muztaghata Dome until ∼12 Ma (Section 2.2). However, for the Tarim Basin in the east, most (∼94–100%) of the Cenozoic shortening deformation is concentrated along its margin (Laborde et al., 2019). Moreover, the KYTS, as the boundary fault between the Pamir and Tarim Basin, was transformed from thrusting to major dextral slip at ∼25–18 Ma (Cowgill, 2010; Bosboom et al., 2014). This means that few materials from the upper crust were transferred into the eastern foreland. From the extension in the interior of the Pamir, the scheme is consistent with the dominant N–S extension accompanying a dextral shear component of shear zones bounding the Central and South Pamir domes (Stübner et al., 2013a; Rutte et al., 2017b), and also matches the asymmetric distribution and arcuate shape of these domes (Figure 1B).
The strength of the surrounding upper crust controls the movement of the gravity-driven upper crust (Rey et al., 2001). The crustal materials will be stopped or forced in another direction if the GPE fails to overcome the compressive strength of the surrounding upper crust. This can explain why the collapsed upper crust in the Pamir tended to move northward and westward. The cratonic Tarim Basin is a rigid block with high compressive strength, which would hinder the orogenic expansion. In contrast, the upper crust of the northern foreland and Tajik Basin is relatively weak, thus favoring the foreland-ward movement of crustal materials. In particular, the Tajik Basin has a weak, upper Jurassic evaporite detachment layer (e.g., Gągała et al., 2020).
The asymmetric foreland-ward movement of the upper crust during the gravitational collapse could have transformed the kinematics of the Pamir salient after ∼23 Ma. The northward and westward movement of the upper crust sustained and may have strengthened the radial thrusting in the western and northern Pamir (Figure 9B), causing the continued rotation within the Tajik Basin (e.g., Thomas et al., 1994). The gravity-driven upper crust that was forced to move northward along the eastern boundary (Figure 9B), together with the overall northward movement of the Pamir salient, may have caused the decoupling of the eastern Pamir from the Tarim Basin. This decoupling, therefore, led to the tectonic transformation from radial thrusting to dextral-slip faulting along the eastern margin of the Pamir. Therefore, the rotation along the eastern flank of the Pamir mostly ceased at ∼24 Ma (Bosboom et al., 2014), but a major dextral-slip fault system (KYTS) developed at 25–18 Ma (see Section 3.5).
After the breakoff of the Indian continental lithosphere during ∼25–20 Ma, the western passive margin of India (Marginal India) was separated from Cratonic India and has been subducting under the Hindu Kush, while the cratonic Indian lithosphere (Cratonic India) switched from subduction to underthrusting (Kufner et al., 2016; Kufner et al., 2018). At ∼12–11 Ma, the cratonic Indian lithosphere collided with the Pamir slab (Kufner et al., 2016), i.e., the Pamir and Tajik lithospheres (Figure 9C).
Geodynamic modeling shows that the underthrusting Indian lithosphere would impose basal shear on the overlying plate, resulting in two stress regimes: 1) extension above the underthrusting Indian lithosphere due to the counteraction between basal shear and horizontal compression, and 2) additional compression from basal shear in front of the underthrusting edge (e.g., Liu and Yang, 2003; Copley et al., 2011). For the Pamir, the two regimes were interpreted to have sustained the exhumation of domes (i.e., gravitational collapse) until ∼4–2 Ma in the underthrusted South Pamir and terminated the dome exhumation at ∼12 Ma in the non-underthrusted Central Pamir (Worthington et al., 2020). This deformation pattern is also well illustrated by the GPS velocity field (Figure 3), which shows ∼ N–S extension in the South Pamir and distinct shortening north of the Central Pamir (Figure 5). Considering the current position of the underthrusting Indian lithosphere beneath the Central Pamir (see Section 2.3), we suggest that the effects of basal shear on the Pamir are subsistent. Due to the irregular curved shape of the underthrusting Indian promontory (Bloch et al., 2021), the northward compression resulting from basal shear was decomposed into asymmetric radial compressive stresses perpendicular to the underthrusting edge (Figures 9C,D). The radial compressive stresses replaced the diminished gravitational collapse as the main driving force, facilitating the foreland-ward expansion of the Pamir salient after ∼12 Ma.
The present divergent interaction of the Indian lithosphere with the foreland lithospheres beneath the Pamir (see Section 2.3) indicates an asymmetric kinematic model of the expansion. On the one hand, under the western and central Pamir, the Pamir slab exhibits westward and northward delamination and rollback forced by the Indian lithosphere’s underthrusting. This suggests that driven by radial compressive stresses, the Pamir salient has been spreading towards the forelands in these two directions. Therefore, the shortening rates of the TFTB and northern margin significantly increased from ∼12 Ma and the Middle Miocene, respectively (Section 5.1). On the other hand, under the eastern margin of the Pamir, the Pamir slab has been overturned and is sandwiched between the Indian and Tarim mantle lithospheres. Moreover, the Moho offset was observed under the PFT in the northeastern Pamir, suggesting pure shear shortening of the Pamir crust (Xu Q. et al., 2021). These two observations imply the “hard” collision between the Pamir and the rigid Tarim lithospheres. The compressive stresses insufficient to deform the Tarim may have been transformed in two ways. One is the thickening of the crust in the northeastern Pamir. The Muztaghata Dome thus experienced the first rapid exhumation during ∼12–8 Ma due to the gravitational imbalance of the new thickened crust (Cai et al., 2017). Then, the compressive stress and the gravity-driven crustal materials from the N–S extension of the Muztaghata Dome thickened the crust around the Kongur Shan region, leading to the peak metamorphism of the Kongur Shan Dome at ∼9 Ma (Section 2.2). The other is that the compressive stresses may have been transferred to the central Tien Shan through the Tarim block. This not only contributed to the intense mountain-building events throughout the central Tien Shan during the Middle–Late Miocene (e.g., Glorie et al., 2011; Jia et al., 2015; Qiao et al., 2016), but also drove the basinward deformation propagation during the Middle Miocene to Pliocene, transferring the deformation front in the NE Pamir from the MPT to the PFT at ∼6–5 Ma (e.g., Thompson et al., 2015). An episode of strong thrusting-related exhumation during ∼10–6 Ma was also reported across the KYTS (Cao et al., 2013a). Therefore, in this context, the Tarim Basin might have coupled with the Pamir and began to move northward after ∼10 Ma, causing the strike-slip deceleration of the KYTS (Sobel et al., 2011).
In summary, the kinematic model of the Pamir salient since the ∼12 Ma shifted from the radial thrusting and dextral transfer faulting model during ∼23–12 Ma to another asymmetric model due to the change in the driving mechanism. The asymmetric model is discussed below.
Present-day crustal deformation of the Pamir constrained by the GPS and seismic strain rate, and earthquake focal stress suggests an asymmetric radial thrusting model of the Pamir salient (Pan et al., 2020). Moreover, the multi-timescale fault kinematics of the Pamir salient support that asymmetric radial thrusting has been the dominant kinematic model of the Pamir salient from ∼12 Ma until the present. This model is represented by the anticlockwise rotation of symmetric radial thrusting (Ge et al., 2022).
Firstly, the fault kinematics along the frontal Pamir salient may have remained stable since the Middle–Late Miocene. In Section 5.1, existing studies indicate that the TFTB since ∼12 Ma, eastern PFT, and KSES since their initiation at ∼6–5 Ma have maintained relatively constant deformation rates. Deformation in the northern margin (i.e., the PTS) also resumed in the Middle Miocene (Coutand et al., 2002), but the initial deformation rate might be much smaller than those on the millennial and decadal timescales. This is because the out-of-sequence thrusting and dextral wrenching were also reactivated within the Central and southeastern Pamir during ∼12–10 Ma (Rutte et al., 2017a; Rutte et al., 2017b). This suggests that the deformation was not concentrated in the northern margin during the early foreland-ward expansion of the Pamir. As the ongoing northward advance of the Indian plate, the deformation has been concentrated in the northern margin with consistent rates on both the millennial and decadal timescales (Section 5.1). For the N–S shortening, if the rate is calculated using the total shortening throughout the Pamir (similar to the TFTB using the shortening throughout the Tajik Basin), which is equal to the amount of the delaminated Pamir crust (∼150 km, Sippl et al., 2013a), the average rate would be ∼12–13 mm/yr since ∼12 Ma, consistent with the millennial and decadal rates of 10–15 mm/yr (Section 5.1). For the dextral slip component, despite the lack of an equivalent to determine the total magnitude of slip, the result may be similar to that of shortening because these two deformations have been governed by the same geodynamic process. Therefore, the deformation in the Pamir north of the underthrusting edge since ∼12 Ma can be considered as steady. As for the strike-slip fault, the DF in the western flank has had a steady slip rate since the Late Quaternary, but the million-year rate is devoid. Based on the ∼100 km left-lateral offset of the Panj River since ∼10 Ma (see Section 2.1), we speculate that the DF became active before ∼10 Ma, and the average slip rate is calculated to be ∼10 mm/yr, consistent with the rate of 10–15 mm/yr since the Late Quaternary (Section 5.1). The dextral slip of the KYTS in the eastern flank decelerated to ∼2–4 mm/yr at least by ∼5–3 Ma (Section 5.1). As stated inSection 5.2.3, the deceleration may have started after ∼10 Ma and was caused by the coupling of the Pamir and Tarim forced by the radial compressive stress since ∼12 Ma. Therefore, the slip of the KYTS has been steady since the Middle–Late Miocene.
Secondly, along the Pamir front, the shortening rates decrease bilaterally, from the northwestern margin rather than the northern margin. The shortening rates of the TFTB in the west decrease southward from 16 mm/yr to 8 mm/yr, while the rates of the PTS in the north decrease eastward from 10 to 15 mm/yr in the northern margin to 4–7 mm/yr in the northeastern margin (Figure 8C). In the northwestern margin between the TFTB and PTS, the sinistral slip of the DF was partly transformed into thrusting (see Section 5.1). Although the shortening rate of the DF is unknown, the shortening rate of the Vakhsh Fault (Figure 1B) is 13–19 mm/yr (Metzger et al., 2020), implying that the summit of the rate is in the northwestern margin. In summary, the asymmetric distribution of the shortening rates indicates the anticlockwise rotation of radial thrusting.
Thirdly, the sinistral slip along the western flank and the dextral slip along the northern and eastern flank denote that the Pamir salient that moves northward en bloc has been accompanied by a counterclockwise rotation, as also reflected in the GPS data (Figure 3, and see Section 4.1). The GPS velocity vectors display a radial asymmetry that rotates anticlockwise. The rotation pole is located west of the Pamir (Zhou et al., 2016), thus the strike-slip motion along the Pamir front should become weaker as it is away from the pole, which is consistent with the anticlockwise decreasing trend of the strike-slip rates (see Section 5.1).
Finally, the KSES, as the large and active E–W extensional fault system within the Pamir, exhibits a decrease from north to south in its E–W extension rate (see Section 5.1), matching the prediction of the radial thrusting (see Section 1). However, the fact that no counterpart of the KSES exists in the western Pamir suggests that the radial thrusting is asymmetric. The anticlockwise radial thrusting would form larger E–W extension stress diminishing from north to south in the northeastern Pamir (Figure 9C). The extension stress may have induced the gravitational collapse of the thickened crust in the northeastern Pamir, forming the KSES at ∼6–5 Ma (Figure 9D) (Cao et al., 2013a; Cheng et al., 2016; Chen and Chen, 2020).
The above four lines of evidence from fault and crustal kinematics suggest that anticlockwise radial thrusting has been driving the foreland-ward expansion of the Pamir salient since ∼12 Ma. In addition to the foreland-ward expansion mode, observations from the GPS velocity analysis and modern seismicity may imply the migration of the extension within the Pamir.
The GPS velocity profile C–C’ shows that the E–W extension rate of 5 ± 1 mm/yr in the central South Pamir is larger than that of the southern KSES (Figure 6). Modern seismicity also indicates that N–S striking normal-fault earthquakes cluster in the same area of the South Pamir and spread roughly in the N–S direction, whereas the main E–W extensional structures in the northern and northeastern Pamir, such as KG and KSES, show low seismicity (Figure 7, and see Section 4.2). These both indicate the stronger E–W extension in the central South Pamir, but it is unreasonable under anticlockwise radial thrusting where the E–W extension in the east is stronger than that in the west.
Two events could have caused the stronger E-W extension in the central South Pamir: 1) the westward gravitational collapse in the South Pamir (e.g., Schurr et al., 2014; Rutte et al., 2017a; Rutte et al., 2017b); and 2) the westward rollback of the Pamir slab (Section 2.3). The average exhumation rate of the South Pamir domes was ∼1–3 mm/yr, consistent with ∼2–4 mm/yr of E–W extension based on the geometry of faults bounding the domes (Stübner et al., 2013a; Stübner et al., 2013b; Worthington et al., 2020). The figure is smaller than the present rate of 5 ± 1 mm/yr and the dome exhumation ceased at ∼2 Ma (Stübner et al., 2013b; Worthington et al., 2020). Therefore, the westward gravitational collapse in the South Pamir might have partly contributed to the E–W extension in the South Pamir before its cessation, but could not enhance the present E–W extension. The slab’s rollback would result in the extension parallel to the rollback direction within the area above the slab. The arcuate Pamir slab is now beneath the western South Pamir and the Central Pamir (see Section 2.3), thus the rollback of the slab can affect the central South Pamir, causing the stronger E-W extension. The ongoing westward rollback of the Pamir slab since ∼12 Ma may have produced the migratory tensile stress from east to west in the South Pamir, migrating the E–W extension in the same direction (Figure 9D). Moreover, except for the extension resulting from the basal shear of the underthrusting Indian lithosphere, the northward rollback of the Pamir slab is likely to have contributed to the current N–S extension in the South Pamir (Figure 5).
We used previously published multi-timescale deformation rates of the main structures, re-analyses of the GPS velocity and seismicity data, and existing deep structure and tectonic background, to interpret the kinematics and geodynamics of the Pamir salient since the Middle Cenozoic. From our analysis of the deformation rates along the frontal Pamir salient at million-year, millennial, and decadal timescales, we observed two deformation stages since the Late Oligocene–Early Miocene, which correspond to two transformations of the geodynamic processes, respectively. The kinematics since the second stage starting in the Middle Miocene was enhanced and has remained steady, which is consistent with the present-day deformation pattern revealed by the GPS velocity and seismicity. Based on these observations and inferences, we established multistage kinematic models for the foreland-ward expansion of the Pamir salient since the Middle Cenozoic and explore the underlying geodynamic processes and their potential causal mechanisms. The Middle–Late Cenozoic tectonic evolution can be divided into three stages.
1) ∼37–24 Ma: The subduction of the buoyant Indian plate continued northward indenting the Pamir after the breakoff of the oceanic lithosphere at ∼45 Ma, causing intense crustal shortening and thickening, and northward movement of the Pamir salient. The Pamir salient moved northward via radial thrusting to propagate deformation into the forelands.
2) ∼23–12 Ma: The breakoff of the Indian continental lithosphere during ∼25–20 Ma induced the gravitational collapse in the Central and South Pamir. The collapsed upper crust driving the orogenic expansion tended to move westward and northward, due to the different strengths of the Pamir’s forelands. The kinematic model of the Pamir salient thus was transformed into the radial thrusting and dextral transfer faulting model.
3) ∼12 Ma–present: After the collision between the underthrusting Indian lithosphere and the Pamir slab at ∼12–11 Ma, the basal shear and Pamir slab’s rollback forced by the underthrusting Indian lithosphere began to govern the deformation of the Pamir salient. The kinematic model of the Pamir salient was transformed into the anticlockwise radial thrusting model, due to the asymmetric radial compression induced by the basal shear and the irregularly shaped Indian promontory, as well as the resistant Tarim block in the east. The extension resulting from the lithospheric basal shear and northward rollback of the Pamir slab have caused the N–S extension within the South Pamir. Meanwhile, the westward rollback of the Pamir slab may dominate a westward migration of the E–W extension within the Pamir.
XS and JG conceived the study. JG, XS, and HC wrote the manuscript. WG helped reanalyze the GPS data. All authors discussed, commented and edited the manuscript.
This work was supported by projects funded by National Natural Science Foundation of China (41720104003, 51988101, 41941016, 41972227), the Second Tibetan Plateau Scientific Expedition and Research Grant (2019QZKK0708) and the Fundamental Research Funds for the Central Universities (2021XZZX005), the Qianjiang Talent Funds of Zhejiang Province (QJD190202) and the 100 Talents Program of Zhejiang University.
We thank Dr. Xin Wang for discussing the focal mechanisms. We are grateful to the reviewers for their constructive comments and suggestions, and the editors and the Frontiers editorial team for handling this manuscript.
The authors declare that the research was conducted in the absence of any commercial or financial relationships that could be construed as a potential conflict of interest.
All claims expressed in this article are solely those of the authors and do not necessarily represent those of their affiliated organizations, or those of the publisher, the editors and the reviewers. Any product that may be evaluated in this article, or claim that may be made by its manufacturer, is not guaranteed or endorsed by the publisher.
The Supplementary Material for this article can be found online at: https://www.frontiersin.org/articles/10.3389/feart.2022.967529/full#supplementary-material
Abdulhameed, S., Ratschbacher, L., Jonckheere, R., Gągała, Ł., Enkelmann, E., Käßner, A., et al. (2020). Tajik Basin and southwestern tian Shan, northwestern India-Asia collision zone: 2. Timing of basin inversion, tian Shan mountain building, and relation to pamir-plateau advance and deep India-Asia indentation. Tectonics 39, e2019TC005873. doi:10.1029/2019TC005873
Altamimi, Z., Métivier, L., and Collilieux, X. (2012). ITRF2008 plate motion model. J. Geophys. Res. 117, B07402. doi:10.1029/2011jb008930
Amidon, W. H., and Hynek, S. A. (2010). Exhumational history of the north central Pamir. Tectonics 29, TC5017. doi:10.1029/2009TC002589
Arnaud, N., Brunel, M., Cantagrel, J., and Tapponnier, P. (1993). High cooling and denudation rates at Kongur Shan, eastern Pamir (Xinjiang, China) revealed by 40Ar/39Ar alkali feldspar thermochronology. Tectonics 12, 1335–1346. doi:10.1029/93TC00767
Arrowsmith, J. R., and Strecker, M. R. (1999). Seismotectonic range-front segmentation and mountain-belt growth in the Pamir-Alai region, Kyrgyzstan (India-Eurasia collision zone). Geol. Soc. Am. Bull. 111, 1665–1683. doi:10.1130/0016-7606(1999)111<1665:SRFSAM>2.3.CO;2
Bershaw, J., Garzione, C. N., Schoenbohm, L., Gehrels, G., and Tao, L. (2012). Cenozoic evolution of the Pamir plateau based on stratigraphy, zircon provenance, and stable isotopes of foreland basin sediments at Oytag (Wuyitake) in the Tarim Basin (west China). J. Asian Earth Sci. 44, 136–148. doi:10.1016/j.jseaes.2011.04.020
Blayney, T., Dupont-Nivet, G., Najman, Y., Proust, J.-N., Meijer, N., Roperch, P., et al. (2019). Tectonic evolution of the Pamir recorded in the western Tarim Basin (China): Sedimentologic and magnetostratigraphic analyses of the Aertashi section. Tectonics 38, 492–515. doi:10.1029/2018tc005146
Blayney, T., Najman, Y., Dupont-Nivet, G., Carter, A., Millar, I., Garzanti, E., et al. (2016). Indentation of the Pamirs with respect to the northern margin of Tibet: Constraints from the Tarim basin sedimentary record. Tectonics 35, 2345–2369. doi:10.1002/2016tc004222
Bloch, W., Schurr, B., Yuan, X., Ratschbacher, L., Reuter, S., Kufner, S.-K., et al. (2021). Structure and stress field of the lithosphere between Pamir and Tarim. Geophys. Res. Lett. 48, e2021GL095413. doi:10.1029/2021gl095413
Bosboom, R., Dupont-Nivet, G., Huang, W., Yang, W., and Guo, Z. (2014). Oligocene clockwise rotations along the eastern Pamir: Tectonic and paleogeographic implications. Tectonics 33, 53–66. doi:10.1002/2013tc003388
Bourgeois, O., Cobbold, P. R., Rouby, D., Thomas, J.-C., and Shein, V. (1997). Least squares restoration of Tertiary thrust sheets in map view, Tajik depression, central Asia. J. Geophys. Res. 102, 27553–27573. doi:10.1029/97jb02477
Brookfield, M. E. (2008). Evolution of the great river systems of southern Asia during the Cenozoic India–Asia collision: Rivers draining north from the Pamir syntaxis. Geomorphology 100, 296–311. doi:10.1016/j.geomorph.2008.01.003
Brunel, M., Arnaud, N., Tapponnier, P., Pan, Y., and Wang, Y. (1994). Kongur Shan normal fault: Type example of mountain building assisted by extension (Karakoram fault, eastern Pamir). Geol. 22, 707–710. doi:10.1130/0091-7613(1994)022<0707:KSNFTE>2.3.CO;2
Bufe, A., Bekaert, D. P. S., Hussain, E., Bookhagen, B., Burbank, D. W., Thompson Jobe, J. A., et al. (2017). Temporal changes in rock uplift rates of folds in the foreland of the Tian Shan and the Pamir from geodetic and geologic data. Geophys. Res. Lett. 44, 10977–10987. doi:10.1002/2017gl073627
Burtman, V. S. (2000). Cenozoic crustal shortening between the Pamir and tien Shan and a reconstruction of the pamir–tien Shan transition zone for the cretaceous and palaeogene. Tectonophysics 319, 69–92. doi:10.1016/S0040-1951(00)00022-6
Burtman, V. S., and Molnar, P. H. (1993). “Geological and geophysical evidence for deep subduction of continental crust beneath the Pamir” in Geological society of America special papers (Boulder, Colorado: Geological Society of America), 1–76. doi:10.1130/SPE281-p1
Cai, Z., Xu, Z., Cao, H., Robinson, A. C., Li, G., and Xu, X. (2017). Miocene exhumation of northeast Pamir: Deformation and geo/thermochronological evidence from western Muztaghata shear zone and Kuke ductile shear zone. J. Struct. Geol. 102, 130–146. doi:10.1016/j.jsg.2017.07.010
Cao, K., Bernet, M., Wang, G.-C., van der Beek, P., Wang, A., Zhang, K.-X., et al. (2013a). Focused pliocene-quaternary exhumation of the eastern Pamir domes, western China. Earth Planet. Sci. Lett. 363, 16–26. doi:10.1016/j.epsl.2012.12.023
Cao, K., Wang, G.-C., van der Beek, P., Bernet, M., and Zhang, K.-X. (2013b). Cenozoic thermo-tectonic evolution of the northeastern Pamir revealed by zircon and apatite fission-track thermochronology. Tectonophysics 589, 17–32. doi:10.1016/j.tecto.2012.12.038
Chapman, J. B., Carrapa, B., Ballato, P., DeCelles, P. G., Worthington, J., Oimahmadov, I., et al. (2017). Intracontinental subduction beneath the Pamir Mountains: Constraints from thermokinematic modeling of shortening in the Tajik fold-and-thrust belt. Geol. Soc. Am. Bull. 129, 1450–1471. doi:10.1130/b31730.1
Chen, H., Yang, S., Picotti, V., Cheng, X., Lin, X., and Li, K. (2021). The late cenozoic expansion of the northeastern Pamir: Insights from the stratigraphic architecture of the wupoer piggyback basin. J. Asian Earth Sci. 232, 105012. doi:10.1016/j.jseaes.2021.105012
Chen, J., Li, T., Li, W., and Yuan, Z. (2011). Late Cenozoic and present tectonic deformation in the Pamir salient, northwestern China. Seismol. Geol. 33, 241–259. (in Chinese with English abstract). doi:10.3969/j.issn.0253-4967.2011.02.001
Chen, S., and Chen, H. (2020). Late cenozoic activity of the tashkurgan normal fault and implications for the origin of the Kongur Shan extensional system, eastern Pamir. J. Earth Sci. 31, 723–734. doi:10.1007/s12583-020-1282-1
Chen, X., Chen, H., Lin, X., Cheng, X., Yang, R., Ding, W., et al. (2018). Arcuate Pamir in the paleogene? Insights from a review of stratigraphy and sedimentology of the basin fills in the foreland of NE Chinese Pamir, western Tarim Basin. Earth. Sci. Rev. 180, 1–16. doi:10.1016/j.earscirev.2018.03.003
Chen, X., Chen, H., Sobel, E. R., Lin, X., Cheng, X., Yan, J., et al. (2019). Convergence of the Pamir and the south tian Shan in the late cenozoic: Insights from provenance analysis in the wuheshalu section at the convergence area. Lithosphere 11, 507–523. doi:10.1130/l1028.1
Cheng, X., Chen, H., Lin, X., Yang, S., Chen, S., Zhang, F., et al. (2016). Deformation geometry and timing of the Wupoer thrust belt in the NE Pamir and its tectonic implications. Front. Earth Sci. 10, 751–760. doi:10.1007/s11707-016-0606-z
Chevalier, M.-L., Li, H., Pan, J., Pei, J., Wu, F., Xu, W., et al. (2011). Fast slip-rate along the northern end of the Karakorum fault system, western Tibet. Geophys. Res. Lett. 38, L22309. doi:10.1029/2011gl049921
Chevalier, M.-L., Pan, J., Li, H., Liu, D., and Wang, M. (2015). Quantification of both normal and right-lateral late Quaternary activity along the Kongur Shan extensional system, Chinese Pamir. Terra 27, 379–391. doi:10.1111/ter.12170
Copley, A., Avouac, J.-P., and Wernicke, B. P. (2011). Evidence for mechanical coupling and strong Indian lower crust beneath southern Tibet. Nature 472, 79–81. doi:10.1038/nature09926
Coutand, I., Strecker, M. R., Arrowsmith, J. R., Hilley, G., Thiede, R. C., Korjenkov, A., et al. (2002). Late Cenozoic tectonic development of the intramontane Alai Valley, (Pamir-Tien Shan region, central Asia): An example of intracontinental deformation due to the Indo-Eurasia collision. Tectonics 21, 3-1–3-19. doi:10.1029/2002tc001358
Cowgill, E. (2010). Cenozoic right-slip faulting along the eastern margin of the Pamir salient, northwestern China. Geol. Soc. Am. Bull. 122, 145–161. doi:10.1130/b26520.1
DeCelles, P. G., Kapp, P., Quade, J., and Gehrels, G. E. (2011). Oligocene–Miocene Kailas basin, southwestern Tibet: Record of postcollisional upper-plate extension in the Indus-Yarlung suture zone. Geol. Soc. Am. Bull. 123, 1337–1362. doi:10.1130/b30258.1
Deng, J., Han, F., Li, T., Zhang, B., Xu, J., and Yao, Y. (2020). Late-Quaternary slip sense and rate of the Muji fault, northeastern Pamir. Quat. Sci. 40, 114–123. (in Chinese with English abstract). doi:10.11928/j.issn.1001-7410.2020.01.11
Fan, G., Ni, J. F., and Wallace, T. C. (1994). Active tectonics of the pamirs and karakorum. J. Geophys. Res. 99, 7131–7160. doi:10.1029/93jb02970
Fu, B., Ninomiya, Y., and Guo, J. (2010). Slip partitioning in the northeast Pamir–Tian Shan convergence zone. Tectonophysics 483, 344–364. doi:10.1016/j.tecto.2009.11.003
Gągała, Ł., Ratschbacher, L., Ringenbach, J.-C., Kufner, S. K., Schurr, B., Dedow, R., et al. (2020). Tajik Basin and southwestern tian Shan, northwestern India-Asia collision zone: 1. Structure, kinematics, and salt-tectonics in the Tajik Fold-and-thrust belt of the western foreland of the Pamir. Tectonics 39, e2019TC005871. doi:10.1029/2019TC005871
Ge, J., Shi, X., Chen, H., Lin, X., Yang, R., Wei, X., et al. (2022). Asymmetric radial thrusting of the Pamir Salient since the Late Quaternary: Implications from the spatio-temporal varations in deformation rates. Quat. Sci. 42, 673–691. (in Chinese with English abstract). doi:10.11928/j.issn.1001-7410.2022.03.05
Glorie, S., De Grave, J., Buslov, M. M., Zhimulev, F. I., Stockli, D. F., Batalev, V. Y., et al. (2011). Tectonic history of the Kyrgyz South Tien Shan (Atbashi-Inylchek) suture zone: The role of inherited structures during deformation-propagation. Tectonics 30, TC6016. doi:10.1029/2011tc002949
Hacker, B. R., Ratschbacher, L., Rutte, D., Stearns, M. A., Malz, N., Stübner, K., et al. (2017). Building the pamir-tibet plateau—crustal stacking, extensional collapse, and lateral extrusion in the Pamir: 3. Thermobarometry and petrochronology of deep asian crust. Tectonics 36, 1743–1766. doi:10.1002/2017TC004488
Herring, T. A., King, R. W., and McClusky, S. C. (2010). Introduction to GAMIT/GLOBK. Cambridge, Massachusetts: Massachusetts Institute of Technology.
Ischuk, A., Bendick, R., Rybin, A., Molnar, P., Khan, S. F., Kuzikov, S., et al. (2013). Kinematics of the Pamir and Hindu Kush regions from GPS geodesy. J. Geophys. Res. Solid Earth 118, 2408–2416. doi:10.1002/jgrb.50185
Jay, C. N., Flesch, L. M., and Bendick, R. O. (2017). Kinematics and dynamics of the Pamir, Central Asia: Quantifying surface deformation and force balance in an intracontinental subduction zone. J. Geophys. Res. Solid Earth 122, 4741–4762. doi:10.1002/2017jb014177
Jay, C. N., Flesch, L. M., and Bendick, R. O. (2018). Kinematics and dynamics of the Pamir, central Asia: Quantifying the roles of continental subduction in force balance. J. Geophys. Res. Solid Earth 123, 8161–8179. doi:10.1029/2018jb015615
Jia, Y., Fu, B., Jolivet, M., and Zheng, S. (2015). Cenozoic tectono-geomorphological growth of the SW Chinese Tian Shan: Insight from AFT and detrital zircon U–Pb data. J. Asian Earth Sci. 111, 395–413. doi:10.1016/j.jseaes.2015.06.023
Jouanne, F., Awan, A., Pêcher, A., Kausar, A., Mugnier, J. L., Khan, I., et al. (2014). Present-day deformation of northern Pakistan from salt ranges to karakorum ranges. J. Geophys. Res. Solid Earth 119, 2487–2503. doi:10.1002/2013jb010776
Kelly, S., and Beaumont, C. (2021). Balanced cross-sections and numerical modeling of the lithospheric-scale evolution of the Hindu Kush and Pamir. J. Geophys. Res. Solid Earth 126, e2020JB020678. doi:10.1029/2020jb020678
Kuchai, V., and Trifonov, V. (1977). Young left-lateral strike slip along the zone of the Darvaz-Karakul Fault. Geotekt. Mosk. 3, 91–105. (in Russian).
Kufner, S.-K., Schurr, B., Haberland, C., Zhang, Y., Saul, J., Ischuk, A., et al. (2017). Zooming into the Hindu Kush slab break-off: A rare glimpse on the terminal stage of subduction. Earth Planet. Sci. Lett. 461, 127–140. doi:10.1016/j.epsl.2016.12.043
Kufner, S.-K., Schurr, B., Ratschbacher, L., Murodkulov, S., Abdulhameed, S., Ischuk, A., et al. (2018). Seismotectonics of the Tajik Basin and surrounding mountain ranges. Tectonics 37, 2404–2424. doi:10.1029/2017tc004812
Kufner, S.-K., Schurr, B., Sippl, C., Yuan, X., Ratschbacher, L., Akbar, A. s. o. M., et al. (2016). Deep India meets deep Asia: Lithospheric indentation, delamination and break-off under Pamir and Hindu Kush (central Asia). Earth Planet. Sci. Lett. 435, 171–184. doi:10.1016/j.epsl.2015.11.046
Kufner, S. K., Kakar, N., Bezada, M., Bloch, W., Metzger, S., Yuan, X., et al. (2021). The Hindu Kush slab break-off as revealed by deep structure and crustal deformation. Nat. Commun. 12, 1685. doi:10.1038/s41467-021-21760-w
Laborde, A., Barrier, L., Simoes, M., Li, H., Coudroy, T., Van der Woerd, J., et al. (2019). Cenozoic deformation of the Tarim Basin and surrounding ranges (xinjiang, China): A regional overview. Earth. Sci. Rev. 197, 102891. doi:10.1016/j.earscirev.2019.102891
Li, J. (2012). “Kinematics of present-day deformation of the Tien Shan and adjacent regions with GPS geodesy: Implications for active tectonics and seismic hazards,” Doctoral thesis (Wuhan: China University of Geosciences), 1–132. (in Chinese).
Li, T., Chen, J., Thompson, J. A., Burbank, D. W., and Xiao, W. (2012). Equivalency of geologic and geodetic rates in contractional orogens: New insights from the Pamir Frontal Thrust. Geophys. Res. Lett. 39, L15305. doi:10.1029/2012gl051782
Li, T., Chen, J., Thompson, J. A., Burbank, D. W., and Yang, H. (2015). Hinge-migrated fold-scarp model based on an analysis of bed geometry: A study from the mingyaole anticline, southern foreland of Chinese tian Shan. J. Geophys. Res. Solid Earth 120, 6592–6613. doi:10.1002/2015jb012102
Li, T., Chen, Z., Chen, J., Thompson Jobe, J. A., Burbank, D. W., Li, Z., et al. (2019a). Along‐strike and downdip segmentation of the Pamir frontal thrust and its association with the 1985 Mw 6.9 wuqia earthquake. J. Geophys. Res. Solid Earth 124, 9890–9919. doi:10.1029/2019jb017319
Li, T., Schoenbohm, L. M., Chen, J., Yuan, Z., Feng, W., Li, W., et al. (2019b). Cumulative and coseismic (during the 2016 Mw 6.6 aketao earthquake) deformation of the dextral-slip Muji fault, northeastern Pamir orogen. Tectonics 38, 3975–3989. doi:10.1029/2019tc005680
Li, W. (2013). “Active tectonics and strong earthquakes in tashkorgan Valley, northeastern Pamir Plateau,” Doctoral thesis (Beijing: Institute of Geology, China Earthquake Administration), 1–132. (in Chinese).
Li, W., Chen, J., Yuan, Z., Huang, M., Li, T., Yu, S., et al. (2011). Coseismic surface ruptures of multi segments and seismogenic fault of the tashkorgan earthquake in Pamir, 1895. Seismol. Geol. 33, 260–276. (in Chinese with English abstract). doi:10.3969/j.issn.0253-4967.2011.02.002
Li, W., Chen, Y., Yuan, X., Schurr, B., Mechie, J., Oimahmadov, I., et al. (2018). Continental lithospheric subduction and intermediate-depth seismicity: Constraints from S-wave velocity structures in the Pamir and Hindu Kush. Earth Planet. Sci. Lett. 482, 478–489. doi:10.1016/j.epsl.2017.11.031
Li, Y.-P., Robinson, A. C., Gadoev, M., and Oimuhammadzoda, I. (2020a). Was the Pamir salient built along a Late Paleozoic embayment on the southern Asian margin? Earth Planet. Sci. Lett. 550, 116554. doi:10.1016/j.epsl.2020.116554
Li, Y.-P., Robinson, A. C., Lapen, T. J., Righter, M., and Stevens, M. K. (2020b). Muztaghata dome Miocene eclogite facies metamorphism: A record of lower crustal evolution of the NE Pamir. Tectonics 39, e2019TC005917. doi:10.1029/2019tc005917
Liang, Y., Li, L., Liao, J., and Gao, R. (2020). Interaction of the Indian and asian plates under the Pamir and hindu-kush regions: Insights from 3-D shear wave velocity and anisotropic structures. Geochem. Geophys. Geosyst. 21, e2020GC009041. doi:10.1029/2020gc009041
Lister, G., Kennett, B., Richards, S., and Forster, M. (2008). Boudinage of a stretching slablet implicated in earthquakes beneath the Hindu Kush. Nat. Geosci. 1, 196–201. doi:10.1038/ngeo132
Liu, M., and Yang, Y. (2003). Extensional collapse of the Tibetan Plateau: Results of three-dimensional finite element modeling. J. Geophys. Res. 108, 2361. doi:10.1029/2002jb002248
Lukens, C. E., Carrapa, B., Singer, B. S., and Gehrels, G. (2012). Miocene exhumation of the Pamir revealed by detrital geothermochronology of Tajik rivers. Tectonics 31, TC2014. doi:10.1029/2011tc003040
Mahéo, G., Blichert-Toft, J., Pin, C., Guillot, S., and Pêcher, A. (2009). Partial melting of mantle and crustal sources beneath south karakorum, Pakistan: Implications for the Miocene geodynamic evolution of the India–Asia convergence zone. J. Petrology 50, 427–449. doi:10.1093/petrology/egp006
Mechie, J., Schurr, B., Yuan, X., Schneider, F., Sippl, C., Minaev, V., et al. (2019). Observations of guided waves from the Pamir seismic zone provide additional evidence for the existence of subducted continental lower crust. Tectonophysics 762, 1–16. doi:10.1016/j.tecto.2019.04.007
Metzger, S., Gągała, Ł., Ratschbacher, L., Lazecký, M., Maghsoudi, Y., and Schurr, B. (2021). Tajik depression and greater Pamir neotectonics from InSAR rate maps. JGR. Solid Earth 126, e2021JB022775. doi:10.1029/2021jb022775
Metzger, S., Ischuk, A., Deng, Z., Ratschbacher, L., Perry, M., Kufner, S.-K., et al. (2020). Dense GNSS profiles across the northwestern tip of the India-Asia collision zone: Triggered slip and westward flow of the peter the first range, Pamir, into the Tajik depression. Tectonics 39, e2019TC005797. doi:10.1029/2019tc005797
Mohadjer, S., Bendick, R., Ischuk, A., Kuzikov, S., Kostuk, A., Saydullaev, U., et al. (2010). Partitioning of India-Eurasia convergence in the pamir-hindu Kush from GPS measurements. Geophys. Res. Lett. 37, L04305. doi:10.1029/2009gl041737
Molnar, P., and Stock, J. M. (2009). Slowing of India's convergence with Eurasia since 20 Ma and its implications for Tibetan mantle dynamics. Tectonics 28, TC3001. doi:10.1029/2008tc002271
Murphy, M., Yin, A., Kapp, P., Harrison, T., Ding, L., and Guo, J. (2000). Southward propagation of the Karakoram fault system, southwest Tibet: Timing and magnitude of slip. Geology 28, 451–454. doi:10.1130/0091-7613(2000)028<0451:spotkf>2.3.co;2
Negredo, A. M., Replumaz, A., Villaseñor, A., and Guillot, S. (2007). Modeling the evolution of continental subduction processes in the Pamir–Hindu Kush region. Earth Planet. Sci. Lett. 259, 212–225. doi:10.1016/j.epsl.2007.04.043
Nikonov, A. A. (1975). An analysis of tectonic movements along the Hindu Kush-Darvaz-Karakul fault zone in late Pliocene and Quaternary time. Bull. MOIP Geol. Sec 50, 5–23. (in Russian).
Nikonov, A. A. (1977). Holocene and contemporary movements of the earth’s crust (Moscow: Nauka 240). (in Russian).
Nikonov, A. A., Vakov, A. V., and Veselov, I. A. (1983). Seismotectonics and earthquakes in the convergent zone between the Pamir and the Tien Shan (Moscow: Nauka 240). (in Russian).
Pan, J., Li, H., Chevalier, M., Liu, D., Sun, Z., Pei, J., et al. (2013). Holocene slip rate along the northern Kongur Shan extensional system: Insights on the large pull-apart structure in the NE Pamir. San Francisco, California: American Geophysical Union.
Pan, Z., He, J., and Li, J. (2018). Contemporary crustal deformation within the Pamir Plateau constrained by geodetic observations and focal mechanism solutions. Pure Appl. Geophys. 175, 3463–3484. doi:10.1007/s00024-018-1872-3
Pan, Z. Y., Shao, Z. G., Zhou, Y., Wang, X., Xie, M. Y., and Yisimayili, A. (2020). Present-day crustal deformation of the Pamir constrained by the GPS strain rate, seismic strain rate and earthquake focal stress. Chin. J. Geophys. 63, 1143–1154. (in Chinese with English abstract). doi:10.6038/cjg2020N0161
Patyniak, M., Landgraf, A., Dzhumabaeva, A., Baikulov, S., Williams, A. M., Weiss, J. R., et al. (2021). The Pamir frontal thrust fault: Holocene full-segment ruptures and implications for complex segment interactions in a continental collision zone. JGR. Solid Earth 126, e2021JB022405. doi:10.1029/2021jb022405
Peng, C.-C., Kuo, B.-Y., Faccenda, M., and Chiao, L.-Y. (2020). Mantle flow entrained by the Hindu Kush continental subduction inferred from source-side seismic anisotropy. Earth Planet. Sci. Lett. 530, 115905. doi:10.1016/j.epsl.2019.115905
Qiao, Q., Huang, B., Piper, J. D. A., Deng, T., and Liu, C. (2016). Neogene magnetostratigraphy and rock magnetic study of the kashi depression, NW China: Implications to neotectonics in the SW tianshan mountains. J. Geophys. Res. Solid Earth 121, 1280–1296. doi:10.1002/2015jb012687
Ratschbacher, L., Frisch, W., Liu, G., and Chen, C. (1994). Distributed deformation in southern and western Tibet during and after the India-Asia collision. J. Geophys. Res. 99, 19917–19945. doi:10.1029/94JB00932
Replumaz, A., Negredo, A. M., Villaseñor, A., and Guillot, S. (2010). Indian continental subduction and slab break-off during Tertiary collision. Terra 22, 290–296. doi:10.1111/j.1365-3121.2010.00945.x
Rey, P. F., Teyssier, C., and Whitney, D. L. (2010). Limit of channel flow in orogenic plateaux. Lithosphere 2, 328–332. doi:10.1130/l114.1
Rey, P., Vanderhaeghe, O., and Teyssier, C. (2001). Gravitational collapse of the continental crust: Definition, regimes and modes. Tectonophysics 342, 435–449. doi:10.1016/S0040-1951(01)00174-3
Robinson, A. C., Ducea, M., and Lapen, T. J. (2012). Detrital zircon and isotopic constraints on the crustal architecture and tectonic evolution of the northeastern Pamir. Tectonics 31, TC2016. doi:10.1029/2011tc003013
Robinson, A. C., Yin, A., and Lovera, O. M. (2010). The role of footwall deformation and denudation in controlling cooling age patterns of detachment systems: An application to the Kongur Shan extensional system in the Eastern Pamir, China. Tectonophysics 496, 28–43. doi:10.1016/j.tecto.2010.10.003
Robinson, A. C., Yin, A., Manning, C. E., Harrison, T. M., Zhang, S.-H., and Wang, X.-F. (2007). Cenozoic evolution of the eastern Pamir: Implications for strain-accommodation mechanisms at the western end of the Himalayan-Tibetan orogen. Geol. Soc. Am. Bull. 119, 882–896. doi:10.1130/b25981.1
Robinson, A. C., Yin, A., Manning, C. E., Harrison, T. M., Zhang, S.-H., and Wang, X.-F. (2004). Tectonic evolution of the northeastern Pamir: Constraints from the northern portion of the Cenozoic Kongur Shan extensional system, western China. Geol. Soc. Am. Bull. 116, 953–973. doi:10.1130/b25375.1
Rutte, D., Ratschbacher, L., Khan, J., Stübner, K., Hacker, B. R., Stearns, M. A., et al. (2017a). Building the Pamir-Tibetan plateau—crustal stacking, extensional collapse, and lateral extrusion in the central Pamir: 2. Timing and rates. Tectonics 36, 385–419. doi:10.1002/2016tc004294
Rutte, D., Ratschbacher, L., Schneider, S., Stübner, K., Stearns, M. A., Gulzar, M. A., et al. (2017b). Building the Pamir-Tibetan plateau—crustal stacking, extensional collapse, and lateral extrusion in the central Pamir: 1. Geometry and kinematics. Tectonics 36, 342–384. doi:10.1002/2016tc004293
Schmidt, J., Hacker, B. R., Ratschbacher, L., Stübner, K., Stearns, M., Kylander-Clark, A., et al. (2011). Cenozoic deep crust in the Pamir. Earth Planet. Sci. Lett. 312, 411–421. doi:10.1016/j.epsl.2011.10.034
Schneider, F. M., Yuan, X., Schurr, B., Mechie, J., Sippl, C., Haberland, C., et al. (2013). Seismic imaging of subducting continental lower crust beneath the Pamir. Earth Planet. Sci. Lett. 375, 101–112. doi:10.1016/j.epsl.2013.05.015
Schneider, F. M., Yuan, X., Schurr, B., Mechie, J., Sippl, C., Kufner, S.-K., et al. (2019). The crust in the Pamir: Insights from receiver functions. J. Geophys. Res. Solid Earth 124, 9313–9331. doi:10.1029/2019jb017765
Schurr, B., Ratschbacher, L., Sippl, C., Gloaguen, R., Yuan, X., and Mechie, J. (2014). Seismotectonics of the Pamir. Tectonics 33, 1501–1518. doi:10.1002/2014tc003576
Schwab, M., Ratschbacher, L., Siebel, W., McWilliams, M., Minaev, V., Lutkov, V., et al. (2004). Assembly of the Pamirs: Age and origin of magmatic belts from the southern Tien Shan to the southern Pamirs and their relation to Tibet. Tectonics 23, TC4002. doi:10.1029/2003tc001583
Sippl, C., Schurr, B., Tympel, J., Angiboust, S., Mechie, J., Yuan, X., et al. (2013a). Deep burial of Asian continental crust beneath the Pamir imaged with local earthquake tomography. Earth Planet. Sci. Lett. 384, 165–177. doi:10.1016/j.epsl.2013.10.013
Sippl, C., Schurr, B., Yuan, X., Mechie, J., Schneider, F. M., Gadoev, M., et al. (2013b). Geometry of the Pamir-Hindu Kush intermediate-depth earthquake zone from local seismic data. JGR. Solid Earth 118, 1438–1457. doi:10.1002/jgrb.50128
Smit, M. A., Ratschbacher, L., Kooijman, E., and Stearns, M. A. (2014). Early evolution of the Pamir deep crust from Lu-Hf and U-Pb geochronology and garnet thermometry. Geology 42, 1047–1050. doi:10.1130/g35878.1
Sobel, E. R., Chen, J., Schoenbohm, L. M., Thiede, R., Stockli, D. F., Sudo, M., et al. (2013). Oceanic-style subduction controls late Cenozoic deformation of the Northern Pamir orogen. Earth Planet. Sci. Lett. 363, 204–218. doi:10.1016/j.epsl.2012.12.009
Sobel, E. R., and Dumitru, T. A. (1997). Thrusting and exhumation around the margins of the western Tarim basin during the India-Asia collision. J. Geophys. Res. 102, 5043–5063. doi:10.1029/96jb03267
Sobel, E. R., Schoenbohm, L. M., Chen, J., Thiede, R., Stockli, D. F., Sudo, M., et al. (2011). Late miocene–pliocene deceleration of dextral slip between Pamir and Tarim: Implications for Pamir orogenesis. Earth Planet. Sci. Lett. 304, 369–378. doi:10.1016/j.epsl.2011.02.012
Stearns, M. A., Hacker, B. R., Ratschbacher, L., Lee, J., Cottle, J. M., and Kylander-Clark, A. (2013). Synchronous Oligocene-Miocene metamorphism of the Pamir and the north Himalaya driven by plate-scale dynamics. Geology 41, 1071–1074. doi:10.1130/g34451.1
Stearns, M. A., Hacker, B. R., Ratschbacher, L., Rutte, D., and Kylander-Clark, A. R. C. (2015). Titanite petrochronology of the Pamir gneiss domes: Implications for middle to deep crust exhumation and titanite closure to Pb and Zr diffusion. Tectonics 34, 784–802. doi:10.1002/2014tc003774
Strecker, M. R., Frisch, W., Hamburger, M. W., Ratschbacher, L., Semiletkin, S., Zamoruyev, A., et al. (1995). Quaternary deformation in the eastern Pamirs, Tadzhikistan and Kyrgyzstan. Tectonics 14, 1061–1079. doi:10.1029/95TC00927
Stübner, K., Ratschbacher, L., Rutte, D., Stanek, K., Minaev, V., Wiesinger, M., et al. (2013a). The giant Shakhdara migmatitic gneiss dome, Pamir, India-Asia collision zone: 1. Geometry and kinematics. Tectonics 32, 948–979. doi:10.1002/tect.20057
Stübner, K., Ratschbacher, L., Weise, C., Chow, J., Hofmann, J., Khan, J., et al. (2013b). The giant Shakhdara migmatitic gneiss dome, Pamir, India-Asia collision zone: 2. Timing of dome formation. Tectonics 32, 1404–1431. doi:10.1002/tect.20059
Thiede, R. C., Sobel, E. R., Chen, J., Schoenbohm, L. M., Stockli, D. F., Sudo, M., et al. (2013). Late Cenozoic extension and crustal doming in the India-Eurasia collision zone: New thermochronologic constraints from the NE Chinese Pamir. Tectonics 32, 763–779. doi:10.1002/tect.20050
Thomas, J. C., Chauvin, A., Gapais, D., Bazhenov, M. L., Perroud, H., Cobbold, P. R., et al. (1994). Paleomagnetic evidence for cenozoic block rotations in the tadjik depression (central Asia). J. Geophys. Res. 99, 15141–15160. doi:10.1029/94jb00901
Thompson, J. A., Burbank, D. W., Li, T., Chen, J., and Bookhagen, B. (2015). Late Miocene northward propagation of the northeast Pamir thrust system, northwest China. Tectonics 34, 510–534. doi:10.1002/2014tc003690
Thompson, J. A., Chen, J., Yang, H., Li, T., Bookhagen, B., and Burbank, D. (2018). Coarse- versus fine-grain quartz OSL and cosmogenic 10 Be dating of deformed fluvial terraces on the northeast Pamir margin, northwest China. Quat. Geochronol. 46, 1–15. doi:10.1016/j.quageo.2018.01.002
Thompson, J. A., Li, T., Chen, J., Burbank, D. W., and Bufe, A. (2017). Quaternary tectonic evolution of the Pamir-Tian Shan convergence zone, Northwest China. Tectonics 36, 2748–2776. doi:10.1002/2017tc004541
Trifonov, V. G. (1978). Late Quaternary tectonic movements of western and central Asia. Geol. Soc. Am. Bull. 89, 1059–1072. doi:10.1130/0016-7606(1978)89<1059:LQTMOW>2.0.CO;2
Wang, M., and Shen, Z.-K. (2020). Present-day crustal deformation of continental China derived from GPS and its tectonic implications. J. Geophys. Res. Solid Earth 125, e2019JB018774. doi:10.1029/2019jb018774
Wei, X., Zheng, H., Wang, P., Tada, R., Clift, P. D., Jourdan, F., et al. (2018). Miocene volcaniclastic sequence within the xiyu formation from source to sink: Implications for drainage development and tectonic evolution in eastern Pamir, NW Tibetan plateau. Tectonics 37, 3261–3284. doi:10.1029/2018tc005008
Worthington, J. R., Ratschbacher, L., Stübner, K., Khan, J., Malz, N., Schneider, S., et al. (2020). The Alichur dome, South Pamir, western India–Asia collisional zone: Detailing the neogene shakhdara–alichur syn-collisional gneiss-dome complex and connection to lithospheric processes. Tectonics 39, e2019TC005735. doi:10.1029/2019tc005735
Xu, J., Arrowsmith, J. R., Chen, J., Schoenbohm, L. M., Li, T., Yuan, Z., et al. (2021). Evaluating young fluvial terrace riser degradation using a nonlinear transport model: Application to the Kongur Normal Fault in the Pamir, northwest China. Earth Surf. Process. Landf. 46, 280–295. doi:10.1002/esp.5022
Xu, Q., Zhao, J., Yuan, X., Liu, H., Ju, C., Schurr, B., et al. (2021). Deep crustal contact between the Pamir and Tarim Basin deduced from receiver functions. Geophys. Res. Lett. 48, e2021GL093271. doi:10.1029/2021gl093271
Yang, S., Li, J., and Wang, Q. (2008). The deformation pattern and fault rate in the Tianshan Mountains inferred from GPS observations. Sci. China Ser. D-Earth. Sci. 51, 1064–1080. doi:10.1007/s11430-008-0090-8
Yin, A., and Harrison, T. M. (2000). Geologic evolution of the Himalayan-Tibetan orogen. Annu. Rev. Earth Planet. Sci. 28, 211–280. doi:10.1146/annurev.earth.28.1.211
Yin, A., Robinson, A., and Manning, C. (2001). Oroclinal bending and slab-break-off causing coeval east-west extension and east-west contraction in the Pamir-Nanga Parbat syntaxis in the past 10 my. San Francisco, California: American Geophysical Union.
Yuan, Z., Chen, J., Owen, L. A., Hedrick, K. A., Caffee, M. W., Li, W., et al. (2013). Nature and timing of large landslides within an active orogen, eastern Pamir, China. Geomorphology 182, 49–65. doi:10.1016/j.geomorph.2012.10.028
Zhou, Y., He, J., Oimahmadov, I., Gadoev, M., Pan, Z., Wang, W., et al. (2016). Present-day crustal motion around the Pamir Plateau from GPS measurements. Gondwana Res. 35, 144–154. doi:10.1016/j.gr.2016.03.011
Zubovich, A., Schöne, T., Metzger, S., Mosienko, O., Mukhamediev, S., Sharshebaev, A., et al. (2016). Tectonic interaction between the Pamir and tien Shan observed by GPS. Tectonics 35, 283–292. doi:10.1002/2015tc004055
Keywords: Pamir salient, muti-timescale, middle-late Cenozoic, kinematic models, geodynamic processes
Citation: Ge J, Shi X, Chen H, Lin X, Ge W, Wei X, Li F, Chen J, Li H, Cheng X and Zhang F (2022) Two kinematic transformations of the Pamir salient since the Mid-Cenozoic: Constraints from multi-timescale deformation analysis. Front. Earth Sci. 10:967529. doi: 10.3389/feart.2022.967529
Received: 13 June 2022; Accepted: 08 August 2022;
Published: 01 September 2022.
Edited by:
Wenjun Zheng, School of Earth Sciences and Engineering, Sun Yat-sen University, Zhuhai Campus, ChinaReviewed by:
Kai Cao, China University of Geosciences Wuhan, ChinaCopyright © 2022 Ge, Shi, Chen, Lin, Ge, Wei, Li, Chen, Li, Cheng and Zhang. This is an open-access article distributed under the terms of the Creative Commons Attribution License (CC BY). The use, distribution or reproduction in other forums is permitted, provided the original author(s) and the copyright owner(s) are credited and that the original publication in this journal is cited, in accordance with accepted academic practice. No use, distribution or reproduction is permitted which does not comply with these terms.
*Correspondence: Xuhua Shi, c2hpeHVodWFAemp1LmVkdS5jbg==; Hanlin Chen, aGxjaGVuQHpqdS5lZHUuY24=
Disclaimer: All claims expressed in this article are solely those of the authors and do not necessarily represent those of their affiliated organizations, or those of the publisher, the editors and the reviewers. Any product that may be evaluated in this article or claim that may be made by its manufacturer is not guaranteed or endorsed by the publisher.
Research integrity at Frontiers
Learn more about the work of our research integrity team to safeguard the quality of each article we publish.