 Nigel J. Cook
 Cristiana L. Ciobanu
 Kathy Ehrig1,3
94% of researchers rate our articles as excellent or good
Learn more about the work of our research integrity team to safeguard the quality of each article we publish.
Find out more
ORIGINAL RESEARCH article
Front. Earth Sci., 12 October 2022
Sec. Economic Geology
Volume 10 - 2022 | https://doi.org/10.3389/feart.2022.967189
This article is part of the Research TopicMicro- to Nano-Analytical Challenges Towards Trace Element Characterization of Ore Minerals: New Perspectives and Applications for Sustainable GeoresourcesView all 8 articles
Hematite (α-Fe2O3) and magnetite (Fe3O4) readily accommodate a wide range of minor and trace elements from across the periodic table at up to wt.% concentrations. This prompts the question of whether these common minerals can also host rare earth elements (lanthanides, Y and Sc; REEs)? If so, what is the chemical and physical nature of the elements: are they incorporated into the oxide crystal structures, or do they occur as nanometer-to micron-sized inclusions of discrete REE-minerals? By combining micron-scale petrography and analysis by LA-ICP-MS with nanoscale imaging and energy-dispersive spectroscopy, the relationships between REEs and iron-oxides are addressed in samples from the world-class Olympic Dam Cu-U-Au-Ag deposit, South Australia. Spatially co-existing silician magnetite and hematite from the outer shell at Olympic Dam show stages of interconversion during which REEs are redistributed. REEs are shown to be preferentially incorporated into the magnetite structure, whereas hematite concentrates U, W, and Sn, and contains negligible structurally bound REEs. Abundant, <20 nm-sized uraninite nanoparticles (NPs) are a key host for REEs in hematite. In contrast, hematite from mineralized breccias displays co-precipitation of Fe-oxides and REE-minerals facilitated by discharge of high-volatile fluids. Variation in the shape of chondrite-normalized REE fractionation trends, ranging from concave (hematite containing uraninite NPs) to steeply downwards-sloping (included LREE-dominant phases such as monazite, florencite, fluocerite and cerianite), reflect these differences. Evolving NP mineralogy in the breccias, from in-situ NP formation to an abundance of monazite reflects successive overprinting events and remobilization of elements from solid-solution and subsequent trapping as NPs via coupled dissolution replacement reaction. REE-minerals such as florencite can host nanoinclusions of hematite. Atomic-scale observations, including defects in magnetite and an O-deficient, two-fold hematite superstructure show crystal structural accommodation during Fe-oxide interconversion and inclusion nucleation. Both silician magnetite and hematite show nanoscale muscovite forming along planar defects. Understanding the mineralogical deportment of REEs at Olympic Dam carries potential implications for investigating the viability of REE extraction opportunities from any resource in which Fe-oxides are the dominant component.
The iron-oxides hematite (α-Fe2O3) and magnetite (Fe3O4) are among the most abundant minerals in the Earth’s crust. Both are recognized as sinks for a wide variety of incorporated elements at concentrations from a few ppm up to several wt.% (Cornell and Schwertmann, 1996; Bowles et al., 2011). Over the past decade, the iron-oxides have attracted scientific interest for classification and fingerprinting of different deposit types, as potential petrogenetic indicators, to trace the provenance of detrital or alluvial oxide resources, and as potential application as vectors in mineral exploration (e.g., Boutroy et al., 2014; Makvandi et al., 2021). Hematite has also found wide acceptance as a robust U-Pb mineral geochronometer for direct dating of mineral deposits (Ciobanu et al., 2013; Courtney-Davies et al., 2019a, 2020a, 2020b; Keyser et al., 2019b; 2022; Verdugo-Ihl et al., 2022).
The capacity of Fe-oxides to accommodate a broad range of elements from across the periodic table prompts the question of whether they might represent a potential future source of high-value critical or strategic metals? This contribution is focused on the capacity of iron-oxides to host lanthanide group elements and other rare earth elements (REEs) such as yttrium (Y) and scandium (Sc). We address the chemical and physical nature of the incorporated REE within a micron-to nanoscale study of REE distributions in one of the earth’s largest concentrations of Fe-oxides, the Olympic Dam Cu-U-Au-Ag IOCG-type deposit, South Australia (Ehrig et al., 2012). Hematite is the most abundant mineral in this deposit, and although REEs are not currently exploited, the size of Olympic Dam resource (>10 billion tonnes) is sufficiently large for the deposit to be considered as a significant global REE anomaly.
Prior work at Olympic Dam has documented several different REE-fluorocarbonates and phosphates (Ciobanu et al., 2017, 2022a; Schmandt et al., 2017, 2019; Owen et al., 2019), as well as trace to minor REE concentrations in fluorapatite, uraninite, zircon, and other accessory minerals (Macmillan et al., 2016; Krneta et al., 2017, 2018). Several prior studies on Olympic Dam ores have demonstrated measurable REE concentrations in hematite and subordinate magnetite (Ciobanu et al., 2013, 2015; Verdugo-Ihl et al., 2017, Verdugo-Ihl et al., 2020a; Courtney-Davies et al., 2020a). Until now, however, it is unclear whether REEs occur within the crystal lattice of the iron-oxides, as nanoscale inclusions of discrete REE-bearing minerals, or in both forms. An explanation is also needed for the widely varying chondrite-normalized REE fractionation patterns reported for Fe-oxides. Our investigation carries implications for constraining the behavior of REEs in other Fe-oxide dominant ore systems but also for the design of future strategies to recover REE at Olympic Dam. Knowledge of how REEs are concentrated and distributed in iron-oxides is also crucial for optimization of REE recovery from other IOCG ores and tailings (Abaka-Wood et al., 2018, 2019), laterites, regolith, and other supergene lithologies in which Fe-oxides are major components.
In this study, we aimed to identify the nature of REEs in hematite and magnetite by a nanoscale study of thinned foils prepared in-situ from the surface of polished mounts of representative samples from Olympic Dam: 1) co-existing silician magnetite and hematite, with evidence of interconversion between the two oxides; 2) matrix hematite; and 3) hematite from high-grade bornite ore.
The literature contains experimental evidence for high temperature (1000–1200°C) incorporation of lanthanides into hematite. Pramanik et al. (2005) documented Ce-substituted hematite, involving incorporation of Ce4+ ions coupled with expansion of cell parameters. Mohapatra et al. (2005) synthesized Ce-bearing goethite, which when transformed to hematite did not release all Ce. Particles of CeO2 were observed to be located along the 111) planes of hematite. Bhuiyan et al. (2007) note formation of a Fe2-xNdxO3 solid solution above 1100°C. Freyria et al. (2013) describe Eu-doped α-Fe2O3 nanoparticles (NPs) with modified magnetic properties. As an alternative, Moon et al. (2007) demonstrated formation of lanthanide-substituted magnetite (containing Nd, Gd, Tb, Ho and Er) via microbial reduction processes.
A substantial body of data supports ppm-level lanthanide concentrations in igneous magnetite (e.g., Paster et al., 1974; Hoernes et al., 1979; Schock, 1979) and in some magnetite ores (e.g., Helvaci, 1987; Frietsch and Perdahl, 1995). In contrast, data for hematite is relatively limited. Selmi et al. (2009) note a wide range of Y and REE concentrations in hematite from Quadrilátero Ferrífero iron formations in Brazil. Iron-oxides, either preserved from bedrock or re-precipitated, have also been proposed as major hosts for REEs in soils.
Hematite, the most abundant gangue mineral in the Olympic Dam resource (Ehrig et al., 2012), is the product of intense iron metasomatism that accompanied Mesoproterozoic deposition of Cu-U mineralization. Hematite can make up to 80% of the ore and is the main iron oxide throughout the deposit except at its outer margins, where (silician) magnetite prevails (Ciobanu et al., 2019; Verdugo-Ihl et al., 2020a). Several publications have documented the extraordinary diversity of trace elements present within Olympic Dam hematite, notably U, W, Mo, Sn, and Pb (Ciobanu et al., 2013, 2015; Verdugo-Ihl et al., 2017, Verdugo-Ihl et al., 2020a, Verdugo-Ihl et al., 2020b).
Ciobanu et al. (2013) reported LA-ICP-MS data showing several tens to low hundreds of parts per million REEs in Olympic Dam hematite. Ciobanu et al. (2015) reported chondrite-normalized REE fractionation patterns for hematite from the center of the deposit that feature a steep downward-sloping profile. Similar REE fractionation patterns were given by Cook et al. (2016) for “rusty” fine-grained hematite. These steeply downward-sloping fractionation patterns of these hematites mimic the characteristic shapes of bastnäsite and florencite, the most common REE-minerals in the deposit (Schmandt et al., 2017, 2019), an interpretation corroborated by the nanoinclusions of monazite documented by Cook et al. (2016).
Ciobanu et al. (2015) also showed a broadly concave pattern with marked enrichment of both LREEs and HREEs relative to chondrite in hematite from samples deeper in the deposit. Verdugo-Ihl et al. (2017) provide a series of LA-ICP-MS element maps showing more complex distributions in different types of hematite from Olympic Dam, including grain-scale compositional zoning of hematite with respect to REEs. These LA-ICP-MS maps were accompanied by chondrite-normalized REE fractionation patterns showing different patterns and LREE:HREE ratios depending on the textural type of hematite. U-W-bearing oscillatory-zoned hematite features a range of broadly concave patterns, whereas rare, fine-grained colloform hematite displays flatter patterns. Reworked hematite grains, the most abundant sub-type and loosely grouped as “carbonate replacement” hematite by Verdugo-Ihl et al. (2017), show the most consistent trend of enriched in LREEs but especially so in HREEs relative to chondrite. This fractionation pattern (also identified by Courtney-Davies et al., 2020a) is unlike that identified in any of the discrete REE-minerals known from Olympic Dam and was interpreted to define a signature unique to REE-substituted hematite.
The flat signals for REEs on time-resolved LA-ICP-MS depth profiles and homogeneous domains on element maps in the aforementioned studies support incorporation of modest concentrations of REEs into the iron-oxide lattice, typically at concentrations of tens to low hundreds of ppm. Despite this, micron-scale inclusions have been noted in hematite, which impact on the shape of chondrite-normalized REE fractionation patterns. Concentrations measured at the scale of a LA-ICP-MS spot (a few tens of microns in diameter) are therefore attributed to both lattice- and NP-bound REEs, with different fractionation patterns indicating, in part, the presence of different species of REE-minerals. Indeed, nanoscale inclusions of (LREE-dominant) bastnäsite-(synchysite) and monazite in hematite have been mapped in prior studies (Cook et al., 2016; Verdugo-Ihl et al., 2017). HREE-dominant nanoinclusions of xenotime-coffinite and uraninite are observed in hematite from high-grade bornite ore (Cook et al., 2016, 2017).
Data from the outer margin of the deposit (Verdugo-Ihl et al., 2020a) show relative enrichment of REEs in silician magnetite and in (pseudo)mushketovite. Elevated REE concentrations correlate strongly with higher U content, particularly in silician magnetite (up to ∼4,400 ppm ∑REY). ∑REY concentrations in hematite can reach up to ∼760 ppm. Silician magnetite displays smooth, flat to concave REE fractionation patterns, albeit modified when replaced by martite.
All analytical work was undertaken at Adelaide Microscopy, The University of Adelaide. High-resolution transmission electron microscope analysis was carried out on four thinned (<100 nm) foils prepared in-situ from the surface of polished mounts. Each was extracted and attached to a copper grid using a FEI-Helios nanoLab Dual Focused Ion Beam and Scanning Electron Microscope (FIB-SEM). Extraction and thinning procedures followed Ciobanu et al. (2011).
LA-ICP-MS data were obtained from iron-oxides immediately adjacent to FIB-prepared foils for nanoscale analyses (see below) in one sample to better corroborate REE concentration data and nanoscale observations. LA-ICP-MS trace element spot analysis and mapping was undertaken using a RESOlution-LR 193 nm Excimer laser coupled to an Agilent 7900x quadrupole ICP-MS. Ablation time was 60 s and was preceded by a 30 s background measurement. A consistent spot size of 43 μm was used. The isotope suite comprised 46 measured isotopes (dwell times in ms, and minimum detection limits in ppm given in brackets), 24Mg (5, 0.1), 27Al (5, 0.4), 29Si (5, 100), 31P (5, 18), 43Ca (5, 150), 45Sc (10, 0.1), 49Ti (10, 0.2), 51V (10, 0.2), 53Cr (10, 0.3), 55Mn (10, 0.2), 57Fe (5, 5), 59Co (10, 0.04), 60Ni (10, 0.1), 65Cu (10, 0.2), 66Zn (10, 0.15), 69Ga (10, 0.05), 75As (10, 0.4), 88Sr (10, 0.05), 89Y (20, 0.002), 90Zr (10, 0.003), 93Nb (20, 0.004), 95Mo (10, 0.001), 118Sn (20, 0.05), 137Ba (10, 0.002), 139La, 140Ce, 141Pr, 146Nd, 147Sm and 153Eu (all 20, 0.001), 157Gd (20, 0.01), 159Tb, 163Dy, 165Ho, 166Er, 169Tm, 172Yb and 175Lu (all 20, 0.001), 178Hf (10, 0.001), 181Ta (10, 0.001), 182W (20, 0.001), 206Pb, 207Pb and 208Pb (all 20, 0.002), 232Th (10, 0.001), and 238U (20, 0.001). Quantitative data were calculated by calibration against Fe as the internal standard element assuming stoichiometric compositions of hematite and magnetite. External reference materials used were USGS-GSD-2G and NIST-610 glasses.
Nine foils (Supplementary Table S1) were studied using High-angle Annular Dark Field Scanning Transmission Electron Microscopy (HAADF) and EDS measurements reported here were performed using an ultra-high resolution, probe-corrected, FEI Titan Themis S/TEM in the same laboratory equipped with an energy-dispersive spectroscope (EDS) detector. Ciobanu et al. (2016; 2022b) described the approach and advantages of HAADF STEM imaging of modular minerals in the context of complex petrological assemblages. Image acquisition was undertaken using FEI software, TIA (v4.15) and complementary imaging by drift-corrected frame integration package (DCFI) included in Velox (v. 2.13.0.1138) software. Radial Wiener, High-pass, Average and Gaussian blur filters were used to eliminate noise and/or enhance the images. Diffraction pattern indexing was done with WinWulff© (v1.6) (JCrystalSoft) and publicly available data (American Mineralogist Crystal Structure Database; http://rruff.geo.arizona.edu/AMS/amcsd.php). CrystalMaker® (v10.5.7) was used to generate crystal structure models; image simulations were created using STEM for xHREMTM (v4.1) software. All EDS data acquisition and processing was carried out using the Velox software.
The protracted replacement history between (silician) magnetite and hematite, which typically co-exist in iron-metasomatized granite from the outer shell at Olympic Dam (Ciobanu et al., 2019; Courtney-Davies et al., 2020a; Verdugo-Ihl et al., 2020a) significantly impacts on the REE+Y (hereafter REY) distributions in the two Fe-oxides. Sample CLC21 studied here (Figure 1) is representative of the broad variation in textures and trace element concentrations throughout the outer shell and at the scale of a single polished block. In this sample, aggregates of lamellar hematite form a ∼0.5 cm-wide band that separates the magnetite-dominant area of the sample from altered granite (Figure 1A). A selvedge of variable width (up to 1 cm) comprising a mixture of fine-grained magnetite and silicates forms at the immediate contact with the granite. Two representative areas, one for silician magnetite and one for lamellar hematite, hereafter called “FIB areas,” were selected for nanoscale work based on their relative homogeneity in terms of textures and mineral inclusions.

FIGURE 1. (A–F) Photomicrographs in reflected light. (A) Overview of magnetite-hematite-bearing sample CLC21, as labelled. (B) Lamellar silician magnetite underlined by sub-micron-sized Si-bearing inclusions. (C) Partial pseudomorphic replacement of silician magnetite by hematite. (D) Coarse aggregate of lamellar ‘bladed’ hematite. (E) Monazite inclusions (Mnz) clustered within fine-grained hematite and magnetite. (F) Subhedral pyrite (Py) with chalcopyrite (Cp) in pressure shadow. (G) Reflected light image (top left) and selected LA-ICP-MS element maps of boundary domain between lamellar hematite and silician magnetite. Note relative enrichment of W and U in hematite relative to silician magnetite and relative LREE enrichment (Ce and Nd) in silician magnetite. HREEs (represented here by Yb) are evenly distributed across both Fe-oxides.
Magnetite displays an unusual lamellar and/or acicular habit underlined by dusty Si-bearing inclusions, less than 1 μm in size, typical of the variety termed “silician magnetite” (Figure 1B). In detail, the inner parts of such magnetite lamellae become inclusion-free prior to pseudomorphic replacement by hematite (Figure 1C). The resulting hematite is a polygranular martite, i.e., it retains a granular sub-texture within the lamellar habit. This texture is also prominent in the coarser aggregates of hematite seen in Figure 1D. Micron-sized monazite, and sulfides are clustered whenever fine-grained intergrowths of the two Fe-oxides are seen (Figures 1E,F).
LA-ICP-MS data for the two coexisting Fe-oxides (Supplementary Table S2) indicates that REY concentrations in magnetite are an order of magnitude higher than in hematite (mean ΣREY 455 and 34 ppm, respectively). In contrast, U, W, and Sn (hereafter referred to as granitophile elements) are concentrated within hematite (mean 730 ppm U, 311 ppm W, 157 ppm Sn in hematite compared to 8, 0.9, and 6.4 ppm, respectively, in magnetite). Magnetite contains ∼2 to 2.5 wt.% Si. LA-ICP-MS element maps of lamellar hematite either at the contact with, or within magnetite (Figure 1G, Supplementary Figure S1A1) highlight the preferential distribution of the granitophile elements (U, W) in hematite, and LREEs in silician magnetite. Some HREEs appear however to be equally distributed in the two Fe-oxides (e.g., Yb).
Despite the textural heterogeneity within the sample, chondrite-normalized REE fractionation patterns for magnetite and hematite display conspicuous, well-defined trends, albeit with a wider range of LREE variability in hematite outside the FIB area (Figure 2A). Both Fe-oxides show a concave pattern with a pronounced negative Eu anomaly, yet magnetite has greater LREE, and hematite shows enrichment in HREEs relative to LREEs.
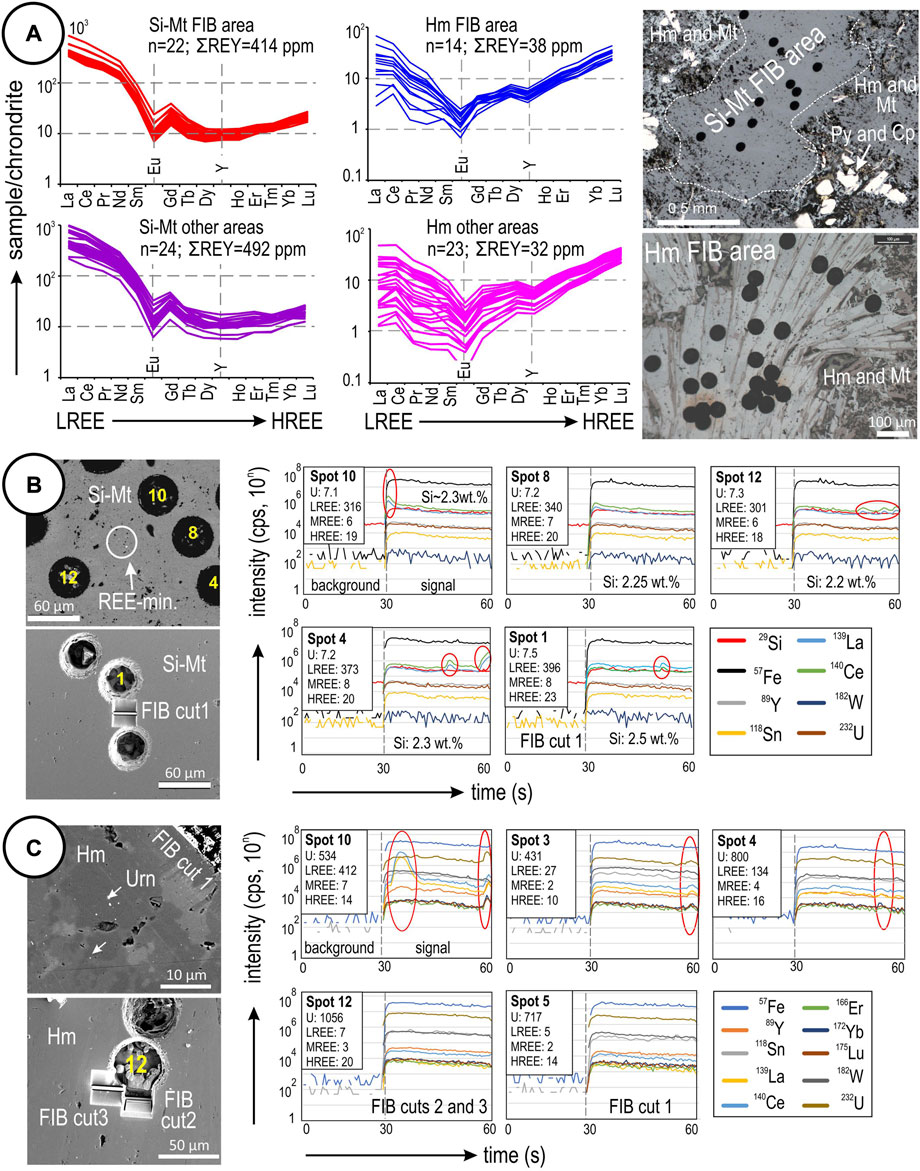
FIGURE 2. (A) REE fractionation patterns normalized to chondrite (McDonough and Sun, 1995) for silician magnetite and hematite in sample CLC21, separated by spots in the immediate vicinity of FIB cuts and those in other areas of the sample. The comparison shows that the FIB-sampled areas are representative of the greater sample with respect to REE concentrations and fractionation. Note the distinct fractionation patterns of the two Fe-oxides. (B) Selected time-resolved downhole LA-ICP-MS profiles for silician magnetite and BSE images of laser spots plotted. The profiles comprise generally flat signals with occasional irregularities in certain elements (red circles/ovals) indicative of inclusions, notably La and Ce. (C) Selected time-resolved downhole LA-ICP-MS profiles for hematite. Note generally flat signals for REEs and other elements on some profiles (including Spot 12, sampled by FIB) but small irregularities on signals for Spots 10, 3 and 4 (marked by red ovals) that are indicative of uraninite inclusions.
Irregularities in the La and Ce signals on time-resolved downhole profiles for magnetite in the FIB area (albeit not replicated in all analyzed spots) are suggestive of subsurface REE-mineral inclusions (Figure 2B, all spots shown except for no. 8 which is smooth). These features correlate with the observation of scattered sub-μm-sized REE-bearing inclusions between the selected LA-ICP-MS craters (Figure 2B). In hematite from the FIB area (Figure 2C), where fields of minute U-bearing inclusions are visible, there is a correlation between individual HREEs (Y, Er, Yb, Lu) and U on the time-resolved downhole profiles, even though some spots (e.g., nos. 12 and 5) show smooth signals for these elements. This suggests that hematite may host HREE-bearing uraninite NPs (Urn-NPs) that may or may not be picked up on the time-resolved downhole profiles, depending on their size and distribution. This also explains the greater concavity of the fractionation pattern for hematite in this sample (Figure 2A).
Intensively mottled magnetite from the FIB area hosts REE-mineral inclusions in proximity to fine micro-textures such as laminae that are free of Si-bearing particles or pores (Supplementary Figures S1B–E). REE-mineral species such as cerianite, (Ce4+,Th)O2, and members of the bastnäsite-synchysite group [BSG; (Ce,La,Nd…..)(CO3)F – Ca(Ce,La,Nd … )(CO3)2 F] (Supplementary Figures S1F,G) are observed in adjacent areas wherever martite is the product of replacement of magnetite by hematite. Likewise, fields of tiny U-, W-, and Sn-bearing inclusions form in porous hematite from the FIB area, and coarser monazite clusters around tiny voids between mineral grains (hereafter termed microvugs) within domains displaying interconversion between the two Fe-oxides (Supplementary Figures S1H,I).
The nanoscale study was conducted on six foils obtained from sample CLC21 (Supplementary Table S1; Figure 3) obtained from locations marked on Figure 2 and Supplementary Figure S1. Magnetite from an area free of visible REE-inclusions (foil Mt#1; Figure 1A) is a fine-grained aggregate densely mottled with Si-bearing particles (silician magnetite; Ciobanu et al., 2019). Unlike material described previously, however, the present sample lacks oscillatory zoning patterning and instead features sub-µm domains of different orientation separated by cracks/fractures and narrow zones of inclusion-free magnetite (Figure 3A). Large cavities (up to several µm wide) are present at crack/fracture junctions. These are filed with secondary phases, the largest being a CaSO4-species, gypsum or anhydrite. Silician magnetite only occupies part of the two foils derived from FIB cuts across cerianite and BSG inclusion trails in foils Mt#2 and #3; hematite is exposed at depth (Figures 3B,C). The three hematite foils show ubiquitous uraninite NPs along trails which may also include scheelite, ferberite and cassiterite (Figures 3D–F). In addition, Si-free magnetite is present as inclusions within hematite, whereas silician magnetite and chlorite fill a μm-wide fracture through hematite in one foil (Hm #3; Figure 3F).
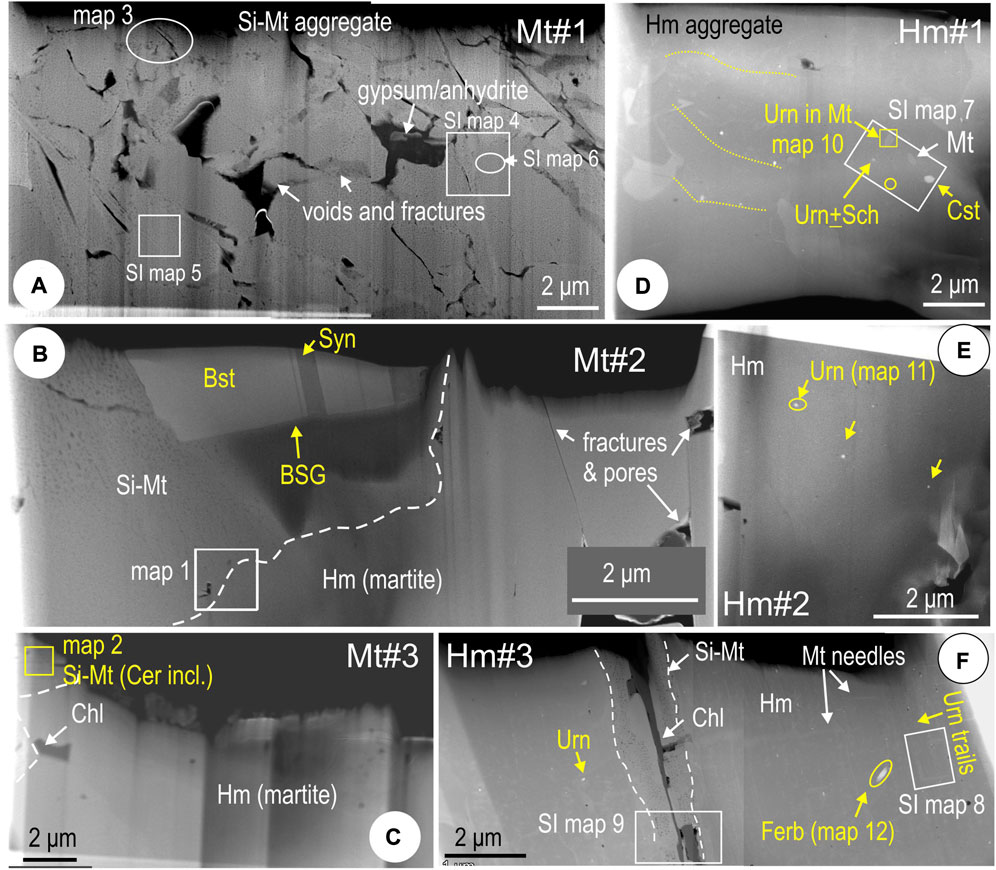
FIGURE 3. HAADF STEM images providing overview of thinned foils from sample CLC21. (A) Foil Mt#1. (B) Foil Mt#2. (C) Foil Mt#3. (D) Foil Hm#1. (E) Foil Hm#2. (F) Foil Hm#3. BSG, bastnäsite-synchysite group minerals; Bst, bastnäsite; Cer, cerianite; Chl, chlorite; Cst, cassiterite; Ferb, ferberite; Hm, hematite; Mt, magnetite; Sch, scheelite; Si-Mt, silician magnetite; Syn, synchysite; Urn, uraninite. White boxes refer to areas of element maps in this publication.
Typical for the silician magnetite are the densely mottled areas with randomly oriented, rounded to subhedral Si-bearing NPs (Figure 4A). Some domains show sets of Si-bearing precipitates along (111) planes within host magnetite [hereafter called (111)Si-Fe rods; Figure 4B]. Whereas the (111)Si-Fe rods have widths corresponding to 2d111 of magnetite and comparable atom arrangements although with darker appearance due to replacement of Fe atoms by Si (Xu et al., 2014; Ciobanu et al., 2019, 2022b), some are much darker and notably lack the middle arrays of atoms (inset on Figure 4B).
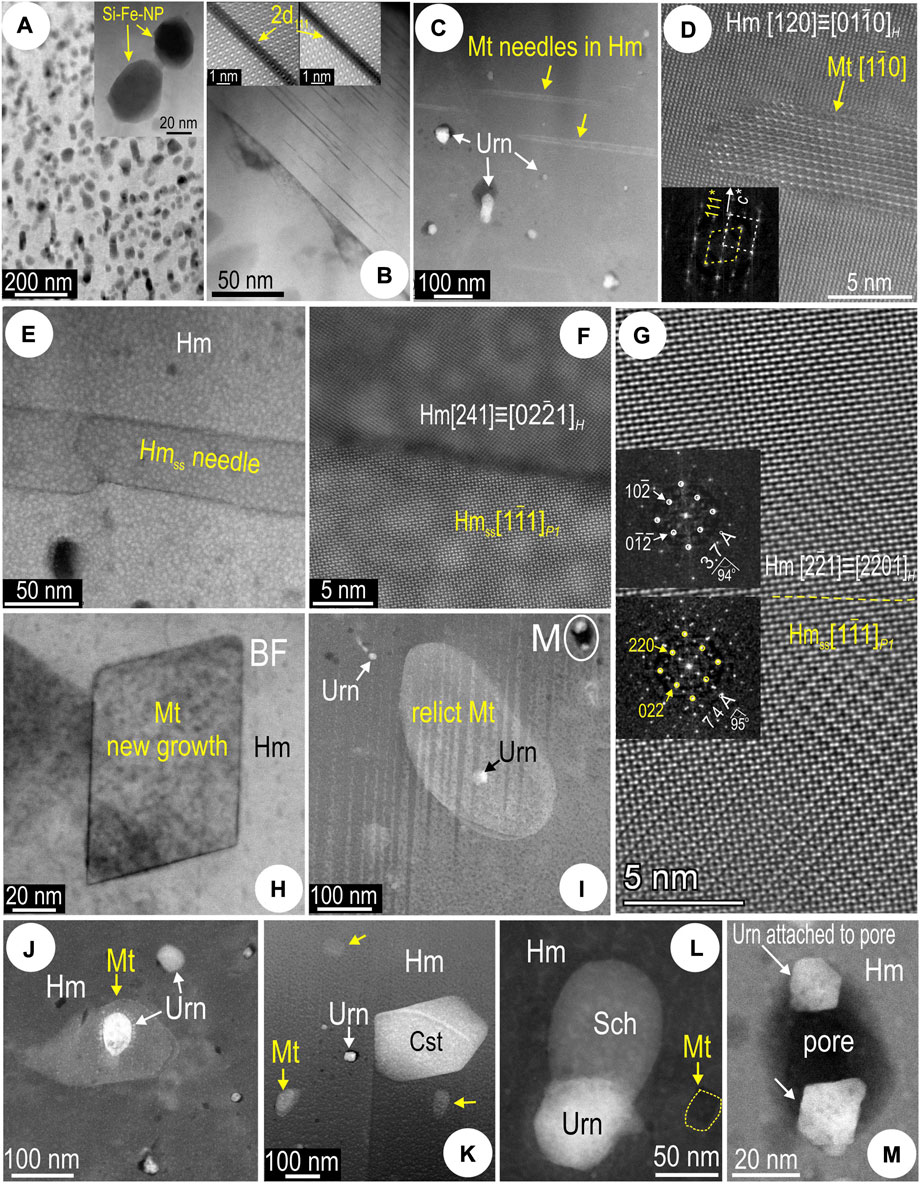
FIGURE 4. HAADF STEM images showing aspects of silician magnetite and co-existing hematite (sample CLC21). (A) Mottled texture in silician magnetite comprising Si-Fe NPs (detail in the inset). (B) Grain boundary in silician magnetite showing different textures. Grain to the right is free of Si-Fe NPs but displays linear defects of 2d111 width of magnetite (inset). (C) Magnetite (Mt) needles and uraninite (Urn) NPs in hematite (Hm). (D) Image and fast Fourier transform (FFT; inset) showing epitactic relationships between the magnetite needle and host hematite (zone axes given in square brackets). (E–G) Hematite superstructure (Hmss) identified as coherently intergrown needles in host hematite (Hm) in areas of martitization (foil Mt#3). High-resolution images [(F,G) and FFT patterns as insets in (G)] showing the congruent boundary between the two species. The phase along the needle is identified as the O-deficient, two-fold hematite superstructure (a = b = c = 10.85 Å; α = β = γ = 55.28°) defined in Verdugo-Ihl et al. (2020) based on a model involving ordered oxygen vacancies. (H) New growth of nanocrystalline magnetite in hematite. (I) Uraninite NP within relict magnetite (rounded grain) enclosed by hematite. (J) Uraninite within relict magnetite enclosed in hematite. (K) Relict magnetite and uraninite adjacent to cassiterite (Cst). (L) Composite NP comprising uraninite and scheelite (Sch) in hematite. (M) High-magnification image of pore-attached uraninite NPs located on (I).
Complex relationships between the two Fe-oxides and crystal-structural modification of hematite are observed at the nanoscale (Figure 4). Magnetite occurs as thin needles (up to ∼10 nm wide) throughout hematite containing fields of uraninite NPs (Figure 4C). High-resolution imaging shows that such magnetite has sharp boundaries and is coherently oriented within the host hematite (c*Hm//111*Mt; Figure 4D).
The foil extracted from domains of martitization (Mt#2) instead displays needles of O-deficient, two-fold hematite superstructure (a = b = c = 10.85 Å; α = β = γ = 55.28°; Verdugo-Ihl et al., 2020b) (Figures 4E–G). The co-existence of euhedral and rounded particles of magnetite within hematite suggests both new growth and inherited (relict) grains (foil Hm#1; Figures 4H,I). The relict magnetite hosts uraninite (Figures 4I,J) or is associated with cassiterite, scheelite and uraninite inclusions (Figure 4K,L). Some of the smallest uraninite NPs are pore-attached (Figure 4M).
STEM EDS mapping shows that Ce is slightly higher in silician magnetite compared to martite (hematite in foil Mt#2; Figure 5A). A cerianite NP was identified in a banded mottled area of silician magnetite (foil Mt#3; Figures 5B,C). Lower-resolution STEM EDS mapping of Si-bearing magnetite domains (foil Mt#1) shows boundaries marked by small inclusions of CaSO4 (anhydrite?), halite, and a fine, irregular white mica, hereafter referred to as muscovite, with Cl and F also picked up, most likely within fractures (Supplementary Figure S2A). Inclusion-free magnetite is present along the fractures. No marked enrichment in REEs or discrete REE-bearing phases was identified along domain boundaries in magnetite. Mottled magnetite domains show a variation on the theme of Si-bearing NPs, some of which are associated with scattered Cl-, Na-, F-, K-, and Al-bearing NPs (fluorite, halite, and muscovite). No discrete REE-bearing inclusions or patterns are depicted, e.g., on La and Ce element maps (Supplementary Figure S2B). This would imply that the ΣREY concentrations measured in magnetite (427 ppm ΣREY, 340 ppm LREEs, 191 ppm Ce in spot 1; Figure 2B) is best attributed to statistically disordered REY incorporation into the Fe-oxide lattice. The higher resolution STEM EDS map of Si-bearing NPs in magnetite and EDS profile across them (Supplementary Figure S2C) shows that the Si-bearing NPs are slightly depleted in REEs (Ce, La) relative to the magnetite host. The blebs show no changes in the crystal structure relative to magnetite on the same orientation, but atom-scale mapping (Supplementary Figure S2D) shows antipathetic gradients of Si and Fe across their mutual boundaries.
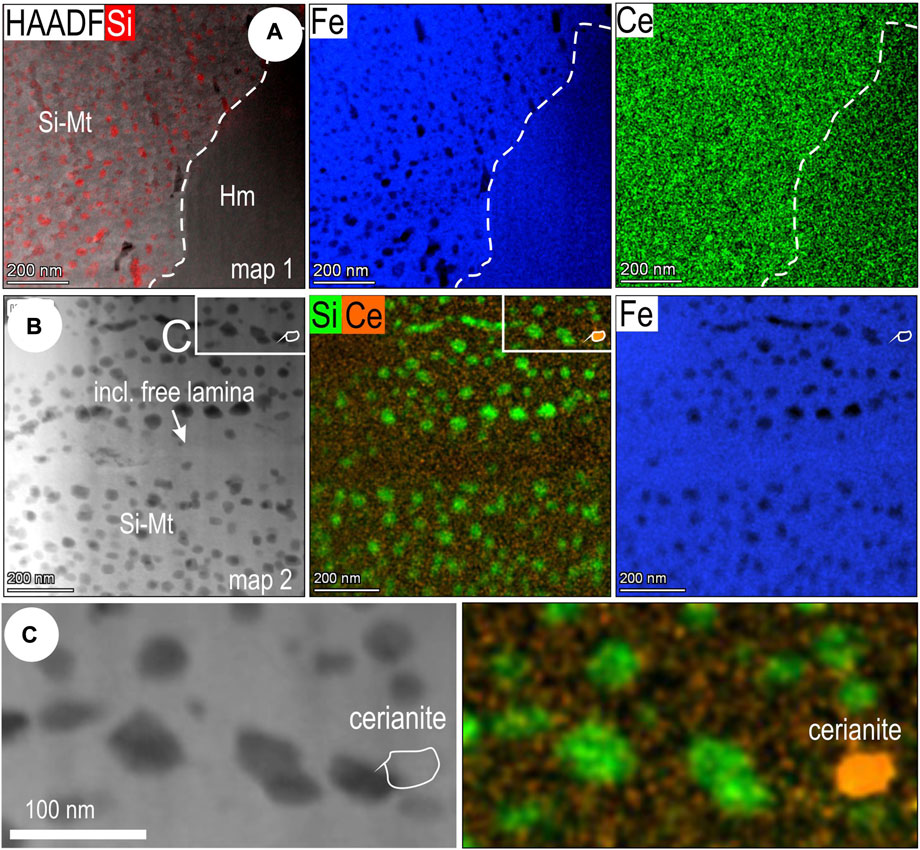
FIGURE 5. (A) HAADF STEM image with Si overlay (left) and STEM EDS element maps for Fe and Ce across silician magnetite (Si-Mt)—hematite (Hm) boundary (foil Mt#2). Note that Ce is slightly higher in silician magnetite compared to hematite (interpreted as martite). (B) HAADF STEM image (left), overlay of Si and Ce element maps and Fe map showing banding with respect to silician NPs (Si-Fe NPs) in silician magnetite (Si-Mt) from foil Mt#3. Note inclusion-free lamina in the middle. (C) Enlargement of area indicated by white box in (B), showing the presence of a cerianite NP along the Si-Fe NP bands.
Mapping and profiles across the (111)Si-Fe rods show that Si is accompanied by K and Al, albeit at much lower concentrations (Figure 6A) in some of them. This association can be attributed to an incipient stage of “muscovite” formation and may explain the apparent darkening through the middle part of the 2d111 interval (Figure 6B). Element mapping at atom-resolution shows that the darker parts of these rods do show a relative enrichment in K. In contrast, no chemical changes are identified by mapping defects along (110) planes in magnetite (Figure 6C). The Fe maps depict atom distributions across the defect.
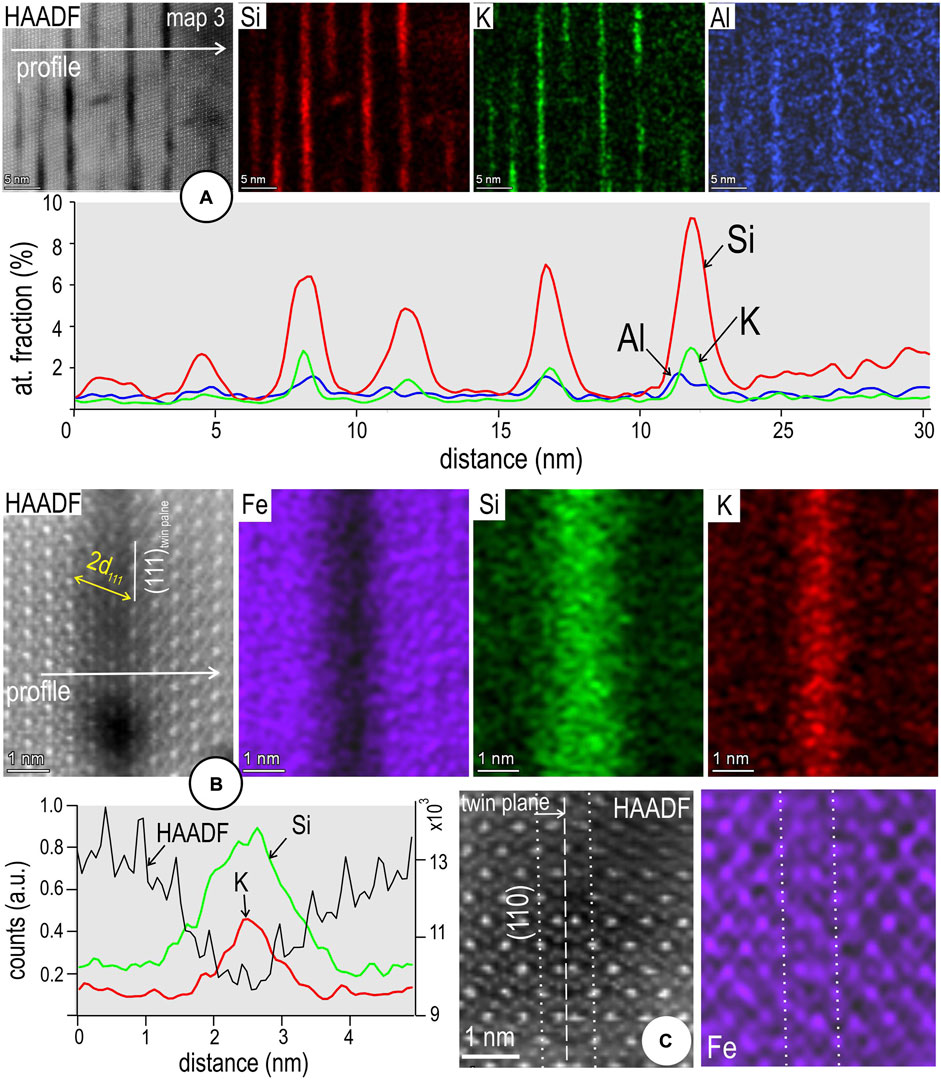
FIGURE 6. (A) Image, STEM EDS element maps and line profile across domain in silician magnetite displaying (111)Si-Fe rods (2d111 width of magnetite) which are incipiently replaced by muscovite (foil Mt#1). The “sericitisation” is depicted by K and Al maps and element profiles showing an overlap with Si distribution. (B) Atom-resolution image, STEM EDS maps (Fe, Si, K) and EDS line profile across a single 2d111 rod showing K distribution through the centre of the Si-bearing, Fe-depleted band. (C) Atomic-resolution image and STEM EDS map for Fe across a (110) twin plane in magnetite. Note the match between the image and map with respect to Fe atoms. This type of defect shows no distinct pattern with respect to Si distribution.
High-resolution imaging of mottled areas reveals abundant defects as (111)Si-Fe rods or along (110) planes (Supplementary Figure S3). These are present in either the host magnetite or Si-bearing blebs, in some cases directly crossing their mutual boundaries. The atomic arrangement of Fe in magnetite viewed on [1–10] zone axis matches STEM simulations and the only change observed across the 2d111 rods is a decrease in total HAADF signal intensity (Supplementary Figure S3A). In contrast, nanodomains of different orientation are observed in areas displaying defects along (110) twin planes (Supplementary Figures S3B,C). The (110) twins promote changes in domain orientation from <110> to <111> or <121> zone axes observed from areas affected by fluid percolation. Interpretation of the HAADF STEM images illustrating the two types of planar defects is made considering the atom-fill crystal structure model for Fe atoms in [1–10]magnetite (Supplementary Figures S3D–H).
STEM EDS mapping of hematite co-existing with silician magnetite is typified by abundant U-, W-, and Sn-bearing NPs that form fields or parallel trails (Supplementary Figure S4). Uraninite appears to be commonly associated with scheelite NPs, either within the same field or as bi-component particles. Cassiterite contains measurable W, as well as traces of U and REEs (Ce and Yb maps). Such NPs are also present in hematite on either side of a silician magnetite sliver. Chlorite replaces magnetite along Si-free laminae.
Although no discrete REE inclusions were observed, EDS STEM mapping of larger particles of uraninite (∼50–100 nm-wide) and ferberite (∼100 nm wide, 200 nm long) show measurable amounts of both LREEs and HREEs (Ce, Er, Yb maps in Figure 7). This can explain the characteristic concave chondrite-normalized fractionation trend typical of this type of hematite (Figure 2A). A halo of tiniest NPs surrounds uraninite hosted in relict magnetite within hematite (Figure 7A), implying element remobilization via diffusion within the host. Pore-attached uraninite NPs are instead formed directly in hematite (Figure 7B). An association between uraninite and W-bearing particles, whether scheelite (Figure 7A) or ferberite (Figure 7C) is common throughout the hematite.
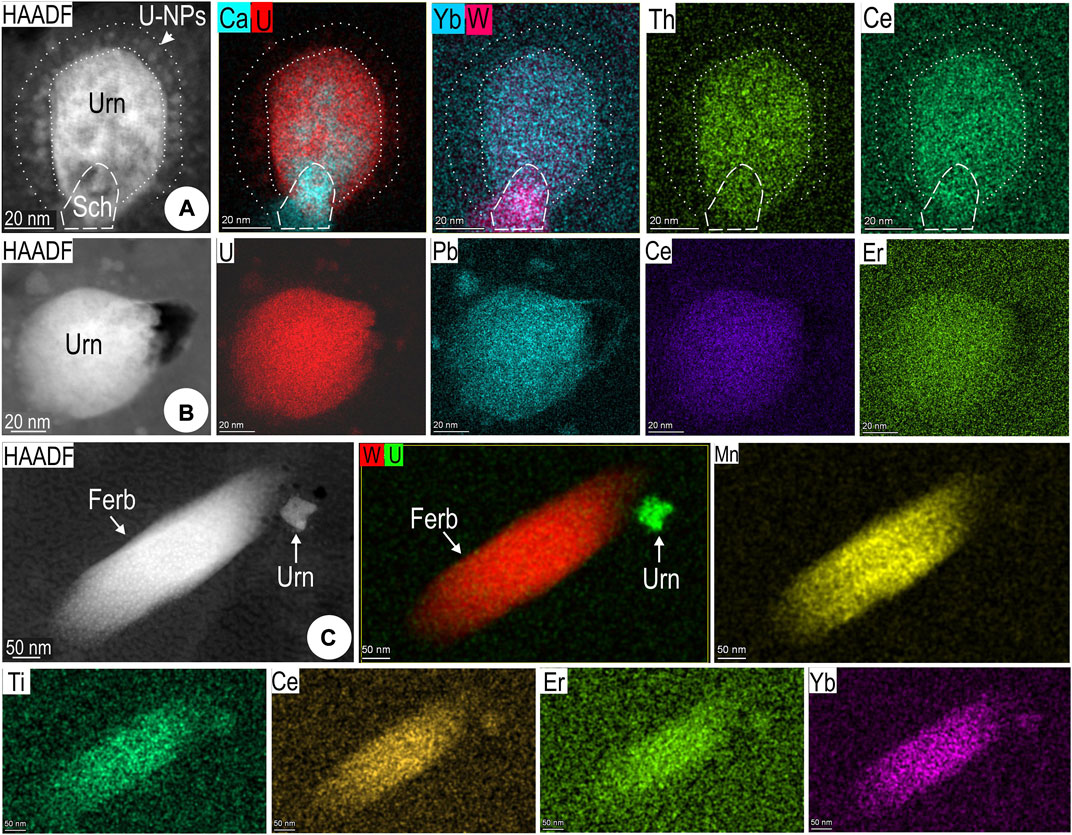
FIGURE 7. Images and selected STEM EDS element maps for U-W-bearing NPs in hematite from sample CLC21 (maps 10–12; foils Hm#1–3). (A) Multi-component nanoinclusion (shown in Figure 4J) comprising uraninite (Urn) and scheelite (Sch) with halo of sub-nm-scale uraninite. (B) Single, bleb-shaped uraninite NP, and (C) lamellae of ferberite (Ferb). Note that uraninite, scheelite, and ferberite all contain REEs (both LREEs, represented by Ce, and HREEs, represented here by Er and/or Yb).
Speciation of the U-, W-, and Sn-bearing NPs mapped in hematite, or magnetite inclusions therein was assessed by high-resolution imaging and FFT patterns (Figures 8A–F). Epitaxial growth is displayed only by uraninite with magnetite (Figure 8A), and with scheelite (Figures 8B,C). No coherency of orientation is observed between host hematite with uraninite, cassiterite (Figures 8D–F), or ferberite inclusions.
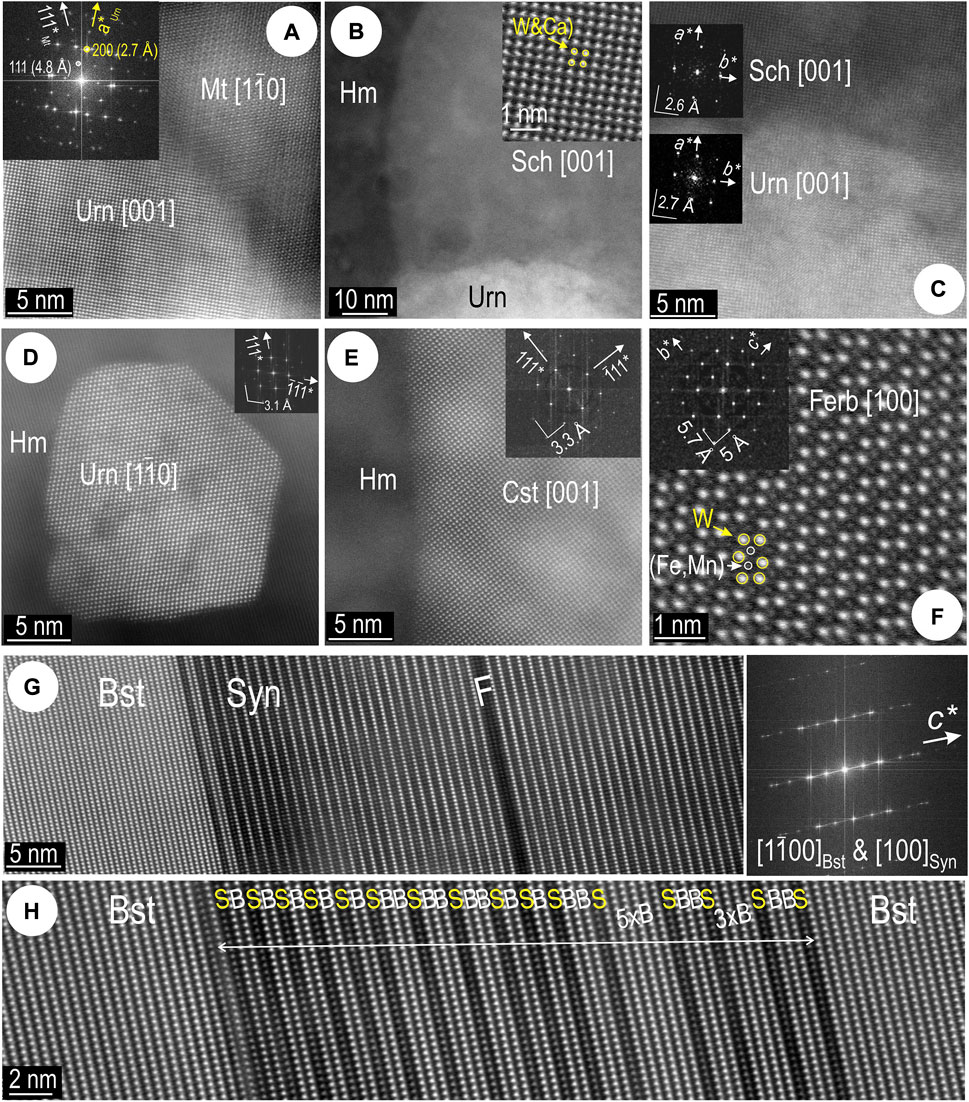
FIGURE 8. High- and atomic-scale resolution images showing crystal-structural aspects of nanoinclusions in hematite from (foils Hm#1–3) (A–F) and the BSG lamella in silician magnetite (Foil Mt#2) (G,H) in sample CLC21. Zone axes as marked in square brackets, and orientation on FFT patterns (insets) (A) Congruent boundary between uraninite (Urn) and host magnetite (Mt). (B) Scheelite (Sch; detail as inset) and uraninite in hematite (Hm). (C) Congruent boundary between scheelite and uraninite both on [001] zone axis. (D) Uraninite NP attached on a pore in hematite, zone axis as marked. (E) Boundary domain between cassiterite (Cst) NP and host hematite. Note lack of congruency with host hematite. (F) Ferberite on [100] zone axis, with W and (Fe,Mn) sites identified (overlay). (G) Boundary between bastnäsite (Bst) and synchysite (Syn). Note disordering in synchysite close to the boundary. F─crystal fault. FFT pattern (right) shows strong disorder on c* axis with overlap between zones axes of the two minerals as marked. (H) Detail of disordered bastnäsite domain with various stacking modules as marked. “B” and “S” refer to bastnäsite and synchysite modules, respectively.
The BSG lamella in silician magnetite (Figure 3B, Supplementary Figure S1G) shows a disordered stacking sequence (Figures 8G,H). All species in the series are formed by combinations of bastnäsite (B) and synchysite (S) modules stacked along the c axis, and easily recognizable on HAADF STEM images (Ciobanu et al., 2017; 2022a). Although intervals of ordered B and S stacks are observed (Figure 8G), stacking sequences with various other combinations of B and S are present as short (20–30 nm) interval repeats within host bastnäsite (Figure 8H).
The highest REE concentrations in iron-oxides from Olympic Dam are measured in the fine-grained hematite that forms the matrix of mineralized breccias (Cook et al., 2016). Notable enrichment in REEs also occurs in porous hematite from high-grade bornite ore (Ciobanu et al., 2013). Three examples of these ore types (Supplementary Tables S1, S3; Figure 9) were studied at the nanoscale. They are comparable in terms of LREE-enrichment and downwards-sloping chondrite-normalized fractionation trends (Figure 9A). They differ, however, in terms of mean ΣREY concentrations and features observed on time-resolved LA-ICP-MS downhole profiles (Figure 9B).
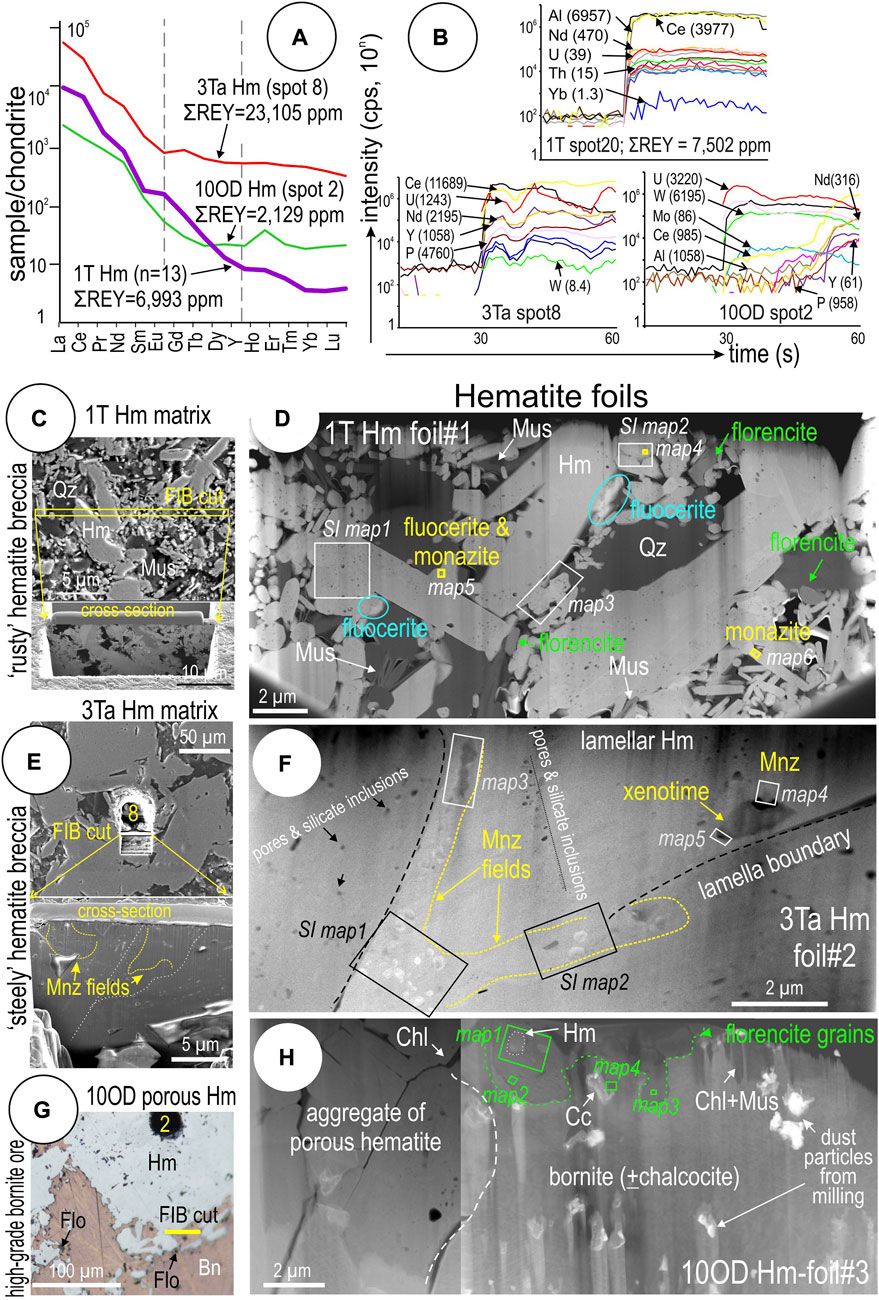
FIGURE 9. (A) Chondrite-normalized REE fractionation trends for representative LA-ICP-MS spot analyses from samples 1T, 3Ta, and 10OD. (B) Time-resolved downhole LA-ICP-MS profiles for the three spots. Note relatively smooth signals and high REE concentrations in 1T Spot 20, erratic signals indicative of inclusions in 3Ta Spot 12, and flat and anomalous signals related to inclusions in 10OD Spot 2. (C–H) Locations of FIB-cuts from samples 1T, 3Ta, and 10OD, respectively, marked on reflected light photomicrograph, and overview of the studied thinned foils. EDS element maps presented in this work are located on the overview images.
The finest-grained hematite observed in ‘rusty’ hematite breccia sample 1T-Hm (Figures 9C,D) records very consistent downwards-sloping, LREE-enriched chondrite-normalized fractionation trends with an average ΣREY concentration of ∼7,000 ppm. Time-resolved LA-ICP-MS downhole profiles show smooth signals for all lanthanides that are suggestive of lattice-bound trace element incorporation (spot 20; Figure 9B). Contradicting such an interpretation, however, are the conspicuous, diverse REE-minerals, florencite [LREEAl3(PO4)2(OH)6], fluocerite [(Ce,La)F3] and monazite [(LREE)PO4], which occur as nanoscale inclusions throughout and interstitial to the hematite aggregate (Figure 9D; see below). In detail, hematite forms an aggregate of wider (a few μm in diameter) and narrower (sub-μm- down to nm-sized) lamellae with interstitial quartz and muscovite. A few, relatively larger grains of discrete REE-minerals (up to several hundred nm) are observed at boundaries between hematite and silicates.
Sample 3Ta-Hm is representative of the coarser hematite forming the matrix of steely hematite breccias (Figures 9E,F). This has a markedly less-steeply sloping fractionation trend and contains REY at concentrations an order of magnitude higher than rusty hematite (23,105 ppm ΣREY in spot 8; Figure 9A). In this case, time-resolved LA-ICP-MS depth profiles feature noisy signals suggestive of discrete inclusions of REY minerals below the sample surface (Figure 9B). Such an interpretation is readily confirmed by the fields of monazite NPs clustering the boundaries between hematite lamellae in the investigated foil (Figure 9F).
Samples 1T-Hm and 3Ta-Hm both contain Cu-(Fe)-sulfides as veinlets and disseminations and respectively represent the upper bornite-chalcocite ore zone (1T) and lower chalcopyrite-pyrite ore zone (3Ta) of the Olympic Dam deposit (Ehrig et al., 2012). The third sample is from high-grade copper ores in which two distinct generations of U-bearing hematite occur as disseminations throughout massive bornite (Ciobanu et al., 2013). An older generation, represented by polygranular, porous hematite is relatively richer in REY (2,129 ppm ΣREY in spot 2; Figure 9A). This hematite features a downwards-sloping REE fractionation trend comparable with that shown for sample 3Ta. Micron-sized grains of florencite occur at boundaries between bornite and hematite (Figures 9G,H). Time-resolved LA-ICP-MS depth profiles feature noisy signals (Figure 9B) that match the presence of florencite inclusions in the foil (Figure 9H).
The finest hematite aggregate in foil 1T-Hm displays an abundance of NPs in which an eclectic range of other included phases co-exist with the REE-minerals. These include Cu-Fe-sulfides, As-bearing Fe-phosphates, and Si-bearing NPs, all identified by STEM EDS mapping (Supplementary Figures S5A,B). The distribution of NPs varies, in some cases, their arrangement is suggestive of a zoning with respect to which mineral species is present or NP size. Smaller grains of hematite show clusters of such NPs, including multiple discrete LREE species, around their margins (Figure 10A), but in other cases NPs are concentrated in grain cores. The REE-bearing NPs occur either as discrete grains or as tiny pico-sized inclusions, possibly cerianite-(Ce), within composite particles that also contain sulfides/sulfoarsenides (e.g., arsenopyrite), Fe-phosphates and Si-Al-phases (Figure 10B). Such composite inclusions also commonly feature an internal void (vapor bubble?) suggesting they could represent fluid inclusions opened during ion milling. Larger, discrete REE-particles, tens of nm in diameter within hematite can be composite (e.g., monazite–fluocerite; Figure 10C), or single species, commonly monazite (Figure 10D). Nanoparticles of Cu-Fe-sulfides are associated with monazite.
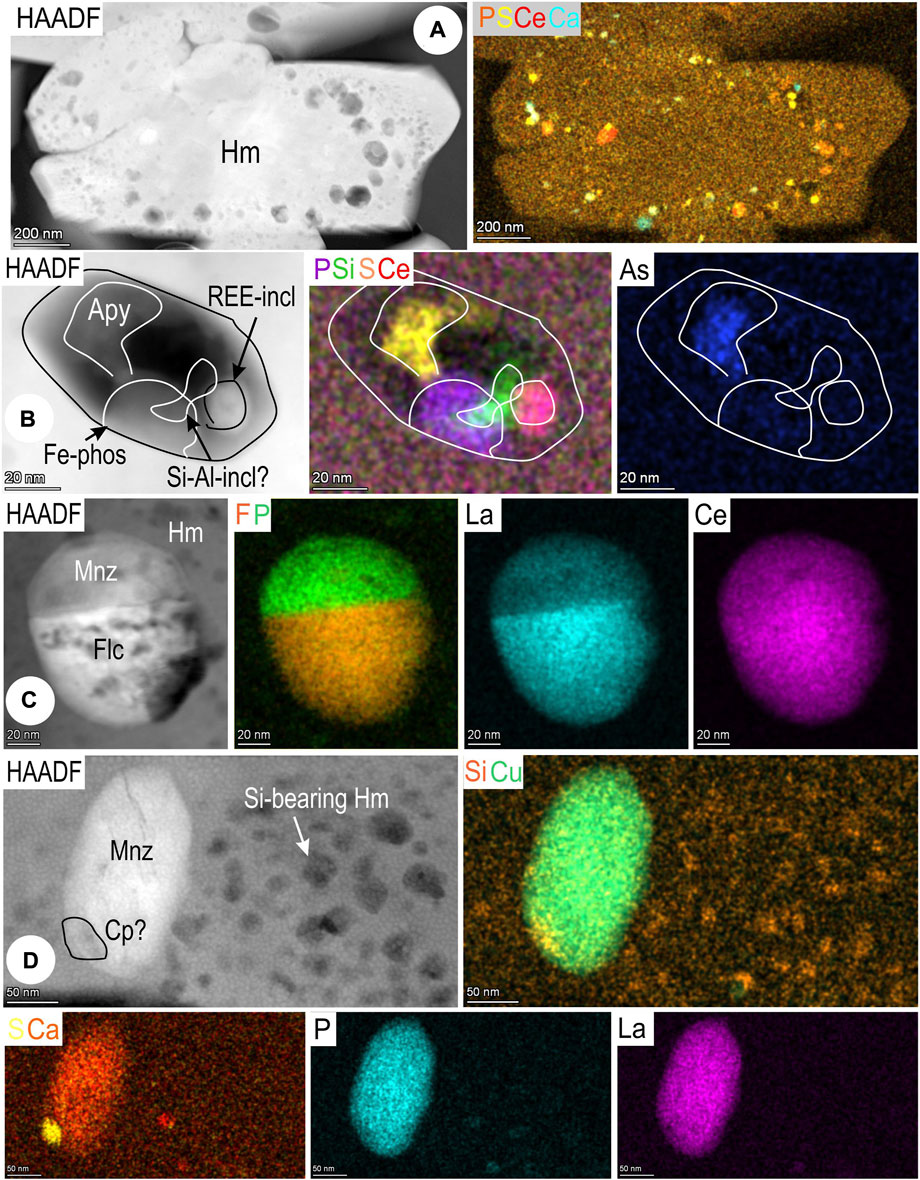
FIGURE 10. Images and STEM EDS element maps of nanoinclusions in hematite from sample 1T (maps 3–6; foil Hm#1). (A) Smaller grain of hematite with clustering of NPs, including multiple discrete LREE species, around grain margins. (B) Composite NP containing arsenopyrite (Apy), a REE-mineral (cerianite?), a Si-Al-bearing phase and an unidentified Fe-phosphate interpreted as an opened fluid inclusion (C) Binary NP comprising monazite (Mnz) and fluocerite (Flc). Note difference between maps for La and Ce. (D) Monazite and marginal chalcopyrite (Cp) within Si-bearing hematite.
Aside from STEM EDS mapping and spot analysis, the identity of REE-phases has also been assessed by high-resolution HAADF STEM imaging on relevant zone axes (see below). The largest yet rarest inclusions are fine particles of florencite that always occur outside hematite, at the boundary to quartz (Figure 11A). Small hematite grains, at most a few hundreds of nm wide, cut across muscovite lamellae and display mottling with respect to NPs (Figure 11B). The O-deficient, two-fold hematite superstructure is identified from many such grains (Figure 11C). The other REE-species that occurs as fine particles outside of hematite grins is fluocerite (Figure 11D). Inclusions of monazite and fluocerite, both as NPs (<100 nm) and fine particles (100–2500 nm), are abundant within hematite (Figures 11E,F). The two species in the binary REE-inclusion shown in Figure 10C display coherent lattice-scale intergrowths with one another. Layers of fluocerite are recognized within monazite close their mutual contact boundary (Figures 11G,H). Zone axes for the two species with epitaxial growth are shown in Figures 11I,J. The distribution of LREEs (Ce, La) is represented by dumbbell patterns with distinct periodicity for each phase and the HAADF STEM image is reproduced by STEM simulations (Figure 11H). The fine particle of monazite mapped in Figure 10D could also be identified from another zone axis displaying Ce atoms with a double-dumbbell pattern (Figure 11K). Atomic-scale images on additional zone axis are matched with simulations Supplementary Figure S6.
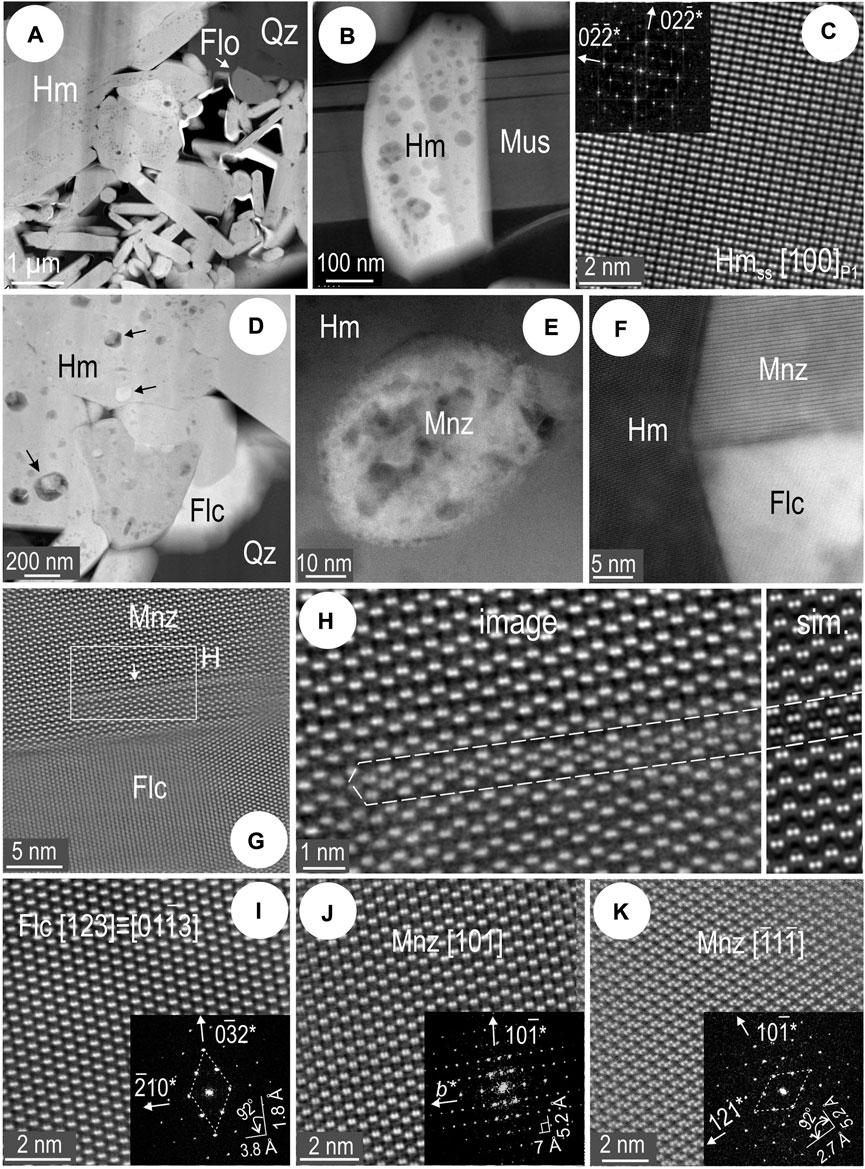
FIGURE 11. HAADF STEM images showing aspects of hematite and REE-minerals in sample 1T (foil Hm#1). Zone axes marked in square brackets and FFT patterns as insets. (A) Fine particle of florencite (Flo) harbored at the boundary between hematite (Hm) and quartz (Qz). Note the fine-grained, lamellar aggregate of hematite adjacent to coarser grains. (B) One of smallest hematite grains crosscuts muscovite (Mus). Note hematite is densely mottled with inclusions. (C) Atom-scale image and FFT pattern (inset) of hematite superstructure (Hmss) identified from inclusion-bearing hematite. (D) Fluocerite (Flc) fine particle at boundary between coarser hematite and quartz. Inclusions of various types in hematite are arrowed. (E) Single monazite (Mnz) NP within hematite. (F) Composite NP containing monazite and fluocerite. (G) Coherent boundary domain between monazite and fluocerite. (H) Detail of monazite [rectangle in (G)] showing lattice-scale disorder as intergrowths of fluocerite layers. Note similarity between atom-scale image and STEM simulation (sim.). (I) Atom-scale image of fluocerite and (J,K) monazite on two different zone axes as marked.
STEM EDS mapping shows that the highly porous hematite in sample 3Ta is typified by an abundance of monazite inclusions as both NPs and fine particles. Such inclusions are densely clustered close to boundaries between individual lamellae (Supplementary Figures S5C,D). These boundaries are marked by tiny NPs, with swarms of still finer Si-bearing NPs enclosing particles of monazite. Calcium is present within monazite and co-defines a grain-scale compositional zoning, in which Ca-rich bands form the middle part of grains with La-rich margins. The monazite crystal structure is considered highly flexible and capable of incorporating other cations, including Ca (Clavier et al., 2011).
Higher resolution mapping of an elongate cluster of monazite grains, 1 μm or so in total length (Figure 12A), also shows grain-scale compositional zoning with respect to Ca and La, as does the example illustrated as Figure 12B. Other minor elements characteristic of monazite, Th, U, and Pb, are also present at mappable concentrations. In some cases, galena or uraninite NPs can be mapped in monazite. Clusters of uraninite NPs are present in cavities along the margin of a larger xenotime inclusion (Figure 12C).
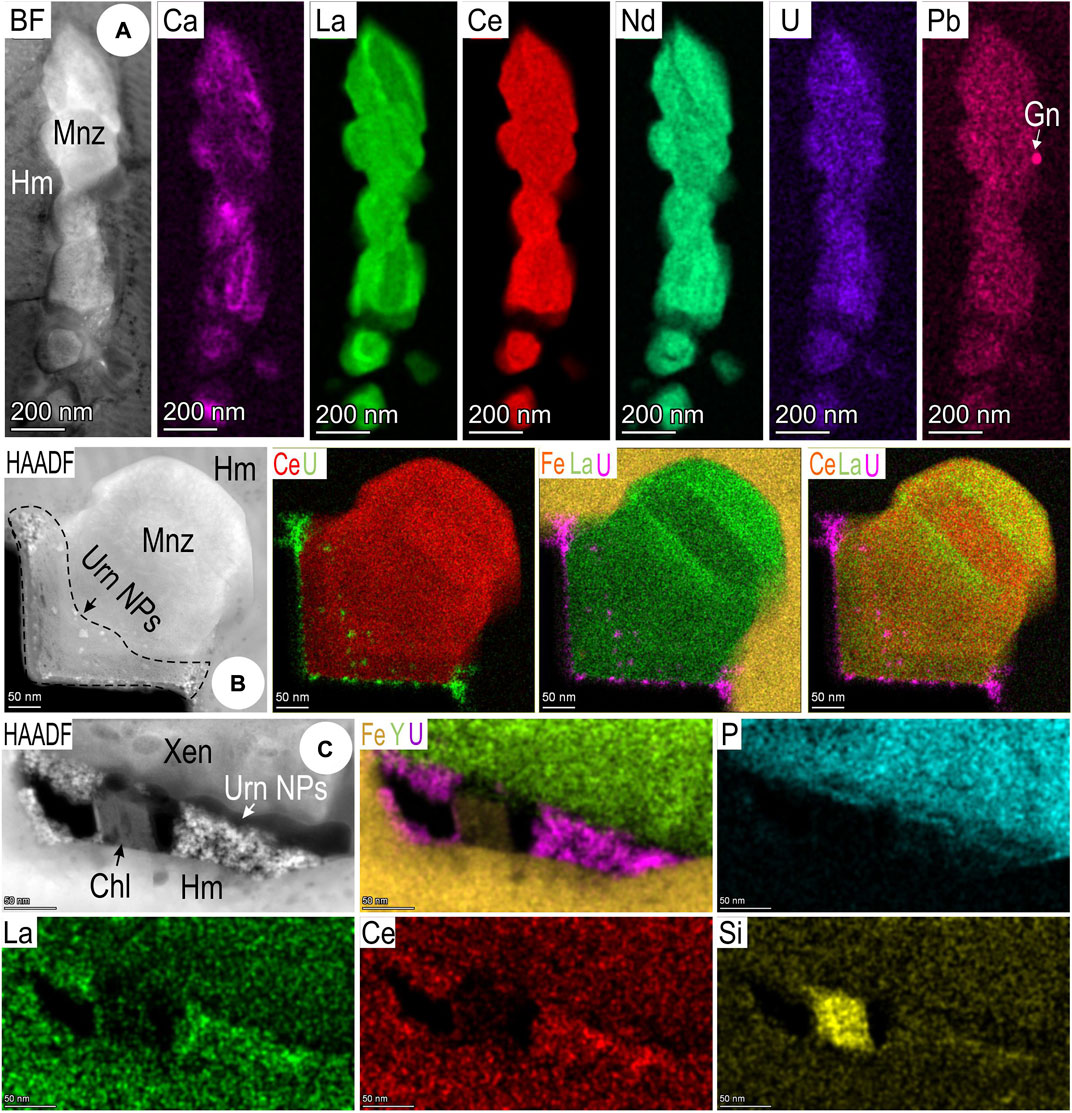
FIGURE 12. Images and STEM EDS element maps of monazite (Mnz) particles (A,B) and uraninite (Urn) NPs (C) in hematite (Hm) from sample 3Ta (maps 3–5; foil Hm#2). (A,B) Monazite NPs with nm-scale compositional zonation and/or heterogeneity. Note galena NP [in (A)] and marginal uraninite NPs [in (B)]. (C) Uraninite NPs and chlorite (Chl) at margin between xenotime (Xen) and hematite.
Hematite displays a finely striped and/or streaky oriented fabric that is accentuated by the FIB-milling around single or clustered inclusions (Figures 13A,B). In this area, xenotime, YPO4, occurs as a single inclusion a few μm in length, with dense clusters of uraninite NPs. Uraninite NPs are also present in monazite (Figure 13C) in a grain adjacent to xenotime. Otherwise, the monazite grains are euhedral and some show a degree of coherent orientation with host hematite (Figures 13D,E).
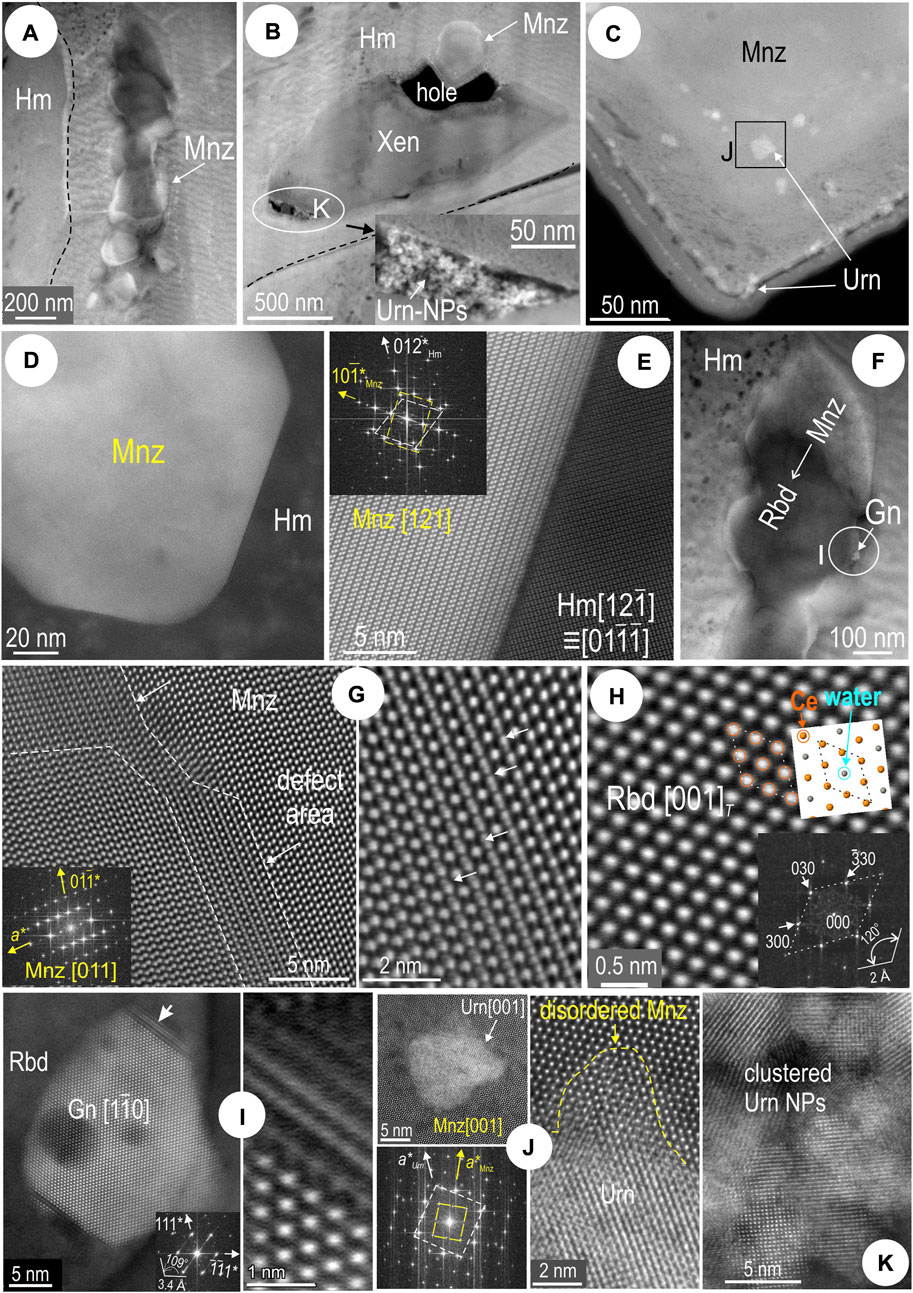
FIGURE 13. HAADF STEM images of inclusions in hematite (Hm) from sample 3Ta (foil Hm#2). Zone axes given in square brackets and orientation as FFT patterns (insets). (A) Monazite (Mnz) string (mapped in Figure 12A) along lamellae boundaries. Note a “streaky” fabric in hematite. (B) Xenotime (Xen) with marginal monazite (top) and uraninite (Urn) (bottom and inset). (C) Uraninite NPs in monazite from grain at the top of xenotime. (D,E) Congruent boundary between monazite and hematite. (F) Contrast changes in monazite undergoing transformation rhabdophane (Rbd). Gn─galena. (G) High-resolution images of defect area within monazite. (H) Atomic-scale image and FFT pattern allowing identification as rhabdophane. The structure model (inset) shows a rhombic motif of Ce atoms with “water” at the centre, absent on the image (Ce atom overlay). (I) Detail of galena NP shown in (F). (J) Single uraninite NP with disordered monazite in boundary domain. (K) Clustered uraninite NPs [from inset in (B)].
Some monazite grains display a change in contrast across a single crystal (darkening on HAADF images; Figure 13F). Defects are present in an area close to the grain edge (Figure 13G). The same grain shows zone axes which could not be resolved using the monazite structure but rather to the trigonal structure of the hydrated REE-phosphate rhabdophane, REEPO4.0.5H2O (Figure 13H). The crystal structural model on rhabdophane [001] shows that the H2O position is occupied by a lanthanide. Although the presence of zeolitic water is considered necessary to stabilize the rhabdophane structure (Mooney, 1950), we can reasonably infer a transition from monoclinic monazite (P21/n) to an as-yet-unnamed anhydrous trigonal rhabdophane-like phase (P3121). We note, however, that an anhydrous phase with hexagonal symmetry was obtained in the temperature range 100–400°C during heating experiments studying the transition of the proposed rhabdophane-like phase to monazite (Clavier et al., 2011, and references therein).
The edges of the galena inclusion show disordered intergrowths with the rhabdophane phase (Figure 13I). Coherent crystallization of uraninite NPs and monazite is associated with incipient metamictization seen as localized disordering of the host monazite lattice (Figure 13J). The smallest uraninite NPs imaged from clusters along the xenotime margins (Figure 13K), as well as the size and morphology of the xenotime, suggest this may be the result of replacement of pre-existing zircon rather than the result of co-crystallization with monazite.
Relationships between REE-minerals and hematite reveal a prolonged history of co-crystallization as exemplified by high-magnification imaging and mapping of sample OD10. A 7 μm-long string of florencite grains occurs at the hematite-bornite boundary at sample surface but deviates from the boundary between the two minerals at depth (foil 10OD Hm#3; Figure 9H). In turn, the florencite hosts new-formed hematite ranging in size from NPs to fine particles (Figures 14A–C). STEM EDS mapping reveals a distinctive carbon substrate within the largest florencite grain (∼2 μm in diameter) at the direct contact to the porous hematite (Figure 14A). Small areas from this florencite also show measurable concentrations of Fe and U (Figure 14B). The smallest hematite grain (<50 nm) is seen within a florencite grain without any obvious C substrate (Figure 14C). Mapping also shows compositional zoning with respect to Sr, F, and Na within one of the smallest florencite grains (Figure 14D).

FIGURE 14. Images and STEM EDS element maps of florencite (Flo) from sample 10OD (foil Hm#3). (A) Hematite (Hm) inclusions in coarse florencite with “holey” texture. This corresponds to the conspicuous pattern visible on the C map. (B) Heterogeneity in florencite from (A) mapped as Fe and U. (C) Hematite NP mapped in florencite. (D) Zonation patterns (distribution of P, Sr, F, and Na) in one of the florencite fine particles.
The two florencite grains hosting hematite (Figures 15A,B) are positioned ∼2 μm apart from one another. The florencite forming a mesh within the C substrate is crystalline and can be imaged and indexed (Figure 15C). The C substrate cannot be explained by sample contamination or other type of artefact but may instead reflect partial decomposition or alteration of florencite at the direct contact to hematite. This contact is marked by thin slivers of chlorite and abundant pores in the hematite implying fluid percolation after florencite formed. Further evidence for a post-crystallization overprint is seen in the formation of muscovite as sets of needles, a few nm in width, affecting the lower part of the hematite grain, a domain that is also Cu-bearing (Figure 15D). Imaging and indexing of hematite at the contact with the K-bearing needles (muscovite?) show this is represented by the O-deficient, two-fold hematite superstructure (Figures 15E,F). The hematite NP is located along a misorientation domain boundary in florencite (Figures 15B,G). Epitaxial growth is documented for the hematite and the host florencite domain (Figure 15H–L). High-resolution imaging shows the same two-fold superstructure throughout the hematite NP (Figure 15J–L). Potentially, this hematite is REE-bearing, resulting in a slight distortion (and increase in intensity) of the Fe atom dumbbells on the image relative to the crystal model for the superstructure (Figure 15K).
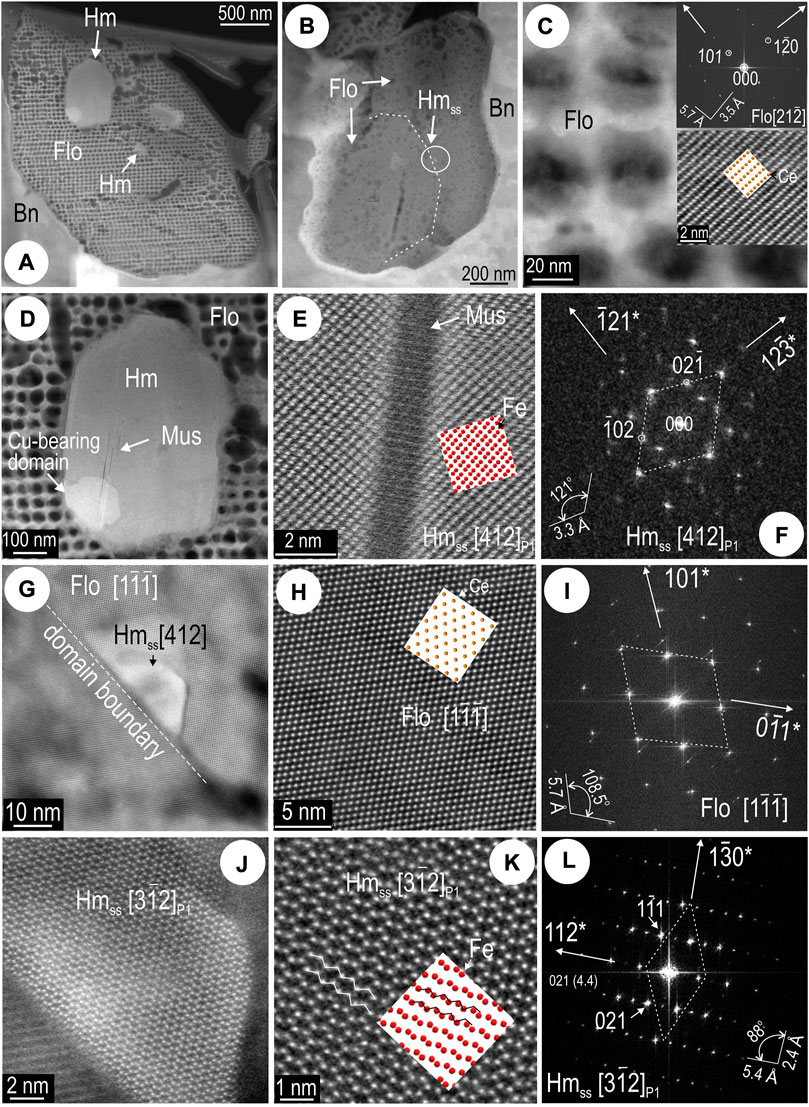
FIGURE 15. HAADF STEM images of florencite (Flo) and hematite (Hm) from sample 10OD (foil Hm#3). Zone axes given in square brackets and atom models as overlays. (A) Largest and (B) smallest hematite inclusions in florencite. (C) Image and FFT pattern of florencite from the grain partially decomposed in (A). FFT pattern and image detail shown as insets. (D) Hematite [from (A)] with nm-wide lamellae of muscovite (Mus). (E,F) High-resolution image and FFT patters showing superstructuring in hematite (Hmss) on the sides of the muscovite lamella [detail from (D)]. (G) Hematite NP at domain boundary within florencite. (H,I) Atom-scale image and FFT pattern of host florencite. Images (J,K) and FFT pattern (L) showing that the hematite in the NP from (G) is the 2-fold superstructure (Hmss).
Silician magnetite (∼50 ppm U) and hematite from the outer shell at Olympic Dam have been dated at ∼1.76 and ∼1.6 Ga, respectively, using U-Pb techniques (Courtney-Davies et al., 2020a). The authors concluded that the magnetite was inherited from Fe-rich horizons within (meta)sedimentary sequences affected by hydrothermal fluids derived from granites emplaced at ∼1.75 Ga, thus prior to the major IOCG mineralizing event at ∼1.6 Ga linked to extensive magmatism during emplacement of the Gawler LIP. The ∼1.6 Ga event would have contributed significantly to the REY and U budget in Si-magnetite and hematite, respectively. The wide range of micron–to–nanoscale textures in Fe-oxides that have undergone cycles of interconversion (Figures 1–8, Supplementary Figures S1–S4) is typical of the Fe-oxides in the outer shell (Verdugo-Ihl et al., 2020), further supporting such a multi-stage evolution.
The abundance of magnetite inclusions in the coarsest hematite (Figures 4C,D,H,I) indicates a crystallization history in which fine-grained martite undergoes coarsening towards formation of lamellar aggregates (Figures 1D,G). During that process, hematite becomes enriched in granitophile elements (Supplementary Table S2), seen as discrete NPs and fine particles of uraninite, scheelite, and cassiterite (Figures 4C,J–M, Supplementary Figures S1, S4). This enrichment process is tied to re-mobilization of elements from pre-existing magnetite (inclusions of uraninite in relict magnetite; Figure 7A). Fluid percolation facilitates redistribution of U, W, and Sn within the same grains, leading to formation of pore-attached NPs (Figure 4M). Measured REY concentrations in the hematite aggregates (Supplementary Table S2) can be tied to particles that contain U, W, and Sn (Figure 7). The coherency of the distinctive chondrite-normalized trends fractionation for hematite in this sample (Figure 2A) can be explained by the fact that such inclusions host both LREEs and HREEs (Figures 2C, 7). Downhole LA-ICP-MS depth profiles also show a strong association between U and HREEs (Figure 2C). Formation of new magnetite, either as euhedral grains (Figure 4H), or epitaxial needle growth (Figure 4D), as well as ferberite, indicates that changes of f O 2 were only subtle, and still within field of magnetite+hematite co-stability. The origin of hematite can be tracked to the initial silician magnetite which is preserved as thin slivers between the hematite lamellae (Supplementary Figures S1A, S4C).
Comparable REY fractionation trends have been shown for mm-sized lamellar hematite of similar habit and polygranular internal textures occurring within the deposit and in the outer shell, which have been interpreted to represent pseudomorphic replacement of pre-existing carbonates (Verdugo-Ihl et al., 2017; Verdugo-Ihl et al., 2020). Hematite lacking uraninite NPs, or nanoscale inclusions containing other granitophile elements is oscillatory zoned with respect to U-(Pb)-W-Sn-Mo (Ciobanu et al., 2013). This type of zoned hematite has been dated from Olympic Dam and other prospects in the same province using U-Pb LA-ICP-MS techniques (Ciobanu et al., 2013; Courtney-Davies et al., 2020a) and high-precision ID-TIMS methods (Courtney-Davies et al., 2019b; 2020b). Zoned U-bearing hematite is also present throughout the outer shell yielding an ID-TIMS age of 1591.27 ± 0.89 Ma (Courtney-Davies et al., 2020b). The chondrite-normalized REY patterns are concave yet lack any marked HREE enrichment (Verdugo-Ihl et al., 2020) and are thus distinct from the unzoned, U-bearing hematite considered here.
Silician magnetite, although containing lesser U, has the highest REY concentrations, an order of magnitude higher than co-existing hematite (Supplementary Table S2). Although none of the nanoscale defects in magnetite (Figure 6, Supplementary Figures S2, S3) host measurable REY concentrations according to the present data, identification of discrete REE-NPs within mottled areas undergoing laminae modification (inclusion-free) suggest they belong to the range of micro-textures supporting and/or defining REY redistribution during interconversion among Fe-oxides (e.g., formation of cerianite during martitization; Figure 5C). These defects further promote alteration as the IOCG system evolves, e.g., formation of muscovite along the 2d111 rods (Figures 6A,B).
In contrast to the larger aggregates of hematite and magnetite, the domains containing fine-grained Fe-oxides and abundant REE-minerals, particularly monazite, were likely more intensively affected by fracture-driven fluid percolation resulting in formation of larger cavities. The coarsest REE-inclusions (BSG minerals and monazite; Supplementary Figures S1G,I) represent mineral deposition in such cavities. Evidence for chemical disequilibrium during this stage is the formation of the O-deficient superstructure in hematite (Figures 4E–G) and lattice-scale disorder in bastnäsite-synchysite intergrowths (Figures 8G,H; Ciobanu et al., 2022a).
Isobaric-isothermal phase diagrams considering Ca2+, F− and CO32- activities show that bastnäsite but also Ca-bearing REE-fluorocarbonates such as synchysite may coexist with fluocerite (Williams-Jones and Wood, 1992; Gysi and Williams-Jones, 2015), as seen here from REE-inclusion speciation in areas of martitization (Supplementary Figures S1F,G). Moreover, discrete BSG phases cannot be transformed into one another by change in aF−, while keeping aCa2+ and aCO32- constant (Williams-Jones and Wood, 1992), implying that the lattice-scale intergrowths illustrated here are primary.
Hematite from the mineralized breccias shows instead highest REY concentrations (Supplementary Table S3) attributable to the presence of discrete particles (Figures 9–15, Supplementary Figure S5). The diverse range of REE-minerals, including F-bearing species (fluocerite), their variation in size, and their association with sulphides, Fe-As-phosphates, and Si-bearing NPs, suggests crystallization from volatile rich-fluids upon supersaturation, as exemplified by the fine-grained hematite in the “rusty hematite breccias” (Figures 10A,B). Composite fluid inclusions containing REE-bearing NPs attached to bubble walls in composite daughter mineral associations, including arsenopyrite, infer that devolatilization accompanied ore deposition at this stage. Copper sulfides associated with monazite inclusions in hematite (Figure 10D) further emphasize the correlation between deposition of REEs and sulfides in the hematite breccias. Fluid inclusions were also documented in Cu-As-zoned hematite from Olympic Dam (Verdugo-Ihl et al., 2019).
Co-crystallization of binary inclusions shows preferential partitioning of La into fluocerite relative to monazite (Figure 10C). Crystal-structural flexibility of the phosphate (Clavier et al., 2011) allows incorporation of F-bearing layers of fluocerite of monazite as lattice-scale disorder (Figures 11G,H). Likewise, the O-deficient superstructure occurs throughout hematite lamellae populated by inclusions, indicating crystal-structure modularity of the Fe-oxide in response to strain-induced NP formation (Figure 11C).
It is interesting to note that florencite, the Al-bearing phosphate, occurs only outside hematite (Figure 11A), whereas fluocerite is present both outside and within (Figures 11D,F). The REE-species outside hematite are tied to mutual boundaries between Fe-oxide and quartz (Figures 11A,D), implying that although REE absorption onto oxide surfaces may be plausible in some pedogenetic processes (Laveuf and Cornu, 2009, and references therein), this is unlikely to be the case here.
The lack of florencite within hematite from the rusty breccia is not due to crystal-structural incompatibility, since hematite inclusions in florencite are identified from high-grade ores (Figures 14A–C, Figures 15A,B). Such differences may be explained by variability in fluid parameters. For example, the stability of hematite in bornite from high-grade ores has been constrained from numerical modelling of REE fractionation trends of fluorapatite at high pH (∼7.5 at 300°C; Krneta et al., 2018). Otherwise, formation of the hematite-sericite stage in the orebody (sericite being a term commonly used for very fine-grained, aggregates of white or colorless micas, typically made of muscovite, with illite, or paragonite), is modelled at weakly acidic pH (<5) at 300°C (Verdugo-Ihl et al., 2020a). As in the cases above, superstructuring of hematite hosted by florencite further underlines that the Fe-oxide lattice can accommodate strain-induced modifications associated with muscovite formation (Figures 15D–F) or REE-incorporation (Figures 15J–L).
In contrast to the REE-mineral inclusions formed in situ by discharge of hydrothermal fluids in the rusty hematite, hematite in the steely breccias represents the opposite case, represented by a single, dominant type of REE-inclusion, monazite (Figures 12A,B, Supplementary Figures S5C,D). Here, however, monazite formation can be attributed to an overprinting episode in which fluids percolating through the hematite generated porosity and monazite precipitation along lamellae boundaries (Figure 9F). It is likely that monazite, otherwise a rare species in the mineralized breccias at Olympic Dam, could have formed via coupled dissolution-reprecipitation (CDR) reactions between pre-existing hematite and later fluids. This type of reaction advances via transient porosity (Putnis, 2004) and can lead to inclusions effectively clogging the pores as fluid-mineral interaction ceases. We cannot unequivocally constrain whether the lanthanides and Y were remobilized from host hematite or introduced from fluids, but the higher U content in monazite from this sample (Figure 12A) relative to that in the rusty breccia further supports CDR-driven reaction rather than hematite-monazite co-crystallization. Further overprinting of monazite results in lattice-scale disorder, formation of rhabdophane (Figures 13F–H), as well as galena and uraninite NPs during radiogenic decay (Figures 13I–K).
Identifying whether a given trace or minor element, or group of elements, occurs in solid solution or as finely disseminated NPs of discrete minerals is a question that has long fascinated mineralogists (Cook et al., 2016). If the particles of an included mineral are sufficiently fine-grained, regularly sized and homogeneously distributed throughout the host, steady signals on time-resolved LA-ICP-MS depth profiles do not necessarily imply structurally-bound incorporation. For example, the case of measured Zr in hematite, in which high-resolution TEM studies revealed pervasive NPs of baddeleyite through the host (Keyser et al., 2019a). The simple rule is always to check for nanoinclusions whenever there is doubt (e.g., when concentrations vary significantly from analytical spot to spot without obvious mineral zoning, or where an apparently incorporated element would seem to be incompatible on crystal-structural grounds), although this is seldom done in practice. For many practical purposes, elucidation of structurally-bound vs. NP-hosted concentrations does not matter unduly (Cook et al., 2022). In some cases, including “invisible gold” in common sulfides, measured concentrations may represent a combination of both modes of occurrence, as indeed recently shown for pyrite-hosted gold at Olympic Dam (Ehrig et al., 2023 in press).
Quantifying the size and density of included NPs in an analyzed volume needed to attain measured concentrations and explain irregularities on time-resolved LA-ICP-MS profiles is a complex exercise based upon assumptions that are often difficult or impossible to verify directly. However, by combining the LA-ICP-MS and nanoscale data, we can derive simplified calculations to correlate measured values with observed particles (Supplementary Table S4).
Assuming a cylinder-shaped LA-ICP-MS analysis volume of 31,222 μm3 (diameter 43 μm, crater depth 21.5 μm), a hypothetical 1,561 foils with dimensions of 20 × 10 × 0.1 μm would be required to fill that volume. If we consider the (nano)particles as spheres with radii in the range 10–200 nm and an average REE concentration of 55%, we can estimate the number of particles that would account for the concentrations in the Fe-oxides measured by LA-ICP-MS. Furthermore, assuming that these particles are randomly distributed in 3D throughout the volume of a single foil, as well as in 2D on the observed foil surface, we can show that the estimated inclusion densities in hematite from the rusty and steely breccias broadly match the density of observed REE-inclusions. A best fit scenario would be for REE-particles with an average radius of 200 nm, i.e., 27 particles of monazite would give 25,000 ppm ΣREY in foil 3Ta-Hm, and 7.6 particles of florencite, fluocerite and monazite would give 7,000 ppm ΣREY in foil 1T-Hm. In contrast, the results for silician magnetite show that many more particles should be present than are actually observed. No less than 434 particles, each with a radius of 20 nm, would be required to give the ∼400 ppm ΣREY measured in CLC21-Mt-3. Excluding the large BSG lamella, the only REE inclusion observed was a cerianite NP, ∼20 nm in length (Figures 5B,C). Although indirect evidence, this implies that structurally-bound LREEs must be present in silician magnetite, an interpretation supported by the STEM EDS map in Figure 5A. Applying similar arguments to hematite with lower REE concentration (∼35 ppm), the number and abundance of uraninite NPs observed in foil CLC21-Hm is sufficient to account for the measured concentration, even when considering that uraninite contains only around 5% REEs.
Nanoscale mineral inclusions identified include REE-minerals common in the deposit such as florencite, xenotime, and monazite, but also less abundant minerals such as cerianite, fluocerite, and rhabdophane. Other significant NP hosts for REEs include uraninite (with characteristic HREE enrichment), scheelite and ferberite. Variation in inclusion speciation contributes to the diverse REE fractionation patterns.
Inclusion-hosted REEs were either formed from discharge of high-volatile fluids or were initially present within primary hydrothermal Fe-oxides and subsequently released and reprecipitated following superimposed fluid-assisted overprinting. Incorporation and release of trace elements during overprinting events show a preferential partitioning of REEs into magnetite and the association U-W-Sn into co-existing hematite. Hematite from mineralized breccias hosts abundant monazite nanoinclusions. Transient porosity created during CDR reactions promote formation of REE-minerals in Fe-oxides. The discharge of volatile-rich fluids, possibly at multiple stages during ore formation, results in co-crystallization of a wide variety of REE-minerals together with hematite. Conversely, REE-minerals such as florencite can host nanoinclusions of hematite. Magnetite is the better host for lattice-bound REEs than hematite. However, the two-fold superstructure of hematite with ordered O vacancies (Verdugo-Ihl et al., 2020b) is a common crystal structural modification and supports (re)mobilization of REEs and other trace elements in this Fe-oxide.
Although the data presented here is specific to the Olympic Dam deposit, there are broad implications for IOCGs elsewhere, and for other deposit types. We show that Fe-oxides carry REEs, both structurally-bound, and within nm- to μm-sized inclusions of discrete REE- and REE-bearing minerals and that, in magnetite, REEs are incorporated within the structure. A wide variation in inclusion speciation contributes to diverse REE fractionation patterns. These observations emphasize the contribution of fluid-assisted overprinting events at Olympic Dam to observed features, here causing release of REEs from Fe-oxides and reprecipitation as discrete REE-minerals as inclusions within the source host or at grain boundaries.
Although oxide-bound REEs are unlikely to account for a major proportion of the overall REE budget in the ores, they deserve consideration when designing strategies for recovery of REE from, for example, flotation tailings, and given the persistent association of REEs with U (and Th), for generation of clean concentrates. More broadly, the findings described here carry implications for REE recovery from a wide range of ores and wastes in which Fe-oxides dominate, including lateritic REE resources, and equally importantly, from future targets for REE recovery such as red muds from alumina production.
The original contributions presented in the study are included in the article/Supplementary Material, further inquiries can be directed to the corresponding author.
NC and CC conceptualized this work with advice and guidance from KE. KE assisted with sample selection and collection. FIB-SEM work was undertaken by CC, nanoscale analysis was performed by CC and AS, and LA-ICP-MS analysis by CC and SG. All authors contributed to writing, figure preparation, and editing of the manuscript.
This research was funded by Australian Research Council Linkage grant LP200100156 (Critical Metals from Complex Copper Ores), co-supported by BHP Olympic Dam. We also acknowledge support from the Premier’s Research and Industry Fund Research Consortia Program “Unlocking Complex Resources through Lean Processing”.
The authors acknowledge the staff of Adelaide Microscopy (University of Adelaide) for assistance and encouragement. Microscopy Australia are thanked for access to FEI Titan Themis instrumentation. We appreciate the constructive comments of three reviewers and Editor AC.
Author KE is an employee of BHP Olympic Dam.
The remaining authors declare that the research was conducted in the absence of any commercial or financial relationships that could be construed as a potential conflict of interest.
All claims expressed in this article are solely those of the authors and do not necessarily represent those of their affiliated organizations, or those of the publisher, the editors and the reviewers. Any product that may be evaluated in this article, or claim that may be made by its manufacturer, is not guaranteed or endorsed by the publisher.
The Supplementary Material for this article can be found online at: https://www.frontiersin.org/articles/10.3389/feart.2022.967189/full#supplementary-material
1Supplementary Figures S1-S6 are located in the Datasheet included in the Supplementary materials for this article.
Abaka-Wood, G. B., Zanin, M., Addai-Mensah, J., and Skinner, W. (2019). Recovery of rare Earth elements minerals from iron oxide–silicate rich tailings – Part 1: Magnetic separation. Min. Eng. 136, 50–61. doi:10.1016/j.mineng.2019.02.026
Abaka-Wood, G. B., Zanin, M., Addai-Mensah, J., and Skinner, W. (2018). The upgrading of rare Earth oxides from iron-oxide silicate rich tailings: Flotation performance using sodium oleate and hydroxamic acid as collectors. Adv. Powder Technol. 29, 3163–3172. doi:10.1016/j.apt.2018.08.019
Bhuiyan, T. I., Nakanishi, M., Fujii, T., and Takada, J. (2007). Structure, morphology and color tone properties of the neodymium substituted hematite. Mem. Fac. Eng., Miyazaki Univ. 41, 93–98.
Boutroy, E., Dare, S. A. S., Beaudoin, G., Barnes, S-J., and Lightfoot, P. C. (2014). Magnetite composition in Ni-Cu-pge deposits worldwide: Application to mineral exploration. J. Geochem. Explor. 145, 64–81. doi:10.1016/j.gexplo.2014.05.010
Bowles, J. F. W., Howie, R. A., Vaughan, D. J., and Zussman, J. (2011). Non-silicates: Oxides, hydroxides and sulphides. Rock-forming minerals, 5A. London: Geological Society.
Ciobanu, C. L., Cook, N. J., and Ehrig, K. (2015). “Trace element concentrations in iron oxides from Olympic Dam, South Australia,” in Proceedings of the Mineral Resources in a Sustainable World, Proceedings, 13th Biennial SGA Meeting, Nancy, France, 24-27 August 2015, 1071–1074.3
Ciobanu, C. L., Cook, N. J., Maunders, C., Wade, B. P., and Ehrig, K. (2016). Focused ion beam and advanced electron microscopy for minerals: Insights and outlook from bismuth sulphosalts. Minerals 6, 112. doi:10.3390/min6040112
Ciobanu, C. L., Cook, N. J., Pring, A., and Green, L. (2011). Focussed ion beam - transmission electron microscopy applications in ore mineralogy: Bridging micron- and nanoscale observations. Ore Geol. Rev. 42, 6–31. doi:10.1016/j.oregeorev.2011.06.012
Ciobanu, C. L., Cook, N. J., Slattery, A. D., Ehrig, K., and Liu, W. Y. (2022a). Nanoscale intergrowths in the bastnäsite–synchysite series record transition toward thermodynamic equilibrium. MRS Bull. 47, 250–257. doi:10.1557/s43577-022-00318-1
Ciobanu, C. L., Kontonikas-Charos, A., Slattery, A., Cook, N. J., Ehrig, K., and Wade, B. P. (2017). Short-range stacking disorder in mixed-layer compounds: A HAADF STEM study of bastnäsite-parisite intergrowths. Minerals 7, 227. doi:10.3390/min7110227
Ciobanu, C. L., Verdugo-Ihl, M. R., Cook, N. J., Ehrig, K., Slattery, A., and Courtney-Davies, L. (2022b). Ferro-tschermakite with polysomatic chain-width disorder identified in silician magnetite from Wirrda Well, South Australia: A HAADF STEM study. Am. Mineral. 107, 765–777. doi:10.2138/am-2022-7975
Ciobanu, C. L., Verdugo-Ihl, M. R., Slattery, A., Cook, N. J., Ehrig, K., Courtney-Davies, L., et al. (2019). Silician magnetite: Si–Fe-Nanoprecipitates and other mineral inclusions in magnetite from the Olympic Dam deposit, South Australia. Minerals 9, 311. doi:10.3390/min9050311
Ciobanu, C. L., Wade, B. P., Cook, N. J., Schmidt Mumm, A., and Giles, D. (2013). Uranium-bearing hematite from the Olympic Dam Cu-U-Au deposit, South Australia: A geochemical tracer and reconnaissance Pb-Pb geochronometer. Precambrian Res. 238, 129–147. doi:10.1016/j.precamres.2013.10.007
Clavier, N., Podor, R., and Dacheux, N. (2011). Crystal chemistry of the monazite structure. J. Eur. Ceram. Soc. 31, 941–976. doi:10.1016/j.jeurceramsoc.2010.12.019
Cook, N. J., Ciobanu, C. L., Ehrig, K., Slattery, A., Verdugo-Ihl, M. R., Courtney-Davies, L., et al. (2017). Advances and opportunities in ore mineralogy. Minerals 7, 233. doi:10.3390/min7120233
Cook, N. J., Ciobanu, C. L., George, L., Zhu, Z. Y., Wade, B., and Ehrig, K. (2016). Trace element analysis of minerals in magmatic-hydrothermal ores by laser ablation inductively-coupled plasma mass spectrometry: Approaches and opportunities. Minerals 6, 111. doi:10.3390/min6040111
Cook, N. J., Ciobanu, C. L., Verdugo-Ihl, M. R., Courtney-Davies, L., Ehrig, K., Li, W., et al. (2022). “Trace elements in minerals: Where do we stand on the road between the holy grail and a can of worms?,” in Proc. 16th SGA Bienn. Meet, Rotorua, New Zealand. Editor A. B. Christie (Society for Geology Applied to Mineral Deposits), 1, 65–68
Cornell, R. M., and Schwertmann, U. (1996). The iron oxides: Structure, properties, reactions, occurrence and uses. Weinheim and New York: VCH, 573.
Courtney-Davies, L., Ciobanu, C. L., Tapster, S. R., Cook, N. J., Ehrig, K., Crowley, J. L., et al. (2020b). Opening the magmatic-hydrothermal window: High-precision U-Pb geochronology of the mesoproterozoic Olympic Dam Cu-U-Au-Ag deposit, South Australia. Econ. Geol. 115, 1855–1870. doi:10.5382/econgeo.4772
Courtney-Davies, L., Ciobanu, C. L., Verdugo-Ihl, M. R., Cook, N. J., Ehrig, K., Wade, B. P., et al. (2020a). ∼1760 Ma magnetite-bearing protoliths in the Olympic Dam deposit, South Australia: Implications for ore Genesis and regional metallogeny. Ore Geol. Rev. 118, 103337. doi:10.1016/j.oregeorev.2020.103337
Courtney-Davies, L., Ciobanu, C. L., Verdugo-Ihl, M. R., Dmitrijeva, M., Cook, N. J., Ehrig, K., et al. (2019a). Hematite geochemistry and geochronology resolve genetic and temporal links among iron-oxide copper gold systems, Olympic Dam district, South Australia. Precambrian Res. 335, 105480. doi:10.1016/j.precamres.2019.105480
Courtney-Davies, L., Tapster, S. R., Ciobanu, C. L., Cook, N. J., Verdugo-Ihl, M. R., Ehrig, K. J., et al. (2019b). A multi-technique evaluation of hydrothermal hematite U-Pb isotope systematics: Implications for ore deposit geochronology. Chem. Geol. 513, 54–72. doi:10.1016/j.chemgeo.2019.03.005
Ehrig, K., Ciobanu, C. L., Verdugo-Ihl, M. R., Dmitrijeva, M., Cook, N. J., and Slattery, A. (2023). Lifting the cloak of invisibility: Gold in pyrite from the Olympic Dam Cu-U-Au-Ag deposit, South Australia. Am. Mineral. in press. doi:10.2138/am-2022-8395
Ehrig, K., McPhie, J., and Kamenetsky, V. (2012). “Geology and mineralogical zonation of the Olympic Dam iron oxide Cu-U-Au-Ag deposit, South Australia,” in Geology and genesis of major copper deposits and districts of the world: A tribute to richard H. Sillitoe. Soc. Econ. Geol. Editors J. W. Hedenquist, M. Harris, and F. Camus (United Kingdom: Spec. Publ.), 16, 237–267.
Freyria, F. S., Barrera, G., Tiberto, P., Belluso, E., Levy, D., Saracco, G., et al. (2013). Eu-doped α-Fe2O3 nanoparticles with modified magnetic properties. J. Solid State Chem. 201, 302–311. doi:10.1016/j.jssc.2013.03.018
Frietsch, R., and Perdahl, J.-A. (1995). Rare Earth elements in apatite and magnetite in Kiruna-type iron ores and some other iron ore types. Ore Geol. Rev. 9, 489–510. doi:10.1016/0169-1368(94)00015-g
Gysi, A. P., and Williams-Jones, A. E. (2015). The thermodynamic properties of bastnäsite-(Ce) and parisite-(Ce). Chem. Geol. 392, 87–101. doi:10.1016/j.chemgeo.2014.11.001
Helvaci, C. (1987). Rare Earth elements in apatite-rich iron deposits and associated rocks of the Avnik (Bingöl) region, Turkey. Schweiz. Mineral. Petrogr. mitt. 67, 309–319.
Hoernes, S., Friedrichsen, H., and Schock, H. H. (1979). Oxygen- and hydrogen-isotope and trace-element investigation on rocks of the DSDP hole 395 A, Leg 45. Init. Rep. Deep Sea Drill. Proj. 45, 541–550.
Keyser, W., Ciobanu, C. L., Cook, N. J., Feltus, H., Johnson, G., Slattery, A., et al. (2019a). Mineralogy of zirconium in iron-oxides: A micron- to nanoscale study of hematite ore from Peculiar Knob, South Australia. Minerals 9, 244. doi:10.3390/min9040244
Keyser, W., Ciobanu, C. L., Ehrig, K., Dmitrijeva, M., Wade, B. P., Courtney-Davies, L., et al. (2022). Skarn-style alteration in proterozoic metasedimentary protoliths hosting IOCG mineralization: The Island Dam prospect, South Australia. Min. Depos. 57, 1227–1250. doi:10.1007/s00126-022-01096-1
Keyser, W. M., Ciobanu, C. L., Cook, N. J., Johnson, G., Dmitrijeva, M., Courtney-Davies, L., et al. (2019b). Iron-oxides constrain BIF evolution in terranes with protracted geological histories: The Iron Count prospect, Middleback Ranges, South Australia. Lithos 324-325, 20–38. doi:10.1016/j.lithos.2018.10.035
Krneta, S., Ciobanu, C. L., Cook, N. J., Ehrig, K., and Kontonikas-Charos, A. (2017). Rare Earth element behaviour in apatite from the Olympic Dam Cu-U-Au-Ag deposit, South Australia. Minerals 7, 135. doi:10.3390/min7080135
Krneta, S., Ciobanu, C. L., Cook, N. J., and Ehrig, K. (2018). Numerical modeling of REE fractionation patterns in fluorapatite from the Olympic Dam deposit (South Australia). Minerals 8, 342. doi:10.3390/min8080342
Laveuf, C., and Cornu, S. (2009). A review on the potentiality of Rare Earth Elements to trace pedogenetic processes. Geoderma 154, 1–12. doi:10.1016/j.geoderma.2009.10.002
Macmillan, E., Cook, N. J., Ehrig, K., Ciobanu, C. L., and Pring, A. (2016). Uraninite from the Olympic Dam IOCG-U-Ag deposit: Linking textural and compositional variation to temporal evolution. Am. Mineral. 101, 1295–1320. doi:10.2138/am-2016-5411
Makvandi, S., Huang, X., Beaudoin, G., Quirt, D., Ledru, P., and Fayek, M. (2021). Trace element signatures in hematite and goethite associated with the Kiggavik–Andrew Lake structural trend U deposits (Nunavut, Canada). Min. Depos. 56, 509–535. doi:10.1007/s00126-020-00980-y
McDonough, W. F., and Sun, S.-S. (1995). The composition of the Earth. Chem. Geol. 120, 223–253. doi:10.1016/0009-2541(94)00140-4
Mohapatra, M., Sahoo, S. K., Mohanty, C. K., Das, R. P., and Anand, S. (2005). Effect of Ce(IV) doping on formation of goethite and its transformation to hematite. Mat. Chem. Phys. 94, 417–422. doi:10.1016/j.matchemphys.2005.05.024
Moon, J.-W., Roh, Y., Yeary, L. W., Lauf, R. J., Rawn, C. J., Love, L. J., et al. (2007). Microbial formation of lanthanide-substituted magnetites by Thermoanaerobacter sp. TOR-39. Extremophiles 11, 859–867. doi:10.1007/s00792-007-0102-1
Mooney, R. C. L. (1950). X-ray diffraction study of cerous phosphate and related crystals. I. Hexagonal modification. Acta Crystallogr. 3, 337–340. doi:10.1107/s0365110x50000963
Owen, N. D., Cook, N. J., Rollog, M., Ehrig, K. J., Schmandt, D. S., Ram, R., et al. (2019). REE-Sr- Ca-aluminum-phosphate-sulfate minerals of the alunite supergroup and their role as hosts for radionuclides. Am. Mineral. 104, 1806–1819. doi:10.2138/am-2019-7116
Paster, T. P., Schauwecker, D. S., and Haskin, L. A. (1974). The behavior of some trace elements during solidification of the Skaergaard layered series. Geochim. Cosmochim. Acta 38, 1549–1577. doi:10.1016/0016-7037(74)90174-4
Pramanik, N. C., Bhuiyan, T. I., Nakanishi, M., Fujii, T., Takada, J., and Seok, S. I. (2005). Synthesis and characterization of cerium substituted hematite by sol-gel method. Mat. Lett. 29, 3783–3787. doi:10.1016/j.matlet.2005.06.056
Schmandt, D. S., Cook, N. J., Ciobanu, C. L., Ehrig, K., Wade, B. P., Gilbert, S., et al. (2017). Rare Earth element fluorocarbonate minerals from the Olympic Dam Cu-U-Au-Ag deposit, South Australia. Minerals 7, 202. doi:10.3390/min7100202
Schmandt, D. S., Cook, N. J., Ciobanu, C. L., Ehrig, K., Wade, B. P., Gilbert, S., et al. (2019). Rare Earth element phosphate minerals from the Olympic Dam Cu-U-Au-Ag deposit, South Australia: Recognizing temporal-spatial controls on REE mineralogy in an evolved IOCG systems. Can. Mineral. 57, 3–24. doi:10.3749/canmin.1800043
Schock, H. H. (1979). Distribution of rare-Earth and other trace elements in magnetites. Chem. Geol. 26, 119–133. doi:10.1016/0009-2541(79)90034-2
Selmi, M., Lagoeiro, L. E., and Endo, I. (2009). Geochemistry of hematitite and itabirite, Quadrilátero Ferrífero, Brazil. Rem. Rev. Esc. Minas 62, 35–43. doi:10.1590/s0370-44672009000100006
Verdugo-Ihl, M., Ciobanu, C. L., Cook, N. J., Ehrig, K., Slattery, A., and Courtney-Davies, L. (2020b). Trace-element remobilisation from W–Sn–U–Pb zoned hematite: Nanoscale insights into a mineral geochronometer behaviour during interaction with fluids. Mineral. Mag. 84, 502–516. doi:10.1180/mgm.2020.49
Verdugo-Ihl, M. R., Ciobanu, C. L., Cook, N. J., Ehrig, K., and Courtney-Davies, L. (2020a). Defining early stages of IOCG systems: Evidence from iron-oxides in the outer shell of the Olympic Dam deposit, South Australia. Min. Depos. 55, 429–452. doi:10.1007/s00126-019-00896-2
Verdugo-Ihl, M. R., Ciobanu, C. L., Cook, N. J., Ehrig, K., Courtney-Davies, L., and Gilbert, S. (2017). Textures and U-W-Sn-Mo signatures in hematite from the Cu-U-Au-Ag orebody at Olympic Dam, South Australia: Defining the archetype for IOCG deposits. Ore Geol. Rev. 91, 173–195. doi:10.1016/j.oregeorev.2017.10.007
Verdugo-Ihl, M. R., Ciobanu, C. L., Courtney-Davies, L., Cook, N. J., Ehrig, K., Tornos, T., et al. (2022). U-Pb geochronology and mineralogy of hematite from Mantoverde and Carmen de Cobre, northern Chile: Constraints on andean IOCG mineralization. Econ. Geol. 117, 943–960. doi:10.5382/econgeo.4903
Verdugo-Ihl, M. R., Ciobanu, C. L., Slattery, A., Cook, N. J., Ehrig, K., and Courtney-Davies, L. (2019). Copper-arsenic nanoparticles in hematite: Fingerprinting fluid-mineral interaction. Minerals 9, 388. doi:10.3390/min9070388
Williams-Jones, A. E., and Wood, S. A. (1992). A preliminary petrogenetic grid for REE fluorocarbonates and associated minerals. Geochim. Cosmochim. Acta 56, 725–738. doi:10.1016/0016-7037(92)90093-x
Keywords: hematite, magnetite, crystal structure, nanoparticles, rare earth elements, Olympic Dam, IOCG deposits
Citation: Cook NJ, Ciobanu CL, Ehrig K, Slattery AD and Gilbert SE (2022) Micron- to atomic-scale investigation of rare earth elements in iron oxides. Front. Earth Sci. 10:967189. doi: 10.3389/feart.2022.967189
Received: 12 June 2022; Accepted: 22 September 2022;
Published: 12 October 2022.
Edited by:
Antoni Camprubí, National Autonomous University of Mexico, MexicoReviewed by:
José María González-Jiménez, Andalusian Earth Sciences Institute (CSIC), SpainCopyright © 2022 Cook, Ciobanu, Ehrig, Slattery and Gilbert. This is an open-access article distributed under the terms of the Creative Commons Attribution License (CC BY). The use, distribution or reproduction in other forums is permitted, provided the original author(s) and the copyright owner(s) are credited and that the original publication in this journal is cited, in accordance with accepted academic practice. No use, distribution or reproduction is permitted which does not comply with these terms.
*Correspondence: Nigel J. Cook, bmlnZWwuY29va0BhZGVsYWlkZS5lZHUuYXU=
Disclaimer: All claims expressed in this article are solely those of the authors and do not necessarily represent those of their affiliated organizations, or those of the publisher, the editors and the reviewers. Any product that may be evaluated in this article or claim that may be made by its manufacturer is not guaranteed or endorsed by the publisher.
Research integrity at Frontiers
Learn more about the work of our research integrity team to safeguard the quality of each article we publish.