
95% of researchers rate our articles as excellent or good
Learn more about the work of our research integrity team to safeguard the quality of each article we publish.
Find out more
ORIGINAL RESEARCH article
Front. Earth Sci. , 02 September 2022
Sec. Structural Geology and Tectonics
Volume 10 - 2022 | https://doi.org/10.3389/feart.2022.966192
This article is part of the Research Topic Active Faults and Earthquake due to Continental Deformation View all 25 articles
 Yuanqian Peng1†
 Xiangyu Sun2,3†Yan Zhan2,3*
 Lingqiang Zhao4
 Quanxing Luo2,5Xuehua Liu2Zhijie Ran1Lisen Wang1
The Zhangjiakou-Bohai fault zone (ZBFZ) is an important NW-trending active tectonic zone in North China. The western section of ZBFZ is characterized by frequent moderate and strong earthquakes. This is a typical tectonic area for studying seismic and volcanic activities. The three-dimensional (3D) deep electrical structure of the region was revealed by using 3D electromagnetic inversion of 143 magnetotelluric stations. The results suggest that the deep electrical structure in the western part of the ZBFZ is laterally heterogeneous. To the north of the Shangyi-Chicheng Fault (F4), the upper crust has a high resistivity structure (R), corresponding to the exposed Hanuoba basalts and metamorphic rocks. To the south of F4, high and low resistivity zones alternate, which is attributed to the complex faults and basin-range structures. In the middle crust, the low-resistivity structures (C1 and C2) gradually appear in the northwest and southeast of the study area, showing the characteristics of a high-resistivity structure sandwiched between two low-resistivity structures. In the lower crust, the two low-resistivity structures (C1 and C2) gradually join each other and the whole region becomes characterized by low resistivity. The Shangyi-Chicheng Fault (F4), the northern margin fault of the Huai’an Basin (F7), and the northern margin fault of the Huaizhuo Basin (F11) are definite electrical difference zones, which are connected to a low-resistivity layer in the crust. The results indicate that the focal depth of the 1998 M6.2 Zhangbei earthquake was between 12 km and 15 km and its seismogenic fault was the Dahezhen-Hailiutu Fault (F3), which is concealed beneath the Hanuoba basalt area. It is speculated that owing to the neotectonic activities, the magma originated in the asthenosphere mantle rose and erupted on the surface near Datong, forming the Datong volcanic group. Then the magma continued to migrate and overflow along with the fractures in the NE direction, forming the Hannuoba basalts in the Zhangbei area. The existence of mantle thermal material in this area led to the migration of accompanying fluids to the middle and upper crust, resulting in fault sliding and frequent occurrence of moderate and strong earthquakes in this region.
The Zhangjiakou-Bohai fault zone (ZBFZ) is a vast structural belt with a width of tens of kilometers. It is one of the important NW-trending active tectonic zones in North China. It comprises a series of discontinuous, NW-trending active tectonic belts in the northern part of North China Craton and the northeastern part of Shanxi Graben (Fu et al., 2000; Figure 1A). The ZBFZ is tectonically situated in the central and eastern part of the North China Craton, which experienced destruction during the Phanerozoic (Zhu et al., 2012; Figure 1A). It extends from the west of Zhangjiakou, through the north of Beijing, Sanhe, the south of Tangshan, the south of Tianjin, to Penglai, and finally intersects with the NNE-trending Tan-Lu Fault Zone (TLFZ) in Bohai Bay. From west to southeast, the ZBFZ can be divided into the Zhangjiakou (western), Beijing (central-western), Tangshan (central-eastern) and Penglai (eastern) sections (Gao, 2001; Suo et al., 2013).
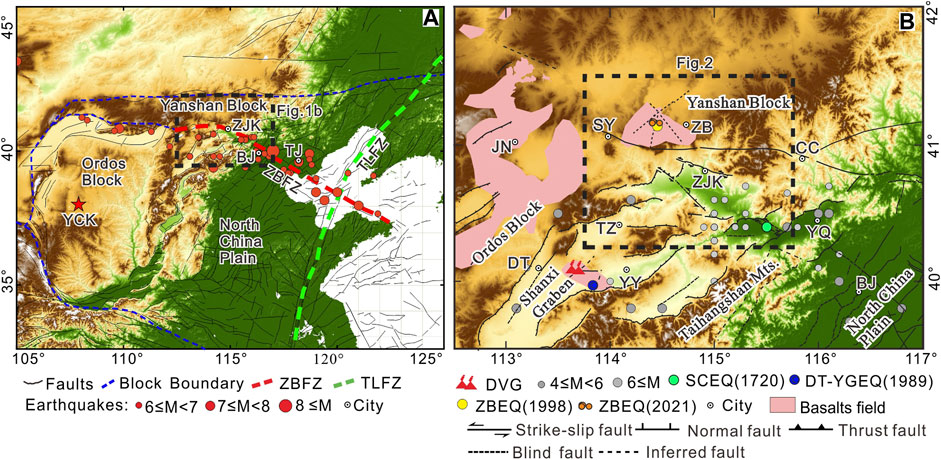
FIGURE 1. (A) Location of the study region. (B) Topographic map of the Western segment of Zhangbo fault zone. Faults are modified from Zhou (2011) and Luo et al. (2021); Moderately and strong earthquakes (BC 231-AD 2018) are from Liu et al. (2017) and Hu et al. (2021); Abbreviations are: ZBFZ, Zhangbo fault zone; TLFZ, Tanlu fault zone; DVG, Datong Volcanoes group; JN, Jining; SY, Shangyi; ZB, Zhangbei; CC, Chicheng; ZJK, Zhangjiakou; TZ, Tianzhen; YQ, Yanqing; DT, Datong; YY, Yangyuan; BJ, Beijing; YCK, Remote reference station; LPF, Langshan Piedmont fault; LHF, Linhe fault; DKF, Dengkou fault; QS, Qingshan; HJHQ, Hangjinhouqi; LH, Linhe; DK, Dengkou; WH, Wuhai; WLTHQ, Wulatehouqi; WY, Wuyuan; WLTQQ, Wulateqianqi; WLTZQ, Wulatezhongqi; HJQ, Hangjinqi.
The ZBFZ is an area of concentrated strong earthquakes and plays a significant role in controlling the distribution of moderate and strong earthquakes in North China. Since the beginning of recorded history, there have been more than 20 moderate and strong earthquakes above M6 in the middle-western and middle-eastern sections of the ZBFZ, such as the 1679 M8 Sanhe-Pinggu earthquake, 1969 M7.4 Bohai earthquake and 1976 M7.8 Tangshan earthquake (Liu et al., 1982; Xiang et al., 1988, Zhang et al., 1995; Wang et al., 2017; Figure 1A). The western section of the ZBFZ has also been seismically active since records are available, with frequent moderate and strong earthquakes above M5, such as the 1720 M6.7 Shacheng earthquake (SCEQ), 1989 M5.6–5.9 Datong-Yanggao earthquake swarm (DT-YGEQ) and 1998 M6.2 Zhangbei earthquake (ZBEQ 1998) (Xu et al., 1998; Feng et al., 2016). In recent years, moderate and small earthquakes have frequently occurred in the ZBFZ. In particular, in 2021, a significant number of moderate and small earthquakes with a magnitude of about 3 were observed near the Zhangbei seismic area, indicating that the western section of the ZBFZ has become more seismically active (Figure 1B).
The western section of the ZBFZ is also characterized by intensive volcanic activities. The Datong volcanic group (DVG) located in this area is the only volcanic group on the Loess Plateau. The basaltic magma originated from melting of the upper mantle (Deng et al., 1987; Li, 1988; Figure 1B). The volcanic activities in Datong were intermittent and lasted for a long time. The latest volcanic activity occurred in the early Late Pleistocene (Zhai et al., 2011). A study of mantle xenoliths indicates that the DVG resulted from destruction of the lithosphere and upwelling of mantle materials (Cen et al., 2015). Zhang (2021) observed that magmatic rocks are rarely found in Tianzhen and Yanggao in the northeast of the Datong volcanic area. It is speculated that magma in this area has not erupted, and there are still magma chambers or high-temperature anomalies at depth. Cenozoic fissures or overflow basalt (Hannoba basalt, HNBB) are distributed along the borders of Shangyi, Zhangbei and Zhangjiakou (Liu et al., 1992; Figure 1B). They are a result of an overflow of mantle-derived magma along the approximately EW-trending Shangyi-Chicheng Fault and the NW-trending ZBFZ. The numerous volcanic activities in the western section of the ZBFZ also strongly suggest that the crust in this area was active in the Cenozoic (Hao, 2010).
Carrying out 3D deep structure exploration of the western segment of ZBFZ and its adjacent area will help to comprehensively understand the seismogenic mechanisms and environment in the seismically active area and is practically very important for the medium and long-term seismic risk analysis in this area. The magnetotelluric method can be used for detection of even small changes in the resistivity of a rock mass. It can be successfully applied to reveal the seismogenic environment and the deep extension of fault zones. It is one of the effective means of studying the structure of moderate and strong earthquake and seismogenic environments (Tan et al., 2004; Unsworth et al., 2004; Becken et al., 2011; Zhao et al., 2012; Zhang et al., 2016; Cai et al., 2017; Yu et al., 2017; Lin et al., 2017; Zhan et al., 2017, 2021; Ye et al., 2018a; Wang et al., 2018; Yang et al., 2019; Li et al., 2021). In the past decade, moderate and strong earthquakes have occurred on the eastern edge of the Qinghai-Tibet Plateau, such as in Wenchuan, Lushan, and Jiuzhaigou. Magnetotelluric exploration has been carried out in these areas and the surrounding Longmenshan, Altyn Tagh, and Qilian-Haiyuan structural belts. It revealed the different deep resistivity structures along different sections of the active faults as well as the deep tectonic environment of a series of moderate and strong earthquakes. Literature suggests that moderate and strong earthquakes and aftershocks are closely associated with the resistivity structure of the underground medium (Zhao et al., 2012; Zhan et al., 2013; Wang et al., 2014; Xiao et al., 2017; Cai et al., 2017; Sun et al., 2019, 2020). The 3D magnetotelluric imaging before the 2021 M7.4 Maduo, 2021 M6.4 Yangbi and 2022 M6.9 Menyuan earthquakes (Ye et al., 2021; Zhan et al., 2021; Zhao et al., 2022) also showed that the seismogenic positions of these earthquakes were near the resistivity change zone in the deep medium. In addition, by using the magnetotelluric 3D electromagnetic imaging technology, Ye et al., 2018b, Ye et al., 2020 identified the 3D resistivity characteristics of the crust beneath the Tengchong volcanic belt and the distribution of magma and revealed multiple seismogenic structures in the area.
Moderate and strong earthquakes and volcanoes abound in the western section of the ZBFZ and its adjacent areas. The 3D magnetotelluric imaging technology enables determining the 3D structure of the resistivity in the deep medium in the western section of the ZBFZ, which can provide a reference for studying the material state and deep seismogenic environment in this area. Using a 3D electromagnetic inversion of 143 magnetotelluric stations, this study reveals the 3D deep electrical structure of the region, clarifies the seismogenic structure of the M6.2 Zhangbei earthquake, interprets the Zhangbei earthquake area and the deep breeding environment of the recent frequent small and medium-sized earthquakes, and provides deep data for seismic risk assessment in this area.
The study area is located at the intersection of the EW-trending Yanshan Orogen, the northeastern section of the NE-trending Shanxi fault depression belt and the NW-trending ZBFZ (Figure 1B). The geological structure and the distribution of magnetotelluric survey points in the western section of the ZBFZ are shown in Figure 2. Bounded by the approximately EW-trending Shangyi-Chicheng Fault (F4), the Yanshan Orogen is located in the north, while the complex basin-range structural area is located in the south, including the Zhangjiakou Fault (F5), Huai’an Basin (HAB), Yanggao-Tianzhen Basin (YTB), Xuanhua Basin (XHB), and Huaizhuo Basin (HZB) (Xu et al., 2002; Zhou, 2011; Peng et al., 2017; Figure 2).
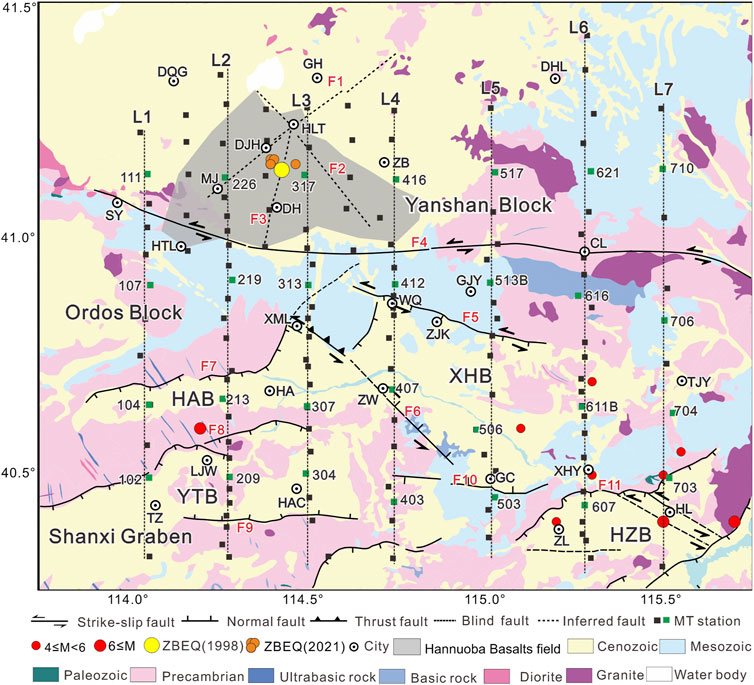
FIGURE 2. Geological setting [modified from Peng et al. (2017), Zhou (2011); Luo et al. (2021)] and MT stations in studied region. Black Squares denote MT stations; Green square denote typical MT stations in Figure 2; Abbreviations are: HAB, Huaian basin; YTB, Yanggao-Tianzhen basin; XHB, Xuanhua basin; HZB, Huaizhuo basin; F1, Daman-Qianheishatu fault; F2, Miaodongying-Dayingtan fault; F3, Dahezhen-Hailiutu fault; F4, Shangyi-Chicheng fault; F5, Zhangjiakou fault; F6, Ximalin-shuiquan fault; F7, Northern margin fault of the Huaian basin; F8, Northern margin fault of the Yanggao-Tianzhen basin; F9, Southern margin fault of the Huaian basin; F10, Southern margin fault of the Xuanhua basin; F11, Northern margin fault of the Huaizhuo basin; DQG, Daqinggou; GH, Gonghui; DHL, Dahulun; HLT, Hailiutu; DJH, Danjinghe; MJ, Manjing; DH, Dahe; SY, Shangyi; CL, Chongli; HTL, Hongtuliang; GJY, Gaojiaying; WQ, Wanquan; XML, Ximalin; ZJK, Zhangjiakou; HA, Huaian; ZW, Zuowei; TJY, Tianjiayao; LJW, LuJiawan; HAC, Huaiancheng; GC, Guocun; XHY, Xiahuayuan; TZ, Tianzhen; ZL, Zhuolu; HL, Huialai.
The 150-km long Shangyi-Chicheng Fault (F4) is the largest fault in this region. The fault plane is steep and dips to north or south in different places, exhibiting features of high-angle compression and shear (Zhou et al., 2019). In the northern part of F4, three hidden faults are located near the Zhangbei earthquake area, namely the Daman-Qianheishatu (F1), Miaodongying-Dayingtan (F2), and Dahezhen- Hailiutu (F3) Fault (Xu et al., 1998; Cai et al., 2003). In the southern part of F4, three groups of NW-, NE- and approximately EW-trending faults are found. The NW-trending faults, including the Zhangjiakou (F5) and Xialin-Shuiquan (F6) Fault, are situated in the middle of the study area. The NE-trending faults are distributed in the southwest of the study area and include mainly the northern margin fault of Huai’an Basin (F7) and the northern margin fault of Yanggao-Tianzhen Basin (F8), which are characterized by large scale and long extensions. The approximately EW-trending faults are developed in the south of the study area. Most of them are concealed, discontinuous, and arranged as an echelon. These EW-trending faults are represented by the southern margin fault of Huai’an Basin (F9), the southern margin fault of Xuanhua Basin (F10), and the northern margin fault of Huaizhuo Basin (F11) (Ran et al., 2001; Zhou, 2011; Qi, 2017; Luo et al., 2021).
The strata, lithology, and magmatic activities in the western section of the ZBFZ are obviously controlled by fault structures (Qi, 2017). Precambrian, Mesozoic, and Cenozoic strata are exposed to the north of F4. The Cenozoic Hanuoba basalts are distributed in the Shangyi and Zhangbei regions (Liu et al., 1992), Precambrian strata are mainly found to the south of F4, Paleozoic strata occur sporadically around Shangyi. Mesozoic strata are mainly distributed between Shangyi and Zhangjiakou, and Cenozoic strata in the Huai’an (HAB), Yanggao-Tianzhen (YTB), Xuanhua (XHB), and Huaizhuo (HZB) Basins as well as their margins. Ultramafic, mafic, diorite, and granite are also sporadically exposed in the study area. The Precambrian strata are dominated by metamorphic rocks, the Paleozoic strata are mainly composed of carbonate rocks and the Mesozoic strata consist mostly of volcanic sedimentary rocks in continental basins. The Cenozoic strata are exposed in the mountains and comprised plagioclase granulite and gneiss. The Cenozoic strata in the basin are mainly loess, sandy clay and glutenite (Wang et al., 1996; Peng et al., 2017; Figure 2).
In view of the complex fault system and distribution characteristics of the main faults in the study area, an magnetotelluric detection array was adopted, which had Zhangjiakou as its center and extended from it, forming seven survey lines along the SN direction (numbered L1, L2, L3, L4, L5, L6 and L7 from west to east) as seen in Figure 2. The spacing of adjacent lines was about 20 km. Survey line L6 was the longest, with a length of 125 km, and survey line L1 was the shortest, with a length of 103 km. The measurement points were evenly distributed and relatively dense along the survey lines, with most of them less than 5 km apart. In order to reveal the deep seismogenic structure of the Zhangbei earthquake area, 15 additional measurement points were arranged, bringing the total number of magnetotelluric measurement points to 143.
The magnetotelluric field survey was carried out between July and September 2020. The MTU-5A magnetotelluric observation system manufactured by Phoenix Geophysics Ltd. of Canada was used for data acquisition. The electric field components in the SN and EW directions and the magnetic field components in the SN, EW, and vertical directions were observed at each measurement point. Transport and electrical power infrastructure, such as electrified railways and wind power stations, are densely distributed over the entire study area. During field data collection, remote-reference was used to process the data for enhanced quality (Gamble et al., 1979). A remote reference station (YCK) is located near the Maowusu Desert in Otog Front Banner, Inner Mongolia, about 700 km away from the study area (Figure 1A). The data recording period at each measurement point was more than 40 h, and at some it reached 50 h. The quality of data was significantly improved after the remote reference processing. The apparent resistivity and phase curves of 12 measurement points before and after remote reference processing are shown in Supplementary Figure S1 as examples.
The apparent resistivity and impedance phase curves of 28 typical measurement points from north to south along the seven survey lines are shown in Figure 3 (the locations of measurement points are shown as green squares in Figure 2). As can be seen in Figure 3, the apparent resistivity curves at all measurement points in the Yanshan Orogen to the north of F4 are essentially the same, i.e., they first have low values, then increase, to fall again with increasing period. The apparent resistivity at the intermediate frequencies is close to tens of thousands of Ωm, indicating the presence of high resistivity anomalies in the middle and upper crust. The decrease in low-frequency apparent resistivity implies the existence of deep low-resistivity structures. Moreover, the apparent resistivity is low in the west and high in the east. To the south of F4, the shapes of apparent resistivity curves in medium-high frequency band at each measurement point are distinct, corresponding to the complex Jin-Ji-Meng Basin and Range Province. The apparent resistivity values at lower frequencies are generally low, indicating the presence of low-resistivity structures in the middle and lower crust in this region.
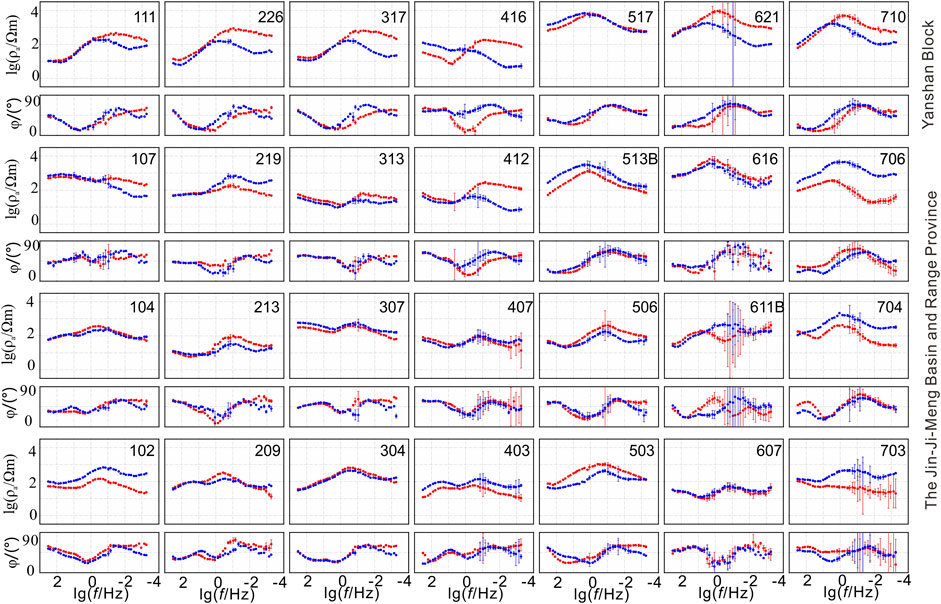
FIGURE 3. Apparent resistivity and impedance phase curve of typical MT stations (Red dots denote XY mode, blue dots denote YX mode).
The phase tensor decomposition technique (Caldwell et al., 2004; Bibby et al., 2005) is usually used to qualitatively analyze the dimensional features of underground media. Considering that the actual observation data contain uncertainty, it is generally believed that when two-dimensional deviation degree of the phase tensor, |β|, is larger than 5, the 3D property of an underground structure is strong (Booker, 2014; Cai et al., 2017). Figure 4 shows the values of |β| of all measurement points in four periods, as well as the periodic changes along survey lines L2 and L6, where it can be seen that in the moderate and high frequency bands, the values of |β| are below 5. With increasing period, especially to the south of F4, the values of |β| markedly increase. A large number of measurement points exhibit |β| values exceeding 5, indicating that the shallow structure of the survey area is relatively simple. The middle and deep structures, especially those to the south of F4, are relatively complex. The deep electrical structure is 3D, which is related to the distribution of complex fault systems in the south of the study area. In order to reveal the deep electrical structure of such complex areas, it is necessary to apply the 3D electromagnetic inversion technology.
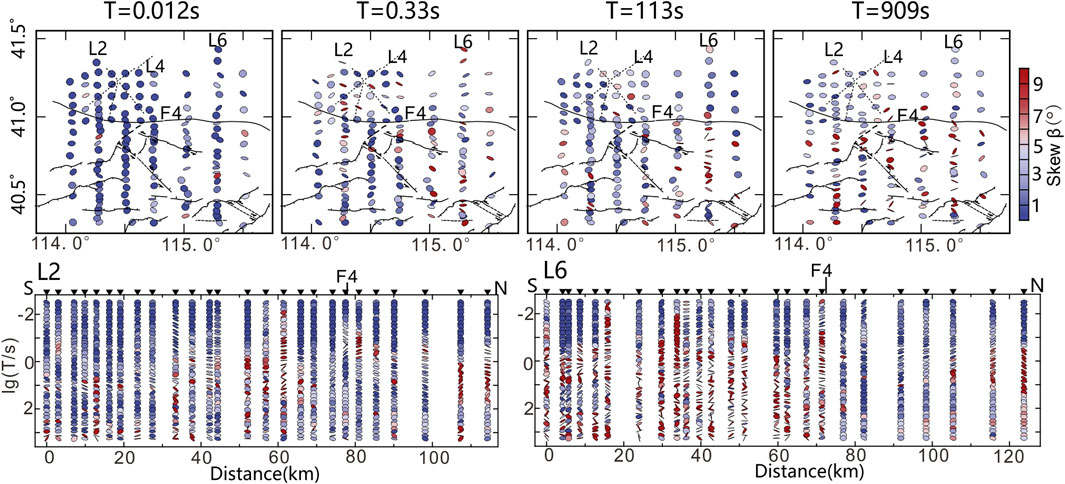
FIGURE 4. Mapview of phase tensor ellipses filled with the absolute value of skew angle β for periods 0.012 s, 0.33 s, 113 s, and 909 s (upper). Profiole of phase tensor ellipses filled with the absolute value of skew angle β for profiles L2 and L6 (bottom).
In the qualitative analysis of regional electrical differences, the phase tensor invariant, φ2 (Heise et al., 2008), is adopted, which only contains the resistivity gradient and variation information. Although it cannot be used to determine the specific resistivity value of an underground structure, it can reflect its trend. A large value of φ2 indicates that the resistivity decreases with depth, otherwise it indicates that it increases with depth. Figure 5 shows the distribution map of phase invariants at all measurement points over four periods as well as the periodic changes along survey lines L2 and L6. The φ2 values increase with the period in the moderate and high frequency bands to the west of survey line L4 and to the south of F4. The φ2 values are clearly smaller than those in the to the east of survey line L4. This shows that the decreasing trend in the west and south of the study area is more obvious. With the period increasing in the low-frequency band below tens of seconds, the φ2 values become much larger and more uniform, indicating that the deep strata of the study area generally has a decreasing trend.
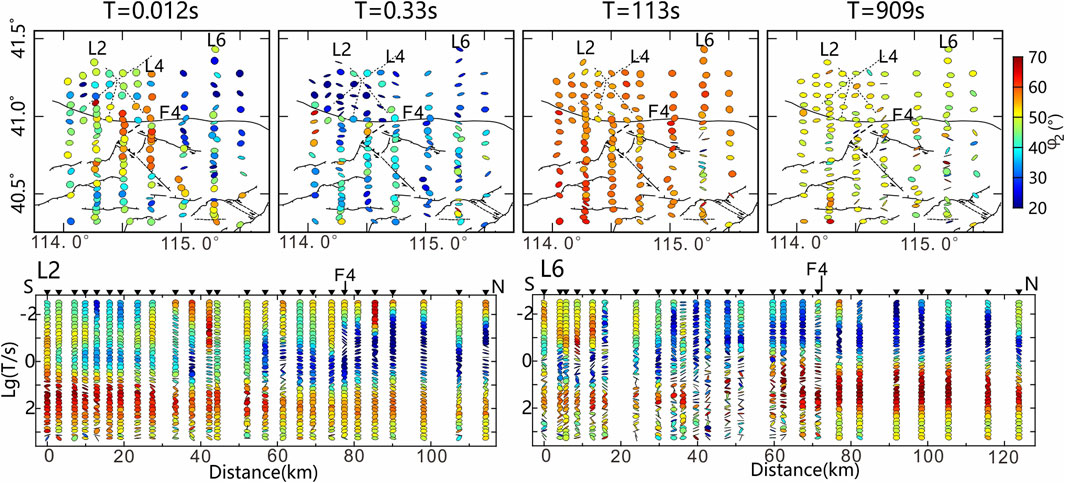
FIGURE 5. Mapview of phase tensor ellipses filled with the phase tensor invariant for periods 0.012 s, 0.33 s, 113 s, and 909 s (upper). Profiole of phase tensor ellipses filled with the phase tensor invariant for profiles L2 and L6 (bottom).
The 3D inversion was carried out using the ModEM software (Egbert and Kelbert, 2012; Kelbert et al., 2014). The full impedance data at 35 frequency points from all 143 measurement points between 320 Hz—0.000137 Hz (periods 0.0031 s–7,300 s) were utilized for inversion, including nine frequency points above 1 s and 28 frequency points below 1 s. Among the 143 measurement points, 132 points provided valid data with a period of more than 1,000 s.
The horizontal grid generation for the 3D inversion model covers the core of each measurement point and its boundary. The horizontal grid covering the core of each measurement point was evenly divided. A 48 (SN direction) × 48 (EW direction) grid (3.0 km × 3.0 km in the centre of the study area) was adopted. There were 10 extended grids for each horizontal boundary, and, therefore, 68 × 68 grid lines in total. The vertical grids were denser closer to the surface but became gradually coarser with the increasing depth. The thickness of the uppermost layer was 10 m and increased at different rates with depth. These rates were 1.2, 1.1, 1.2, 1.3, and 1.4 within 2 km, 2–60 km, 60–80 km, 80–150 km, and 150–800 km, respectively. The vertical grid had a total of 69 layers (Figure 6).
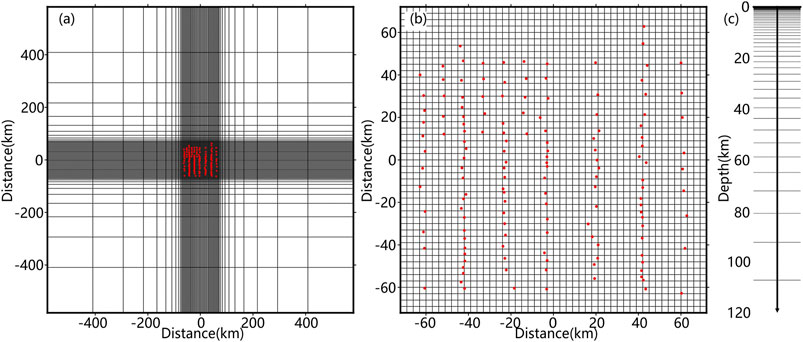
FIGURE 6. Grid used for the 3D inversion (A) Horizontal grid; (B) Horizontal grid of central part; (C) Vertical grid; The red dotes denote MT stations.
During the 3D inversion, the error floor of the diagonal elements and the off-diagonal elements were set to 10% and 5%, respectively. The errors of a few frequency points obviously disturbed by noise were enlarged to reduce their weight in inversion. The smoothing factors used in the three directions for the 3D inversion equalled 0.3. A 100 Ωm uniform half-space was utilized as the initial model with an automatically updated regularization factor of an initial value of 5,000. When the inversion no longer converged, the regularization factor was reset to one tenth of the original value and inversion continued. After 79 iterations, the inversion was completed, and the root mean square (RMS) error of the model was 2.22. The 3D inversion results at the measurement points agreed well with the measured main diagonal elements and sub diagonal elements (Figure 7). The lines fitted to the 3D inversion model response at all the measurement points are shown in Supplementary Figure S2. Regarding the robustness of the major model features, sensitivity tests of C1 and C2 have been carried out, as shown in Supplementary Figures S3, S4.

FIGURE 7. The four component RMS misfit at each station.
The 3D electromagnetic inversion reveled the 3D deep electrical structure of the western section of the ZBFZ. The deep electrical structures of seven sections along the SN direction are shown in Figure 8. The planar sections at nine depths are displayed in Figure 9, while two vertical sections across the Zhangbei seismic area are presented in Figure 10. The positions of these faults from surface geological data were compared with the positions of magnetotelluric measurement points. The deep extension of each fault is illustrated in Figure 8. Three concealed faults in the northern part of F4 and the seismic structure in Zhangbei area are detailed in Figure 10. From the electrical structure characteristics shown in these figures, the main faults in the study area are situated in obvious electrical interface or electrical gradient zones and the electrical structures of the survey area are strongly horizontally heterogeneous.
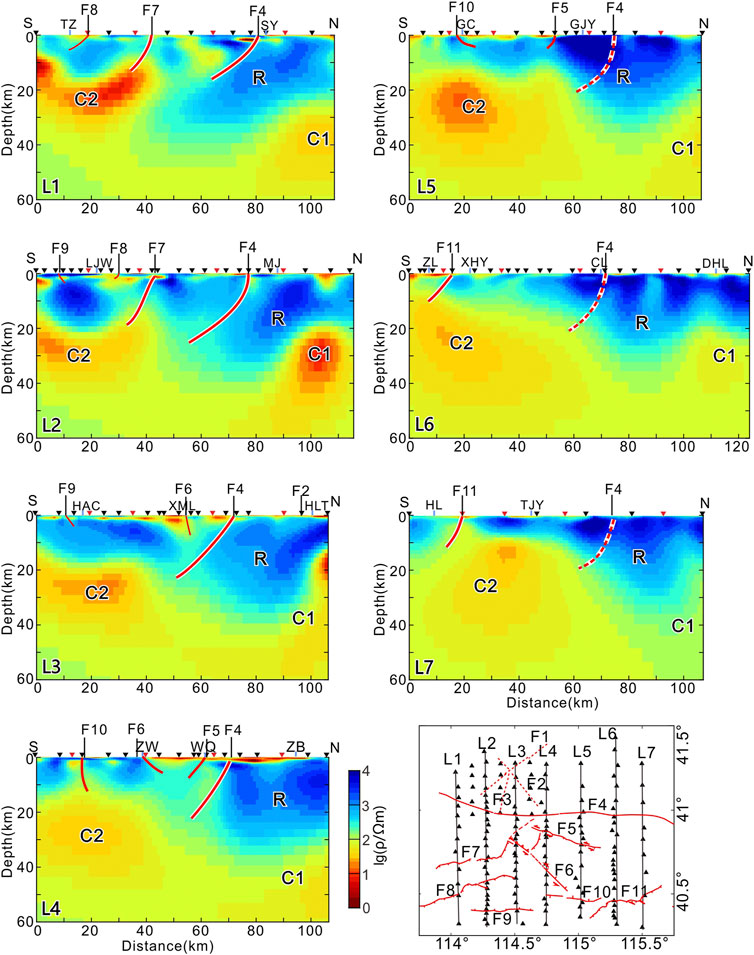
FIGURE 8. Cross sections of seven profiles (L1, L2, L3, L4, L5, L6, and L7) extracted from the 3D inversion model.
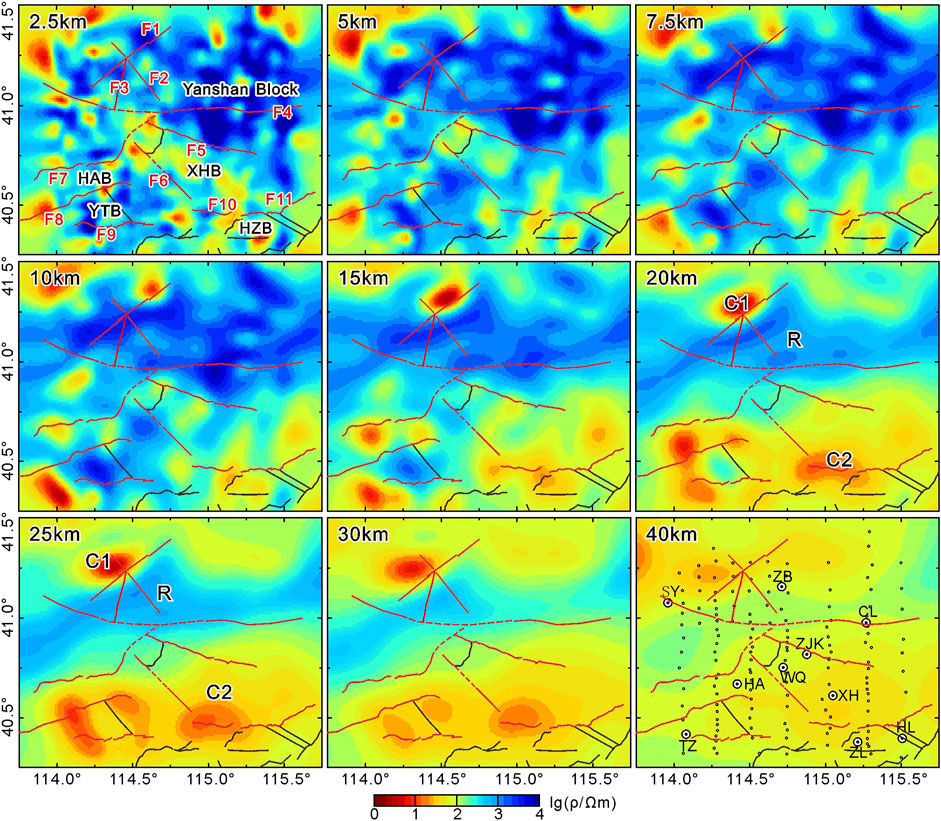
FIGURE 9. Map view of the 3D inversion model.
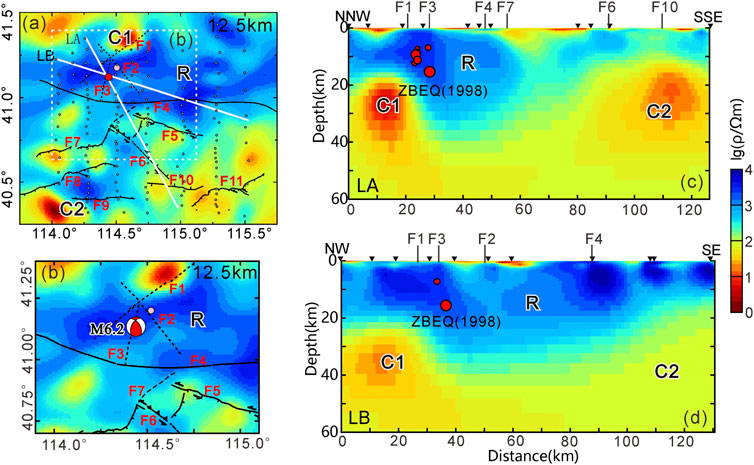
FIGURE 10. Electrical structure beneath the Zhangbei earthquake. (A) Map view of the 3D inversion model in the Western section of ZBFZ at depth of 12.5 km; (B) Map view of the 3D inversion model near the Zhangbei earthquake at depth of 12.5 km; (C) and (D) Cross sections of 3D inversion model along profiles LA and LB.
The approximately EW-trending F4 is one of the largest faults in the study area. The fault dips to north or south, exhibiting high-angle compression and shear characteristics (Zhou et al., 2019). Along survey lines L1 to L7, F4 is consistent with the electrical difference zone (Figure 8). The deep extension of the electrical difference from west to east is segmented. In the western survey lines L1 to L4, there is an obvious electrical difference zone. The part to the north of F4 is characterized by high resistivity structure, while the part to the south of it has markedly low resistivity. From west to east, the downward extension angle of the electrical difference zone gradually becomes steeper from dipping south. The extension depth this zone can reach is below 15 km and it is connected with the deep low-resistivity structure C2. To the east of survey line L4, F4 is developed inside the high-resistivity structure R, with little electrical difference. This difference along the EW direction may be related to the fact that the western segment of F4 is highly active and relatively new, while the eastern segment of F4 is relatively stable. We speculate that the fault may be concealed in the high-resistivity body in the eastern section, which is also consistent with the conclusions of the geological survey (Cai et al., 2002; Zhou et al., 2019).
The Zhangjiakou (F5) and Ximalin-Shuiquan (F6) Faults are two NW-trending faults in the middle of the study area and are the southern and northern boundaries of the Xuanhua basin (XHB). Along survey lines L4 and L5, F5 is an electrical difference zone with a slight southward dip. The electrical difference tends to decrease from west to east, which may be related to the intense activity of the western section and the relatively weak activity of the eastern section (Zhou and You, 2010). Along survey lines L3 and L4, F6 is an electrical boundary zone with a slight dip to the north. These two faults extend to a depth of about 3 km and are small in scale.
F7 is mainly observed in survey lines L1 and L2 and has a southward sloping electrical boundary below it. It extends below 15 km and merges with the moderate-low resistivity structure (C2). F8 is the northern boundary of Yanggao-Tianzhen Basin (YTB) and is present as an electrical differential gradient zone in survey lines L1 and L2, with a depth of 2–3 km. In the southwest of the study area, the fault in the southern margin of Huai’an Basin (F9) shows as an upright and slightly northward dipping electrical difference zone in survey line L2, with an extended depth of about 10 km. The fault in the southern margin of Xuanhua Basin (F10) manifests as a gently northward dipping electrical difference zone in survey lines L4 and L5, extending for about 5 km. The fault in the northern margin of Huaizhuo Basin (F11) is evident as a southward dipping electrical difference zone in survey lines L6 and L7, with an extension depth of about 10 km. In the deep part, it may merge with the low resistivity layer (C2). The distribution of faults indicated by the deep electrical structure image reveal a clear electrical anomaly difference zone with a deep extension under the Shangyi-Chicheng Fault (F4), the northern margin fault of Huai’an Basin (F7) and the northern margin fault of Huaizhuo Basin (F11). It is connected with the low-resistivity layer in the middle and lower crust, indicating that these three faults may be large faults.
The horizontal slices of the resistivity structure at nine depths are shown in Figure 9. As can be seen from the figure, the electrical structures in the shallow and deep parts of the study area are clearly distinct. From the shallow surface to the depth of 7.5 km, the electrical structures to the north and south of F4 are significantly different. To the north of F4, the deep electrical structure of the surrounding area centered on Zhangbei is generally characterized by high resistivity (R) reaching up to thousands of Ωm and corresponding to the Cenozoic Hannuoba basalts and metamorphic rocks exposed in Zhangbei and its adjacent areas (Liu et al., 1992). To the south of F4, zones of high and low resistivities are liberally distributed, consistent with the shallow faults and complex basin-range structural areas comprising the Huai’an (HAB), Yanggao-Tianzhen (YTB), Xuanhua (XHB), and Huaizhuo (HZB) Basins (Xu et al., 2002; Zhou, 2011; Peng et al., 2017). At depths of 7.5–15 km, in the northwest and southeast regions low resistivity structures C1 and C2 exist, respectively. The deep electrical structure shows a zone of high resistivity sandwiched between two zones of low resistivity. At depths of 20–30 km, with the increase in depth, C1 extends to the southwest and C2 extends to the northwest. The high-resistivity structure R becomes an elliptic band spreading from southwest to northeast. Below 40 km, the resistivity of the whole region is generally low (Figure 8).
The sections shown in Figure 8 enable further elaboration on the spatial distribution characteristics of the low resistivity structures C1, C2, and the high-resistivity structure R. Across the seven survey lines, the high-resistivity structure R is narrow in the west and wide in the east, and deep in the west and shallow in the east. Along the western survey line L1, R is the narrowest, with a depth of about 40 km. Moving across survey lines L2, L3 and, L4, its width gradually increases, while its depth gradually decreases. Along survey lines L5 and L6, it is the widest, but its depth is reduced to about 30 km. Along the easternmost survey line L7, the range of R is reduced. The low-resistivity structure C1 in the northwest part of the survey area is generally deep in the south and shallow in the north. The low-resistivity structure C2 developed in the southeast region is shallow in the south and deep in the north, with a depth of about 30 km in the northern part. Along survey line L1, C2 changes from deep in the south to shallow in the north. The depth of the southern section of C2 exceeds 20 km, while in the northern section it is shallower, about 10 km. It joins F7 in the upper crust. Along survey line L7, C2 is about several kilometers below the northern margin fault of Huaizhuo Basin (F11). On the whole, the deep electrical structure in the study area varies greatly in the horizontal direction. The areas with the greatest variation are consistent with the locations of major faults. At a depth of 20 km, the shallow part of the basin-range structural area to the south of F4 is characterized by a low-resistivity structure, while the overlying area covered by Hannuoba basalts and metamorphic rocks has a high-resistivity structure. At depths 20–40 km, the high-resistivity structure R is sandwiched between the low-resistivity bodies C1 and C2. Further down, the medium is characterized by uniform low resistivity.
In 1998, an earthquake with a magnitude of 6.2 occurred near Zhangbei at the northwest end of the ZBFZ. Since 2021, medium and small earthquakes have frequently been reoccurring in the Zhangbei seismic area, several of them with magnitudes of about 3. The occurrences of these earthquakes suggests that the region may have become seismically active. Figure 10 shows the electrical structure planar section (a and b) at the depth of 12.5 km and two deep electrical sections (LA and LB) across the Zhangbei seismic area. The fine 3D deep electrical structure characteristics of Zhangbei can reveal the seismogenic structure and the possible location of the source of the Zhangbei earthquake and help to understand the deep seismogenic environment of the region.
Existing seismological research literature preposes two estimates of the focal depth of the M6.2 Zhangbei earthquake; one is 8–10 km (Zheng et al., 1998; Gao et al., 2002), and the other is 12–15 km (Yang et al., 2002; Yang and Chen, 2004). There are also controversies with regard to the seismogenic faults (Xu et al., 1998; Cai et al., 2001, 2002; Gao, 2001; Zhou et al., 2019). The deep electrical structure diagrams (LA and LB) across two sections of the Zhangbei seismic area shown in Figure 10 demonstrate that there is a high-low resistivity electrical interface in the crust at the depth of about 15 km in the focal area, which is consistent with the estimation that the focal depth of the Zhangbei earthquake was 12–15 km (Yang et al., 2002; Yang and Chen, 2004). The depths of multiple M3 earthquakes that occurred near Zhangbei in 2021 are projected on the sections LA and LB in Figure 10, where it can be seen that they are located near the Dahezhen-Hailiutu Fault (F3). Ekstrom et al. (2012) suggested that the 1998 M6.2 Zhangbei earthquake resulted from thrust and dextral tectonic activities. Chen et al. (2020) argued that the main compressive stress in Zhangbei was in the NEE-SWW direction, which is almost consistent with the trend of F3. In addition, the east side of F3 is blocked by relatively high resistivity structures and should be characterized by thrust movement, which is in accordance with the focal mechanism solution of the Zhangbei earthquake (Ma et al., 1998). Therefore, the seismogenic fault of the 1988 M6.2 Zhangbei earthquake was the Dahezhen-Hailiutu Fault (F3). The fine structure of seismic region revealed by the magnetotelluric method can be used to constrain the focal depth as well as the seismogenic fault of the earthquake.
Ye et al. (2021) concluded that the M6.4 Yunnan Yangbi earthquake occurred near the high and low resistivity transition zone, on the high resistivity side. He described this phenomenon as “strong earthquake gestation and occurrence in the rigid and flexible transition zone”. This is consistent with the analyses of the 2021 M7.4 Qinghai Maduo earthquake (Zhan et al., 2021). The high-resistivity structure in the upper crust of Zhangbei may represent the Hanuoba basalts, which are very rigid. The faults developed in the Hanuoba basalts can gradually accumulate enough stress to induce moderate to strong earthquakes. The low-resistivity structure beneath the Hanuoba basalts may comprise mantle magmatic materials (Zhao, 2009; Zhang et al., 2016; Wu et al., 2021). The continuous intrusion and upwelling of these materials may have weaken the stability of the Dahezhen-Hailiutu Fault (F3) in the Hanuoba basalt region, leading to heterogeneous stress accumulation and deformation as well as weakening of the fault, finally resulting in the occurrence of the Zhangbei earthquake. This analysis suggests that the focal depth of Zhangbei earthquake was between 12 and 15 km and its seismogenic fault was F3. The deep seismogenic environment of the earthquake was associated with the magmatic activities in the middle and lower crust and mantle.
Numerous studies have suggested that the occurrence of moderate and strong earthquakes is induced by the sliding of faults due to instability. In the process of fault sliding, layer decoupling is often required to provide conditions for fault dislocation (Unsworth et al., 1997; Becken et al., 2011). According to the magnetotelluric detection results of the 2008 M8.0 Wenchuan earthquake, 2013 M7.0 Lushan earthquake, 2016 M6.9 Menyuan earthquake, 2021 M7.4 Maduo earthquake and 2021 M6.4 Yunnan Yangbi earthquake (Zhao et al., 2012; Zhan et al., 2013, 2021; Zhao et al., 2015, 2019; Ye et al., 2021), the focal areas were near the transition zone of high and low resistivity, on the side of high resistivity. Similar results have been reported for velocity structures, i.e., strong earthquakes occurred in the transition zone between high and low seismic waves velocities, close to the side of high velocity (Zhang et al., 2005; Yang et al., 2011). The 3D deep structure of the western section of the ZBFZ has the clear electrical anomaly zone beneath the Shangyi-Chicheng Fault (F4), the northern margin fault of Huai’an Basin (F7), and the northern margin fault of Huaizhuo Basin (F11). It extends deep and connects with the low resistivity layer in the middle and lower crust. These observations suggest that the three faults are transcrust faults that have the electrical structural characteristics of faults that host moderate and strong earthquakes.
Since the Cenozoic, the collision between the Indian and Eurasian Plates has resulted in the eastward expansion of the asthenosphere (Li et al., 2010). The weak materials in the middle and lower crust of the western section of the ZBFZ were also squeezed eastward. Inhomogeneous bodies exist in the crust and the deep parts of the western segment of Shangyi-Chicheng Fault (F4) and the north margin fault of the Huai’an Basin (F7) are connected with the low resistivity structure (C2) in the crust, which becomes gradually shallower to the northeast along F7. These deep faults provided channels for upwelling of mantle-derived basaltic magma (Xu et al., 1998). In particular, the deep materials near F7 have a stronger effect on the shallow crust. This deep tectonic and geodynamic environment indicate that this region may be the main area of moderate and strong earthquakes in the future and deserves special attention.
The resistivity structure characteristics of the medium revealed by magnetotelluric imaging combined with previous geological surveys, geophysical exploration and deformation field analysis (Xu et al., 2002; Jia et al., 2009; Zhao, 2009; Li et al., 2010; Guo et al., 2016; Zhang et al., 2016; Shen et al., 2019; Chen et al., 2020; Wang and Shen, 2020; Wu et al., 2021) enabled formulating a model of the deep seismogenic environment and volcanic formation mechanism in the western ZBFZ (Figure 11). In the northwest part of the Zhangbei seismic area in the western ZBFZ, there is an obvious low-resistivity structure (C1), which extends from the depth upward to the depth of 15 km and then gradually disappears (Figure 9). Structure C1 is connected with the low-resistivity structure (C2) under the DVG (Zhou, 2021) in the southwest (Zhang et al., 2016), indicating that C1 may extend to the Datong region in the southwest. Combined with the results obtained by Zhao, 2009, it is speculated that the low-resistivity structure in the middle and lower crust beneath the Zhangbei-Datong region may have originated from partial melting of upper mantle materials. Moreover, there is an obvious electrical boundary zone between C1 and the southeastern high-resistivity structure (R) in the middle and lower crust, which may be a manifestation of the Dahezhen-Hailiutu Fault (F3) beneath the Hanuoba basalt area.
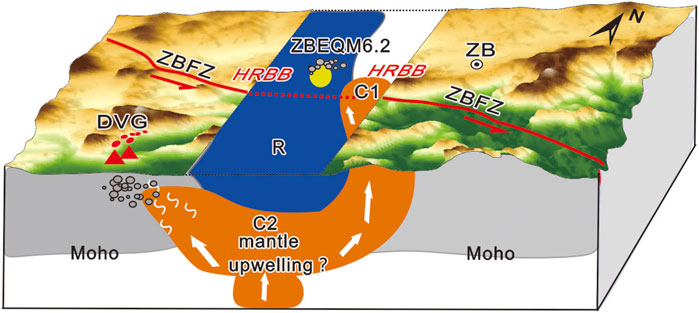
FIGURE 11. Schematic model of the seismogenic environments and formation mechanism for volcanism in the ZBFZ.
The ZBFZ is an important NW-trending active tectonic zone in North China. It is one of the well-known moderate and strong seismic tectonic zones of the mainland China. Zhangjiakou and other regions in the west section of the ZBFZ are not only characterized by frequent moderate and strong earthquakes, but also contain the DVG and widely exposed basalts. This area provides a good opportunity for studying earthquake and volcanic activity. In order to reveal the deep electrical structure and seismogenic environment of the western section of the ZBFZ leading to the 1998 M6.2 Zhangbei earthquake, magnetotellerite array exploration was carried out in an area extending for about 113 km from north to south and 125 km from east to west with Zhangjiakou as the center. The 3D deep electrical structure of the area was obtained by 3D electromagnetic inversion imaging. The results show that:
1) The deep electrical structure in the western section of the ZBFZ is characterized by significant lateral heterogeneity. To the north of the Shangyi-Chicheng Fault (F4), the upper crust has a high resistivity structure (R), corresponding to the exposed Hanuoba basalts and metamorphic rocks. To the south of F4, zones of high and low resistivities alternate, which is attributed to the complex faults and basin-range structures. In the middle crust, low-resistivity structures (C1 and C2) gradually appear in the northwest and southeast of the study area, showing the characteristics of a high-resistivity structure sandwiched between two low-resistivity structures. In the lower crust, two low-resistivity structures (C1 and C2) gradually join each other and the whole region becomes characterized by low resistivity. The Shangyi-Chicheng Fault (F4), the northern margin fault of Huai’an Basin (F7) and the northern margin fault of Huaizhuo Basin (F11) are definite electrical difference zones, which are connected with the low-resistivity structure in the crust.
2) The electrical structure of the upper crust in the 1998 M6.2 Zhangbei earthquake area is dominated by high resistivity. In the distribution area of some fault zones, high and low resistivities alternate. The middle and lower crust mainly consists of large-scale and laterally discontinuous low-resistivity layers. The results of magnetotelluric exploration indicate that the focal depth of the Zhangbei earthquake was between 12 and 15 km and its seismogenic fault was the Dahezhen-Hailiutu Fault (F3), concealed beneath the Hanuoba basalt area. The northern margin fault of the Huai’an Basin (F7) is a transcrust fault with a deep extension, and it connects with the low resistivity structure in the middle and lower crust. The Zhangbei seismic area and the distribution region of F7 are potential seismic areas requiring further attention.
3) Based on the comprehensive analysis of geological surveys, geophysical exploration and deformation field, it is speculated that owing to the neotectonic activities, the magma originated from asthenosphere mantle rose and erupted on the surface near Datong, forming the DVG. The magma continued to migrate and overflow along the fractures in the NE direction, forming the Hannuoba basalts in the Zhangbei area. The existence of mantle thermal material in this area led to the formation of the Hannuoba basalt area and the accompanied fluids migrated to the middle and upper crust, resulting in fault sliding and frequent occurrence of moderate and strong earthquakes in this region. The continuous upwelling of mantle thermal materials weakened the stability of the fault in the Hannuoba basalts and gave rise to a heterogeneous stress accumulation and deformation. Thus, the fault was weakened and finally the Zhangbei earthquake occurred in 1998.
The raw data supporting the conclusions of this article will be made available by the authors, without undue reservation.
YP, XS, LZ, and YZ completed the field data acquisition, the data analyses, and wrote the article. YZ provided funding for the study. XL and LW assisted in data acquisition. All authors have read and agreed to the published version of the manuscript.
This paper was supported by the National Key Research and Development Program of China (2017YFC1500103), the National Nonprofit Fundamental Research Grant of Institute of Geology, China Earthquake Administration (Grant No. IGCEA2215), the Science and Technology Program of Hebei Province (19975412D), and the National Field Scientific Observation and Research Station Project of Continental Rift Dynamics in Taiyuan, Shanxi Province (NORSTY 20-07).
The field data acquisition was supported by Zhangjiakou Emergency Management Bureau and Zhangjiakou Central Station, Earthquake Administration of Hebei Province. We appreciate the access to the computing resources of the Computer Network Information Center at the Institute of Geology, China Earthquake Administration. Some figures were prepared using GMT (Wessel et al., 2013).
The authors declare that the research was conducted in the absence of any commercial or financial relationships that could be construed as a potential conflict of interest.
All claims expressed in this article are solely those of the authors and do not necessarily represent those of their affiliated organizations, or those of the publisher, the editors and the reviewers. Any product that may be evaluated in this article, or claim that may be made by its manufacturer, is not guaranteed or endorsed by the publisher.
The Supplementary Material for this article can be found online at: https://www.frontiersin.org/articles/10.3389/feart.2022.966192/full#supplementary-material
Becken, M., Ritter, O., Bedrosian, P. A., and Weckmann, U. (2011). Correlation between deep fluids, tremor and creep along the central San Andreas fault. Nature 480, 87–90. doi:10.1038/nature10609
Bibby, H. M., Caldwell, T. G., and Brown, C. (2005). Determinable and non-determinable parameters of galvanic distortion in magnetotellurics. Geophys. J. Int. 163, 915–930. doi:10.1111/j.1365-246X.2005.02779.x
Booker, J. (2014). The magnetotelluric phase tensor:A critical review. Surv. Geophys. 35, 7–40. doi:10.1007/s10712-013-9234-2
Cai, H., Zhang, J., Liu, R., Diao, G., Huang, W., He, C., et al. (2001). The feature and researching significance of the ground fissures formed by Zhangbei 6.2 earthquake. North. earth. Scie 19 (4), 47–53. (in Chinese).
Cai, H., Zhang, S., Liu, X., Sun, J., Wang, S., and Diao, G. (2003). The Detection and the study of the active faults in Zhangbei earthquake area. Earth. Res. Shanxi 2, 23–28. (in Chinese).
Cai, H., Zhang, S., Zhang, Z., Liu, Y., Ren, J., He, C., et al. (2002). The tectonic feature of the faults in Zhangbei Earthquake region. North. earth. scie. 20 (2), 2–9. (in Chinese).
Cai, J., Chen, X., Xu, X., Tang, J., Wang, L., Guo, C., et al. (2017). Rupture mechanism and seismotectonics of the Ms 6.5 Ludian earthquake inferred from three‐dimensional magnetotelluric imaging. Geophys. Res. Lett. 44, 1275–1285. doi:10.1002/2016GL071855
Caldwell, T. G., Bibby, H. M., and Brown, C. (2004). The magnetotelluric phase tensor. Geophys. J. Int. 158, 457–469. doi:10.1111/j.1365-246X.2004.02281.x
Cen, M., Dong, S., Shi, W., Zhou, T., Chen, L., and Chen, X. (2015). Structural analysis on the formation mechanism of Datong basin. Geol. Rev. (in Chin. 61 (6), 1235–1247.
Chen, F., Guo, L., and Zheng, Z. (2020). Research on activity of ZhangJiaKou-BohHai fault zone based on GPS obser vations. Seismol. Geol. 42 (1), 95–108. (in Chinese). doi:10.3969/j.issn.0253-4967.2020.01.007
Deng, J., Mo, X., and Lin, P. (1987). Geolongical and petrological characters of Datong volcanic group. Earth Sci. 12 (3), 233–239. (in Chinese).
Egbert, G., D., and Kelbert, A. (2012). Computational recipes for electromagnetic inverse problems. Geophys. J. Int. 189, 251–267. doi:10.1111/j.1365-246X.2011.05347.x
Ekstrom, G., Nettles, M., and Dziewoński, A, M. (2012). The global CMT project 2004–2010: Centroid-moment tensors for 13, 017 earthquakes. Phys. Earth Planet. Interiors 200-201, 1–9. doi:10.1016/j.pepi.2012.04.002
Feng, Y., Wang, H., Chen, S., and Huang, Q. (2016). Blind faults of Datong eqrthquake equence:JHD and Coulomb stress. Chin. J. Geophys. 59 (2), 568–577. (in Chinese). doi:10.6038/cjg20160215
Fu, Z., Liu, J., and Liu, G. (2000). Research on medium and long-term seismic risk in zhangjiakou-penglai fault zone. Earth. Res. China 16 (4), 334–341. (in Chinese).
Gamble, T., Goubau, W., and Clarke, J. (1979). Error analysis for remote reference magnetotellurics. Geophysics 44, 959–968. doi:10.1190/1.1440988
Gao, J., Diao, G., Zhang, S., Cai, H., zhnag, H., Lai, X., et al. (2002). Rupture characteristics of the Zhangbei earthquake sequence analyzed by exact focal location. Seismol. Geol. 24 (1), 81–89. (in Chinese).
Gao, Z. (2001). A study on characteristics of earthquake geology of the Zhangjiakou-Penglai fault zone (in Chinese). BeijingGeology: InstituteCEA. Doctoral thesis.
Guo, Z., Afonso, J. C., Qashqai, M. T., Yang, Y., and Chen, Y. J. (2016). Thermochemical structure of the North China Craton from multi-observable probabilistic inversion: Extent and causes of cratonic lithosphere modification. Gondwana Res. 37, 252–265. doi:10.1016/j.gr.2016.07.002
Hao, Y. (2010). The study of active structure and crust stability in Zhangjiakou area. Geotech. Geotechn. Inve. Survr. S1, 161–165. (in Chinese).
Heise, W., Caldwell, T. G., Bibby, H. M., and Bannister, S. C. (2008). Three-dimensional modelling of magnetotelluric data from the Rotokawa geothermal field, Taupo Volcanic Zone, New Zealand. Geophys. J. Int. 173, 740–750. doi:10.1111/j.1365-246X.2008.03737.x
Hu, H., Wang, Y., Jiang, H., Li, Z., Hu, X., and Han, Y. (2021). Spatial-temporal distribution of historical earthquake events in Beijing-Tianjin-Hebei area. J. Palaeogeog 23 (2), 435–448. (in Chinese). doi:10.7605/gdlxb.2021.02.026
Jia, S., Zhang, C., Zhao, J., Fang, S., Liu, Z., and Zhao, J. (2009). Crustal structure of the rift-depression basin and Yanshan uplift in the northeast part of North China. Chin. J. Geophys. 52 (1), 51–63. (in Chinese). doi:10.1002/cjg2.1326
Kelbert, A., Meqbel, N., Egbert, G., and Tandon, K. (2014). ModEM: A modular system for inversion of electromagnetic geophysical data. Comput. Geosci. 66, 40–53. doi:10.1016/j.cageo.2014.01.010
Li, J., Ye, T., Zhang, H., and Huang, Q. (2021). A multi-geophysical parameter model in Tengchong volcanic area. Chin. J. Geophys. 64, 3657–3668. (in Chinese). doi:10.6038/cjg2021P0214
Li, S. (1988). Morphotectonic setting of the devlopment of Datong Volcano groups in the eastern part of china. Acta Geogr. sin. 43 (3), 233–240. (in Chinese).
Li, S., Suo, Y., Dai, L., Liu, L., Jin, C., Liu, Xin., et al. (2010). Development of the Bohai bay Basin and destruction of the north China Craton. Earth Scien. Front. 17 (4), 64–89. (in Chinese).
Lin, C., Peng, M., Tan, H., Xu, Z., Li, Z. H., Kong, W., et al. (2017). Crustal structure beneath Namche Barwa, eastern Himalayan syntaxis: New insights from three-dimensional magnetotelluric imaging. J. Geophys. Res. Solid Earth 122, 5082–5100. doi:10.1002/2016JB013825
Liu, G., Guo, S., and Liu, C. (1982). Seismogeological background (1976 Tangshan earthquake). Beijing: Seismological Press. (in Chinese).
Liu, R., Chen, W., Xie, G., Fan, Q., Zhou, X., Liu, C., et al. (1992). Chronology and geochemistry of Cenozoic volcanic rocks in China (in Chinese). Beijing: Seismological Press.
Liu, Y., Li, J., Wang, Y., Wang, R., Zhang, X., and Qu, M. (2017). The relationship between seismic activity and geological structure in Zhangjiakou area. Sei. Geo. Obser. Resarch (in Chin. 38 (5), 14–21.
Luo, Q., Li, C., Li, X., Ren, G., and Dong, J. (2021). Slip distribution and footwall topography of the yanggao-tianzhen fault (northern Shanxi graben):implications for the along-strike variations in fault activity and regional deformation. Tectonics 10, 1029. doi:10.1029/2020tc006593
Ma, S., Chen, H., Wang, S., Zhao, W., and Luo, J. (1998). A preliminary study for focal mechanism of Ms6. 2 earthquake on January10, 1998, In zhangbei-shangyi region. Chin. J. Geophys. 41 (5), 724–728. (in Chinese).
Peng, Y., Meng, L., Zhou, Y., Wen, C., Ran, Z., Guo, Q., et al. (2017). Characteristics of seismic structure in Hebei province(in Chinese). Shijiazhuang: Hebei People Press.
Qi, B. (2017). Study on the crustal stability in Zhangjiakou area(in Chinese). Doctoral thesis. Beijing: China Ac, geologic. Beijing: Science.
Ran, Y., Chen, L., and Xu, X. (2001). Quantitative data about active tectonics and possible locations of strong earthquakes in the future in northwest beijing. Acta Seism. Sin. 23 (5), 502–512. (in Chinese).
Shen, X., Kind, R., Huang, Z., Yuan, X., and Liu, M. (2019). Imaging the Mantle Lithosphere below the China cratons using S-to-p converted waves. Tectonophysics 754, 73–79. doi:10.1016/j.tecto.2019.02.002
Sun, X., Zhan, Y., Unsworth, M., Egbert, G., Zhang, H., Chen, X., et al. (2020). 3-D magnetotelluric imaging of the easternmost kunlun fault: Insights into strain partitioning and the seismotectonics of the jiuzhaigou Ms7.0 earthquake. J. Geophys. Res. Solid Earth 125, e2020JB019731. doi:10.1029/2020JB019731
Sun, X., Zhan, Y., Zhao, L., Chen, X., Sun, J., Li, C., et al. (2019). Electrical structure of the Kunlun–Qinling fault system, northeastern Tibetan Plateau, inferred from 3-D inversion of magnetotelluric data. J. Asian Earth Sci. 181, 103910. doi:10.1016/j.jseaes.2019.103910
Suo, Y., Li, S., Liu, X., Dai, L., Xu, L., Wang, P., et al. (2013). Structural characteristics of NWW-trending active fault zones in east China: A case study of the zhangjiakou-penglai fault zone. Acta Petrol. Sin. 29 (3), 953–966. (in Chinese).
Tan, H., Wei, W., Unsworth, M., Deng, M., and Jin, S. (2004). Crustal electrical conductivity structure beneath the Yarlung Zangbo Jiang suture in the southern Xizang plateau. Chin. J. Geophys. 47, 685–690. (in Chinese). doi:10.3321/j.issn:0001–5733.2004.04.020
Unsworth, M. J., Malin, P., Egbert, G. D., and Booker, J. R. (1997). Internal structure of the san andreas fault at parkfield. Calif. Geol. 28, 399–402. doi:10.1130/0091-7613(1997)0252.3.CO;2
Unsworth, M., Wenbo, W., Jones, A. G., Li, S., Bedrosian, P., Booker, J., et al. (2004). Crustal and upper mantle structure of northern Tibet imaged with magnetotelluric data. J. Geophys. Res. 109, 1–18. doi:10.1029/2002JB002305
Wang, C., Wu, Q., Duan, Y., Wang, Z., and Lou, H. (2017). Crustal and uppermantles tructure and dee p tect on icgene sis of largee arth quakes in North China. Sci. China Earth Sci. 60, 821–857. doi:10.1007/s11430-016-9009-1
Wang, J., Wan, X., Deng, S., Lu, X., Tian, Y., Xu, H., et al. (1996). Lithostratigraphy of Hebei province(in Chinese). Beijing: China U, Geoscien. Press.
Wang, M., and Shen, Z. (2020). Present-day crustal deformation of continental China derived from GPS and its tectonic implications. J. Geophys. Res. Solid Earth 125 (2), e2019JB018774. doi:10.1029/2019jb018774
Wang, X., Zhang, G., Fang, H., Luo, W., Zhang, W., Zhong, Q., et al. (2014). Crust and upper mantle resistivity structure at middle section of Longmenshan, eastern Tibetan plateau. Tectonophysics 619-620, 143–148. doi:10.1016/j.tecto.2013.09.011
Wang, X., Zhang, G., Zhou, J., Li, D., Luo, W., Hu, Y., et al. (2018). Crust and upper mantle electrical resistivity structure in the Longmenshan tectonic belt and its relationship with Wenchuan and Lushan earthquakes. Chin. J. Geophys. 61 (5), 1984–1995. (in Chinese). doi:10.6038/cjg2018M0233
Wessel, P., Smith, W., Scharroo, R., Luis, J., and Wobbe, F. (2013). Generic mapping tools: Improved version released. Eos Trans. AGU. 94, 409–410. doi:10.1002/2013eo450001
Wu, P., Ding, Z., Tan, H., Yang, Q., and Wang, X. (2021). Inversin MT data for the electrical structure beneath the Zhangbo seismic beltbased on constraint of the VP/VS model. Chin. J. Geophys. 64 (8), 2716–2732. (in Chinese). doi:10.6038/cjg2021O0292
Xiang, H., Fang, Z., Xu, J., Li, R., Jia, S., Hao, S., et al. (1988). Seismotectonic background and recurrence interval of great earthquakes in 1679 Sanhe-Pinggu M=8 earthquake area. Seismol. Geol. 10 (1), 15–28. (in Chinese).
Xiao, Q., Yu, G., Liu-Zeng, J., Oskin, M. E., and Shao, G. (2017). Structure and geometry of the Aksay restraining double bend along the Altyn Tagh Fault, northern Tibet, imaged using magnetotelluric method. Geophys. Res. Lett. 44, 4090–4097. doi:10.1002/2017GL072581
Xu, X., Ran, Y., Zhou, B., Yin, G., Li, J., and Liu, W. (1998). Seismotectonics and microdamage features of the Zhangbei-Shangyi earthquake. Seismol. Geol. 20 (2), 135–145. (in Chinese).
Xu, X., Wu, W., Zhang, X., Ma, S., Ma, W., Yu, G., et al. (2002). Recent tectonic changes and earthquakes in the capital circle area(in Chinese). Beijing: Science Press.
Yang, H., Yang, X., Zhan, Y., Cunningham, D., Zhao, L., Sun, X., et al. (2019). Quaternary activity of the beihewan fault in the southeastern beishan wrench belt, western China: Implications for crustal stability and intraplate earthquake hazards north of tibet. J. Geophys. Res. Solid Earth 124, 13286–13309. doi:10.1029/2018JB017209
Yang, X., Xu, Y., Liu, J., and Li, Z. (2011). Seismic tomography in the Tengchong volcanic area and its teetonic implication. Chin. J. Geophys. 54 (8), 2050–2059. (in Chinese). doi:10.3969/j.issn.0001-5733.2011.08.012
Yang, Z., and Chen, Y. (2004). Relocation of the 1998 Zhangbei-Shangyi earthquake sequence using the double difference earthquake location algorithm. Acta Seism. Sin. 26 (2), 115–120. (in Chinese).
Yang, Z., Chen, Y., and Zhang, H. (2002). Relocation and seismogenic structure of the 1998 Zhangbei-Shangyi earthquake sequence. Acta Seism. Sin. 24 (4), 366–377. (in Chinese).
Ye, T., Chen, X., Huang, Q., and Cui, T. (2021). Three-dimensional electrical resistivity structure in focal area of the 2021 Yangbi MS6.4 Earthquake and its implication for the seismogenic mechanism. Chin. J. Geophys. 64, 2267–2277. (in Chinese). doi:10.6038/cjg2021O0523
Ye, T., Chen, X., Huang, Q., Zhao, L., Zhang, Y., and Uyeshima, M. (2020). Bifurcated crustal channel flow and seismogenic structures of intraplate earthquakes in western yunnan, China as revealed by three‐dimensional magnetotelluric imaging. J. Geophys. Res. Solid Earth 125, 1–17. doi:10.1029/2019JB018991
Ye, T., Huang, Q., and Chen, X. (2018a). Three-dimensional deep electrical structure and seismogenic environment of Nantinghe fault zone in southwestern Yunnan. Chin. J. Geophys 61, 4504–4517. (in Chinese). doi:10.6038/cjg2018M0287
Ye, T., Huang, Q., Chen, X., Zhang, H., Chen, Y. J., Zhao, L., et al. (2018b). Magma chamber and crustal channel flow structures in the Tengchong volcano area from 3-D MT inversion at the intracontinental block boundary southeast of the Tibetan plateau. J. Geophys. Res. Solid Earth 123 (11), 11,112–11,126. doi:10.1029/2018JB015936
Yu, N., Hu, X., Li, J., Zhao, N., Zhou, J., Cai, X., et al. (2017). Electrical structure of the Longling area in western Yunnan and its effect on route selection of the Dali-Ruili railway. Chin. J. Geophys. 60 (6), 2442–2455. (in Chinese). doi:10.6038/cjg20170632
Zhai, J., Hu, X., Wang, L., and Lu, H. (2011). Summary of the research on volcano eruptions in Datong basin. J. Disaster-Prevention Sci. Technol. 13 (1), 82–86. (in Chinese).
Zhan, Y., Liang, M., Sun, X., Huang, F., Zhao, L., Gong, Y., et al. (2021). Deep structure and seismogenic pattern of the 2021.5.22 Madoi(Qinghai) Ms 7.4 earthquake. Chin. J. Geophys. 64 (7), 2232–2252. (in Chinese). doi:10.6038/cig2021O0521
Zhan, Y., Yang, H., Zhao, G., Zhao, L., and Sun, X. (2017). Deep electrical structure of crust beneath the Madongshan step area at the Haiyuan fault in the northeastern margin of the Tibetan plateau and tectonic implications. Chin. J. Geophys. 60, 2371–2384. (in Chinese). doi:10.6038/cjg20170627
Zhan, Y., Zhao, G., Unsworth, M., Wang, L., Chen, X., Li, T., et al. (2013). Deep structure beneath the southwestern section of the Longmenshan fault zone and seimogenetic context of the 4.20 Lushan M S7.0 earthquake. Chin. Sci. Bull. 58, 3467–3474. doi:10.1007/s11434-013-6013-x
Zhang, H., Huang, Q., Zhao, G., Guo, Z., and Chen, Y. (2016). Three-dimensional conductivity model of crust and uppermost mantle at the northern Trans North China Orogen: Evidence for a mantle source of Datong volcanoes. Earth Planet. Sci. Lett. 453, 182–192. doi:10.1016/j.epsl.2016.08.025
Zhang, S., Zhao, J., and Diao, G. (1995). A preliminary study of the relation between focal faults and deep and shallow structures in North China area. North. earth. scie. 13 (2), 1–9. (in Chinese).
Zhang, W. (2021). Study of steam magmatic eruption in the Datong Volcano area (in Chinese). Beijing: Institute. Geophys. CEA. Master thesis.
Zhang, Z., Bai, Z., Wang, C., Teng, G., Lui, H., Li, J., et al. (2005). Crustal structure in the Tam Giang area and its dynamic significance: Revelation from seismic reflection/refraction profiles in Chafang-binchuan County, Yunnan. Earth Sci. 35 (4), 314–319. (in Chinese).
Zhao, D. (2009). Multiscale seismic tomography and mantle dynamics. Gondwana Res. 15, 297–323. doi:10.1016/j.gr.2008.07.003
Zhao, G., Unsworth, M. J., Zhan, Y., Wang, L., Chen, X., Jones, A. G., et al. (2012). Crustal structure and rheology of the Longmenshan and Wenchuan Mw 7.9 earthquake epicentral area from magnetotelluric data. Geology 40, 1139–1142. doi:10.1130/G33703.1
Zhao, L., Sun, X., Zhan, Y., Yang, H., Wang, Q., Hao, M., et al. (2022). The seismogenic model of the Menyuan Ms6.9 earthquake on January 8, 2022, Qinghai Province and segmented extensional characteristics of the Lenglonging fault. Chin. J. Geophys. 65, 1536–1546. (in Chinese). doi:10.6038/cjg2022Q0051
Zhao, L., Zhan, Y., Sun, X., Hao, M., Zhu, Y., Chen, X., et al. (2019). The hidden seismogenic structure and dynamic environment of the 21 January Menyuan, Qinghai, MS6.4 earthquake derived from magnetotelluric imaging. Chin. J. Geophys. 62, 2088–2100. (in Chinese). doi:10.6038/cjg2019M0204
Zhao, L., Zhan, Y., Zhao, G., Chen, X., Yang, H., and Jiang, F. (2015). The seismogenic environment of the 2013 Minxian-Zhangxian Ms6. 6 earthquake based on the deep electrical structure. Seismol. Geol. (in Chinese) 37, 541–554. doi:10.3969/j.issn.0253-4967.2015.02.016
Zheng, X., Ding, H., Zhang, H., and Hao, C. (1998). The preliminary study on epicenter distribution and tectonic activity of Zhangbei-Shangyi earthquake sequence. Sei. Geo. Obser. Res. 19 (6), 24–27. (in Chinese).
Zhou, W. (2021). Electrical structure of geothermal area in northeast of Datong Basin(in Chinese). Wuhan: China U, Geoscience. Doctoral thesis.
Zhou, Y. (2011). Geometrical structure and tectonic deformation of fault zone in north Margin of Yanghe Basin(in Chinese)Master thesis. Beijing: Institute. Geophys. CEA.
Zhou, Y., Ran, Z., Fan, Q., Wang, Y., and Bian, Q. (2019). New signs and tectonic implications of the Shangyi-Chicheng fault. Sci. Tech. Engine 19 (2), 40–46. (in Chinese).
Zhou, Y., and You, H. (2010). Research on quaternary deformation and activities of Zhangjiakou fault, Hebei Province. Technique. earth. Disas. Pre 5 (2), 157–166. (in Chinese).
Keywords: Zhangjiakou-Bohai fault zone, 3D magnetotelluric imaging, electrical structure, 1998 Zhangbei earthquake, seismogenic environment
Citation: Peng Y, Sun X, Zhan Y, Zhao L, Luo Q, Liu X, Ran Z and Wang L (2022) 3D deep electrical structure and seismogenic environment in the western section of the Zhangjiakou-Bohai fault zone. Front. Earth Sci. 10:966192. doi: 10.3389/feart.2022.966192
Received: 10 June 2022; Accepted: 26 July 2022;
Published: 02 September 2022.
Edited by:
Wenjun Zheng, Sun Yat-sen University, Zhuhai Campus, ChinaReviewed by:
Lanfang He, Institute of Geology and Geophysics (CAS), ChinaCopyright © 2022 Peng, Sun, Zhan, Zhao, Luo, Liu, Ran and Wang. This is an open-access article distributed under the terms of the Creative Commons Attribution License (CC BY). The use, distribution or reproduction in other forums is permitted, provided the original author(s) and the copyright owner(s) are credited and that the original publication in this journal is cited, in accordance with accepted academic practice. No use, distribution or reproduction is permitted which does not comply with these terms.
*Correspondence: Yan Zhan, emhhbnlhbjY2QHZpcC5zaW5hLmNvbQ==
†These authors have contributed equally to this work and share first authorship
Disclaimer: All claims expressed in this article are solely those of the authors and do not necessarily represent those of their affiliated organizations, or those of the publisher, the editors and the reviewers. Any product that may be evaluated in this article or claim that may be made by its manufacturer is not guaranteed or endorsed by the publisher.
Research integrity at Frontiers
Learn more about the work of our research integrity team to safeguard the quality of each article we publish.