- 1Faculty of Engineering, China University of Geosciences, Wuhan, China
- 2China Electric Power Research Institute Co., Ltd, Beijing, China
- 3State Grid Smart Internet of Vehicles Co., Ltd, Beijing, China
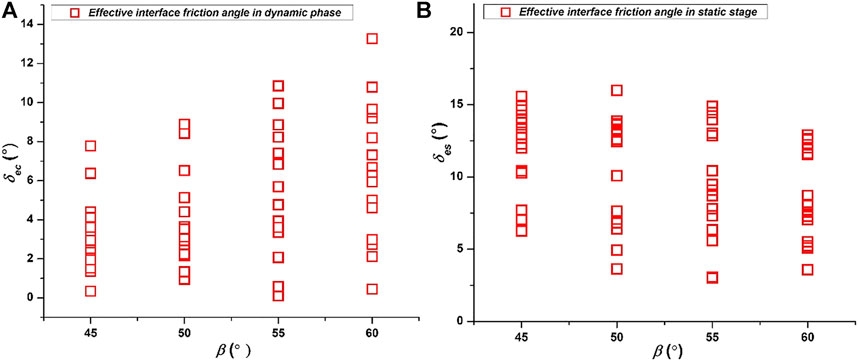
By using the normal and tangential forces measured in experiments of granular flow impact against a retaining wall, the effective interface friction angle of the wall was calculated in the dynamic phase and the static phase respectively, designated as δec and δes, and both of them are smaller than the interface friction angle measured by laboratory test (δ2). It is found δec shows an increasing trend against inclination angle (β), which is opposite to that of δes; and δec has an underestimation of effective interface friction angle. By comparing the calculated normal forces of static phase and of dynamic phase with the measured values, it is found the lower bound relation between δes/δ2 and β obtained from regression analysis could well calibrate the effective interface friction angle for both the wall and flume base. It is also noted that the increasing trend of δec against β may be explained by the higher proportion of gravity-friction force at lower inclination angle, i.e., the higher proportion of drag force at higher inclination angle.
1 Introduction
A granular flow impact, such as a landslide or a rock avalanche impinging against a retaining wall or other structures, could generate tremendous impact force on the structures against its flow (Sovilla et al., 2008; Faug et al., 2011). As concluded by Faug et al. (2009) and Jiang et al. (Jiang and Towhata., 2013; Jiang et al., 2015) in a granular flow impact event for both impact modes, see Figure 1, the force exerted on a retaining wall is basically composed of three force components: a drag force (Fd) (Buchholtz and Pöschel, 1998) and a passive earth force (Fp) (Savage and Hutter, 1989), both of them are produced by the flowing or inertial layer; and a gravity-and-friction induced force (Fgf) generated by the stagnant zone formed in front of the wall(Jiang and Towhata, 2013). According to the average velocity (v) and depth of flowing layer (h), and the weight of stagnant zone (G), the three force components could be calculated by the Eqs. 1–3.
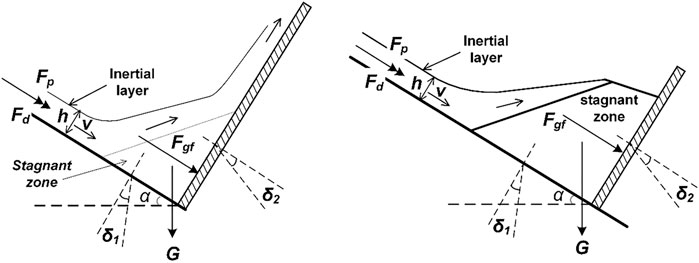
FIGURE 1. Drag force (Fd), passive earth force (Fp) and gravity-and-friction force (Fgf) respectively produced by inertial layer and stagnant zone in a granular flow impact event for two kinds of impact mode. δ1 and δ2 are respectively the interface friction angles of the flume base and the retaining wall.
In which
In which
In the previous research Bryant et al. (2014) reported that in a granular flow the actual basal friction is smaller than what measured in laboratory interface friction tests. While for a granular flow impact process Jiang et al. (2015) found for the stagnant zone the actual value of friction angle between granular material and the interface of retaining wall (δ2 in Eq. 3) is also significantly smaller than the value measured by laboratory interface friction tests; also compared with δ2, the reduction of δ1.more significantly increases the value of Fgf calculated by Eq. 3. As a further extension of Jiang’s previous work, this paper provides a more detailed study of the reduction of interface friction angle and a calibration of the effective interface friction angles for impact force calculation.
2 Experimental methodology
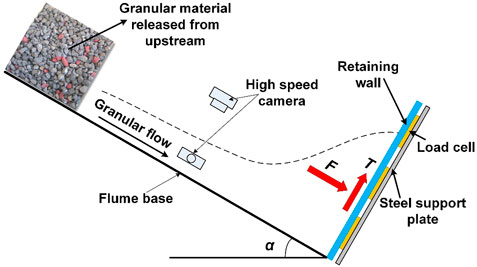
As shown in Figure 2, the height and width of the flume were 0.35 m, and 0.3 m, respectively. In order to simulate a granular flow impact process, a mass of limestone particles (named as Particle1) were released on the upstream of the flume with an inclination of α. There was a trigger gate in front face of the moving particles to control the release of the particles. After flowing a distance of 2.19 m, it impacted the retaining wall installed at the downstream of the flume. In the experiments the impact force exerted on the retaining wall was measured in both normal and tangential directions by an array of load cells. The total normal force (F) and total tangential force (T) could be deduced from the load cells records. The current methodology neglected the influence of non-uniform normal forces measured from the load cells and ignored the development of interface friction as a function of relative movement between the soil and the interface material. The motion of impact process and the surface velocity of granular flow were recorded by high speed cameras installed at the downstream of the flume. Each model test was named according to the length (L) and height (H) of the initial deposition, and the inclination angle of flume base (α), such as “Particle1-L44-H20-α45,” which indicates an experiment of Particle1 with an initial length and height of 44 and 20 cm, and a inclination angle of 45°. By changing initial length, height and inclination angle 64 tests were done in total.
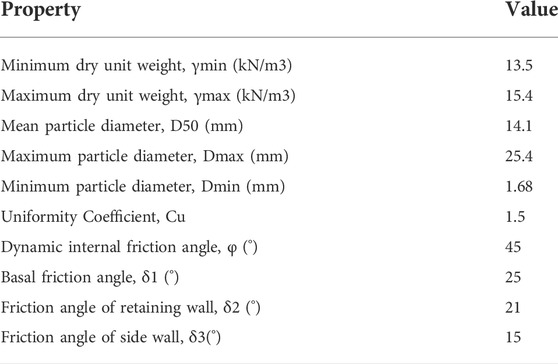
By referring to Burkalow (1945), Pudasaini et al. (2007) and Jiang and Towhata (2013), the interface friction angles of Particle1 with flume base, retaining wall and side wall were measured by laboratory tests. In the tests a paper cylinder with a diameter of more than 10 times of mean particle diameter (D50) and a height of more than 5 times of D50, was filled with Particle1 and placed on the plate which is the same material as flume base or retaining wall or side wall. A gap of half D50 was kept between paper cylinder and the plate to avoid friction. Then by slowly tilting the plate until the cylinder started to move, the inclination angle was recorded as the interface friction angle between Particel1 and the plate. Physical properties of Particle1 are listed in Table 1.
3 Results analysis
3.1 Reduction of interface friction
In order to calculate the effective interface friction angle in a granular flow impact process, first of all, the time history of the total normal force (F) and total tangential force (T) were plotted in Figure 3A. The force history could be categorized into two phases: one is the dynamic phase, in which granular flow interacts with the retaining wall, both the flowing layer and the stagnant zone determine the force on the wall (Figure 3B); the other is the static phase, in which granular flow ceases, only the stagnant zone generates force on the wall (Figure 3C). For the dynamic phase the forces were deduced at the time when maximum F occurred, and the corresponding normal and tangential forces are defined as Fcr and Tcr; while for the static phase, since both normal and tangential forces are constant, therefore, they were deduced at any time and defined as Fs and Ts.
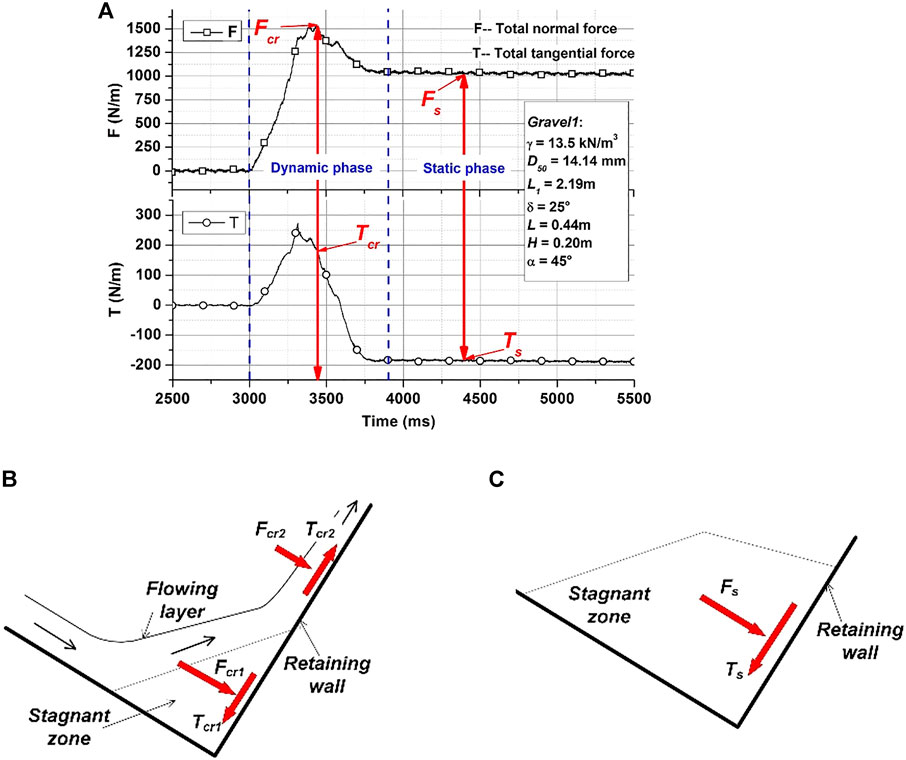
FIGURE 3. (A) Total normal and tangential forces history composed of dynamic and static phases, (B) Force generation mode in dynamic phase, (C) Force generation mode in static phase.
Fcr, Tcr, Fs, and Ts were deduced for all the 64 experiments, thereafter, the effective interface friction angle of the dynamic phase was calculated by
As shown in Figure 3B in the dynamic phase the flowing layer produced a normal sub-force (Fcr1) and a tangential sub-force (Tcr1); meanwhile, the stagnant zone produce another pair of normal sub-force (Fcr2) and tangential sub-force (Tcr2). It is clear that the two tangential sub-forces are opposite in direction, which means the resultant tangential force is smaller than either Tcr1 or Tcr2, i.e., the effective interface friction angle calculated from
3.2 Calibration of effective interface friction angle
In Figure 4B the effective interface friction angle (δes) was calculated for the wall, however, from Figure 1 and Eq. 3 it is known that the normal force on the wall is determined by both the frictions of the wall and flume base. Therefore, it is also necessary to evaluate the effective interface friction angle of flume base. Since the laboratory measured interface friction angles of the wall and the flume base are close (Table 1), therefore, authors assume the reduction law for the wall and the flume base is the same; and if a relation between δes and β could be obtained from Figure 4B, it will be also applicable to the calibration of the effective interface friction angle of flume base.
In order to obtain one proper relation to calibrate δes, first, δes was normalized by δ2 and plotted against β in Figure 5. The green dash line is the fitting of the data and defined as intermediate relation. Since for each β the value of δes/δ2 has a wide scope, therefore, by offsetting the green line to the greatest and lowest bounds of δes/δ2, an upper bound (light blue dash line) and a lower bound (deep blue dash line) relationships were found. According to the β of flume base and wall, the corresponding δes will be calculated. Consequently, it is going to be verified that if any of the relations could well calibrate δes.
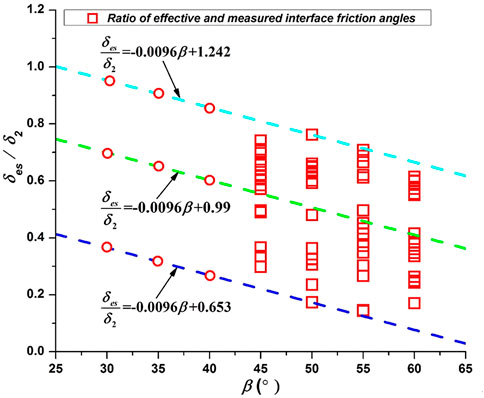
FIGURE 5. Relation of reduction rate of interface friction angle (δes/δ2) and inclination angle (β); the red circle is where the value of δes will be calculated for flume base.
In Figure 6, the normal force in static phase was calculated by Eq. 3 and designated as Fsc, and plotted against experimentally measured Fs. From Figures 6A–D the interface friction angles were either set as δ1 and δ2 or calculated by the three fitting relations in Figure 5.
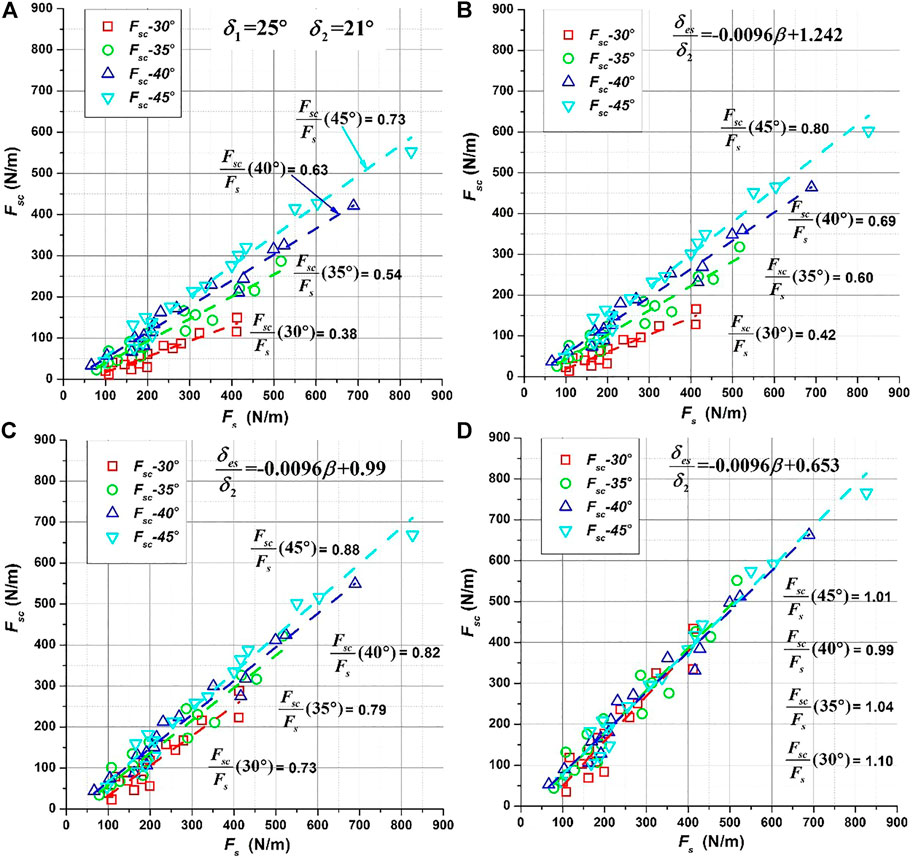
FIGURE 6. Comparison of calculated normal force of static phase (Fsc) with normal force of experimental measurement (Fs).
Different colors was used to differentiate the results of different inclination angle. In Figure 6A it is clear that using δ1 = 25° and δ2 = 21° the calculated Fsc were smaller than the measured Fs; and with inclination angle (α) decreasing, the ratio of Fsc over Fs decreases from 0.73 to 0.38, i.e., the smaller the inclination angle is, the greater Fsc deviates from Fs.
From Figure 6B and Figure 6D, the ratio of Fsc/Fs get greater from upper bound relation to intermediate relation and to lower bound relation. As shown in Figure 6D for all the inclination angles the ratios of Fsc/Fs are close to 1.0, i.e., the lower bound relation gives the most accurate calibration of δes. As a second validation, the normal impact force of dynamic phase was calculated by summation of Eqs. 1,3 and designated as Fsum. In Figures 7A,B Fsum were respectively calculated by using the interface friction angle measured by laboratory test and that calibrated by lower bound relation, and were plotted against the experimentally measured impact force (Fcr). In Figure 7A it is clear before calibration the ratio of Fsum/Fcr is always smaller than 1.0, and also decreases with inclination angle; for inclination angle of 30° the Fsum is only half of Fcr. After calibration for all the inclination angles the ratio of Fsum/Fcr is very close to 1.0, which once again indicates that the lower bound relation is suitable for the calibration of effective interface friction angle.
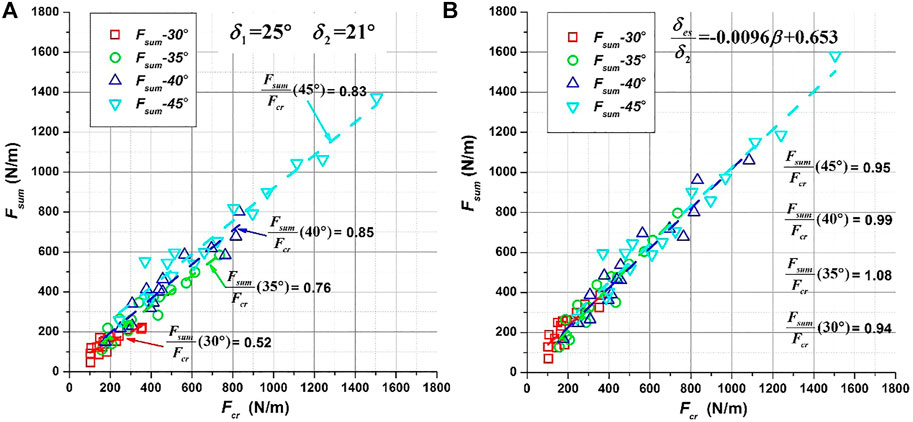
FIGURE 7. Comparison of calculated normal force of dynamic phase (Fsum) with normal force of experimental measurement (Fcr).
4 Discussion
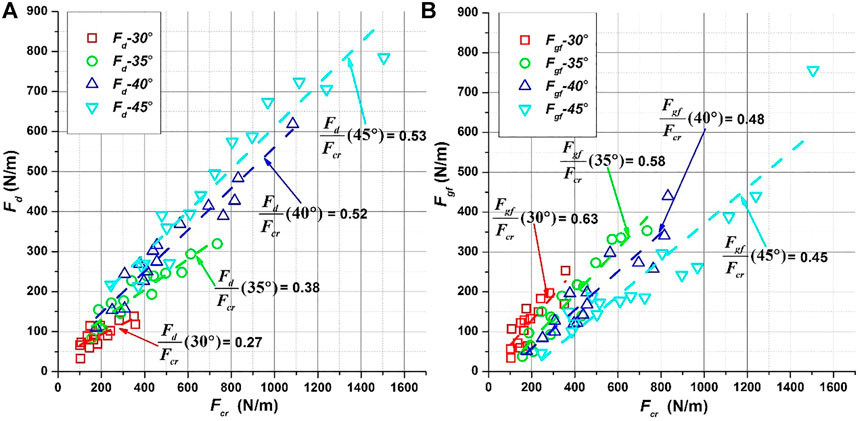
In Section 3, Figures 4A,B present two opposite trends between δes and β. Since Figure 4B is already validated to be the correct representation of effective interface friction angle, hereby, the reason for the decreasing trend between δec and β in Figure 4A is going to be discussed. First, the two main force components, Fd and Fgf, were respectively plotted against Fcr in Figure 8, in which Figure 8A shows for higher inclination angle the proportion of Fd is higher; and Figure 8B shows for lower inclination angle the proportion of Fgf is higher. For higher inclination angle where the drag force is in domination (Figure 8A), the relatively thicker flowing layer (Figure 1A) produces more upward tangential sub-force; vice versa, for lower inclination angle where the gravity-and-friction force is dominating (Figure 8B), the flowing layer is thinner (Figure 1B), and less upward tangential sub-force is produced. Consequently, for higher inclination angle the resultant tangential force is relatively smaller, the effective friction angle calculated by
5 Conclusion
The effective interface friction angle of the wall calculated for the dynamic phase and the static phase (δec and δes) are smaller than the laboratory measured δ2. It is found δec shows an increasing trend against inclination angle (β), which is opposite to that of δes; and δec has an underestimation of effective interface friction angle. By using regression analysis an upper bound relation, an intermediate relation and a lower bound relation were obtained for δes/δ2 and β. It is found the lower bound relation could well calibrate the effective interface friction angle for both the wall and flume base. It is also noted that the increasing trend of δec against β in Figure 4A may be explained by the higher proportion of gravity-friction force at lower inclination angle, i.e., the higher proportion of drag force at higher inclination angle.
Data availability statement
The raw data supporting the conclusion of this article will be made available by the authors, without undue reservation.
Author contributions
BZ contributed to conception and investigation of the study and wrote the first draft of the manuscript. All authors contributed to manuscript revision, read, and approved the submitted version.
Funding
This study was funded by the National Key R&D Program of China, grant number 2018YFC0809400.
Conflict of interest
Authors BZ, YL, XK, CL, XX and YD were employed by China Electric Power Research Institute Co., Ltd. Author YZ was employed by State Grid Smart Internet of Vehicles Co., Ltd.
Publisher’s note
All claims expressed in this article are solely those of the authors and do not necessarily represent those of their affiliated organizations, or those of the publisher, the editors and the reviewers. Any product that may be evaluated in this article, or claim that may be made by its manufacturer, is not guaranteed or endorsed by the publisher.
References
Bryant, S. K., Take, W. A., and Bowman, E. T. (2014). Observations of grain-scale interactions and simulation of dry granular flows in a large-scale flume. Can. Geotech. J. 52, 638–655. Published on the web 19 September 2014. doi:10.1139/cgj-2013-0425
Buchholtz, V., and Pöschel, T. (1998). Interaction of a granular stream with an obstacle. Granul. Matter 1, 33–41. doi:10.1007/pl00010908
Burkalow, A. (1945). Angle of repose and angle of sliding friction: An experimental study. Geol. Soc. Am. Bull. 56 (6), 669–707. doi:10.1130/0016-7606(1945)56[669:aoraao]2.0.co;2
Faug, T., Beguin, R., and Chanut, B. (2009). Mean steady granular force on a wall overflowed by free-surface gravity-driven dense flows. Phys. Rev. E 80, 021305. doi:10.1103/physreve.80.021305
Faug, T., Caccamo, P., and Chanut, B. (2011). Equation for the force experienced by a wall overflowed by a granular avalanche: Experimental verification. Phys. Rev. E 84, 051301. doi:10.1103/physreve.84.051301
Jiang, Y.-J., and Towhata, I. (2013). Experimental study of dry granular flow and impact behavior against a rigid retaining wall. Rock Mech. Rock Eng. 46 (4), 713–729. doi:10.1007/s00603-012-0293-3
Jiang, Y. J., Zhao, Y., Towhata, I., and Liu, D.-X. (2015). Influence of particle characteristics on impact event of dry granular flow. Powder Technol. 270, 53–67. doi:10.1016/j.powtec.2014.10.005
Pudasaini, S. P., Hutter, K., Hsiau, S-S., Tai, S-C., Wang, Y., and Katzenbach, R. (2007). Rapid flow of dry granular materials down inclined chutes impinging on rigid walls. Phys. Fluids (1994). 19 (5), 053302. doi:10.1063/1.2726885
Savage, S. B., and Hutter, K. (1989). The motion of a finite mass of granular material down a rough incline. J. Fluid Mech. 199, 177–215. doi:10.1017/s0022112089000340
Sovilla, B., Schaer, M., Kern, M., and Bartelt, P. (2008). Impact pressures and flow regimes in dense snow avalanches observed at the vallée de la sionne test site. J. Geophys. Res. 113 (F1), F01010.
Glossary
a Empirical constant
T Total tangential force, N/m
g Gravitational acceleration, m/s−2
Tcr Total tangential forces of dynamic phase, N/m
h Flow thickness, m
Tcr1 Tangential sub-force of dynamic phase, N/m
kp Passive earth pressure coefficient
Tcr2 Tangential sub-force of dynamic phase, N/m
n Empirical constant
Ts Total tangential force of static phase, N/m
v Depth-averaged velocity, m/s
Dmin Minimum particle diameter, mm
Cd Empirical drag coefficient
α Inclination angle of flume base, °
D50 Mean particle diameter, mm
β Inclination angle, °
Dmax Maximum particle diameter, m
γmin Minimum dry unit weight, kN/m3
Fr Froude number
γmax Maximum dry unit weight, kN/m3
F Total normal force, N/m
δ1 Interface basal friction angle, °
Fcr Total normal force of dynamic phase, N/m
δ2 Interface friction angle of retaining wall, °
Fcr1 Normal sub-force of dynamic phase, N/m
δ3 Interface friction angle of side wall, °
Fcr2 Normal sub-force of dynamic phase, N/m
δec Equivalent interface friction angle of dynamic phase, °
Fs Total normal force of static phase, N/m
δes Equivalent interface friction angle of static phase, °
Fsum Total normal force calculated by equation, N/m
θ Angle of repose, °
G Weight of the stagnant zone, N/m
ρ Density of granular flow, kN/m3
H Height of the initial deposit, m
φ Dynamic internal friction angle, °
L Length of the initial deposit, m
Fd Drag force, N/m
Fp, Passive earth force, N/m
Fgf Gravity-and-friction-induced force, N/m
Kp Passive coefficient
Keywords: granular flow, interface friction angle, retaining wall, impact, calibration
Citation: Zhao B, Zhang Y, Liu Y, Kong X, Liu C, Xu X and Deng Y (2022) Calibration of effective interface friction angle in granular flow impact experiment. Front. Earth Sci. 10:964055. doi: 10.3389/feart.2022.964055
Received: 08 June 2022; Accepted: 12 August 2022;
Published: 23 September 2022.
Edited by:
Wen Zhang, Jilin University, ChinaReviewed by:
Yuanjun Jiang, Chinese Academy of Sciences (CAS), ChinaXiaoyi Fan, Southwest Petroleum University, China
Copyright © 2022 Zhao, Zhang, Liu, Kong, Liu, Xu and Deng. This is an open-access article distributed under the terms of the Creative Commons Attribution License (CC BY). The use, distribution or reproduction in other forums is permitted, provided the original author(s) and the copyright owner(s) are credited and that the original publication in this journal is cited, in accordance with accepted academic practice. No use, distribution or reproduction is permitted which does not comply with these terms.
*Correspondence: Binbin Zhao, emhhb2JpbmJpbkAxNjMuY29t
 Binbin Zhao
 Yingtian Zhang3
 Xiaoang Kong
 Chang Liu