
94% of researchers rate our articles as excellent or good
Learn more about the work of our research integrity team to safeguard the quality of each article we publish.
Find out more
ORIGINAL RESEARCH article
Front. Earth Sci., 09 January 2023
Sec. Environmental Informatics and Remote Sensing
Volume 10 - 2022 | https://doi.org/10.3389/feart.2022.962498
This article is part of the Research TopicArtificial Intelligence and Machine Learning in Earth ScienceView all 5 articles
 Shangzhi Li
 Meng Zhang*
The leaf area index (LAI) is a crucial descriptive parameter of the dynamic change of ground vegetation. The widely used MODIS LAI product, however, does not satisfy the requirements of regional eco-environment modeling. There is an urgent need to improve the product’s overall accuracy. Under this circumstance, this study proposed an improvement scheme based on the nonlinear autoregressive neural network with eXogenous input (NARXNN) model and the high-quality time series LAI inversion result. Case studies were implemented for two seasons a year croplands in Wuzhi, Xinzheng, and Xiangcheng in Henan province. This research acquired 46 periods of the NARXNN model-improved LAI, which went through rigid in situ LAI validation. The in situ measured LAI by LAI-2000 was used to validate the accuracy of NARXNN-enhanced LAI data. The R2 values of the improved LAI of the three research areas are 0.54, 0.41, and 0.51, while the RMSE decreased by 0.07, 0.1, and 0.03, and the bias also decreased to a certain extent. Direct validation using the in situ measured LAI demonstrates that the NARXNN model-enhanced LAI data were more accurate and had a lower bias than MCD15A2H. A comparison of the time series change indicates that the NARXNN-enhanced LAI shows a smoother bimodal change trend and is more conformed to the actual cropland growth than the original MODIS product. The results indicated that the NARXNN neural network further increased the accuracy of the MODIS product and has a particular practical value in future research.
As an important part of the earth’s ecosystem, surficial vegetation plays an important role in controlling terrestrial productivity, surface energy balance, and hydrological cycling, which affects the natural environment and human settlements directly and indirectly (Qi et al., 2022). The quantitative description of surface vegetation in remote sensing usually relies on the vegetation index (VI) and leaf area index (LAI) (Xue and Su, 2017). The leaf area index is defined as one-half of the total green leaf area per unit of the land area (Chen and Black, 1992) and is a dimensionless and dynamic parameter, which changes with the number of leaves (Jonckheere et al., 2004). The LAI plays a crucial variable in vegetation photosynthesis, respiration, carbon cycle, and rainfall interception (Luo et al., 2013), and it has been widely used in many meteorological, ecological, and agricultural studies. By 2011, the Global Climate Change Research Community listed the LAI as a rudimentary global vegetation attribute (Fang et al., 2019).
Remote sensing is the only way to access ground parameters on a global and regional scale. The development of the Earth Observation Plan has provided massive reference data for the production of global LAI products. Over the last decades, a number of global LAI products with different spatial and temporal characteristics have become available, for example, the MODIS LAI, CYCLOPES LAI (Baret et al., 2007), GEOV2, and PROBA-V (Fuster et al., 2020). However, the current LAI products could not meet the systematic requirements of accuracy for climate studies and other applications (Sprintsin et al., 2009). Thus, it is highly needed to get more precise LAI data (Heinsch et al., 2006). Currently, the improvement solutions of LAI products have been composed of the development of new products with more advanced algorithms and precise measurement and post-process of the existing products (Wang and Liang, 2014). Obviously, the latter category is more feasible and economical for regional studies. The usual product post-processing scheme consisted of varying approaches including thresholds, Fourier fitting, curve smoothing, and other modalities. For example, Viovy et al. (1992) proposed a best index slope extraction (BISE) algorithm to reduce noise in time series NDVI data. Chen et al. (2004) developed a simple but robust method based on the Savitzky–Golay filter to smooth out noise in NDVI time series, specifically that which is caused primarily by cloud contamination and atmospheric variability. Hermance et al. described a data-adaptive weighted recursive least square (LS) modeling procedure using high-order annual splines for characterizing the detailed intra-annual and interannual behaviors of representative members of vegetation classes for multiyear time series (Cleveland and Devlin, 1988). Xu et al. (2017) came up with a pixel-to-pixel correction (PPC) method to replace unreliable MODIS LAI time series and successfully improved the accuracy of raw MODIS LAI products. Wang and Liang (2014) proposed a method based on optimal interpolation (OI) to integrate MODIS true LAI and CYCLOPES effective LAI retrievals. The integrated results agree better with the LAI reference maps than the MODIS LAI product. The aforementioned methods can improve the accuracy of LAI products to a certain extent, and each has its own pros and cons in applications. Nevertheless, the neural network has strong nonlinear fitting abilities and is widely used in LAI retrieval, but to the knowledge of the authors, the neural network has not been used to improve the LAI products. In addition, scant attention has been paid to the Central Chinese cropland in improving MODIS LAI products.
Based on prior knowledge, this article proposed a method of improving the MODIS LAI product based on the periodic growth of the cropland and the connection between the LAI and surface reflectance. The basic idea is to maximize the high-quality product information in a certain area and replace the backup algorithm’s retrieved pixels. With this approach, a NARX neural network was designed and trained to utilize the historical information on the croplands and get a more reasonable LAI. The main contributions to this work are two-fold. First, the applicability of recurrent neural networks was tested in improving MODIS products. Second, the experiment was conducted in cropland areas that are highly influenced by human activities. The remainder of this article is organized as follows. Section 2 demonstrates the geographic conditions of the study area, MODIS reflectance product, MODIS land classification product, MODIS LAI product, and the in situ measured LAI. Section 3 introduces the architecture and structural design of the NARX model and the model parameter training and retrieval procedure. Section 4 describes the NARX-improved MODIS product and accuracy validation compared with the original LAI. Sections 5 and 6 discuss the applicability and shortage of the NARXNN model in improving MODIS LAI products.
In this research, as shown in Figure 1, three research areas were selected, namely, Wuzhi, Xinzheng, and Xiangcheng, all of which are located in the north and middle regions of Henan province, China, between 110°21′–116°39′ E and 31°23′–36°22′ N. The main land cover types are cropland and construction lands, and the main crop types are wheat and maize. When the summer maize is sowed in mid-June and harvested in late September, the growing season of winter wheat is from October to June of the next year. The topography of the study areas is characterized by a sizable alluvial plain with elevations of 50–100 m above sea level. The territory’s north, west, and south directions are encircled by the Taihang Mountains, the Funiu Mountains, and the Dabie Mountains. Most of the rainy season is concentrated in summer, with a total rainfall of about 464.2–1193.2 mm (Shi et al., 2016), and diminishes from south to north. The abovementioned three places in Henan province pertain to a warm temperate monsoon climate with a mean annual air temperature of 12.9–16.5°C, and the highest temperature occurs in July (Li et al., 2022).
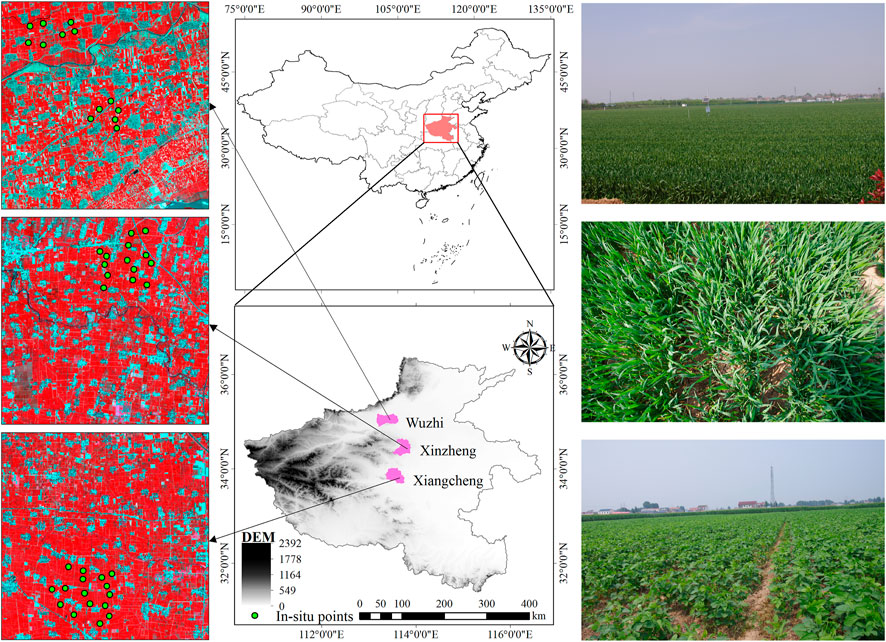
FIGURE 1. Locations of Wuzhi, Xinzheng, and Xiangcheng in Henan province, China. The left side was a 30-m spatial resolution Landsat-8 OLI standard false-color composite image (band 5, band 4, and band 3 of the OLI instrument were used as R, G, and B bands, respectively). Locations of in situ measurements are displayed as green points. The right side is part of the field scene photographs of the in situ LAI.
Both satellite and in situ LAI data are used in this study. Satellite data contain the MCD15A2H leaf area index product, MOD09A1 surface reflectance product, and auxiliary MCD12Q1 land cover classification data. The product path and row numbers are 27 and 5, respectively. All the MODIS data were downloaded from https://lpdaac.usgs.gov/. In situ measured LAI data were deployed in Wuzhi, Xinzheng, and Xiangcheng in Henan province. A brief description of the datasets is presented as follows.
The MCD15A2H product consists of six datasets as illustrated in Table 1. The LAI dataset of the MCD15A2H product is a combination of the three-dimensional radiation transfer model and NDVI-LAI empirical relationship model. The input data on the abovementioned algorithms include MOD09GA surface reflectance data and land classification data. The MCD15A2H product has a 500-m spatial resolution and a temporal resolution of 8 days. The quality control (QC) band demonstrated the data quality of the MODIS product (Yang et al., 2006). When converting the QC tags into binary, the last three bits represent the status of the retrieval result and can be divided into five categories: 1) when the “SCF_QC” equals “000,” the LAI pixel value was reversed by the main algorithm and without saturation, which has the best quality. 2) The “001” label represents that the main algorithm produced the corresponding pixel, but saturation occurred, which is also acceptable in practical applications, 3) the “010” label means that the LAI-NDVI empirical relationship algorithm was used due to bad geometry, 4) the “011” label means the backup algorithm was used due to other problems, and 5) the “100” label means not produced.
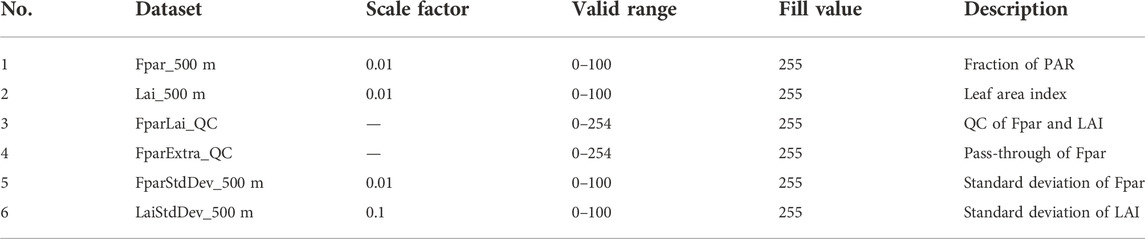
TABLE 1. Datasets of the MCD15A2H product.
The MOD09A1 C6 land surface reflectance product offered seven MODIS spectral bands carried by the Terra satellite, including visible, near-infrared, and shortwave infrared bands (Table 2). The reflectance data went through various conditions of atmospheric correction, including gas, aerosol, and Rayleigh scattering (Xiao et al., 2015). The MOD09A1 product was synthesized by the best reflectance data over 8 days and had a 500-m spatial resolution, which means the spatiotemporal resolution is the same as the MCD15A2H product. Apart from reflectance bands, this product also provided two quality control bands and three observation angle bands (sun zenith, view zenith, and relative azimuth).
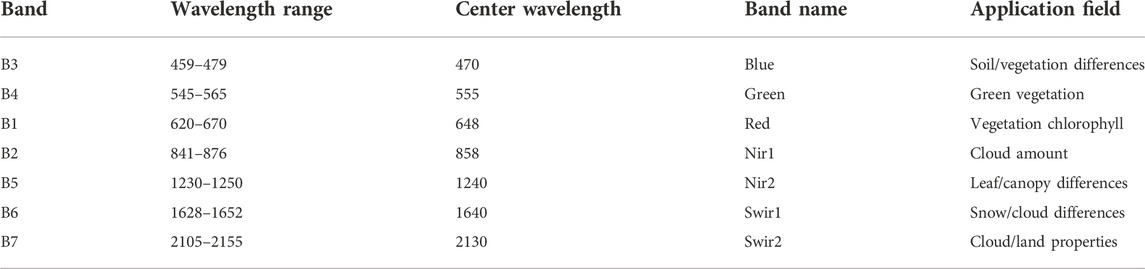
TABLE 2. MOD09A1 seven bands and their main application fields.
The MCD12Q1 land classification product was produced from Terra and Aqua satellite observation data in 1 year. The classification method used is a supervised decision tree, and the spatial resolution is 500 m (Friedl et al., 2002). The MCD12Q1 classification product organizes five land cover classification datasets, such as the IGBP, UMP, and LAI/FPAR scheme. The IGBP scheme classified land use into 17 classes (Friedl et al., 2010). The primary vegetation types were croplands, deciduous broadleaf forest, grasslands, and mixed forest.
In March, April, July, and August of 2018, we deployed LAI in situ measurement work to get the LAI of wheat and maize in Wuzhi, Xinzheng, and Xiangcheng. The measuring instrument is the plant canopy analyzer LAI-2200 invented by LI-COR (Fang et al., 2014). During the overcast sky or around sunset moment, the measurement task selected unobscured areas with a single vegetation cover. The distribution of stroke points thoroughly considered the uniformity in spatial distribution. The area of the sample is 30 m × 30 m. Moreover, each sample was measured five times and the average of the five measurements was considered as in situ LAI.
Figure 2 presents a flowchart of implementation using the NARX model to improve the MODIS LAI product. First, we used quality control tags in the MCD15A2H and MOD09A1 products to select the main algorithm-retrieved LAI, time series continuous LAI, and ideal quality reflectance data pairs. Second, cropland land cover pixels will be selected according to the MCD12Q1 IGBP dataset. Then, the selected training data will be used to train the NARXNN model. Immediately, the NARXNN model will be applied to MODIS reflectance data. Furthermore, the NARX model-retrieved LAI will compromise the main algorithm-retrieved LAI in the MCD15A2H product to make the maximum use of the 3D radiative transfer model and the strength of the NARXNN model and overcome errors brought by the backup algorithm; to verify the accuracy of the improved LAI, in situ measured LAIs were used to validate the accuracy and time continuity of NARX model-improved MODIS LAI data and compare it with the original product.
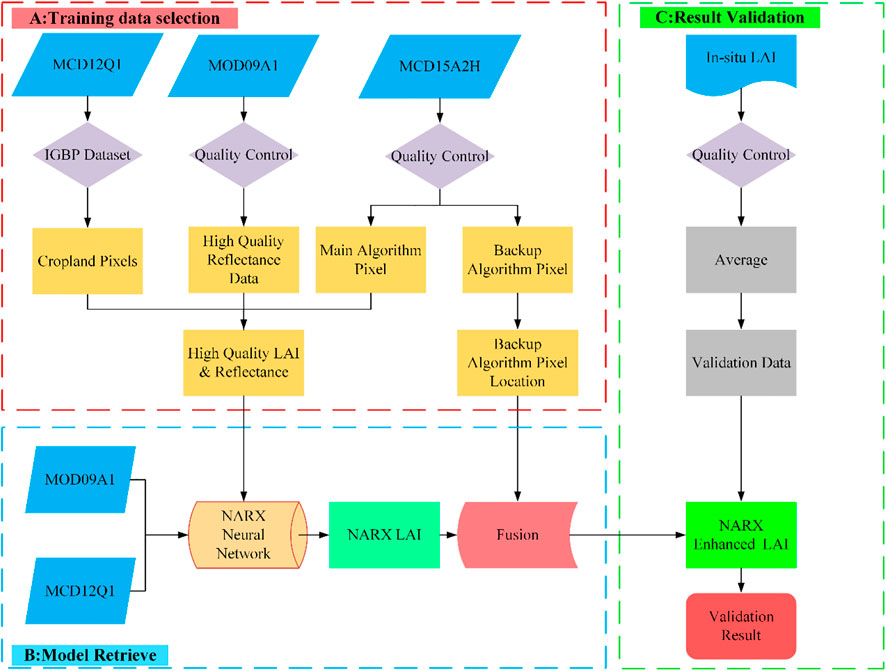
FIGURE 2. Flow chart of the NARXNN method to generate the NARX-enhanced LAI product using the MODIS datasets.
Structurally, the NARXNN model was composed of an input layer, a hidden layer, an output layer, and a time delay from output to input. The NARXNN model used the exogenous input parameter and delayed time series data to train the neural network. Therefore, the NARXNN model has the memorial function, which can keep the status information in the structure and thus can approach complex nonlinear relations. The mathematical expression of the NARXNN model is as follows:
In Figure 3, the NARXNN model contains M exogenous input Ik and N feedback time-delayed output Oj, so the input of this neural network It is {I1, I2,…, IM} at the time t, while the corresponding feedback Ct equals {Ot-1, Ot-2,…, Ot-N}. When there is no exogenous input X, the NARXNN model will become a pure nonlinear autoregressive neural network. Nevertheless, no time delay will transform the NARXNN model into a back-propagation neural network. The hidden layer consists of j neural nodes. The output of jth neuron Hj will be as follows:
where f means the activation function of the hidden layer. Ii is the ith input index, and wji is the connection weight matrix from i to j. bj is the threshold of jth hidden neurons. The output of this network is
where S is the number of hidden neurons; Woj is the connection weight matrix from neuron j to the output neuron; and bo is the threshold of the output neuron.
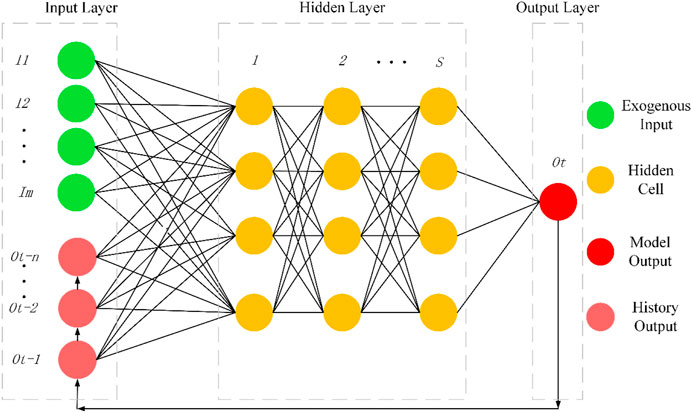
FIGURE 3. Architecture of the NARXNN model configured with the m exogenous input variable, n time-delayed output variable, and S hidden layer.
In the first place, the LAI has a substantial correlation with the red and near-infrared bands. Many LAI products used the abovementioned spectral bands in the retrieval program. The MODIS sensor is also provided with two shortwave bands that are more sensitive to vegetation water content and can depict the inner leaf structure and dry matter content.
Moreover, the LAI is closely related to the satellite measurement angle (Feret et al., 2008). As a geometry parameter, the satellite angle is tightly connected with the relative position and will not be affected by the measurement system error. Even though the cloud and aerosol contaminated the surface reflectance, the angle information can still be used for model retrieval unaffected.
Consequently, the exogenous input parameter of the NARXNN model includes the red band, near-infrared band, two shortwave infrared bands, sun zenith, view zenith, and relative azimuth. The model output is the LAI. When the NARXNN model parameters are fixed, Eq. 1 will become the following:
Using a neural network to establish a vegetation LAI dynamic change model, the quality of training data is equally as important as the capability of the neural network. To begin with, arrange the MCD15A2H LAI product and MOD09A1 reflectance product according to the time sequence. Then, select the main algorithm inversed time series continuous, high-quality LAI reflectance pairs as training data via the quality control tags in the QC band. Furthermore, divide the training data into different classes according to the IGBP dataset of the MCD12Q1 land use product. In this way, sufficient numbers of high-quality reflectance and LAI pairs were chosen to be ready for training. The organization format of training data is as follows:
In practical application, the training of the NARXNN model involves the configuration of network structure and parameters. The neurons of the input layer must match the exogenous parameter, and the output layer is the LAI. In addition, the hidden layer has three layers, the number of which is 10, 20, and 10, respectively. The sigmoid function [1/(1+e-x)] was selected as the activation function of the NARXNN model, for it has a relatively fast convergence rate. Training samples will be divided into training, validation, and test data. The training part will be used to update the weight matrix and the bias vector. Furthermore, the validation data are going to test the model error and assess the model performance. In advance of the training, the training data will be standardized to [0, 1] to prevent the effect of scale differences brought by different physical meanings while increasing the convergence performance at the same time. In the training process, the epochs of training are adjustable. A longer period implies better accuracy and a longer calculation time.
The coefficient of determination (R2), root mean square error (RMSE), and bias were used as the criteria to quantitatively evaluate the accuracy of experimental results. In general, larger R2 and lower RMSE represent higher inversion accuracy, while bias can depict the average value prediction conditions. These three statistical variables are defined as follows:
where xi represents the ith ground-measured LAI, yi represents the corresponding model-retrieved LAI; x¯ and y¯ represent the mean values of x and y, respectively; n is the number of assessment pairs.
Based on the reflectance data and land classification data, the NARXNN models were used to retrieve 46 periods of the LAI within 1 year and replace backup algorithm pixels. Given the re-projection transformation will change the number and numerical value of pixels, the image projection remains the initial sinusoidal projection. Only after the LAI was retrieved and ready to be validated by the in situ LAI did the inversion results transform to UTM projection. The NARX-enhanced LAI is shown in Figure 4, and the coverage of each area in Figure 4 is about 1,369 km2. The color bar beside each retrieved LAI scene indicates the corresponding LAI values for the different colors. The shallow yellow-colored areas stand for low vegetation or unvegetated areas. In the time series, the value of LAI changes with time, and the LAI reaches the climax in summer and became lower in the winter and early spring. The LAI value changes from 0 to 7. The LAI spatial distribution of the three research areas, namely, Wuzhi, Xinzheng, and Xiangcheng in Henan Province, showed similar increase and decrease trends. The Wuzhi site shows that at the beginning of 2018, the LAI of some vegetated areas was 0; these areas are represented in shallow yellow. However, as the day of the year (DOY) increased (from 26 February 2018 to 25 May 2018), the vegetation grew and became denser. After the winter wheat was harvested, the LAI standard dropped dramatically. Then, the summer maize was seeded and started to grow during the summer season, and until the 249 DOY, the LAI of the rest of 2018 was kept low. The same phenomenon could also be observed in the Xinzheng and Xiangcheng research areas.
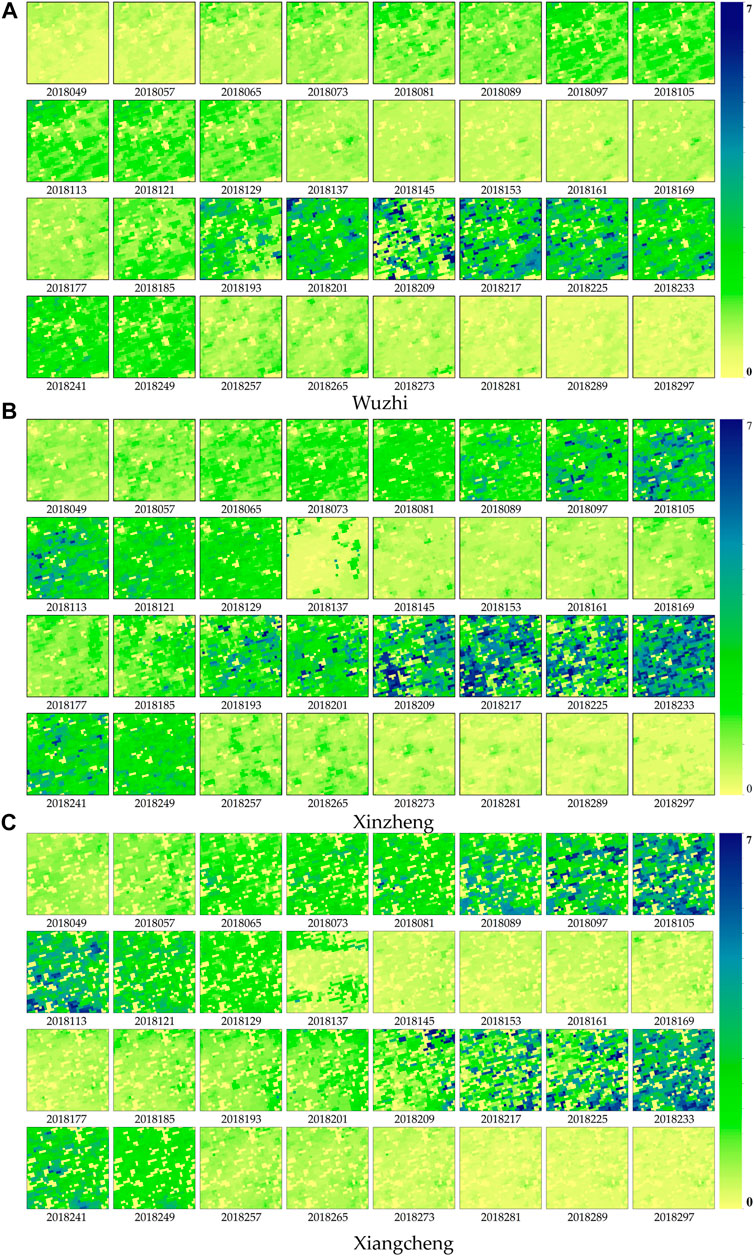
FIGURE 4. NARXNN improved the time series LAI in (A) Wuzhi, (B) Xinzheng, and (C) Xiangcheng in 2018. The color bar beside each sub-image indicates the corresponding LAI values for different colors. All three LAI maps are marked with the corresponding day of the year (DOY) from 49 to 297.
The accuracy validation is a vital process of quantum remote sensing. This article used multiple groups of the in situ LAI to compare the NARXNN model-improved LAI and the original LAI product. Figure 5 shows the comparison result between ground measurement and the LAI acquired by the NARXNN model or the LAI product. In the figure, the improved LAI showed a better agreement with the in situ measured LAI. The R2 values of the improved LAI of the three research areas are 0.54, 0.41, and 0.51, while the RMSE decreased by 0.07, 0.1, and 0.03, and the bias also decreased to a certain extent. In the three scatter plots, the data points cover the range between [0, 4], and most of the points are distributed around the 1:1 line with a part of the points deviating from the 1:1 line.
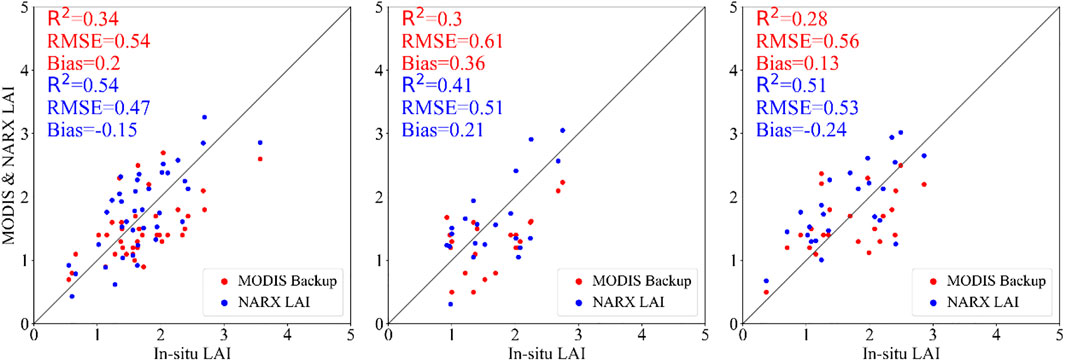
FIGURE 5. Comparison of the relationship between the in situ cropland LAI and NARXNN-improved LAI and the original MODIS backup algorithm-retrieved LAI (the red point represents a pair of in situ LAI and MODIS backup algorithm LAI, while the blue point represents a pair of in situ LAI and NARX LAI).
Under the influence of ground heterogeneity, crop variations, irrigation, and fertilization, farmland is one of the most complex ecosystems on the Earth’s surface. At the same time, the wheat–maize double cropping a year field is easy to be influenced by cloud contamination and human activity. However, precision agriculture and yield estimation imposed additional requests on the accuracy of the moderate-resolution LAI products. In Figure 6, temporal trends of the original main algorithm MODIS LAI, backup algorithm MODIS LAI, and MODIS LAI improved using the NARXNN model were compared. We can find that the LAI of two seasons a year cropland showed a bimodal change trend. Results indicate that the NARXNN model smoothed the abnormalities in MODIS LAI and enhanced the continuity of the trends over time. Compared with the original MODIS LAI, the MODIS LAI improved by the NARXNN model was more closely correlated with the in situ measured LAI. At the same time, the NARX-enhanced LAI was smoother in all four seasons and more conformed to specific vegetation growth and seasonal change withered feature. Numerically, the in situ LAI has a better consistency with the NARX LAI while being more different from original MODIS products. This implies that, after the NARXNN model was applied, the quality and reliability of the original MODIS LAI product were improved. The possible cause for this improvement is that the NARXNN model adopted historical status information and overcame the adverse effects of the backup algorithm.
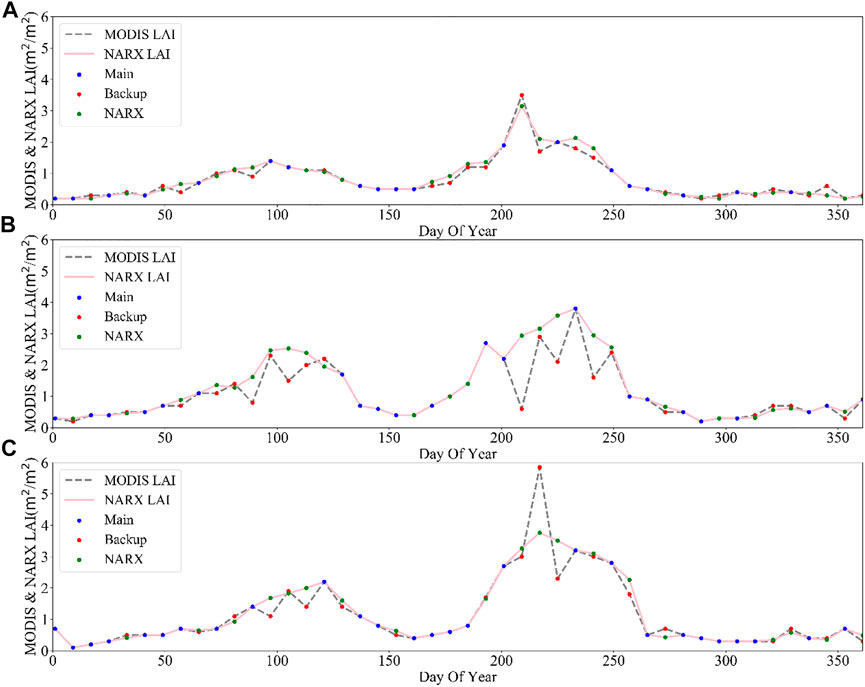
FIGURE 6. Comparison of the MODIS LAI product with NARX neural network-improved LAI data within the three study areas: (A) Wuzhi, (B) Xinzheng, and (C) Xiangcheng.
By now, the MODIS global LAI product has evolved into the latest C6 version (Yan et al., 2016) and is widely used in various research fields. Nevertheless, the MODIS LAI product is subject to errors or uncertainties because of 1) uncertainties in the input data, such as errors in remote sensing reflectance caused by atmospheric effects and cloud contamination, 2) model uncertainties and inevitably affected by the “ill-posed inversion problem” (Verstraete et al., 1996), and 3) errors in the ancillary information (e.g., land use misclassification) (Fang et al., 2013). During the manufacturing process, the MODIS LAI product (C6) consists of two retrieval algorithms: the three-dimensional radiative transfer model and the backup NDVI-LAI empirical relationship algorithm. Figure 7 shows the statistics of the pixel quality distribution of MCD15A2H products. We can find that the proportion of pixels retrieved by the backup algorithm is between 25% and 40%. For the aforementioned LAI pixels, the results of the 3D radiative transfer model stand for excellent accuracy and are proven to be reliable. There are plenty of failed inversion pixels through the radiative transfer model, and the backup algorithm was not as reliable as the physical model (Wang et al., 2005). Moreover, the fluctuating phenomenon in time series was frequently detected in the MODIS LAI product and thus cannot reasonably describe the vegetation growth status (Verrelst et al., 2015). In this context, improving MODIS backup pixels will contribute valuable higher-accuracy LAI data for a variety of applications including crop growth monitoring, crop yield estimation, and ecological environment assessment.
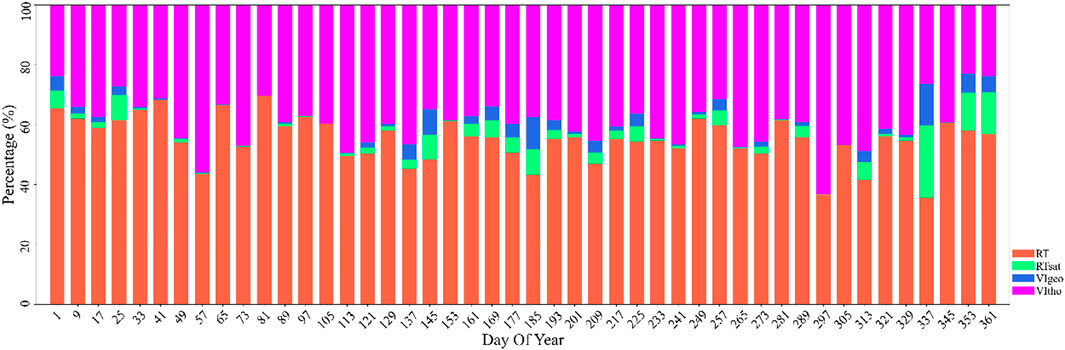
FIGURE 7. Temporal variation of MODIS LAI quality control flags (QC) over h27v05. DOY: day of the year; RT: main radiative transfer (RT) method used; RTsat: main radiative transfer method with saturation; VIgeo and VIoth: empirical vegetation index (VI) algorithm used due to bad geometry and other problems, respectively.
Traditional LAI inversion methods, such as the support vector machine (SVM) (Wang et al., 2018), random forest (RF) (Srinet et al., 2019), and static neural network represented by a back-propagation neural network (BPNN) (Wang et al., 2017), neglected the historical status information between previous output and latter output and cannot immensely draw on the dynamic system. In other words, traditional LAI inversion methods must contain the nonlinear relationships between the LAI and reflectance and the LAI variations in time dimensions, so the model performance was greatly restricted. Physically, the growth of ground vegetation is periodic, which means the previous growth status determines the following. Also, this phenomenon opened up a new direction in improving MODIS LAI products. Therefore, the recurrent neural network model involves additional information, regardless of the relationship between the LAI and remote sensing measured data and historical LAI change patterns.
The NARXNN model is a typical dynamic recurrent neural network (Cadenas et al., 2016) and has been extensively employed in nonlinear system modeling. The NARXNN model accepts exogenous input data in the retrieval procedure. Meanwhile, the model output will be appended to the input parameters to aid the inversion work (Boussaada et al., 2018). Some theories also proved that as long as the right activation function was selected and the number of neurons is enough, the NARX model can be used to draw on any dynamic system (Funahashi and Nakamura, 1993). Thus, the NARXNN model is more feasible for the inversion of ground LAI products. The overall accuracy of the NARXNN-enhanced LAI is −55% compared to the original, that is, −30%. The NDVI-LAI relationship model was intrinsically easy to be affected by environmental conditions. Also, this part of pixels is the focus of this improvement. In contrast, using Chen’s implementation of the Savitzky–Golay filter method will smooth the LAI curves indiscriminately (Chen et al., 2004) and lead to the loss of pixel’s theoretical basis. Afterward, any improvement in the accuracy of the leaf area index and vegetation coverage will significantly improve the development of the earth systems modeling.
In this research, the NARXNN model was used to improve the MODIS LAI product, and the accuracy of the replaced backup algorithm pixels was satisfactory. The capability of the NARXNN model was tested in product improvement. The NARXNN model can be extended to improve other global products, such as EPS and PROBA-V, and get a higher overall accuracy. In addition, the model can be used for time series modeling or reconstruction work and better serve global change research programs.
Based on the structure of the NARX neural network, two main points deserve to be considered in future research. First, land surface reflectance is the basis of LAI retrieval, which greatly affects the accuracy of the LAI product and regional retrieval result. The NARX neural network is no exception. If the reflectance data with higher atmospheric correction accuracy were provided, the improvement effect will be further enhanced. Second, only the MODIS LAI product was engaged in model training as the true value. If multiple LAI products were integrated together, a greater improvement effect could have also been achieved.
Constrained by the calculation ability and time cost, this experiment sets the time delay as one step ahead. Nevertheless, multiple time delays consider more historical LAI information and may increase the model accuracy. As of now, there are no standard criteria to determine the number of hidden layers and neurons, and the configuration of a neural network is a possible influence factor in practical applications. Even though the NARXNN model has more generalization ability than the NDVI-LAI relationship model and is more suitable to time series vegetation modeling, but it is more complex and still needs quantitative, high-quality training data. Moreover, the relevant parameters need to be adjusted and tested to ensure the model’s accuracy, which limited its usage and promotion.
The cropland vegetation pixels are chosen according to the IGBP dataset in the MODIS land use product because the 500-m resolution is not perfect in land cover classification, which means pixels may be contaminated by roads or construction land and ultimately influence the training performance of the NARXNN model. If the pure pixel filter method was added to control the percentage of 30-m resolution cropland pixels within one MODIS pixel (Zhou et al., 2018), the estimation precision of the NARXNN will rise by a degree.
Even though this work gets a decent performance in improving the MODIS LAI product, the experiment and validation work were carried out in the Wuzhi, Xinzheng, and Xiangcheng areas; the in situ measured cropland type includes only wheat and maize. But the cropland ecosystem area is broad in coverage, and the cropland types are also plentiful. So, validation works still need to be carried out in future research.
More accurate LAI products with higher temporal and spatial resolutions are greatly needed to support more advanced climatological and ecological research efforts. The existing MODIS LAI dataset designed for global coverage can rarely satisfy these requirements. Further improvements based on the current product may be one solution for this issue. Nevertheless, utilization of single-phase measurement data, without incorporating historical vegetation growth information, can hardly realize this goal. However, the improvement of the backup algorithm-retrieved LAI data has not been well established. This article proposed a product improvement scheme to enhance the accuracy of the MCD15A2H product with the help of MOD09A1 reflectance data and MCD12Q1 classification data.
Comparison with the in situ LAI validation data demonstrated the NARXNN LAI improves over the original MODIS backup algorithm LAI data, resulting in a smaller bias and RMSE and higher R2. After enhancement, the data points in the time series get smoothed. The improvement process removes the low-quality LAI data from the original data. It is to be noted that the accuracy of the improvement performance relies on the quality of the original high-quality LAI and the land classification data. The product improvement scheme based on the NARX neural network has a solid theoretical basis. It generates statistically optimal results by incorporating both the radiative transfer model and recurrent neural network. However, the computational cost of applying NARXNN is still an obstacle for handling large-scale datasets.
The datasets presented in this article are not readily available because the data are measured with cooperative partners. Requests to access the datasets should be directed to gislishangzhi@gmail.com.
Conceptualization, methodology, software, validation, and data curation, SL. Review and editing, funding acquisition, supervision, MZ. All authors have read and agreed to the published version of the manuscript.
This work was supported in part by the National Natural Science Foundation of China under Grant 41871315 and in part by the Key Research and Development Program of Shaanxi Province (China) under Grant 2020SF-434.
The authors appreciate reviewers for their insightful comments and constructive suggestions on our research work. The authors also want to thank the editors for their patient and meticulous work on our manuscript.
The author declares that the research was conducted in the absence of any commercial or financial relationships that could be construed as a potential conflict of interest.
All claims expressed in this article are solely those of the authors and do not necessarily represent those of their affiliated organizations, or those of the publisher, the editors, and the reviewers. Any product that may be evaluated in this article, or claim that may be made by its manufacturer, is not guaranteed or endorsed by the publisher.
Baret, F., Hagolle, O., Geiger, B., Bicheron, P., Miras, B., Huc, M., et al. (2007). LAI, fAPAR and fCover CYCLOPES global products derived from VEGETATION Part 1: Principles of the algorithm. Remote Sens. Environ. 110, 275–286. doi:10.1016/j.rse.2007.02.018
Boussaada, Z., Curea, O., Remaci, A., Camblong, H., and Mrabet Bellaaj, N. (2018). A nonlinear autoregressive exogenous (NARX) neural network model for the prediction of the daily direct solar radiation. Energies 11, 620. doi:10.3390/en11030620
Cadenas, E., Rivera, W., Campos-Amezcua, R., and Heard, C. (2016). Wind speed prediction using a univariate ARIMA model and a multivariate NARX model. Energies 9, 109. doi:10.3390/en9020109
Chen, J., Jönsson, P., Tamura, M., Gu, Z., Matsushita, B., and Eklundh, L. (2004). A simple method for reconstructing a high-quality NDVI time-series data set based on the Savitzky–Golay filter. Remote Sens. Environ. 91, 332–344. doi:10.1016/j.rse.2004.03.014
Chen, J. M., and Black, T. A. (1992). Defining leaf area index for non-flat leaves. Plant Cell. Environ. 15, 421–429. doi:10.1111/j.1365-3040.1992.tb00992.x
Cleveland, W. S., and Devlin, S. J. (1988). Locally weighted regression: An approach to regression analysis by local fitting. J. Am. Stat. Assoc. 83, 596–610. doi:10.1080/01621459.1988.10478639
Fang, H., Baret, F., Plummer, S., and Schaepman-Strub, G. (2019). An overview of global leaf area index (LAI): Methods, products, validation, and applications. Rev. Geophys. 57, 739–799. doi:10.1029/2018RG000608
Fang, H., Li, W., and Myneni, R. B. (2013). The impact of potential land cover misclassification on MODIS leaf area index (LAI) estimation: A statistical perspective. Remote Sens. 5, 830–844. doi:10.3390/rs5020830
Fang, H., Li, W., Wei, S., and Jiang, C. (2014). Seasonal variation of leaf area index (LAI) over paddy rice fields in NE China: Intercomparison of destructive sampling, LAI-2200, digital hemispherical photography (DHP), and AccuPAR methods. Agric. For. Meteorology 198-199, 126–141. doi:10.1016/j.agrformet.2014.08.005
Feret, J. B., François, C., Asner, G. P., Gitelson, A. A., Martin, R. E., Bidel, L. P. R., et al. (2008). PROSPECT-4 and 5: Advances in the leaf optical properties model separating photosynthetic pigments. Remote Sens. Environ. 112, 3030–3043. doi:10.1016/j.rse.2008.02.012
Friedl, M. A., McIver, D. K., Hodges, J., Zhang, X., Muchoney, D., Strahler, A. H., et al. (2002). Global land cover mapping from MODIS: Algorithms and early results. Remote Sens. Environ. 83, 287–302. doi:10.1016/S0034-4257(02)00078-0
Friedl, M. A., Sulla-Menashe, D., Tan, B., Schneider, A., Ramankutty, N., Sibley, A., et al. (2010). MODIS Collection 5 global land cover: Algorithm refinements and characterization of new datasets. Remote Sens. Environ. 114, 168–182. doi:10.1016/j.rse.2009.08.016
Funahashi, K. I., and Nakamura, Y. (1993). Approximation of dynamical systems by continuous time recurrent neural networks. Neural Netw. 6, 801–806. doi:10.1016/S0893-6080(05)80125-X
Fuster, B., Sánchez-Zapero, J., Camacho, F., García-Santos, V., Verger, A., Lacaze, R., et al. (2020). Quality assessment of PROBA-V LAI, fAPAR and fCOVER collection 300 m products of copernicus global land service. Remote Sens. 12, 1017. doi:10.3390/rs12061017
Heinsch, F. A., Maosheng, Z., Running, S. W., Kimball, J. S., Nemani, R. R., Davis, K. J., et al. (2006). Evaluation of remote sensing based terrestrial productivity from MODIS using regional tower eddy flux network observations. IEEE Trans. Geosci. Remote Sens. 44, 1908–1925. doi:10.1109/TGRS.2005.853936
Jonckheere, I., Fleck, S., Nackaerts, K., Muys, B., Coppin, P., Weiss, M., et al. (2004). Review of methods for in situ leaf area index determination: Part I. Theories, sensors and hemispherical photography. Agric. For. Meteorology 121, 19–35. doi:10.1016/j.agrformet.2003.08.027
Li, S., Qin, Z., Zhao, S., Gao, M., Li, S., Liao, Q., et al. (2022). Spatiotemporal variation of land surface temperature in henan province of China from 2003 to 2021. Land 11, 1104. doi:10.3390/land11071104
Luo, S., Wang, C., Gui-Bin, Z., Xiao-Huan, X., and Gui-Cai, L. (2013). Forest leaf area index (LAI) inversion using airborne LiDAR data. Chin. J. Geophysics- Chin. Ed. 56, 1467–1475. doi:10.6038/cjg20130505
Qi, Y., Li, H., Pang, Z., Gao, W., and Liu, C. (2022). A case study of the relationship between vegetation coverage and urban heat island in a coastal city by applying digital twins. Front. Plant Sci. 13, 861768. doi:10.3389/fpls.2022.861768
Shi, B., Zhu, X., Hu, Y., and Yang, Y. (2016). Drought characteristics of henan province in 1961-2013 based on standardized precipitation evapotranspiration index. J. Geogr. Sci. 27, 311–325. doi:10.1007/s11442-017-1378-4
Sprintsin, M., Karnieli, A., Berliner, P., Rotenberg, E., Yakir, D., and Cohen, S. (2009). Evaluating the performance of the MODIS Leaf Area Index (LAI) product over a Mediterranean dryland planted forest. Int. J. Remote Sens. 30, 5061–5069. doi:10.1080/01431160903032885
Srinet, R., Nandy, S., and Patel, N. R. (2019). Estimating leaf area index and light extinction coefficient using Random Forest regression algorithm in a tropical moist deciduous forest, India. Ecol. Inf. 52, 94–102. doi:10.1016/j.ecoinf.2019.05.008
Verrelst, J., Camps-Valls, G., Muñoz-Marí, J., Rivera, J. P., Veroustraete, F., Clevers, J. G. P. W., et al. (2015). Optical remote sensing and the retrieval of terrestrial vegetation bio-geophysical properties – a review. ISPRS J. Photogrammetry Remote Sens. 108, 273–290. doi:10.1016/j.isprsjprs.2015.05.005
Verstraete, M. M., Pinty, B., and Myneni, R. B. (1996). Potential and limitations of information extraction on the terrestrial biosphere from satellite remote sensing. Remote Sens. Environ. 58, 201–214. doi:10.1016/S0034-4257(96)00069-7
Viovy, N., Arino, O., and Belward, A. (1992). The best index Slope extraction (BISE): A method for reducing noise in NDVI time-series. Int. J. Remote Sens. 13, 1585–1590. doi:10.1080/01431169208904212
Wang, D., and Liang, S. (2014). Improving LAI mapping by integrating MODIS and CYCLOPES LAI products using optimal interpolation. IEEE J. Sel. Top. Appl. Earth Obs. Remote Sens. 7, 445–457. doi:10.1109/jstars.2013.2264870
Wang, H., Sánchez-Molina, J. A., Li, M., Berenguel, M., Yang, X. T., and Bienvenido, J. F. (2017). Leaf area index estimation for a greenhouse transpiration model using external climate conditions based on genetics algorithms, back-propagation neural networks and nonlinear autoregressive exogenous models. Agric. Water Manag. 183, 107–115. doi:10.1016/j.agwat.2016.11.021
Wang, L., Chang, Q., Yang, J., Zhang, X., and Li, F. (2018). Estimation of paddy rice leaf area index using machine learning methods based on hyperspectral data from multi-year experiments. PLoS One 13, e0207624. doi:10.1371/journal.pone.0207624
Wang, Q., Tenhunen, J., Dinh, N. Q., Reichstein, M., Otieno, D., Granier, A., et al. (2005). Evaluation of seasonal variation of MODIS derived leaf area index at two European deciduous broadleaf forest sites. Remote Sens. Environ. 96, 475–484. doi:10.1016/j.rse.2005.04.003
Xiao, Z., Liang, S., Wang, T., and Liu, Q. (2015). Reconstruction of satellite-retrieved land-surface reflectance based on temporally-continuous vegetation indices. Remote Sens. 7, 9844–9864. doi:10.3390/rs70809844
Xu, X., Du, H., Zhou, G., and Li, P. (2017). Method for improvement of MODIS leaf area index products based on pixel-to-pixel correlations. Eur. J. Remote Sens. 49, 57–72. doi:10.5721/EuJRS20164904
Xue, J., and Su, B. (2017). Significant remote sensing vegetation indices: A review of developments and applications. J. Sensors 2017, 1–17. doi:10.1155/2017/1353691
Yan, K., Park, T., Yan, G., Chen, C., Yang, B., Liu, Z., et al. (2016). Evaluation of MODIS LAI/FPAR product collection 6. Part 1: Consistency and improvements. Remote Sens. 8, 359. doi:10.3390/rs8050359
Yang, W., Huang, D., Tan, B., Stroeve, J. C., Shabanov, N., Knyazikhin, Y., et al. (2006). Analysis of leaf area index and fraction of PAR absorbed by vegetation products from the Terra MODIS sensor: 2000–2005. IEEE Trans. Geosci. Remote Sens. 44, 1829–1842. doi:10.1109/TGRS.2006.871214
Keywords: leaf area index, MODIS, NARX, remote sensing, time series
Citation: Li S and Zhang M (2023) Improving the MODIS leaf area index product for a cropland with the nonlinear autoregressive neural network with eXogenous input model. Front. Earth Sci. 10:962498. doi: 10.3389/feart.2022.962498
Received: 06 June 2022; Accepted: 23 September 2022;
Published: 09 January 2023.
Edited by:
Ataollah Shirzadi, University of Kurdistan, IranReviewed by:
Yujie Wang, University of Maryland, United StatesCopyright © 2023 Li and Zhang. This is an open-access article distributed under the terms of the Creative Commons Attribution License (CC BY). The use, distribution or reproduction in other forums is permitted, provided the original author(s) and the copyright owner(s) are credited and that the original publication in this journal is cited, in accordance with accepted academic practice. No use, distribution or reproduction is permitted which does not comply with these terms.
*Correspondence: Meng Zhang, emhhbmdtZW5nMDFAbWFpbC54anR1LmVkdS5jbg==
Disclaimer: All claims expressed in this article are solely those of the authors and do not necessarily represent those of their affiliated organizations, or those of the publisher, the editors and the reviewers. Any product that may be evaluated in this article or claim that may be made by its manufacturer is not guaranteed or endorsed by the publisher.
Research integrity at Frontiers
Learn more about the work of our research integrity team to safeguard the quality of each article we publish.