- 1Department of Aviation Meteorology, Civil Aviation University of China, Tianjin, China
- 2College of Earth and Planetary Sciences, University of Chinese Academy of Sciences, Beijing, China
- 3State Key Laboratory of Numerical Modeling for Atmosphere Sciences and Geophysical Fluid Dynamics, Institute of Atmospheric Physics, Chinese Academy of Sciences, Beijing, China
The interdecadal change of the summer (July–August) rainfall over North China (SRNC) is of great concern to the climate research community. Based on the sliding correlation and interdecadal difference analysis, the interdecadal change of SRNC was studied. Results show a significantly wetter period of SRNC since the mid-2000s, which was associated with strengthening negative relationship between SRNC and PDO. PDO affected the SRNC through the jet stream in the upper-level and the East Asia–Pacific (EAP) teleconnection pattern. In the negative phase of the PDO since the mid-2000s, the contractive upper-level jet stream in the west of North China resulted in the abnormal updraft over the southern region of North China. Meanwhile, the positive phase of the EAP teleconnection pattern brought warm and wet southeast flow entering North China from its eastern boundary, both bringing more rainfall in North China. The abnormal water vapor transport from the western Pacific was very different from that accompanying the East Asian summer monsoon.
Introduction
North China lies south of Yanshan mountains, east of Hetao Plain, north of Qinling Mountains and Huaihe River, and east of the Bohai Sea and Yellow Sea (Figure 1), where the capital of Beijing is located. The summer precipitation (July–August) accounts for 80% of the annual precipitation in North China (Tao, 1980). The shortage of summer precipitation in North China has seriously hindered the further development of industrial and agricultural production and the daily life of urban and rural residents there (Huang et al., 1999). North China experienced frequent and severe droughts in the past, which resulted in significant economic and environmental impacts and worsened the local hydrographic environment (Ma and Fu, 2006; Pei et al., 2015).
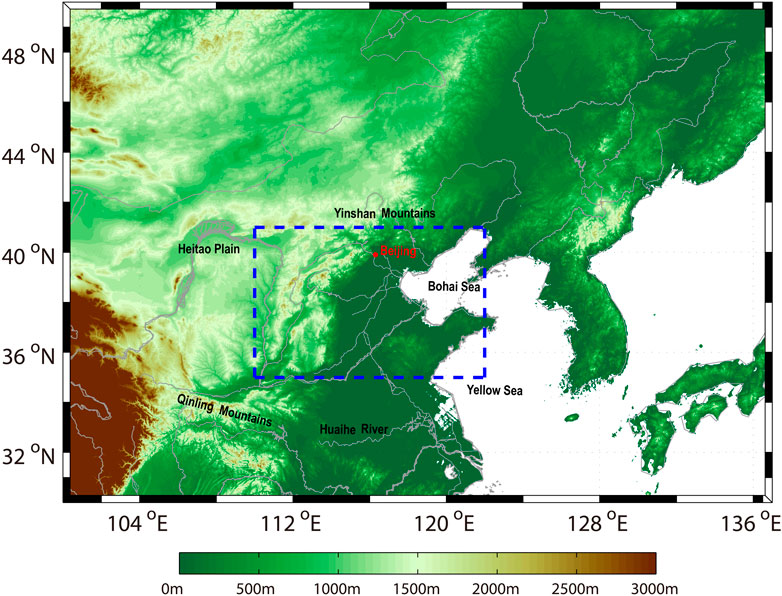
FIGURE 1. The topography around North China; the altitude (unit: m) is shaded. The box (35°N–41°N, 110°N–122°E) shows the region of North China.
Numerous studies have investigated the causes of the decreasing summer (July–August) precipitation over North China (SRNC) since the mid-1960s and after the mid-1970s (Yan et al., 1990; Yatagai and Yasunari, 1994; Huang et al., 1999; Lu, 1999; Dai et al., 2003; Liu and Ding, 2010; Zhu et al., 2011). The main possible causes include the large-scale temperature changes due to the weakening thermal difference between land and ocean (Yan et al., 1990; Yan et al., 1991), the winter Arctic sea-ice variations (Wu et al., 1999), the teleconnection pattern including the North Pacific Oscillation (NPO) variation and the North Atlantic Oscillation (NAO) (Li and Li, 1999), the Pacific Decadal Oscillation (PDO or NPDO) and the South Pacific Decadal Oscillation (SPDO) pattern (Zhang et al., 1997; Chang et al., 2000; Yang and Lau, 2004; Li et al., 2020), the sea surface temperature (SST) of the central and eastern Pacific in the equatorial region (Huang et al., 1999), the interaction of the air-sea in the middle latitudes (Li and Liao, 1996), the circumglobal teleconnection (CGT) (Ding and Wang, 2005), the interdecadal weakening of East Asia Summer Monsoon (EASM) (Wang, 2001), the interdecadal changes of the western Pacific subtropical high (WPSH) over the eastern China regions (Nitta and Hu, 1996), the interdecadal cooling in the upper troposphere and lower stratosphere over East Asia (Yu and Zhou, 2007), and the thermal effect of aerosols over Asia such as the black carbon (Menon et al., 2002).
The natural variability at interdecadal timescales in the Pacific Ocean is termed the Pacific decadal variability, which is referred to as the Interdecadal Pacific Oscillation (IPO; Power et al., 1998, Power et al., 1999; Allan, 2000) for the basin-wide pattern or PDO (Mantua et al., 1997) for the North Pacific pattern (Joshi et al., 2022). Both IPO/PDO is defined as a long-lived El Niño-like pattern of Pacific climate variability that not only modulates the rainfall over India (Joshi and Pandey, 2011; Joshi and Rai, 2015; Joshi and Kucharski, 2017; Joshi et al., 2021), Sahel (Mohino et al., 2011; Villamayor and Mohino, 2015), and United States (Dai, 2013) but also over North China. There were two positive phases of PDO (1922–45 and 1977–2002) and one negative phase of PDO (1946–76) in the period of 1900–2010 (Qian and Zhou, 2014). Meanwhile, Ma (2007) found that the spring PDO index had a climate shift occurring in 1978/1979. In interdecadal timescale, PDO not only has a climate shift but also has a close relationship with SRNC. Qian and Zhou (2014) suggested that the dry conditions of North China in summer were influenced by the PJ/EAP meridional teleconnection pattern generated by one negative PDO phase (1946–76) using the Palmer Drought Severity Index data. Li et al. (2020) suggested that after removing the correlation between SPDO and NPDO, there was a significant positive (negative) correlation between SPDO (NPDO) and PRNC.
Numerous studies investigated the unstable relationships between the two time series and suggested that the relationship between El Nino-Southern Oscillation (ENSO) and the Indian summer monsoon had broken down in recent decades (Kumar et al., 1999; Kulkarni et al., 2021). Liu et al. (2004) found that the interannual correlation between the winter sea ice over the Davis Strait and July rainfall over North China had weakened after 1994.
Previous studies indicated that PRNC had experienced an interdecadal decrease since the mid-1970s (Huang et al., 1999). However, the year after which PRNC entered an interdecadal wetter period was still of great concern to the climate research community. Has a new interdecadal change of PDO occurred? How did the interdecadal change of the PDO influence the interdecadal change of the SRNC? With these questions in mind, we firstly investigated the interdecadal variations of the PDO and SRNC and then verified the stability of the relationship between PDO and SRNC from decades to decades. This study was organized as follows. The data and analysis methods were introduced in the Data and analysis methods section. The Results section shows the interdecadal change of the relationship between PDO and SRNC, and the possible mechanism of PDO influencing the SRNC. The final section is Conclusions and discussions.
Data and analysis methods
The Climate Prediction Center (CPC) Unified Gauge-Based Analysis of Global Daily Precipitation dataset with a horizontal resolution of 0.5° × 0.5° (Xie et al., 2007) and the precipitation data of 17 gauge-based stations from 1979 to 2021 in North China (Liu et al., 2020) were used to investigate the interdecadal change of the SRNC. The SRNC is the regional averaged summer (July–August) precipitation over North China in the box of [35°N–41°N, 110°N–122°E] (Liu et al., 2020). Two precipitation datasets were consistent in indicating the interdecadal change of SRNC. For brevity, we only showed the SRNC index from the CPC dataset.
The monthly NCEP-DOE AMIP-II Reanalysis (R-2) (Kanamitsu et al., 2002) dataset and ERA5 dataset were used to reveal the interdecadal variations of atmospheric circulation. Two reanalyzed datasets have subtle differences in characterizing the interdecadal variations of atmospheric circulation. For brevity, we only showed the NCEP-DOE AMIP-II results in the following. Besides, the SST data from the NOAA Extended Reconstructed Sea Surface Temperature (SST) V5 dataset (Huang et al., 2017) and the monthly Pacific Decadal Oscillation (PDO) index derived from https://www.ncdc.noaa.gov/teleconnections/pdo/ were also used.
The vertically integrated water vapor flux from the ground to 300 hPa was calculated to further measure the interdecadal difference of the water vapor transportation. The vertically integrated water vapor flux is computed using the following formula as discussed by Ding (1989):
where
We intend to discuss the interdecadal change of the summer precipitation over North China and its causes, which was about the difference between the adjacent 10 years. Therefore, we chose a 20-year running t-test to calculate the precipitation difference between the later and former 10-year periods. The 20-year running t-test has also been used earlier to verify the abrupt point of interdecadal change in the summer precipitation over North China (Liu et al., 2012). On the contrary, we used the 11-year sliding correlation to test the relationship variation between the summer rainfall over North China and PDO (Kumar et al., 1999; Liu H. W. et al., 2004).
Results
The characteristics of interdecadal change of the SRNC and PDO in the recent forty years
Figure 2A shows the time series of SRNC during 1979–2021. A 20-year moving t-test was performed to quantify the interdecadal change of SRNC, as shown in Figure 2B. The year 2006 is the first point with a significant precipitation difference between the later and earlier 10-year periods, reaching a 95% confidence level. It was apparent that SRNC had an interdecadal abrupt change point in 2006 during 1979–2021. Therefore, there were two interdecadal periods obviously. In the first period of 1979–2005, the SRNC showed an interdecadal negative anomaly with a mean value below the climate mean. Liu et al. (2020) discovered that SRNC had a weak, increasing trend since 1979 and then halted in the mid-1990s. However, this halted period did not last long (Hu, 1997–2005); then, SRNC entered a wetter period in 2006 (Figure 2A). It is worth noting that, since 2006, the SRNC was not only observed with an increasing trend but also showed an interdecadal positive anomaly with the mean value above the climate mean value. Moreover, the linear trend of SRNC during 2008–2021 was also significant, reaching the 95% confidence level. Thereby, the SRNC entered an interdecadal wetter period in the mid-2000s.

FIGURE 2. (A) Normalized time series of SRNC index during 1979–2021. The horizontal dash lines indicate the mean during two periods, the solid black line during 2006–2021 indicates the linear trend, and the vertical line indicates the interdecadal abrupt change year. (B) A 20-year running t-test of SRNC index, with two green lines showing a 95% confidence level.
In order to further investigate the interdecadal change of the SRNC, the difference in the SRNC between 2006–2021 and 1979–2005 is shown in Figure 3. A significant positive anomaly is clearly observed in North China with blue shading areas. During 2006–2021, North China entered an interdecadal wetter period, which was consistent with the interdecadal change of the SRNC index (Figure 2).
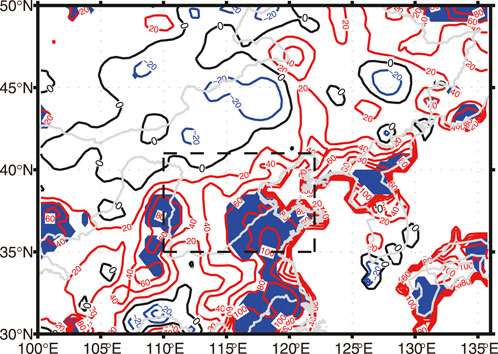
FIGURE 3. Climatological mean difference of summer precipitation during periods 2006–2021 and 1979–2005 using CPC dataset (unit: mm). The shading area indicates a difference reaching the 95% confidence level based on Student’s t-test. The black box shows the region of North China.
Previous studies indicated a negative relationship between the PDO index and the SRNC (Ma, 2007; Qian and Zhou, 2014; Li et al., 2020). Since the SRNC experienced an interdecadal abrupt change in 2006, has the PDO experienced a similar interdecadal change? In order to investigate the interdecadal variation of PDO, the normalized time series of PDO index in July–August during 1979–2021 and the result of the 20-year moving t-test are shown in Figure 4. The PDO index revealed the characteristics of interannual and interdecadal variation in Figure 4A. PDO was almost in the positive phase before 2004 and then turned to the negative phase. The SRNC and the PDO index had a significantly negative relationship with a correlation coefficient of −0.361, reaching a 99% confidence level, which is consistent with numerous previous studies (Ma, 2007; Qian and Zhou, 2014; Li et al., 2020). The 20-year running t-test was performed to find the abrupt change point of the PDO index (Figure 4B). We found that the PDO index had a significant abrupt change during 2002–2004.
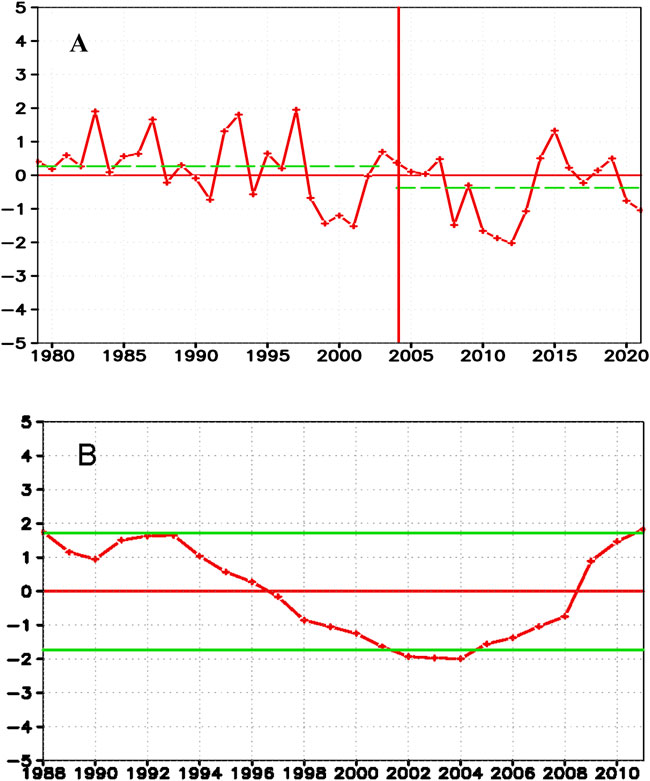
FIGURE 4. The same as Figure 2, but for normalized time series of PDO index in July–August during 1979–2021. The horizontal dash lines in (A) indicate the mean during two periods, and the vertical line indicates the interdecadal abrupt change year. Two green lines showing a 95% confidence level in the 20-year running t-test in (B).
The difference in Pacific SST between the periods 2004–2021 and 1979–2003 is also shown in Figure 5. There were warm anomalies in North Pacific and the Warm Pool region, whereas cold anomalies existed in the eastern equatorial Pacific, which is similar to the previous results (Qian and Zhou, 2014). Thus, PDO changed from the negative phase to the positive phase in 2004, and the phase transition year of 2004 is roughly consistent with the interdecadal abrupt year of the SRNC. This reminds us that the interdecadal change of the SRNC is related to the phase transition of the PDO.
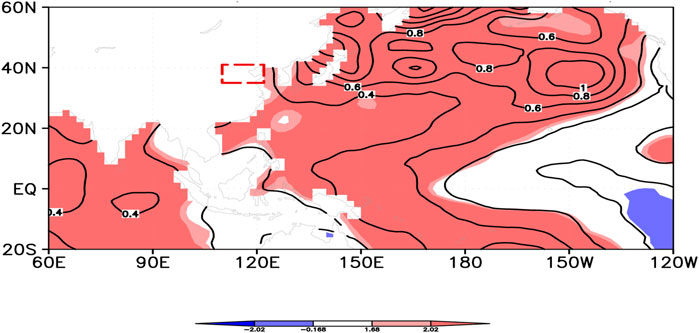
FIGURE 5. The same as Figure 3, but for the difference of SST during the periods 2004–2021 and 1979–2003 in the Pacific (unit: °C). Shaded areas show differences reaching 90% and 95% confidence levels according to Student’s t-test. The box shows the region of North China.
The interdecadal change in the interannual relationship between SRNC and PDO
As mentioned above, the PDO and SRNC both had similar interdecadal variations with close abrupt change or transition years. To further explore whether the interannual relationship between SRNC and the PDO index is stable, Figure 6 shows the sliding correlations between SRNC and the PDO index with an 11-year moving window. The negative correlations between SRNC and the PDO index had obvious interdecadal change. Based on the analysis result using data in the recent 40 years, the the correlations between SRNC and PDO have become stronger and more significant since 2007. Before 2007, the negative correlations between SRNC and the PDO index were almost weak. Accompanying the enhanced interannual relationship between SRNC and the PDO index, the SRNC became wetter since the mid-2000s (Figure 2). This suggests that the interdecadal variations of the SRNC were closely related to the interdecadal variations of the negative relationship between SRNC and the PDO index.
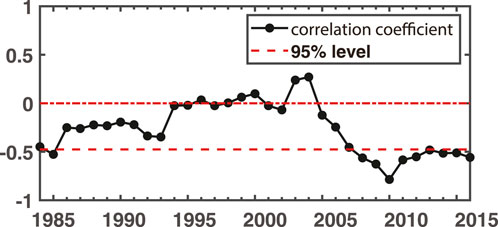
FIGURE 6. 11-year sliding correlations between SRNC and the PDO index during 1979–2021. The red line of −0.476 indicates a critical value of a one-tailed 95% confidence level with n = 11.
To further demonstrate the interdecadal change in the relationship between the PDO index and SRNC, the wind vector at 850 hPa is regressed onto the normalized PDO index during two periods in Figure 7. During 1979–2005 (Figure 7A), the PDO index was almost positive, and the regression of the wind vector shows anomalous northwest wind over North China, reaching a 95% confidence level. An anomalous cyclone was found in Northeast China. On the contrary, during 2006–2021 (Figure 7B), the PDO index was almost negative, and the regression of the wind vector shows anomalous northeast wind to the southeast of North China. Therefore, while the PDO index was negative, there was anomalous southwest wind to the southeast of North China accompanied by an anomalous anticyclone around southern Japan. Obviously, more water vapor entered North China during 2006–2011, especially from the Pacific.
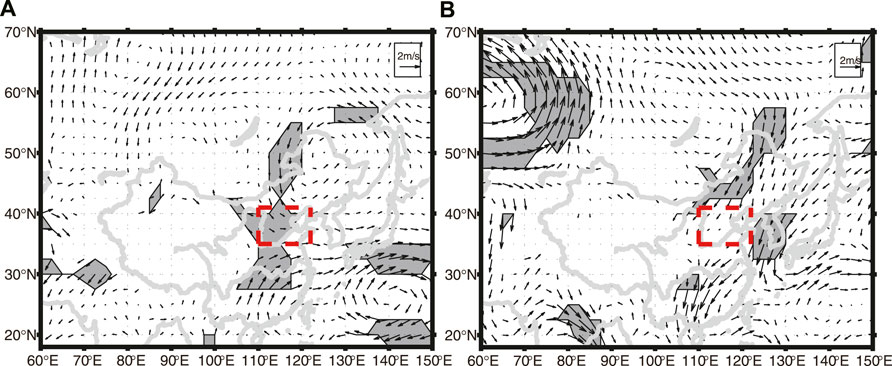
FIGURE 7. Regression results of wind vector at 850 hPa using the normalized PDO index during (A) 1979–2005 and (B) 2006–2021. Shaded areas indicate regression reaching 95% confidence levels according to Student’s t-test. The box shows the region of North China.
The possible causes of interdecadal wetter North China since 2006
The upper-level jet stream and its secondary circulation played an important role in the SRNC (Quan and Liuzhucheng, 2013). The correlation distributions between PDO index and zonal wind at 200 hPa were calculated during 1979–2005 and 2006–2021, respectively, to measure the interdecadal variations of the relationship between the upper-level jet stream and PDO during two periods, as shown in Figure 8. We firstly figured out how the PDO influenced the SRNC through the upper-level jet stream.
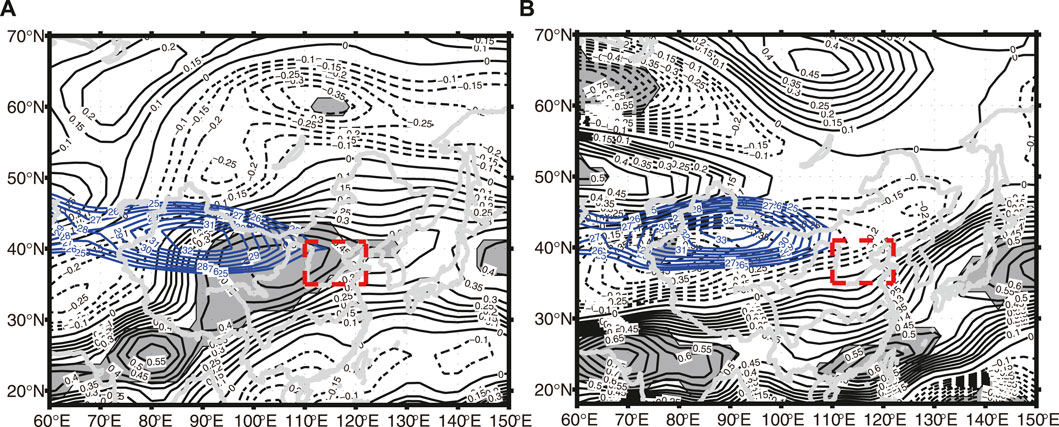
FIGURE 8. Correlation distributions between PDO and zonal wind at 200 hPa during (A) 1979–2005 and (B) 2006–2021. Shaded areas indicate correlation reaching 95% confidence levels according to Student’s t-test. The box shows the region of North China. The blue isolines indicate the zonal wind greater than 25 m/s.
There were significant positive correlation coefficients to the west of North China in Figure 8A. During 1979–2005, the PDO was almost in the positive phase, so the upper-level jet stream was a positive anomaly to the west of North China. Uccellini and Johnson (1979) indicated a downdraft in the right hand of the exited region of the jet stream. North China is just below the exit region of the upper-level jet stream. Therefore, during 1979–2005, with an outstretched jet stream to the west of North China, there should be an abnormal downdraft over North China. Figure 9A further demonstrates an abnormal downdraft over southern North China during the period of 1979–2005, although the vertical velocity anomaly had not passed 95% confidence levels. This feature went against more rainfall in North China.
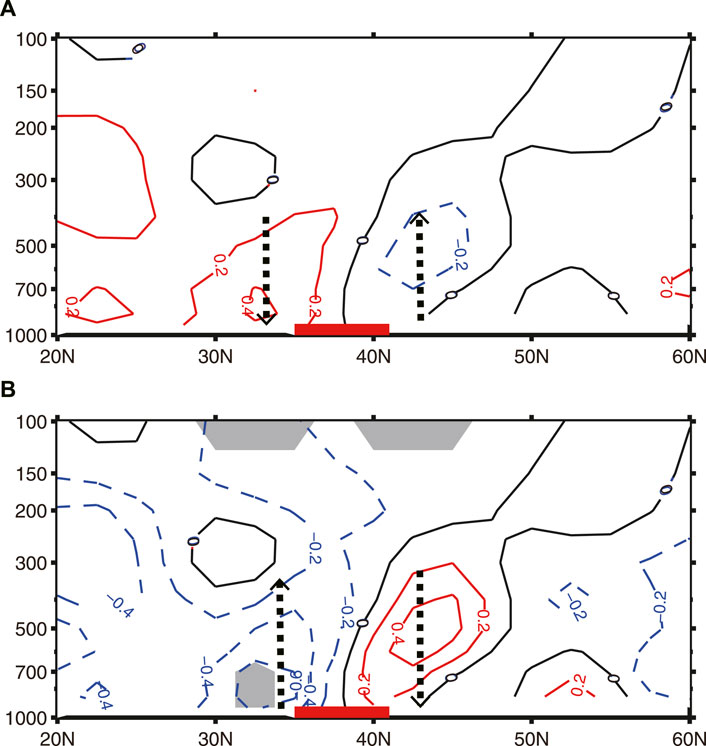
FIGURE 9. Latitude-height cross section of vertical velocity anomaly along 117.5°E in JA by (A) 1979–2005 mean minus 1979–2021 mean (unit: 10−2 Pa/s) and (B) 2006–2021 mean minus 1979–2021 mean. Shaded areas are statistically significant at the 95% confidence level according to Student’s t-test. The red line shows the latitude range of North China. The black arrow line shows the abnormal vertical movement.
On the contrary, during 2006–2021, there were weak negative correlation coefficients to the west of North China in Figure 8B. During 2006–2021, the PDO was almost in the negative phase, so the upper-level jet stream was a weak positive anomaly to the west of North China. However, we found that the upper-level jet stream was contractive to the west of North China during 2006–2021 with respect to that during 1979–2005. There should be an abnormal updraft over North China. Figure 9B further demonstrates an abnormal updraft over southern North China during the period of 2006–2021, whereas the vertical velocity anomaly had passed 95% confidence levels. This feature made more rainfall in North China.
Numerous studies indicated that PDO influenced the SRNC mainly through the East Asia–Pacific (EAP) teleconnection pattern (Nitta, 1987; Huang and Sun, 1992; Qian and Zhou, 2014). Figure 10 shows the difference in wind vector by 2006–2021 minus 1979–2005. An anomalous anticyclone was found to the east of the Philippines island. In contrast, an anomalous cyclone was observed near Taiwan island and an anomalous anticyclone to the east of Japan island. The “+-+” pattern was very similar to the positive phase of the EAP teleconnection pattern (Nitta, 1987; Huang and Sun, 1992). North China is dominated by an anomalous southeast flow from the Pacific and an anomalous northwest flow from Lake Baikal, resulting in the convergence over North China in the mid-lower troposphere. Thus, more precipitation has been observed in North China since the mid-2000s.
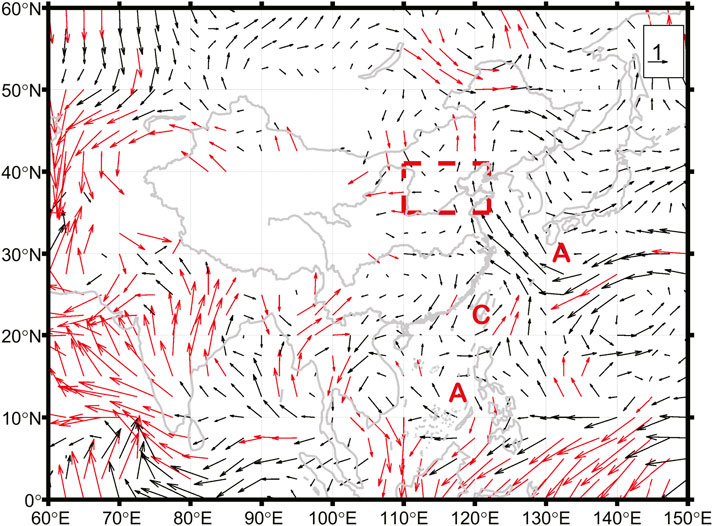
FIGURE 10. The same as Figure 3 but for 850 hPa wind vector (unit: m/s). Red arrows show the difference reaching 90% confidence levels according to Student’s t-test. The box shows the region of North China.
Although the difference in sea level pressure (SLP) by 2006–2021 minus 1979–2005 in Figure 11 does not show the typical positive phase of the EAP teleconnection pattern, it shows a distribution of low over the land and high over the Pacific along 40°N. This pattern benefited anomalous east wind, leading to more precipitation in north China (Liang et al., 2006).
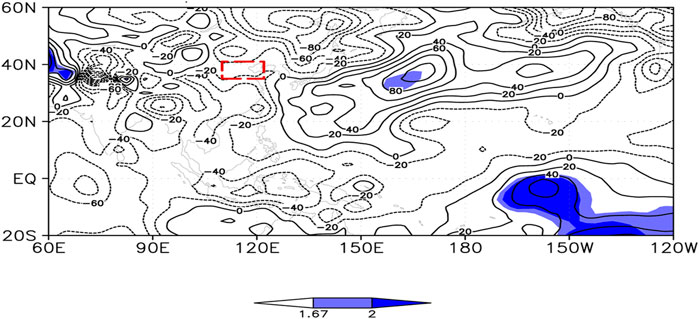
FIGURE 11. The same as Figure 3 but for sea level pressure (unit: hPa). Shaded areas show the difference reaching 90% and 95% confidence levels according to Student’s t-test. The box shows the region of North China.
The difference of wind vector at 1,000 hPa and SST in the Pacific by 2006–2021 minus 1979–2005 shows a positive phase of the EAP teleconnection pattern (Nitta, 1987; Huang and Sun, 1992) in Figure 12. The positive phase of the EAP would lead to more precipitation in North China, with the anomalous southeast wind bringing warm-moist air into North China. At the same time, the positive phase of the EAP strengthened the Kuroshio current in the east of the Japan island to keep the warmer SST in North Pacific. The warmer SST in North Pacific was beneficial to maintaining the negative phase of PDO. In general, PDO was conducive to the form of the EAP teleconnection pattern (Nitta, 1987; Huang and Sun, 1992), whereas the EAP teleconnection pattern contributed to maintaining the PDO in turn. Thus, a positive feedback mechanism was formed between the PDO and the EAP pattern. Furthermore, the negative phase of the PDO and the positive phase of the EAP pattern both led to abundant precipitation over North China (Wang and He, 2015).

FIGURE 12. The same as Figure 3 but for wind vector at 1,000 hPa (unit: m/s) and SST in the Pacific (unit: °C). The isolines show the difference in SST. Shaded areas and red arrows indicate a difference reaching 95% confidence levels according to Student’s t-test. The box shows the region of North China.
In addition, when the PDO was in a negative phase, the SST in the Indian Ocean and the Maritime Continent was anomalously warm, which was significantly different from previous studies (Ma, 2007; Qian and Zhou, 2014). Meanwhile, the warmer SST in the Indian Ocean, around the Maritime Continent, and in the mid-high latitude of the western Pacific resulted in weaker East Asian summer monsoon (EASM) with weaker land-sea thermal contrast.
Figure 13 shows the difference in the water vapor transportation by 2006–2021 minus 1979–2005, which also reflected the characteristics of the positive phase of the EAP with the “+-+” pattern. Anomalous anticyclone of water vapor flux was found near the Philippines island, and the anomalous cyclone of water vapor flux was observed over Taiwan island, while the anomalous anticyclone water vapor fluxed to the east of the Japan island. The anomalous water vapor entering North China between the anomalous cyclone over Taiwan island and the anomalous anticyclone to the east of Japan was significant, reaching a 95% confidence level. Another cyclone marked as “CV” also provided abundant water vapor and brought more precipitation to North China.
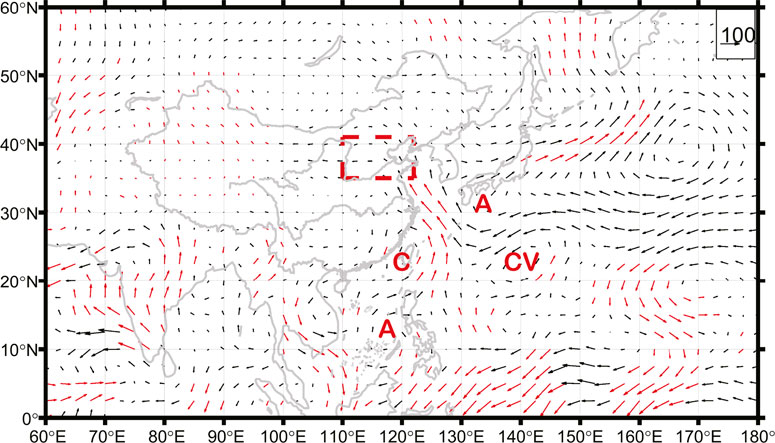
FIGURE 13. The same as Figure 10, but for the vertically integrated water vapor flux (unit: kg/m/s).
Conclusion and discussions
Previous studies (Yan et al., 1990; Yatagai and Yasunari, 1994; Huang et al., 1999; Lu, 1999; Dai et al., 2003; Liu and Ding, 2010; Zhu et al., 2011) proved that North China had undergone interdecadal drought since the mid-1960s and mid-1970s. However, we discovered the SRNC was interdecadal wetter since the mid-2000s. The enhanced negative relationship between SRNC and PDO has occurred since 2006. Accompanied by an enhanced negative relationship between SRNC and PDO, the negative phase of PDO since 2006 resulted in a significantly wetter anomaly of SRNC, which is different from previous results that the SRNC has become drier since the mid-1960s and mid-1970s. The possible major mechanisms are summarized in Figure 14.
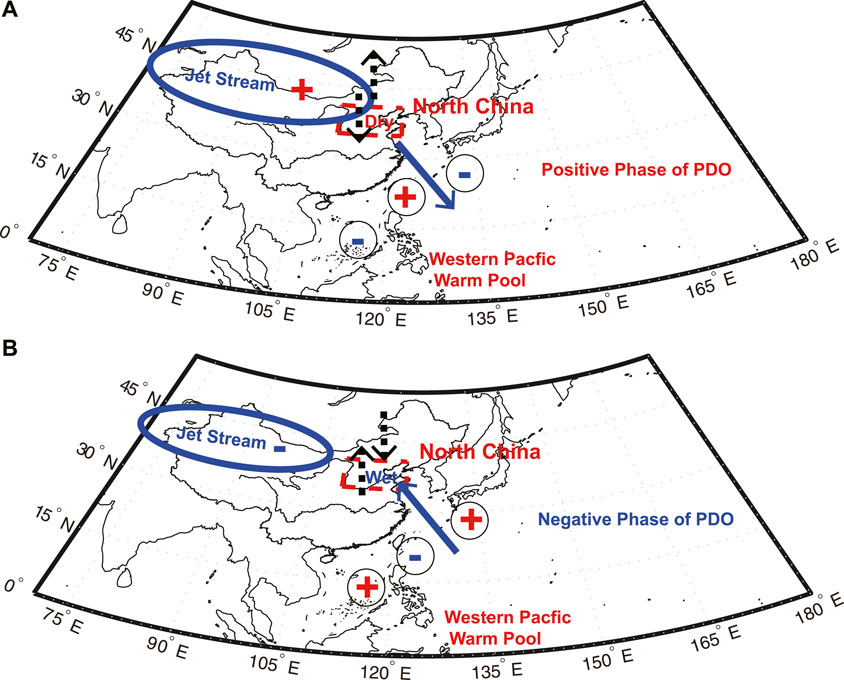
FIGURE 14. Schematic diagram of a mechanism for the abnormal summer rainfall over North China due to (A) positive phase of PDO during 1979–2005 and (B) negative phase of PDO during 2006–2021.
In Figure 14A, during 1979–2005, with PDO in the positive phase, the upper-level jet stream extended to North China, resulting in anomalous downdraft over southern North China and the anomalous northwest wind to the southeast of North China, both leading to less rainfall over North China. However, in Figure 14B, during the enhanced relationship period (2006–2021) between the PDO and SRNC with PDO in the negative phase, the upper-level jet stream was contractive to the west of North China, resulting in an anomalous updraft over southern North China, and the anomalous southwest wind was found to the southeast of North China, both leading to more rainfall over North China.
Except for the upper-level jet stream, the PDO influenced the SRNC mainly through the East Asia–Pacific (EAP) teleconnection pattern (Nitta, 1987; Huang & Sun, 1992; Qian & Zhou, 2014). During 2006–2021 in the positive phase of the EAP teleconnection pattern and negative phase of the PDO, the water vapor transport into North China was mainly from the eastern boundary. The water vapor transport was very different from that provided by the traditional southwest summer monsoon. However, this also suggested that the wetter anomaly of SRNC would not be stable because the recent water vapor budget would be easily changed by the summer monsoon variations in the future, which is worthy of constant attention and research.
Except for two known interdecadal decrease phenomena of SRNC since the mid-1960s and mid-1970s (Yan et al., 1990; Yatagai and Yasunari, 1994; Huang et al., 1999; Lu, 1999; Dai et al., 2003; Liu and Ding, 2010; Zhu et al., 2011), we firstly discover another interdecadal increase phenomenon of the SRNC in this study and the unstable relationship between SRNC and PDO. It is worth noting that the SST in the Indian Ocean and the Maritime Continent are a warm anomaly, which is very different from previous studies when PDO was in a negative phase (Ma, 2007; Qian and Zhou, 2014). In this study, we just used PDO to explain the wetter anomaly of SRNC. However, the other factors, such as the Arctic sea-ice (Wu et al., 1999; Liu H. et al., 2004) and CGT (Ding and Wang, 2005), also need to be further studied.
Data availability statement
The original contributions presented in the study are included in the article/supplementary material. Further inquiries can be directed to the corresponding author.
Author contributions
KW and HL conducted the analyses. HL supervised the study. KW, HL, LZ, YL, and ZY wrote the manuscript. KW, HL, LZ, YL, and ZY contributed to the discussion of the results.
Funding
This work was supported by the State Key Program of the Joint Fund of the National Natural Science Foundation of China and the Civil Aviation Administration of China (U2033207), the Civil Aviation Security Capacity Building Fund project (2146903), and Fundamental Research Funds for the Central Universities (Civil Aviation University of China, 3122019134).
Conflict of interest
The authors declare that the research was conducted in the absence of any commercial or financial relationships that could be construed as a potential conflict of interest.
Publisher’s note
All claims expressed in this article are solely those of the authors and do not necessarily represent those of their affiliated organizations or those of the publisher, the editors, and the reviewers. Any product that may be evaluated in this article, or claim that may be made by its manufacturer, is not guaranteed or endorsed by the publisher.
References
Allan, R. J. (2000). “ENSO and climatic variability in the last 150 years,” in El Niño and the southern oscillation: Multiscale variability, global and regional impacts. 3–56. Editors H. F. Diaz, and V. Markgraf (Cambridge, UK: Cambridge University Press).
Chang, C.-P., Zhang, Y., and Li, T. (2000). Interannual and interdecadal variations of the east asian summer monsoon and tropical pacific SSTs. Part I: Roles of the subtropical ridge. J. Clim. 13 (24), 4310–4325. doi:10.1175/1520-0442(2000)013<4310:IAIVOT>2.0.CO;2
Dai, A. (2013). The influence of the inter-decadal Pacific oscillation on US precipitation during 1923–2010. Clim. Dyn. 41, 633–646. doi:10.1007/s00382-012-1446-5
Dai, X., Wang, P., and Chou, J. (2003). Multiscale characteristics of the rainy season rainfall and interdecadal decaying of summer monsoon in North China. Chin. Sci. Bull. 48 (24), 2730–2734. doi:10.1007/BF02901765
Ding, Q., and Wang, B. (2005). Circumglobal teleconnection in the northern hemisphere summer. J. Clim. 18 (17), 3483–3505. doi:10.1175/JCLI3473.1
Ding, Y. (1989). The diagnostic and analysis method in synoptic dynamics. Beijing: Science Press, 293. [in Chinese].
Hu, Z.-Z. (1997). Interdecadal variability of summer climate over East Asia and its association with 500 hpa height and global sea surface temperature. J. Geophys. Res. 102, 19403–19412. doi:10.1029/97JD01052
Huang, B., Thorne, P. W., Banzon, V. F., Boyer, T., Chepurin, G., Lawrimore, J. H., et al. (2017). Extended Reconstructed Sea surface temperature, version 5 (ERSSTv5), upgrades, validations, and intercomparisons. J. Clim. 30 (20), 8179–8205. doi:10.1175/JCLI-D-16-0836.1
Huang, R., and Sun, F. (1992). Impacts of the tropical western pacific on the east asian summer monsoon. J. Meteorological Soc. Jpn. 70, 243–256. doi:10.2151/jmsj1965.70.1B_243
Huang, R., Xu, Y., and Zhou, L. (1999). The interdecadal variation of summer precipitations in China and the drought trend in north China. Plateau. Meteor 18, 465–476. [in Chinese]. doi:10.3321/j.issn:1000-0534.1999.04.001
Joshi, M. K., and Kucharski, F. (2017). Impact of interdecadal pacific oscillation on Indian summer monsoon rainfall: An assessment from CMIP5 climate models. Clim. Dyn. 48, 2375–2391. doi:10.1007/s00382-016-3210-8
Joshi, M. K., Kucharski, F., Rai, A., and Kulkarni, A. (2021). “Indian summer monsoon and its teleconnection with Pacific decadal variability,” in Indian summer monsoon variability: El niño-teleconnections and beyond. Editors J. Chowdary, A. Parekh, and C. Gnanaseelan (Elsevier), 375–390.
Joshi, M. K., and Pandey, A. C. (2011). Trend and spectral analysis of rainfall over India during 1901–2000. J. Geophys. Res. 116, D06104. doi:10.1029/2010JD014966
Joshi, M. K., and Rai, A. (2015). Combined interplay of the Atlantic multidecadal oscillation and the interdecadal Pacific oscillation on rainfall and its extremes over Indian subcontinent. Clim. Dyn. 44, 3339–3359. doi:10.1007/s00382-014-2333-z
Joshi, M. K., Rai, A., and Kulkarni, A. (2022). Global-scale interdecadal variability a skillful predictor at decadal-to-multidecadal timescales for Sahelian and Indian Monsoon Rainfall. Npj Clim. Atmos. Sci. 5, 2. doi:10.1038/s41612-021-00227-1
Kanamitsu, M., Ebisuzaki, W., Woollen, J., Yang, S.-P., Hnilo, J. J., Fiorino, M., et al. (2002). NCEP–DOE AMIP-II Reanalysis (R-2). Bull. Am. Meteorol. Soc. 83 (11), 1631–1644. doi:10.1175/BAMS-83-11-1631
Kulkarni, A., Rao, K. K., Joshi, M. K., Rai, A., and Darshana, P. (2021). in ENSO-Indian summer monsoon teleconnections in Indian summer monsoon variability: El niño-teleconnections and beyond. Editors J. S. Chowdary, A. Parekh, and C. Gnanaseelan (Elsevier), 51–68. ISBN 9780128224021. doi:10.1016/B978-0-12-822402-1.00024-7
Kumar, K. K., Rajagopalan, B., and Cane, M. A. (1999). On the weakening relationship between the Indian monsoon and ENSO. Science 284 (5423), 2156–2159. doi:10.1126/science.284.5423.2156
Li, C., and Li, G. (1999). Variation of the NAO and NPO associated with climate jump in the 1960s. Chin. Sci. Bull. 44, 1983–1987. doi:10.1007/BF02887124
Li, C., and Liao, Q. (1996). Quasi-decadal oscillation of climate in east asia/northwestern pacific region and possible mechanism. Clim. Environ. Res. 1, 124–133. [in Chinese]. doi:10.3878/j.issn.1006-9585.1996.02.03
Li, G., Li, C., Yan, H., Jiang, X., and Ju, Y. (2020). The relationships of mid-summer rainfall over North China with north Pacific decadal oscillation and south Pacific decadal oscillation and their possible physical machenism. Chin. J. Geophys. 63 (11), 3952–3966. [in Chinese]. doi:10.6038/cjg2020N0417
Liang, P., Duan, L., Zhou, M., and Zhou, L. (2006). Circulation patterns for mid-summer drought/flood in north China and their early summer precursors. Acta. Meteor. Sin. 64, 385–391. [in Chinese]. doi:10.11676/qxxb2006.037
Liu, H., and Ding, Y. (2010). Analysis of daily precipitation characteristics over North China during summer seasons. Chin. J. Atmos. Sci. 34 (1), 12–22. [in Chinese]. doi:10.3724/SP.J.1037.2010.00186
Liu, H., Guo, P., and Zhang, J. (2004b). The interannual relationship between Davis Strait sea-ice and rainfall of North China and its decadal variability. J. Nanjing. Inst. Meteor. 27, 253–257. [in Chinese]. doi:10.13878/j.cnki.dqkxxb.2004.02.015
Liu, H., Miao, J., Wu, K., Du, M., Zhu, Y., and Hou, S. (2020). Why the increasing trend of summer rainfall over North China has halted since the mid-1990s. Adv. Meteorology 2020, 1–10. doi:10.1155/2020/9031796
Liu, H. W., Guo, P. W., and Zhang, J. (2004a). The interannual relationship between Davis Strait sea-ice and rainfall of North China and its decadal variability. J. Nanjing Inst. meteor 27 (2), 253–257. [in Chinese]. doi:10.3969/j.issn.1674-7097.2004.02.015
Liu, H. W., Zhou, T. J., Zhu, Y. X., and Lin, Y. H. (2012). The strengthening East Asia summer monsoon since the early 1990s. Chin. Sci. Bull. 57, 1553–1558. doi:10.1007/s11434-012-4991-8
Lu, R. (1999). Interdecadal variations of precipitations in various months of summer in north China. Plateau. Meteor 18, 510–519. [in Chinese]. doi:10.3321/j.issn:1000-0534.1999.04.005
Ma, Z., and Fu, C. (2006). Some evidence of drying trend over northern China from 1951 to 2004. Chin. Sci. Bull. 51, 2913–2925. doi:10.1007/s11434-006-2159-0
Ma, Z. (2007). The interdecadal trend and shift of dry/wet over the central part of North China and their relationship to the pacific decadal oscillation (PDO). Chin. Sci. Bull. 52, 2130–2139. doi:10.1007/s11434-007-0284-z
Mantua, N. J., Hare, S. R., Zhang, Y., Wallace, J. M., and Francis, R. C. (1997). A Pacific interdecadal climate oscillation with impacts on salmon production. Bull. Am. Meteorol. Soc. 78, 1069–1079. doi:10.1175/1520-0477(1997)078<1069:APICOW>2.0.CO;2
Menon, S., Hansen, J., Nazarenko, L., and Luo, Y. (2002). Climate effects of black carbon aerosols in China and India. Science 297, 2250–2253. doi:10.1126/science.1075159
Mohino, E., Janicot, S., and Bader, J. (2011). Sahel rainfall and decadal to multi-decadal sea surface temperature variability. Clim. Dyn. 37, 419–440. doi:10.1007/s00382-010-0867-2
Nitta, T. (1987). Convective activities in the tropical western pacific and their impact on the northern hemisphere summer circulation. J. Meteorological Soc. Jpn. 65, 373–390. doi:10.2151/jmsj1965.65.3_373
Nitta, T., and Hu, Z. Z. (1996). Summer climate variability in China and its association with 500 hPa height and tropical convection. J. Meteorological Soc. Jpn. 74, 425–445. doi:10.2151/jmsj1965.74.4_425
Pei, L., Yan, Z., and Yang, H. (2015). Multidecadal variability of dry/wet patterns in eastern China and their relationship with the pacific decadal oscillation in the last 413 years. Chin. Sci. Bull. 60, 97–108. [in Chinese]. doi:10.1007/s00382-014-2141-5
Power, S., Casey, T., Folland, C., Colman, A., and Mehta, V. (1999). Inter-decadal modulation of the impact of ENSO on Australia. Clim. Dyn. 15, 319–324. doi:10.1007/s003820050284
Power, S., Tseitkin, F., Torok, S., Lavery, B., Dahni, R., and McAvaney, B. (1998). Australian temperature, Australian rainfall and the southern oscillation, 1910-1992: Coherent variability and recent changes. Aust. Meteorol. Mag. 47, 85–101. doi:10.1016/S1352-2310(97)00414-7
Qian, C., and Zhou, T. (2014). Multidecadal variability of North China aridity and its relationship to PDO during 1900-2010. J. Clim. 27, 1210–1222. doi:10.1175/JCLI-D-13-00235.1
Quan, M., Liu, H. W., Zhu, Y. X., and Cheng, L. (2013). Study of the dynamic effects of upper-level jet stream on the Beijing rainstorm of 21 July 2021. Acta Meteor Sin. 71, 1012–1019. [in Chinese]. doi:10.11676/qxxb2013.092
Villamayor, J., and Mohino, E. (2015). Robust Sahel drought due to the interdecadal pacific oscillation in CMIP5 simulations. Geophys. Res. Lett. 42, 1214–1222. doi:10.1002/2014GL062473
Wang, H., and He, S. (2015). the North China/northeastern Asia severe summer drought in 2014. J. Clim. 28, 6667–6681. doi:10.1175/JCLI-D-15-0202.1
Wang, H. (2001). The weakening of the asian monsoon circulation after the end of 1970’s. Adv. Atmos. Sci. 18, 376–386. doi:10.1007/BF02919316
Wu, B., Huang, R., and Gao, D. (1999). Impacts of long-range variations of winter sea-ice extents in arctic on rainfall in north China. Plateau. Meteor 18, 590–594. [in Chinese]. doi:10.3321/j.issn:1000-0534.1999.04.014
Xie, P., Yatagai, A., Chen, M., Hayasaka, T., Fukushima, Y., Liu, C., et al. (2007). A gauge-based analysis of daily precipitation over East Asia. J. Hydrometeorol. 8, 607–626. doi:10.1175/JHM583.1
Yan, Z., Ji, J., and Ye, D. (1991). Northern hemispheric summer climatic jump in the 1960’s (II)—sea Level pressure and 500 hPa height. Sci. China Ser. B 34, 87–96.
Yan, Z., Ji, J., and Ye, D. (1990). Northern hemispheric summer climatic jump in the 1960’s (I)—rainfall and temperature. Sci. China Ser. B 33, 1092–1101.
Yang, F., and Lau, K. (2004). Trend and variability of China precipitation in spring and summer: Linkage to sea-surface temperatures. Int. J. Climatol. 24, 1625–1644. doi:10.1002/joc.1094
Yatagai, A., and Yasunari, T. (1994). Trends and decadal-scale fluctuations of surface air temperature and precipitation over China and Mongolia during the recent 40 Year period (1951-1990). J. Meteorological Soc. Jpn. 72 (6), 937–957. doi:10.2151/jmsj1965.72.6_937
Yu, R., and Zhou, T. (2007). Seasonality and three-dimensional structure of interdecadal change in the east asian monsoon. J. Clim. 20, 5344–5355. doi:10.1175/2007JCLI1559.1
Zhang, Y., Wallace, J. M., and Battisti, D. S. (1997). ENSO-Like interdecadal variability: 1900–93. J. Clim. 10, 1004–1020. doi:10.1175/1520-0442(1997)010<1004:ELIV>2.0.CO;2
Keywords: North China, summer rainfall, interdecadal change, PDO, EAP, jet stream
Citation: Wu K, Liu H, Zhao L, Lin Y and Yang Z (2022) The strengthening relationship between summer rainfall over North China and PDO since the mid-2000s. Front. Earth Sci. 10:957940. doi: 10.3389/feart.2022.957940
Received: 31 May 2022; Accepted: 22 July 2022;
Published: 31 August 2022.
Edited by:
Lu Zhang, CSIRO Land and Water, AustraliaReviewed by:
Yaocun Zhang, Nanjing University, ChinaManish K. Joshi, Genesis Ray Energy India Pvt. Ltd., India
Copyright © 2022 Wu, Liu, Zhao, Lin and Yang. This is an open-access article distributed under the terms of the Creative Commons Attribution License (CC BY). The use, distribution or reproduction in other forums is permitted, provided the original author(s) and the copyright owner(s) are credited and that the original publication in this journal is cited, in accordance with accepted academic practice. No use, distribution or reproduction is permitted which does not comply with these terms.
*Correspondence: Haiwen Liu, aHdsaXVAY2F1Yy5lZHUuY24=
 Kaijun Wu
 Haiwen Liu
 Liang Zhao
 Yihua Lin
 Zhaohong Yang