- 1Frontiers Science Center for Deep Ocean Multispheres and Earth System, Ocean University of China, Qingdao, China
- 2Physical Oceanography Laboratory, Ocean University of China, Qingdao, China
- 3Qingdao Meteorological Bureau, Qingdao, China
- 4Ocean-Atmosphere Interaction and Climate Laboratory, Ocean University of China, Qingdao, China
- 5Qingdao National Laboratory of Marine Science and Technology, Qingdao, China
- 6National Meteorological Centre, Beijing, China
Sea fog often penetrates adjacent coastal areas, a process called sea fog penetration (SFP). SFP can cause traffic accidents and other economic losses. Qingdao, an international port city with a dense population, suffers from SFP originating over the Yellow Sea in the boreal spring (March–May); the process, however, is not well-studied. Based on hourly observations from buoys and automatic weather stations distributed in Qingdao and its adjacent islands, we composite SFP events to reveal their spatiotemporal features and to investigate the mechanisms involved. Results show that these SFP events often penetrate inland areas from southeast to northwest and last 5–8 h at night. We further use reanalysis data to reveal that during the daytime before SFP, strong moisture advection at 925–975 hPa brings sufficient water vapor from the Yellow Sea to Qingdao; the water vapor then transfers downward to the surface via background descending motion and turbulent mixing. The daytime anomalous moistening, together with the following diurnal cooling at night, saturates the surface atmosphere and, hence, facilitates SFP. The strength of SFP depends on the strength of daytime anomalous moistening. Considering that moistening leads SFP by about a day, we use this relationship to predict the intensity of SFP. The accuracy of predicting SFP events could reach 50–80%, which highlights the predictability of intensity of SFP in Qingdao.
Introduction
Sea fog, or marine fog, refers to the fog that occurs under ocean influence (Wang, 1985), with horizontal visibility of less than 1 km (World Meteorological Organization, 1966). It often occurs over coastal waters and penetrates inland to affect coastal cities (Figure 1B), a phenomenon termed sea fog penetration (SFP) (Lee and Chang, 2018). Some severe SFP events associated with low visibility can disrupt human activities, causing flight delays or cancellations, and resulting in economic losses; they can also cause traffic accidents, threatening the safety of coastal residents (Leigh, 2007).
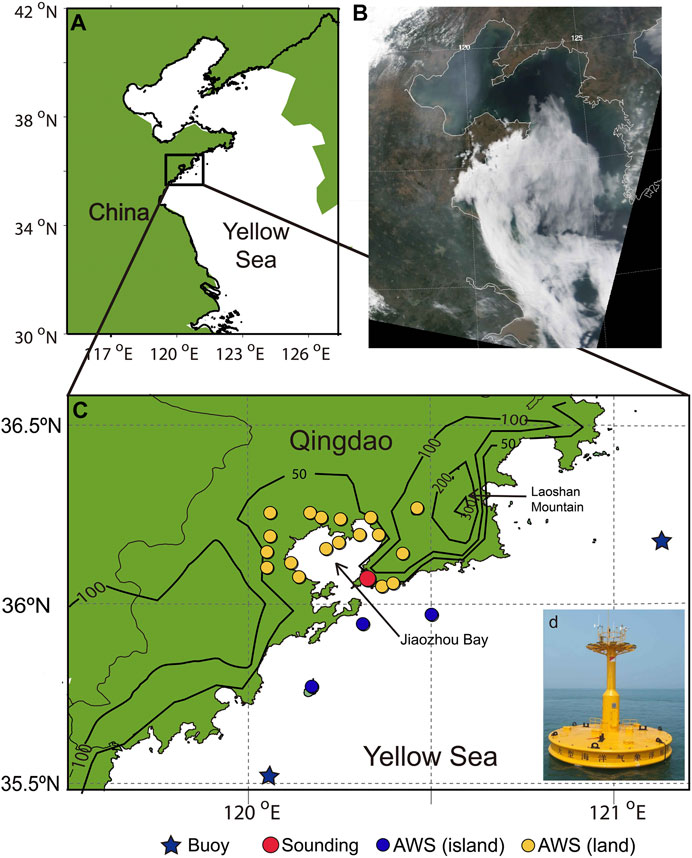
FIGURE 1. Locations of buoys, sounding stations, and automatic weather stations (AWSs) used in this study (A,C). Black contour represents topography (m). There are three AWSs on the island (blue dots) and 19 AWSs on land (yellow dots). Only 21 AWSs are visible because one overlaps with the sounding station. Panel (D) shows the buoy near Qingdao. Panel (B) is a visible image of the MODIS swath scan at 0315 UTC 1 May 2015 during an SFP event.
SFP occurs in coastal regions worldwide, though its causes may differ. In Scotland, the sea breeze determines SFP strength and dissipation (Findlater et al., 1989). Over the Korean Peninsula, when cold sea fog penetrates into warm land, a weak land–sea temperature contrast promotes SFP (Lee and Chang, 2018). Along the coasts of California and Chile, SFP is promoted by persistent onshore wind but blocked by mountain ranges further inland (Cereceda et al., 2002; Johnstone and Dawson, 2010). In addition to topography effects, SFP is affected by the land environment because a dry, warm, and unstable atmosphere over land tends to dissipate SFP (Koračin et al., 2014). Moreover, many works studied coastal fog and synoptic meteorological conditions and its life cycle, also improving the understanding of SFP (Dorman et al., 2021; Fernando et al., 2021; Gultepe et al., 2021).
Qingdao (Figure 1), a coastal city with a population of close to 10 million, experiences a high fog frequency in spring, for about 50 days every year (Zhang et al., 2009). The fog in Qingdao exhibits distinct seasonal variations that are highest during spring and summer. Considering different atmospheric circulations and features of fog from spring to summer, we only focus on spring in this study.
Previous studies show that springtime fog in Qingdao is often associated with sea fog over the Yellow Sea (Fu et al., 2008; Gao et al., 2007; Zhang et al., 2012). The Yellow sea fog is typical advection fog, occurring when prevailing southerlies transport moist and warm air from low latitude northward to the sea surface (Sugimoto et al., 2013; Gao et al., 2016). If the southerlies are persistent and strong enough, the fog or the moist air parcel may be advected northward to the Qingdao area, causing the occurrence of SFP. However, how the winds modulate the SFP processes in the Qingdao region remains unclear.
On the other hand, previous studies used sparse observations to explore SFP in Qingdao (e.g., Diao, 1992), such as data from a single sounding station (Fu et al., 2008) or satellite (Yi et al., 2015). However, the former cannot describe the spatial distribution of SFP and the latter can neither detect fog under higher cloud covers nor accurately separate fogs from low clouds (Zhang and Yi, 2013). Detailed processes associated with SFP need further studies, preferably using high-resolution observations.
Here, we use 22 automatic weather stations (AWSs) to obtain hourly SFP distribution in the Qingdao region for the first time. Such high-spatiotemporal-resolution measurements allow us to study spatiotemporal features, intensity, and mechanisms of SFP. The rest of the study is organized as follows. Data, methods, and definitions used in this study are discussed in Material and methods. Frequency and spatial distributions of SFP are shown in Temporal and spatial distribution. Mechanisms of SFP are presented in Mechanisms of SFP. What affects the intensity of SFP and how to predict it are studied in Intensity of SFP. Summary and discussion are given in Summary and discussion.
Material and methods
Observations
All the data used are from the boreal spring (March to May) each year from 2014–2018.
Two buoys, located at 119.9°E, 35.4°N and 121.2°E, 36.2°N, respectively, and three AWSs on nearby islands are chosen for sea fog detection (Figure 1B). Buoys (Figure 1C) provide hourly visibility, relative humidity (RH), temperature, and wind at 10 m above the sea level; details of the observations are given in Table 1. The three AWSs on islands provide the same measurements as the buoys.
In addition to the three AWSs on islands, there are also 19 AWSs on land in our study area. We use these hourly fog observations to detect inland fog associated with SFP and to obtain a high-spatiotemporal-resolution distribution of SFP.
Daily soundings are used to obtain the vertical structure of SFP. The soundings include the Global Telecommunication System1 (GTS1) digital radiosonde and the Government Furnished Equipment (GFE) L-band secondary wind radar, operated by the Chinese Meteorological Bureau (China Meteorological Administration, 2005). The sounding station (Figure 1B) is 75 m above sea level. These observations are operated at 20:00 local standard time (LST, which is UTC+8) each day. It provides the vertical profiles of temperature (error ±0.2°C), RH (error ±5%), and wind (error ± 1 m/s below 10 m/s) at 50 m vertical resolution (Li et al., 2009).
The ERA5 reanalysis from the European Centre for Medium-range Weather Forecasts is used to analyze the atmospheric circulation (Hersbach and Dee, 2016). The reanalysis data used in this study are on a 0.25° spatial grid at a 1 h interval.
SFP definition
SFP often occurs at midnight and dissipates the next morning (Tardif and Rasmussen, 2007). Hence, an SFP event is defined as a 24-h segment from 12 o’clock LST on day 0 to 12 o’clock LST next day (day+1), during which the following conditions are satisfied:
1) In an SFP event, land fog and sea fog need to exist at the same time. The land fog is detected when at least one inland AWS detects visibility of less than 1 km (World Meteorological Organization, 1966). The sea fog is detected when at least one buoy or one AWS on an island detects visibility of less than 1 km. Sometimes, the duration of low visibility (less than 1 km) for the station is too short to ensure that fog did occur, so the duration of the fog segment should be longer than 2 hours.
2) An SFP event is characterized by the movement of fog from the sea into land. Correspondingly, the fog should first appear at the station(s) near the sea and then be detected at the station(s) inland. To depict the movement of fog, we define an SFP-center location, the mean location of inland AWSs with fog in each hour. From the time when sea fog first penetrates the land area to the time when sea fog covers most inland AWSs, the SFP-center location must move onshore. As shown in Figure 2’s inset, the movement direction of each SFP is marked by the vector from the coordinator’s origin to each black dot. The SFP events mainly develop northwestward ranging from 233° clockwise to 53° (where 0° is to the north and the angle increases clockwise). The distance of each vector in Figure 2 is defined as the penetration distance. In addition, all fog-penetrated stations must detect onshore winds (wind direction in the range of 53°–233°, where 0° represents northerly wind).
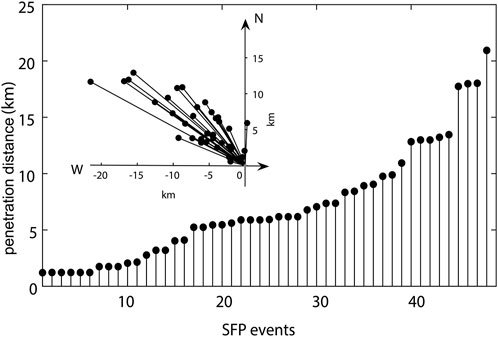
FIGURE 2. Penetration directions and distances (km) of 48 SFP events used in this study. The coordinator’s origin in the inset indicates the SFP-center location when sea fog first appeared on land. The black dot indicates the SFP-center location when SFP covered most inland stations during an SFP event. The SFP-center location is defined as the mean location of fog-affected inland AWSs. The distance from the coordinator’s origin to the dot indicates the penetration distance of the SFP event (main figure).
Using the aforementioned definition, we identified 48 SFP events during the springs from 2014–2018. Their penetration directions were mainly from southeast to northwest (Figure 2), consistent with the direction from the sea to land. These directions are also consistent with one of the four airflow paths influencing spring sea fog in the Yellow Sea (Huang et al., 2018). The median direction was 310°, as shown by the arrow in Figure 4A. The distance from the origin to each black dot represents the penetration distance during an SFP event. The result shows that the penetration distance varied from 1 to 21 km, with a median of 5.9 km.
Temporal and spatial distribution
Frequency distribution
In a 24-h SFP event, sea fog penetrates into the land, lasts for hours or nearly a day, and then disappears. To analyze how long an SFP event can last, we obtain the number of SFP events of different durations (Figure 3A). Results show that the number of events generally decreases with duration. SFP events lasting 5–8 h are most common (15 events) and those lasting 14–17 h are least common (2 events). For SFP events of different durations, their penetration distances also differ. In general, the duration of SFP events increases the penetration distance. For example, the median distance increases from 3 to 14 km when the duration increases from 2 to 17 h. It is to be noted that for SFP events lasting more than 17 h, their median penetration distance decreases with the duration. This is because some SFP events that lasted nearly a day but did not penetrate far inland (just stayed near the coast).

FIGURE 3. Numbers of SFP events (bars): different durations (A), different months (B), and different years (C). The blue line in (A) represents the median penetration distance (km) of SFP events, and the error bars indicate 75 and 25% quantiles, respectively.
To analyze how often SFP events occur, we obtain the number of SFP events in different months and years. The numbers of SFP events are similar in each month from March to May (Figure 3B), with a slight increase from 15 to 18. The increase may be related to the increase of the Yellow Sea fog, due to surface air temperature (SAT) increasing more quickly than sea-surface temperature (SST) and to the air-sea interface becoming increasingly stable from March to May (Leipper, 1994; Zhang et al., 2009). Figure 3C shows the annual numbers of SFP events from 2014–2018. The numbers increased rapidly from 3 to 16, with a drop in 2017. Although the number of SFP events increased rapidly, 5-year observations are not long enough to confirm an interannual variation of SFP. The variation of numbers of SFP events may be associated with interannual variations of SST and large-scale circulations (Norris and Leovy, 1994; Zhang et al., 2015).
Spatial distribution
Based on these high-resolution observations, we analyze the total numbers of SFP events detected by each AWS to obtain the spatial distribution of SFP events (Figure 4A). Over the sea, almost all SFP events were associated with the fogs detected by station S0 (Figure 4B). This suggests that most SFP events started from the southeastern corner of Qingdao. The sea fog first penetrated the east side of the southern mouth of Jiaozhou Bay (Figure 1B), where the stations (e.g., S1) detected more than 40 events. Then, following the median direction of the SFPs (arrow in Figure 4A), the fog penetrated Jiaozhou Bay, detected by two stations (e.g., S2) along a bridge over the bay; these stations detected about half of the events. Finally, the fog reached the coastal stations around the bay (e.g., S3), most of which only detected less than 15 events. However, four stations along the coast of Jiaozhou Bay detected nearly zero events. It may be due to the fact that the stations are located on the leeward slope of the mountains, where the environment is relatively dry and warm induced by adiabatic subsidence. Apart from the main direction of SFP, there are two stations over Laoshan Mountain, S4 and S5. Previous studies found that sea fog can only reach locations lower than the inversion layer (Johnstone and Dawson 2010; Iacobellis and Cayan 2013). Because the altitudes of S4 and S5 are lower than ∼250 m, a common height of inversion (Zhang et al., 2009), sea fog can reach these stations; as a result, 25 events (at S4) and seven events (at S5) were detected.
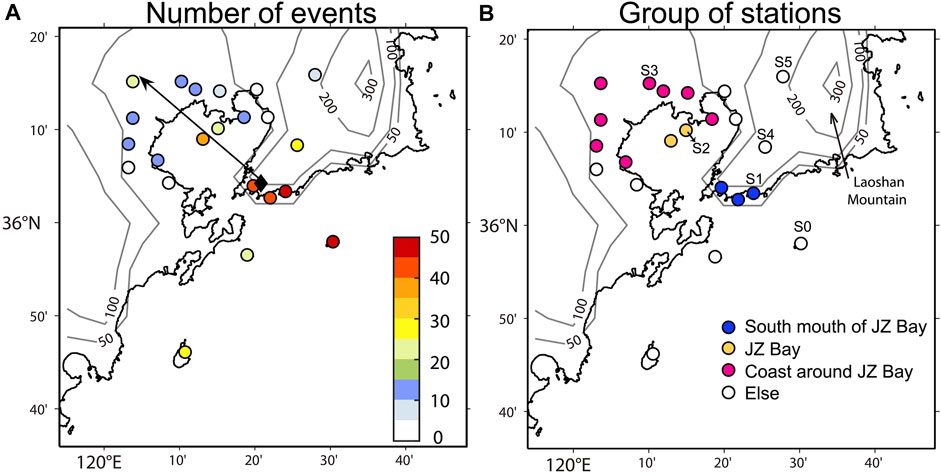
FIGURE 4. Numbers of SFP events at every AWS (A) and groups of AWSs based on locations (B). The gray contours indicate topography (m). In (A), the arrow expresses the median direction of the SFP events (shown in Figure 2’s inset). The black diamond expresses the average location where SFP starts. In (B), the names and groups of stations are given. S1, S2, and S3 are the typical stations for the three groups. S0 is a station on an island. S4 and S5 are located on Laoshan Mountain.
Mechanisms of SFP
Development of SFP
To examine the development of SFP events, we composite the hourly fog and RH along the median direction of SFP (Figure 5). The percentage of SFP at the S1 station always hovers at about 30 and 40%, and then it increases to more than 50% after midnight. At the S2 station, it starts at about 5%, and after 8 h it reaches 30%. In contrast, at the S3 station, the percentage of SFP remains only less than 20% during the night. The results depict the development of SFP from offshore to inland during the night.
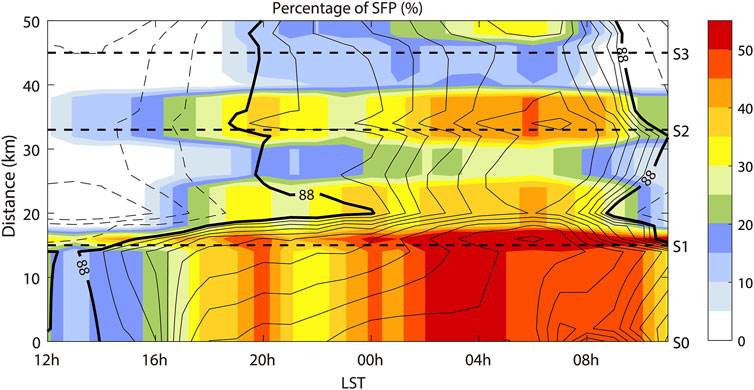
FIGURE 5. Composite results of development in SFP (%; shading) and RH (%; contouring) for all SFP events along the arrow in Figure 4A. The percentage of SFP is the mean value of fog conditions (fog is 100 and no fog is 0) among all SFP events. The interval of RH is 1% among solid lines and it is 5% among dashed lines. The Y axis is the distance from the S0 station along the arrow in Figure 4A. The distance from S0 to S1, S2, and S3 are indicated by dashed lines. The results along the arrow are interpolated by AWSs. LST is local standard time.
The development of SFP can be described by a change of RH. First of all, the liquid water vapor in fog only appears after the air has saturated or the RH closed to 100%. Hence, the increase of RH is beneficial to forming fog droplets and develops SFP. Second, the percentage of SFP is highly correlated with composite RH at about 0.78 (Figure 5). At a given station, a larger composite RH means reaching saturation more frequently, that is, more SFP events occur (Isaac et al., 2020; Gultepe et al., 2021). Hence, it is available to use the change of RH to depict the development of SFP and to decompose RH to reveal the underlying mechanism.
Contributions of specific humidity (q) and temperature (T)
According to the Clausius–Clapeyron equation, the change in RH (∂RH/∂t) is mainly controlled by specific humidity (q) and temperature (T). Therefore, to understand what induces ∂RH/∂t variation, we quantitatively decompose ∂RH/∂t to the contributions of q and T as (Yang et al., 2021)
where
Notably, the diurnal cycle of T strongly affects ∂RH/∂t. This diurnal cycle and other processes that may promote SFP are all contained in
When temperature increases,
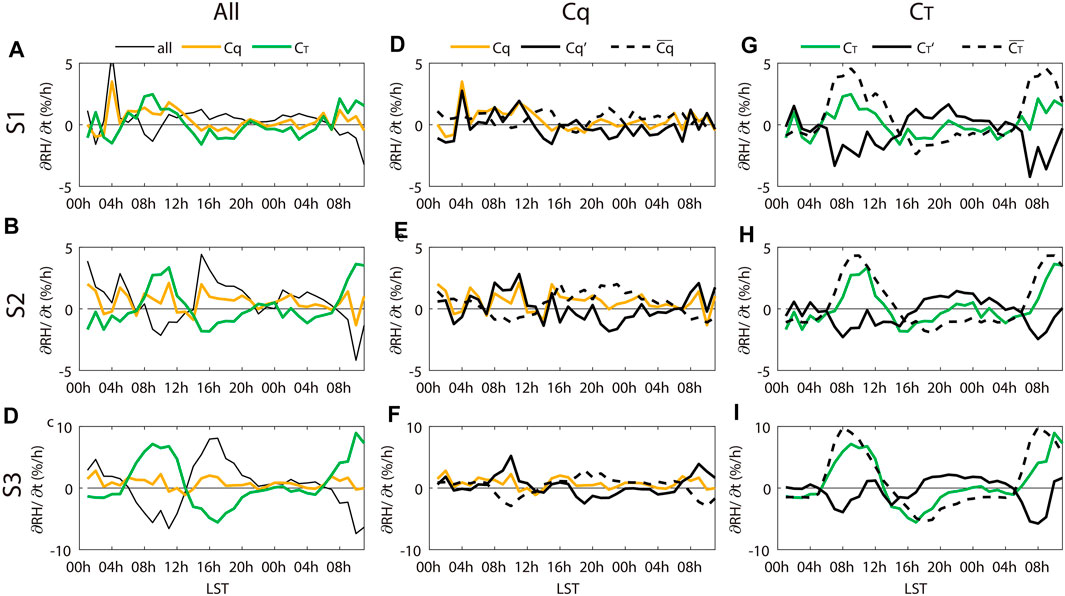
FIGURE 6. Composite ∂RH/∂t (black curve in the left column; %/h), contribution of q (
In addition to
Briefly, anomalous moistening and cooling during the day and climatological cooling at night are the main factors to increase RH and trigger SFP. It is to be noted that the aforementioned discussion concerns only surface variables, which may not represent the whole fog that extends to a few hundred meters vertically.
Physical mechanisms of anomalous moistening and cooling
During an SFP event, anomalous moistening and cooling are specific processes, which are important for understanding the development of these events. Here, we use ERA5 to explore the physical mechanisms and atmospheric circulation during the day before a developed SFP event. The surface results of ERA5 are validated by AWSs in the QD region (Table 2). The bias of ERA5 may be due to the difference between sea level pressure and surface.
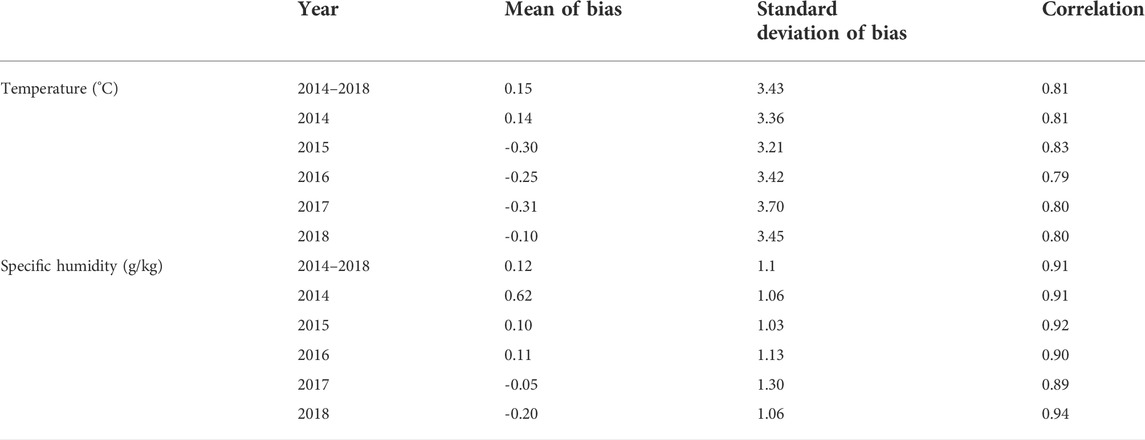
TABLE 2. Validation of AWS and ERA5 based on the region average of the Qingdao area from March to May 2014–2018. The data from AWS are at the surface and the data from ERA5 are at sea level pressure.
Figure 7 shows the composite moisture advections for all SFP events based on ERA5. The results suggest the importance of anomalous moisture advection (advq’) to SFP formation. We composite moisture advection for all SFP events and find that advq’ at 925 hPa is positive over the entire Qingdao region during day 0 due to anomalous southwesterlies (Figure 7C). This positive advq’ at the upper boundary layer (from 975 to 925 hPa) transports excessive water vapor downward to the surface through descending motion and turbulent mixing (Figure 8). In contrast, at the surface, there is negative advq’ at Jiaozhou Bay (Figure 7F) due to the weaker land–-sea difference in specific humidity. However, this negative advq’ is overwhelmed by a downward moisture supply from the upper boundary layer, leading to the increase of anomalous specific humidity (q’) in Figure 6.
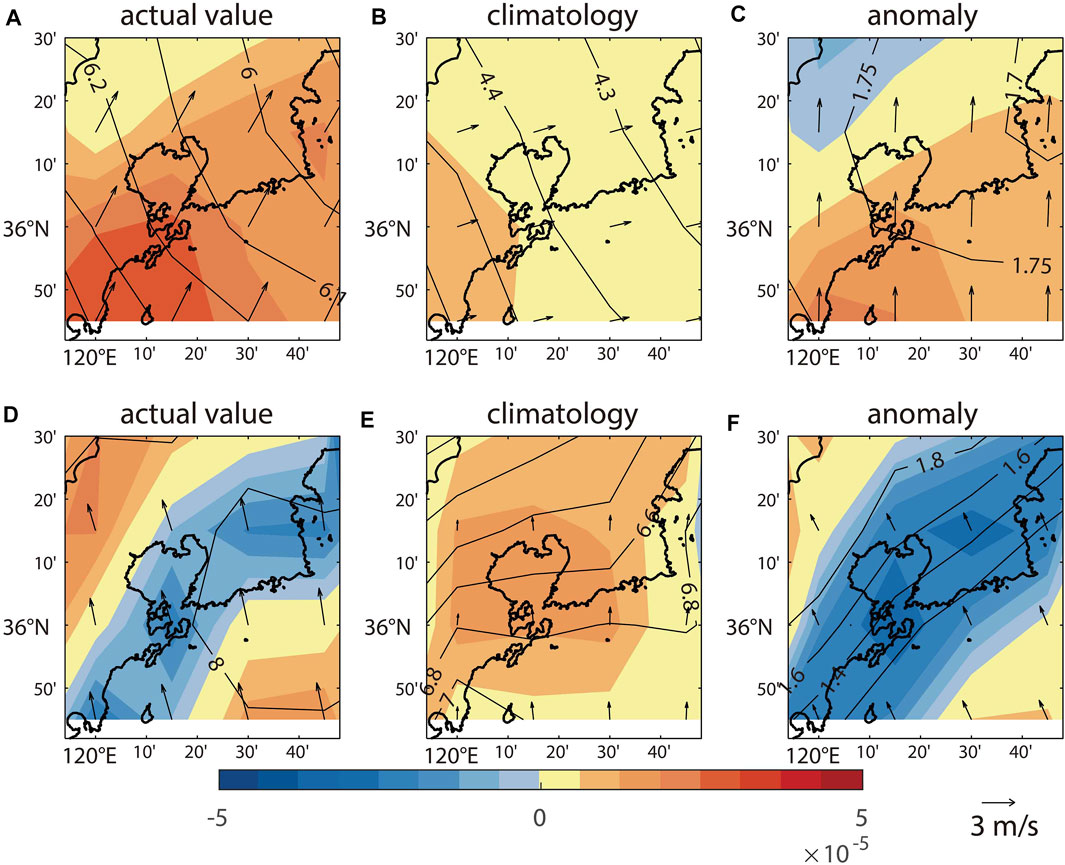
FIGURE 7. Composite results of time-averaged moisture advection (g/kg·s; shading) during day 0 00–23 LST at 925 hPa (top) and at the surface (bottom) for all SFP events based on ERA5. Left, middle, and right panels are actual, climatological, and anomalous values, respectively. The advection is given by shading, and specific humidity (g/kg) by contours. The arrows represent winds.
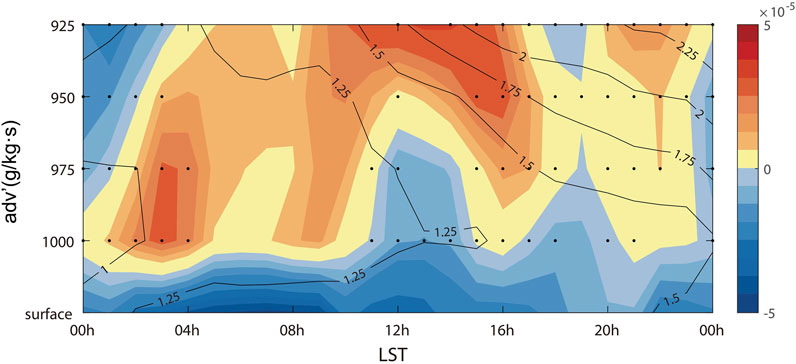
FIGURE 8. Composite results of anomalous moisture advection (g/kg·s; shading) at the Qingdao region from the surface to 925 hPa during day 0 based on ERA5. Anomalous specific humidity (g/kg) is contoured. Black dots represent anomalous descent movements. The results are based on the regional average of the Qingdao region (120.05°-120.5°W, 36°-36.25°N).
As for temperature advection, negative anomalous temperature advection (advt’) exists at the surface (Figure 9), cooling the surface and facilitating temperature inversion (details in Intensity of SFP). The temperature inversion favors moisture accumulation within the boundary layer instead of exchanging with a free atmosphere (Lewis, 2003). Hence, it provides a necessary background for downward moisture supply, which helps increase surface moisture to form an SFP event.
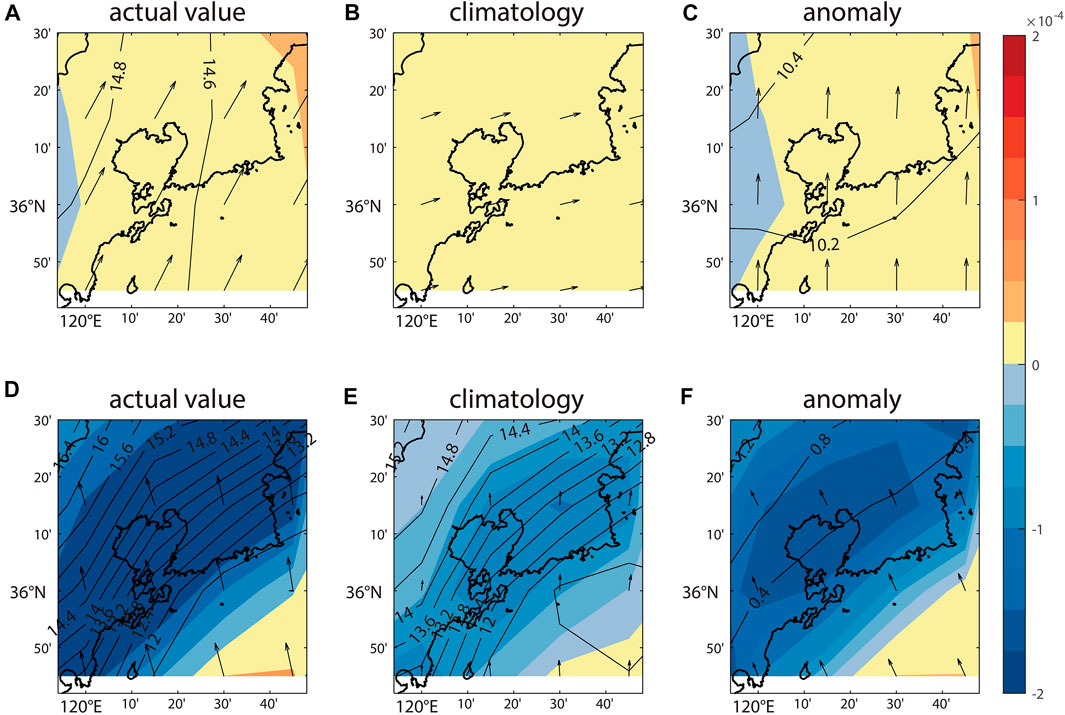
FIGURE 9. Composite results of time-averaged temperature advection (K/s; shading) during day 0 00–23 LST at 925 hPa (top) and at the surface (bottom) for all SFP events based on ERA5. Left, middle, and right panels are actual, climatological, and anomalous values, respectively. The advection is given by shading, and temperature (°C) is given by contour. The arrows represent winds.
Intensity of SFP
Weak SFP events only reached the stations near the coast, and only severe SFP events could reach deep inland stations (Figure 4A). Therefore, based on the spatial distribution and penetration distance of fog, we separate the SFP events into three types using S1, S2, and S3 as the typical stations of the three regions of Qingdao. We define the following: type-1 SFP events are the events that fog only reached S1 (22 events); type-2 SFP events are those that only reached S1 and S2 (10 events); and type-3 SFP events are those that reached S1, S2, and S3 (11 events). As a result, only five events are left out.
We composite the time series of RH′ and q’ at station S3 for the three types and compare their differences (Figure 10A). The results show that type-3 events had the most rapid increases of RH′ and q’ during daytime. From 04 to 12 LST (day0), type-3, type-2, and type-1 RH′ increased by 18, 3, and 4%, respectively. Their q’ increased by 1.7 g/kg, 0.5 g/kg, and 0.03 g/kg (Figure 10B). Moreover, q’ at 925 hPa is also the greatest in type-3 (Figure 10C). Since type-3 events are the strongest, it suggests that the intensity of the SFP events may depend on the intensity of anomalous moistening in the middle boundary layer (925–975 hPa). It is to be noted that at day 0 00 LST, the q’ in the middle boundary layer is already positive in all types (Figure 10C), suggesting that the moistening process occurs a day before SFP. We also composite the vertical structure based on the sounding data for the three types. The soundings were collected at 20 LST each day, but not every SFP event had already happened at that time. Therefore, the composite results only show the background environment of three types of SFP. Results show that type-1 and type-2 RH values decreased from ∼90% at the surface to ∼80% at 200 m, whereas type-3 RH remained above 90% from the surface to 300 m (Figure 11A). Similarly, type-1- and type-2-specific humidity values decreased with altitude, whereas type-3-specific humidity increased with an altitude below 300 m (Figure 11B). The RH and specific humidity of type-3 are significantly different from those of type-1 and type-2 (95% confidence level). As for temperature, there was no significant difference among the three types in terms of the vertical structure of temperature (Figure 11C). For example, their inversion layers had similar strengths and heights. These results support the relationship between moisture and SFP intensity, suggesting that a severe event was associated with a moister vertical environment below 300 m.
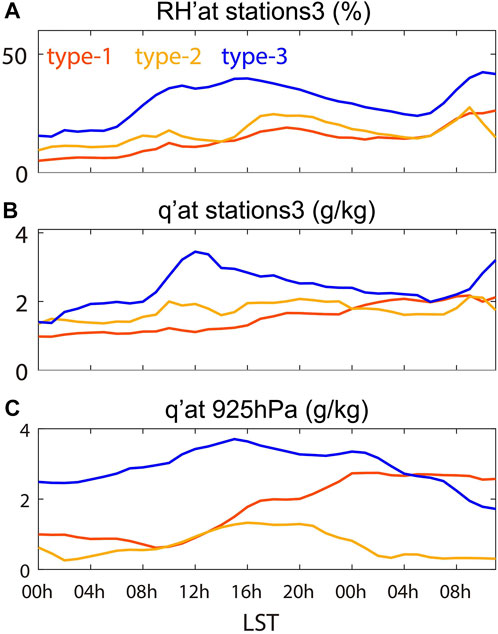
FIGURE 10. Composite results of anomalous RH (a; %), anomalous q (b; g/kg), and anomalous q at 925 hPa (c; g/kg). Red, yellow, and blue curves represent type-1, type-2, and type-3 SFP events, respectively. (A) and (B) are based on station S3. (C) is based on the regional average of the Qingdao area (120.05°-120.5°W, 36°-36.25°N) from ERA5. The time period starts from day 0 00 LST to day+1 12 LST.

FIGURE 11. Composite results of vertical RH (A; %), q (B; g/kg), and temperature (C; °C) based on sounding data (75 m above the sea level). Red, yellow, and blue curves represent type-1, type-2, and type-3 SFP events, respectively.
Anomalous moistening and cooling are two main factors leading to SFP events. Hence, we try to use these factors to predict the intensity of SFP. First, we define values X1, X2, and X
where the numerator of
Summary and discussion
SFP seriously impacts traffic safety and outdoor human activities in Qingdao. However, its spatial-temporal features and mechanisms are still unclear due to limited observations. In this study, we use the data from AWSs to show the high-spatiotemporal-resolution features of SFP in Qingdao. We also investigate the key processes behind these SFP events.
Using the definition of SFP events, we identify 48 SFP events during the spring of 2014–2018. We composite SFP events and draw the follwoing conclusions.
1) The SFP events often penetrate inland from southeast to northwest through Jiaozhou Bay. It tends to occur at night and most often lasts 5–8 h. The duration of SFP is generally proportional to the penetration distance.
2) The anomalous southwesterlies in the 975–925 hPa layer transport water vapor to the Qingdao region in the daytime before SFP. Then, the water vapor transfers downward by descending movement and turbulent mixing during the daytime, leading to anomalous moistening at the surface. At night, the surface temperature cools down and triggers the condensation of water vapor and the formation of fog from offshore to the inland.
3) The stronger SFP event is associated with stronger anomalous moistening and cooling from the surface to 925 hPa which already begins 1 day before SFP. This feature provides the possibility to predict the intensity of SFP. The accuracy of predicting type-1, type-2, and type-3 events are 50, 50, and 82%, respectively, highlighting the predictability of the intensity of SFP in Qingdao.
Lee and Chang (2018) used the Weather Research and Forecasting (WRF) model and found that in cold sea fog (SST<SAT), decreasing inland temperature can help develop SFP events. We agree with the importance of cooling to develop SFP events, but we stress that the cooling is mainly due to the diurnal cycle rather than an anomalous process. Moreover, anomalous accumulating water vapor is also necessary for developing SFP. Previous studies (Zhang et al., 2009; Kim and Yum, 2012; Huang et al., 2018) suggested that the advection fog over the Yellow Sea is formed under the southerly wind, which is similar to the wind condition of SFP events. This is not surprising, because the SFP in Qingdao is originally from the Yellow Sea fog. However, we illustrate that SFP in Qingdao is closely related to humidity and temperature over land and even related to the local terrain, which is similar to the finding of Cereceda et al. (2002). Moreover, we highlight that moistening over land has already begun before SFP occurs and propose a simple method to predict the intensity of an SFP event. However, this method needs further improvement. More observation and research are needed, such as considering variables within the whole boundary layer instead of only at the surface.
This study only focuses on the meteorological conditions inland after the fog has already formed over the sea. We did not analyze which meteorological conditions above the sea favor SFP events, which need further study.
In summary, we find that anomalous moistening before SFP is primarily responsible for SFP development and further affects SFP intensity. The climatological cooling when SFP occurs is the secondary factor, which sustains SFP. We reveal the mechanisms of SFP, highlight the importance of moistening during the day and recommend that forecasters pay attention to meteorological changes before SFP appears.
Data availability statement
The original contributions presented in the study are included in the article/Supplementary Material; further inquiries can be directed to the corresponding author/s.
Author contributions
S-TS: investigation, software, visualization, validation, and original draft. X-MS: data curation, resources, review, and editing. S-PZ: funding acquisition, conceptualization, original draft, review, and editing. X-YC: review and editing. Y-CX: resources and project administration. WZ: data curation and resources. CY: data curation and resources. BH: data curation and resources. LY: conceptualization, methodology, supervision, original draft, review, and editing.
Funding
This work is supported by the National Key Research and Development Program of China (grant numbers 2019YFC1510102 and 2018YFA0605903), the National Natural Science Foundation of China [grant numbers 41975024 and 41876130] and the Marine Meteorology Research and Development Program of the Qingdao Meteorological Bureau (grant number 2019qdqxz02).
Acknowledgments
The authors wish to thank Jing-Wu Liu and Jun-Chao Yang for their valuable comments.
Conflict of interest
The authors declare that the research was conducted in the absence of any commercial or financial relationships that could be construed as a potential conflict of interest.
Publisher’s note
All claims expressed in this article are solely those of the authors and do not necessarily represent those of their affiliated organizations, or those of the publisher, the editors, and the reviewers. Any product that may be evaluated in this article, or claim that may be made by its manufacturer, is not guaranteed or endorsed by the publisher.
Supplementary material
The Supplementary Material for this article can be found online at: https://www.frontiersin.org/articles/10.3389/feart.2022.956836/full#supplementary-material
References
Cereceda, P., Osses, P., Larrain, H., Farı́as, M., Lagos, M., Pinto, R., et al. (2002). Advective, orographic and radiation fog in the Tarapacá region, Chile. Atmos. Res. 64, 261–271. doi:10.1016/S0169-8095(02)00097-2
China Meteorological Administration (2005). People’s Republic of China meteorological industry standard:GTS1 digital radiosonde. Beijing: Standards Press of China.
Diao, X. (1992). Statistical analysis of sea fog in Qingdao and offshore (in Chinese). Mar. Forecast 8, 45–55.
Dorman, C. E., Hoch, S. W., Gultepe, I., Wang, Q., Yamaguchi, R. T., Fernando, H. J. S., et al. (2021). Large-scale synoptic systems and fog during the C-fog field experiment. Netherlands: Springer. doi:10.1007/s10546-021-00641-1
Fernando, H. J. S., Gultepe, I., Dorman, C., Pardyjak, E., Wang, Q., Hoch, S. W., et al. (2021). C-FOG life of coastal fog. Bull. Am. Meteorol. Soc. 102, E244–E272. doi:10.1175/BAMS-D-19-0070.1
Findlater, J., Roach, W. T., and McHugh, B. C. (1989). The haar of north-east Scotland. Q. J. R. Meteorol. Soc. 115, 581–608. doi:10.1002/qj.49711548709
Fu, G., Guo, J., Pendergrass, A., and Li, P. (2008). An analysis and modeling study of a sea fog event over the Yellow and Bohai Seas. J. Ocean. Univ. China 7, 27–34. doi:10.1007/s11802-008-0027-z
Gao, S., Lin, H., Shen, B., and Fu, G. (2007). A heavy sea fog event over the Yellow Sea in March 2005: Analysis and numerical modeling. Adv. Atmos. Sci. 24, 65–81. doi:10.1007/s00376-007-0065-2
Gao, R., Li, X., Ren, Z., and Wang, J. (2016). Study of the sea fog prediction by classification and regression tree (CART) analyses in Qingdao coastal area. Mar. Forecast. 33, 80–87. doi:10.11737/j.issn.1003-0239.2016.04.010
Gultepe, I., Heymsfield, A. J., Fernando, H. J. S., Pardyjak, E., Dorman, C. E., Wang, Q., et al. (2021). A review of coastal fog microphysics during C-fog. Bound. Layer. Meteorol. 181, 227–265. doi:10.1007/s10546-021-00659-5
Huang, J., Wang, B., Wang, X., Huang, F., Lü, W., and Jing, T. (2018). The spring Yellow sea fog: Synoptic and air–sea characteristics associated with different airflow paths. Acta Oceanol. Sin. 37, 20–29. doi:10.1007/s13131-018-1155-y
Iacobellis, S. F., and Cayan, D. R. (2013). The variability of California summertime marine stratus: Impacts on surface air temperatures. J. Geophys. Res. Atmos. 118, 9105–9122. doi:10.1002/jgrd.50652
Isaac, G. A., Bullock, T., Beale, J., and Beale, S. (2020). Characterizing and predicting marine fog offshore newfoundland and labrador. Weather Forecast. 35, 347–365. doi:10.1175/WAF-D-19-0085.1
Johnstone, J. A., and Dawson, T. E. (2010). Climatic context and ecological implications of summer fog decline in the coast redwood region. Proc. Natl. Acad. Sci. U. S. A. 107, 4533–4538. doi:10.1073/pnas.0915062107
Kim, C. K., and Yum, S. S. (2012). A numerical study of sea-fog formation over cold sea surface using a one-dimensional turbulence model coupled with the weather research and forecasting model. Bound. Layer. Meteorol. 143, 481–505. doi:10.1007/s10546-012-9706-9
Koračin, D., Dorman, C. E., Lewis, J. M., Hudson, J. G., Wilcox, E. M., Torregrosa, A., et al. (2014). Marine fog: A review. Atmos. Res. 143, 142–175. doi:10.1016/j.atmosres.2013.12.012
Lee, H.-Y., and Chang, E.-C. (2018). Impact of land-sea thermal contrast on the inland penetration of sea fog over the coastal area around the Korean Peninsula. J. Geophys. Res. Atmos. 123, 6487–6504. doi:10.1029/2017JD027633
Leigh, R. J. (2007). Economic benefits of terminal aerodrome forecasts (TAFs) for sydney airport, Australia. Met. Apps. 2, 239–247. doi:10.1002/met.5060020307
Leipper, D. F. (1994). Fog on the U.S. West coast: A review. Bull. Am. Meteorol. Soc. 75, 229–240. doi:10.1175/1520-0477(1994)075<0229:FOTUWC>2.0.CO;2
Lewis, J. (2003). Sea fog off the California coast: Viewed in the context of transient weather systems. J. Geophys. Res. 108, 4457. doi:10.1029/2002JD002833
Li, W., Xing, Y., and Ma, S. (2009). The analysis and comparison between GTS1 radiosonde made in China and RS92 radiosonde of vaisala company (in Chinese). Meteorol. Mon. 35, 97–102.
Norris, J. R., and Leovy, C. B. (1994). Interannual variability in stratiform cloudiness and sea surface temperature. J. Clim. 7, 1915–1925. doi:10.1175/1520-0442(1994)007<1915:IVISCA>2.0.CO;2
Sugimoto, S., Sato, T., and Nakamura, K. (2013). Effects of synoptic-scale control on long-term declining trends of summer fog frequency over the pacific side of hokkaido island. J. Appl. Meteorol. Climatol. 52, 2226–2242. doi:10.1175/JAMC-D-12-0192.1
Tardif, R., and Rasmussen, R. M. (2007). Event-based climatology and typology of fog in the New York city region. J. Appl. Meteorol. Climatol. 46, 1141–1168. doi:10.1175/JAM2516.1
Yang, L., Liu, J.-W., Xie, S.-P., and Shen, S. S. P. (2021). Transition from fog to stratus over the Northwest Pacific Ocean: large-eddy simulation. Mon. Weather Rev. 149, 1–45. doi:10.1175/MWR-D-20-0420.1
Yi, L., Zhang, S. P., Thies, B., Shi, X. M., Trachte, K., and Bendix, J. (2015). Spatio-temporal detection of fog and low stratus top heights over the Yellow sea with geostationary satellite data as a precondition for ground fog detection — a feasibility study. Atmos. Res. 151, 212–223. doi:10.1016/j.atmosres.2014.03.020
Zhang, S.-P., Xie, S.-P., Liu, Q.-Y., Yang, Y.-Q., Wang, X.-G., and Ren, Z.-P. (2009). Seasonal variations of Yellow sea fog: Observations and mechanisms. J. Clim. 22, 6758–6772. doi:10.1175/2009JCLI2806.1
Zhang, S.-P., and Yi, L. (2013). A comprehensive dynamic threshold algorithm for daytime sea fog retrieval over the Chinese adjacent seas. Pure Appl. Geophys. 170, 1931–1944. doi:10.1007/s00024-013-0641-6
Zhang, S., Chen, Y., Long, J., and Han, G. (2015). Interannual variability of sea fog frequency in the Northwestern Pacific in July. Atmos. Res. 151, 189–199. doi:10.1016/j.atmosres.2014.04.004
Keywords: automatic weather station, coastal fog, inland penetration, moisture advection, boundary layer, prediction
Citation: Song S-T, Shi X-M, Zhang S-P, Chen X-Y, Xue Y-C, Zhao W, Yang C, Huang B and Yi L (2022) Springtime sea fog penetration in Qingdao: Anomalous moistening and diurnal cooling. Front. Earth Sci. 10:956836. doi: 10.3389/feart.2022.956836
Received: 30 May 2022; Accepted: 16 August 2022;
Published: 19 September 2022.
Edited by:
Guihua Wang, Fudan University, ChinaReviewed by:
Jingchao Long, Guangdong Ocean University, ChinaHuijun Huang, China Meteorological Administration (CMA), China
Copyright © 2022 Song, Shi, Zhang, Chen, Xue, Zhao, Yang, Huang and Yi. This is an open-access article distributed under the terms of the Creative Commons Attribution License (CC BY). The use, distribution or reproduction in other forums is permitted, provided the original author(s) and the copyright owner(s) are credited and that the original publication in this journal is cited, in accordance with accepted academic practice. No use, distribution or reproduction is permitted which does not comply with these terms.
*Correspondence: Li Yi, eWlsaUBvdWMuZWR1LmNu
 Shu-Tong Song
 Xiao-Meng Shi3
 Su-Ping Zhang
