- 1Yellow River Engineering Consulting Co., Ltd., Zhengzhou, China
- 2Key Laboratory of Water Management and Water Security for Yellow River Basin, Ministry of Water Resources, Zhengzhou, China
- 3Yellow River Institute of Water Protection Research, Zhengzhou, China
- 4College of Geoscience and Engineering, North China University of Water Resources and Electric Power, Zhengzhou, China
An environmental water supplement through reservoir regulation is an important way to restore the deltaic coastal wetland. In order to quantify the impact of the reservoir on the deltaic coastal wetland ecosystem, this article proposes a quantitative analysis method for the ecological impact and contribution rate of the reservoir, which compares the ecological status in two scenarios with the presence or absence of the reservoir during the assessment period, and reveals the reservoir’s impact on and contribution rate to the ecological status and environmental water supplement conditions. The results show that during 2000–2019, through the regulation of the Xiaolangdi Reservoir, the average annual drying up days at the Lijin section reduced by 81.15 days, the average annual assurance rate of ecological base flow at the Lijin section increased by 20.60%, and the volume of water flowing into the sea from April to June increased by 2.37 billion m³. During 2008–2015, the Xiaolangdi Reservoir increased the environmental water supplement of the Yellow River Delta by 19.95 million m³. Compared with the flow and water withdrawal during 1980–1999, the natural flow of the Yellow River decreased by 10.59% and the measured flow in the lower reaches decreased by 22.15%, and the water withdrawal in the lower reaches increased by 0.32 billion m³ during 2000–2019, which is detrimental to provide environmental water to the Yellow River Delta wetland and coastal areas. The Xiaolangdi Reservoir reversed the adverse effects of flow and water withdrawal and ensured the continuous ecological improvement in the Yellow River Delta and coastal areas, providing the respective contribution rate of 187.85%, 137.24%, and 125.83% to the prevention of drying up at the Lijin section, the increase in the assurance rate of ecological base flow at the Lijin section, and the increase in the volume of water flowing into the sea in the critical period.
Introduction
The coastal wetland is one of the most productive ecosystems (Osland et al., 2018; Zhao et al., 2018). Coastal wetlands can provide biological habitats, purify water quality, facilitate carbon sequestration, resist coastal floods, and protect food security (Narayan et al., 2017; Wang et al., 2020; Zhu et al., 2020), and the value of ecological services is up to US$1,94,000/(ha•yr) (Liu et al., 2021). Coastal wetlands are at the junction of land and sea and are significantly affected by climate change, particularly, the sea level rise (Gabler et al., 2017; Mehvar et al., 2019; Yu et al., 2019). In addition, factors such as land use change, decrease of sediment transport, and decrease of freshwater recharge also lead to the shrinkage of coastal wetland areas and decline in ecological service function (Pascual-Aguilar et al., 2015; Ma et al., 2017; Lin and Yu, 2018). It is estimated that the world’s coastal wetland area decreased by more than 50% in the 20th century (Li et al., 2018). China’s coastal wetland area has declined by up to 58% from 1950 to 2014, with a shrinking area of 8.01 million ha (Sun et al., 2015). The restoration of coastal wetlands is gaining more and more attention, and many achievements have been made in relevant studies on management strategies, risk identification, hydrological and ecological action mechanisms, and the intrinsic role and optimization of wetland biological community (Stagg et al., 2016; Rodríguez et al., 2017; Borchert et al., 2018; Manuel et al., 2018; Renzi et al., 2019).
The deltaic coastal wetland is an important part of coastal wetland. It is the transition zone between rivers and the sea. An estuarine delta is generally the region where agriculture, trade, and fisheries are well developed and strongly disturbed by human activities. In addition, the estuarine delta is also affected by the water and sediment regulation process of the upstream reservoir and water intake along the river. Thus, striking changes have taken place in many deltaic ecological environments (Day et al., 2016). The decrease in freshwater recharge from the river to the delta is one of the main causes of the shrinkage and degradation of the deltaic coastal wetlands. Reservoir construction and operation is an important way of river development. There are more than 15,000 dams that were completed or under construction in the world with a dam height of more than 30 m (Duarte et al., 2016), and about two-thirds of the rivers longer than 1,000 km are not free-flowing (Grill et al., 2019). In recent years, more and more attention has been paid to the ecological protection function of the reservoir. Measures to improve the ecological environment such as discharging environmental flow and creating artificial floods have been studied and applied in many reservoirs (Poff and Schmidt, 2016; Adams et al., 2017; Leroy and Olden, 2018; Qiu et al., 2020). The protected area of the reservoir ecological regulation also gradually extends from the river to the estuary and coastal waters (Yang et al., 2019). The reservoir realizes the environmental water supplement by changing the flow process through storage and discharge regulation. But the flow change is also affected by other factors, such as climate change, water withdrawal, and utilization. Therefore, quantitative analysis of the impact and contribution rate of the reservoir itself on the flow change is a difficult point in the current studies.
The Yellow River Delta is the most complete wetland ecosystem in the warm temperate zone in China, and it is the core habitat that provides a transfer station, overwintering, and breeding place for migrating birds in the inland of Northeast Asia and the Western Pacific Rim (Cui et al., 2009; Changming et al., 2018). There is a severe contradiction between water demand and supply in the Yellow River Basin where the water resource per capita is only 473 m³, the utilization rate of water resources has reached 80%, and the problem of insufficient environmental water has been existing for a long time (Hua and Cui, 2017; Yin et al., 2017). In the 1980s–1990s, there have been drying up days in the lower Yellow River for 15 years. In 1997, the drying up days at the Lijin section of the lower Yellow River reached 227 days, and there was no water flowing into the sea for 330 days (Liu and Zhang, 2002). Insufficient environmental water, reduced sediment transport, farmland reclamation, urbanization, and other factors have led to serious degradation of the Yellow River Delta wetland. The area of reed marsh has dropped from 16.65 thousand ha in 1986 to 11.61 thousand ha in 2006, and coastline erosion, reduction of biological species, and other problems have arisen (Kong et al., 2015; Wang et al., 2016; Zhang et al., 2017; Wang et al., 2019). In order to protect the wetland ecosystem, the Yellow River Conservancy Commission has carried out environmental water supplement for the Yellow River Delta since 2008. As of 2019, the accumulated environmental water supplement reached 461.45 million m³, and the wetland vegetation has been restored to a certain extent. The environmental water supplement in the Yellow River Delta is mainly achieved by the large flow process created by the Xiaolangdi Reservoir. The current relevant studies mainly focus on the effect of ecological restoration in the Yellow River Delta, and the role of reservoir regulation is mainly determined by qualitative analysis.
This article aims to quantify the impact of the reservoir on the deltaic coastal wetland and coastal ecosystem. This article proposes a quantitative analysis method for the ecological impact and contribution rate of the reservoir and quantifies the contribution of the Xiaolangdi Reservoir to the prevention of drying up of the Yellow River channel, the provision of river ecological base flow, and the provision of environmental water to the Yellow River Delta wetland and coastal areas.
Materials and methods
Study area
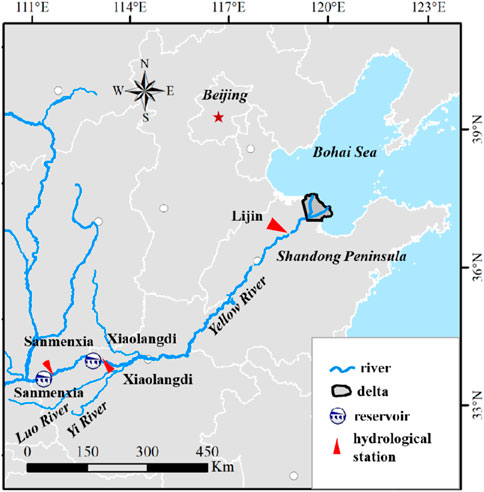
The study area is from the Xiaolangdi Reservoir to the estuary of the Yellow River (Figure 1). The Yellow River Delta, located at the estuary of the Yellow River, faces the Bohai Sea in the north and has an area of about 2,400 km2. The Xiaolangdi Reservoir is 899 km away from the estuary and has a total storage capacity of 12.65 billion m³. It was put into operation in 2000, and it controls the flow in the lower Yellow River. Since the Yellow River is a sediment-laden river, in order to reduce sedimentation, water and sediment regulation (WSR) has been conducted in the Xiaolangdi Reservoir from June to July. During WSR, large flows were artificially made to scour the reservoir and the lower Yellow River channel (Xu et al., 2016; Lu et al., 2020). The large flow during WSR also provides suitable flow conditions for the environmental water supplement to the Yellow River Delta.
Evaluation indicators
The ecological impact of the Xiaolangdi Reservoir on the Yellow River Delta and coastal areas are evaluated by four ecological indicators, namely, the drying up days at the Lijin section, the assurance rate of ecological base flow at the Lijin section, the volume of water flowing into the sea from April to June, and the environmental water supplement in the Yellow River Delta. The Lijin section is close to the estuary of the Yellow River, and its drying up days represent the duration of an extreme low flow period, which is extremely harmful to the ecology of the Yellow River Delta and coastal ecosystem. Ecological base flow is the bottom limit of flow to maintain the ecological function of the river. This article adopts ecological base flow at the Lijin section (50 m³/s) issued by the Ministry of Water Resources of China in 2020. According to the policies of the Ministry of Water Resources of China, the assurance rate of ecological base flow should be no less than 90%. April to June is a critical period for fish reproduction in the coastal areas of the Yellow River estuary, so it is important to ensure the volume of water flowing into the sea during this period to create low-salinity areas suitable for reproduction. The Lijin section controls the environmental water supplement in the Yellow River Delta. The flow at the Lijin section over the years when the conditions for the environmental water supplement in the Yellow River Delta have been met is shown in Table 1. Therefore, the Lijin section is taken as the evaluation section, and all four ecological indicators are calculated based on the daily flow of the Lijin section.

TABLE 1. Threshold flow (Lijin section) of the environmental water supplement in the Yellow River Delta (m³/s).
Scenario setting
This article changes the reservoir conditions in different scenarios and quantifies the ecological impact of the reservoir by comparing ecological indicator values in different scenarios. The evaluation period is set at 2000–2019. Two scenarios are set (Table 2). Scenario 1 represents the flow status at the Lijin section with the regulation of the Xiaolangdi Reservoir, whereas Scenario 2 represents the flow status at the Lijin section without the regulation of the Xiaolangdi Reservoir. The inflow into the Xiaolangdi Reservoir and the water withdrawal under the Xiaolangdi Reservoir are the same in the two scenarios.
In Scenario 2, the regulation of the Xiaolangdi Reservoir needs to be eliminated, i.e., flow restoration needs to be performed. The inflow of the Xiaolangdi Reservoir represents the flow status before the regulation of this reservoir, thus replacing the outflow of the Xiaolangdi Reservoir with the inflow to eliminate the regulation impact. Based on the water balance principle, daily flow at the Lijin section without the regulation of the Xiaolangdi Reservoir can be obtained using the following formula:
where rS,t is the average daily flow of the Lijin section on day t without the regulation of the Xiaolangdi Reservoir, m³/s; rI,t-t1 is the measured inflow of the Xiaolangdi Reservoir on day (t-t1), m³/s; rB,t-t2 is the tributary inflow into the river in the region between the Xiaolangdi Reservoir and Lijin section on day (t-t2), m³/s; rW,t-t3 is the water withdrawal in the region between the Xiaolangdi Reservoir and Lijin section on day (t-t3), m³/s; rL is the daily average loss of flow due to evaporation and leakage in the region between the Xiaolangdi Reservoir and Lijin section, m³/s; and t1, t2, and t3 are the time for water flowing from the Xiaolangdi Reservoir, the location of the tributary flowing into the trunk stream, and the water-withdrawing location to the Lijin section, respectively, d.
Quantitative analysis method for the ecological impact of the reservoir
The ecological status of the Yellow River Delta wetland and coastal areas in the two scenarios is expressed as FA and FS, respectively, as follows:
where fA,i and fS,i are the ith ecological indicator in Scenario 1 and Scenario 2, respectively, and i =1,2,…,n; and n is the number of ecological indicators, n=4.
The ecological impact of the Xiaolangdi Reservoir on the Yellow River Delta wetland and coastal areas (E) is expressed as:
where ei is the impact of the Xiaolangdi Reservoir on the ith ecological indicator.
Quantitative analysis method for the contribution rate of the reservoir
The ecological status of the Yellow River Delta wetland and coastal areas is affected by reservoir regulation, climate change, land use change, and other factors. Changes in the ecological status between 1980–1999 and 2000–2019, under the influence of multiple factors, can be figured out by comparing the ecological indicator values in Scenario 1 and the ecological indicator values quantified by measured data from 1980 to 1999. The measured ecological status of the Yellow River Delta wetland and coastal areas from 1980 to 1999 (FC) is expressed as:
where fC,i is the ith ecological indicator quantified by measured daily flow at the Lijin section during 1980–1999.
Compared with 1980–1999, the change (V) of ecological status in 2000–2019 is expressed as:
where vi is the change of the value of the ith ecological indicator between 1980–1999 and 2000–2019.
The contribution rate P of the Xiaolangdi Reservoir to the ecological status change V is expressed as:
where pi is the contribution rate of the Xiaolangdi Reservoir to the change (vi) of the value of the ith ecological indicator. The change of the ith ecological indicator value between 1980–1999 and 2000–2019 under the impact of other factors except the Xiaolangdi reservoir can be quantified by (fS,i—fC,i). Thus, (fS,i—fC,i)/(fA,i—fC,i) shows the contribution rate of other factors except the Xiaolangdi Reservoir to the change of the ith ecological indicator value between 1980–1999 and 2000–2019.
Data
The data of water withdrawal and utilization are derived from the Yellow River Water Resources Bulletin (http://www.yrcc.gov.cn/other/hhgb/). The flow data measured at the Sanmenxia hydrological station are used as the inflow data of the Xiaolangdi Reservoir. The flow data measured at the Xiaolangdi hydrological station are used as the outflow data of the Xiaolangdi Reservoir. The daily flow data measured at the Sanmenxia, Xiaolangdi, and Lijin hydrological stations are provided by the Hydrological Bureau of the Yellow River Conservancy Commission.
Due to the lack of flow monitoring data of the Yellow River Delta before 2008, this article only evaluates the contribution rates of the Xiaolangdi Reservoir regulation to the drying up days at the Lijin section, the assurance rate of ecological base flow at the Lijin section, and the volume of water flowing into the sea from April to June.
Results
Flow restoration results
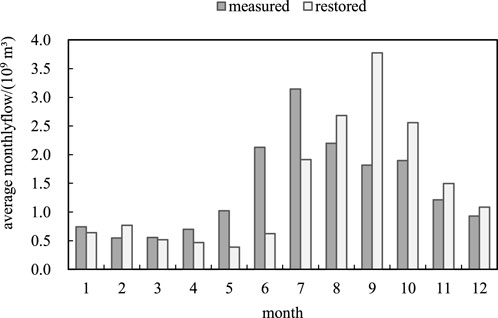
The regulation of the Xiaolangdi Reservoir did not impose an obvious impact on the long-series flow. The measured average annual flow at the Lijin section during 2000–2019 was 16.89 billion m³, and the average annual flow after restoration was 16.91 billion m³. The downstream water withdrawing conditions were poor in some time periods in Scenario 2; therefore, the average annual flow after restoration was slightly higher than the measured average annual flow. As the Xiaolangdi Reservoir is an incomplete annual regulating reservoir, it mainly changes the distribution of the flow process throughout the year (Figure 2): the measured average monthly flow from April to July at the Lijin section during 2000–2019 was higher than the restored value, while the measured average monthly flow from August to November was lower than the restored value, and the change of average monthly flow from December to next March (before and after restoration) was not obvious.
Impact on the drying up days and assurance rate of ecological base flow at the Lijin section
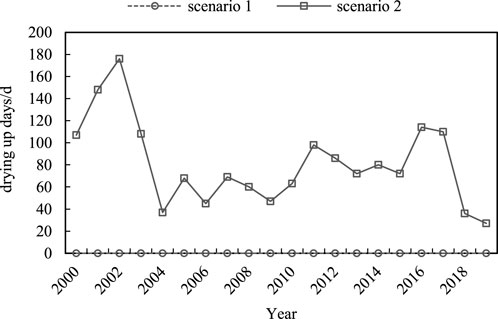
In Scenario 1, the average annual drying up days at the Lijin section were 0 days during 2000–2019; in Scenario 2, the flow simulation results showed that the average annual drying up days at the Lijin section were 81.15 days during 2000–2019, and the annual longest drying up days were 176 days (Figure 3; Table 3).
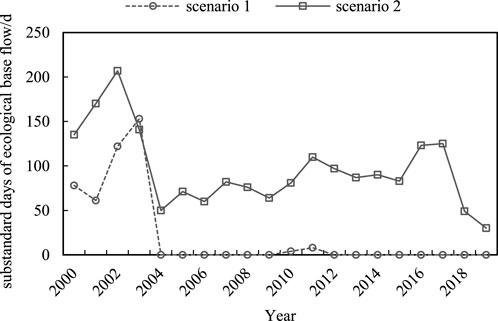
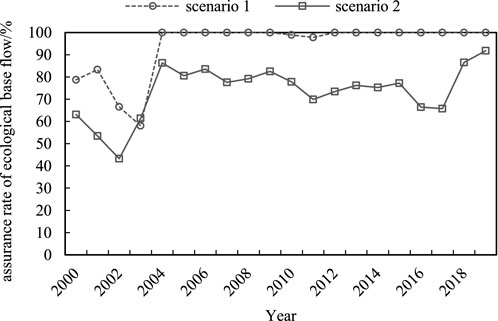
The substandard days and assurance rate of ecological base flow at the Lijin section in two scenarios are shown in Figures 4, 5, and Table 3. In Scenario 1, on average, there were 21.30 days per year in which the flow was lower than the ecological base flow, and the average annual assurance rate of ecological base flow was 94.16%. There had been barely any substandard days of ecological base flow since 2004. In Scenario 2, the average annual substandard days of ecological base flow were 96.55 days. The average annual assurance rate of ecological base flow was 73.55% in Scenario 2, which was far below the target set by the Ministry of Water Resources of China (90%). The Xiaolangdi Reservoir decreased the average annual substandard days of ecological base flow by 75.25 days and increased the average annual assurance rate of ecological base flow by 20.60%.
Impact on the volume of water flowing into the sea from April to June
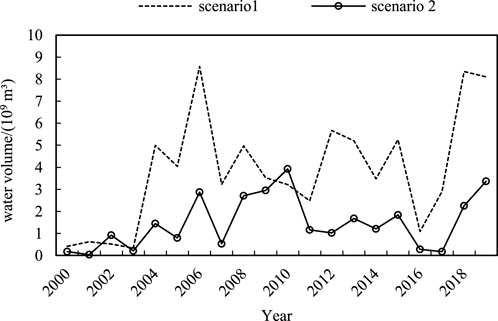
The volume of water flowing into the sea from April to June in scenarios 1 and 2 and the proportion of the annual volume of water flowing into the sea are shown in Figures 6, 7, and Table 3. In Scenario 1, the annual average volume of water flowing into the sea from April to June was 3.85 billion m³, accounting for 22.78% of the annual volume of water flowing into the sea, and the years with the volume of water flowing into the sea from April to June exceeding 3 billion m³ accounted for 65%. In Scenario 2, the annual average volume of water flowing into the sea from April to June reduced to 1.48 billion m³, accounting for 8.74% of the annual volume of water flowing into the sea, and the years with the volume of water flowing into the sea from April to June exceeding 3 billion m³ only accounted for 10%. The Xiaolangdi Reservoir increased the annual average volume of water flowing into the sea from April to June by 2.37 billion m³.
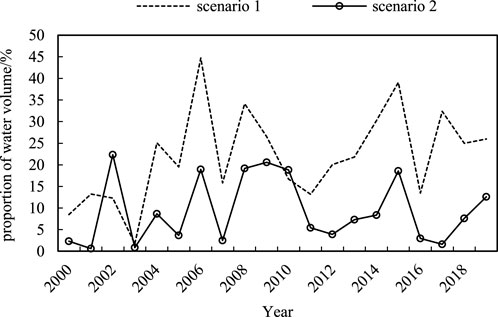
FIGURE 7. Proportion of water volume flowing into the sea from April to June in that of the whole year in two scenarios.
Impact on the environmental water supplement in the Yellow River Delta
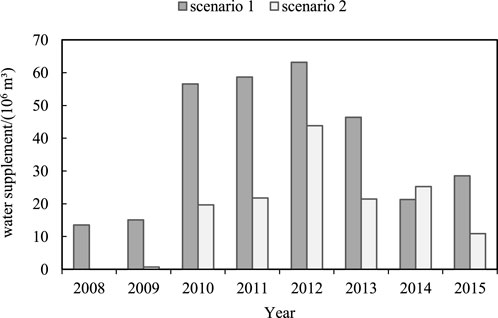
The environmental water supplements in the Yellow River Delta in scenarios 1 and 2 are shown in Figure 8. In Scenario 1, the accumulated environmental water supplement in the Yellow River Delta from 2008 to 2015 was 303.31 million m³, and the annual average environmental water supplement was 37.91 million m³. In Scenario 2, the accumulated environmental water supplement in the Yellow River Delta during 2008–2015 was 143.71 million m³, which was only 47.38% of that in Scenario 1, and the annual average environmental water supplement was 17.96 million m³. The Xiaolangdi Reservoir has increased the environmental water supplement volume in the Yellow River Delta by 19.95 million m³ annually.
For the environmental water supplement volume in the Yellow River Delta of each year, in Scenario 2, the flow at the Lijin section in 2008 was lower than the threshold value; therefore, the conditions for the environmental water supplement were not met. In 2009, only 1 day’s flow was qualified for the environmental water supplement. The environmental water supplement volume in 2010, 2011, 2013, and 2015 was 34.71%–46.26% of that in Scenario 1. In 2012, the environmental water supplement volume reached 69.42% of that in Scenario 1. It was special in 2014 that in Scenario 2, the environmental water supplement volume in the Yellow River Delta was 25.24 million m³, which was 3.96 million m³ higher than that in Scenario 1. This was because during the WSR period (June 29–July 8), there was a flood under which the measured maximum flow at the Sanmenxia section was 4,020 m³/s. Without the regulation of the Xiaolangdi Reservoir, the maximum flow at the Lijin section would reach 5,080 m³/s, while the minimum bank full discharge of the lower reaches of the Yellow River in 2014 was only 4,250 m³/s, which posed the overbank risk. In Scenario 1, the maximum outflow of the Xiaolangdi Reservoir was 2,630 m³/s, and the maximum flow at the Lijin section was 3,250 m³/s, balancing the downstream flood control and environmental water supplement in the Yellow River Delta.
Discussion
Contribution rate of the Xiaolangdi Reservoir
The values of ecological indicators in different scenarios and different periods are shown in Table 3. Compared with those in 1980–1999, the annual average drying up days at the Lijin section decreased by 43.20 days, the assurance rate of ecological base flow at the Lijin section increased by 15.00%, and the volume of water flowing into the sea from April to June increased by 1.88 billion m³ in 2000–2019. The ecological conditions in the lower Yellow River and the coastal areas had changed to a favorable direction. The contribution rate of the Xiaolangdi Reservoir to the reduction of drying up days at the Lijin section was 187.85%, the contribution rate to the assurance rate of ecological base flow at the Lijin section was 137.24%, and the contribution rate to the increase of water volume flowing into the sea from April to June was 125.83%.
Contribution analysis of water inflow and water withdrawal
The contribution rates of the Xiaolangdi Reservoir to the reduction of drying up days at the Lijin section, the increase of the assurance rate of ecological base flow at the Lijin section, and the increase of water volume flowing into the sea from April to June all exceeded 100%, indicating that the total contribution rate of other factors was negative, that is, the combined impact of other factors was detrimental to the environmental water supply to the Yellow River Delta and coastal areas.
The analyses of water inflow and water withdrawal are shown in Table 4. The natural average annual flow of the Yellow River during 2000–2019 was 5.63 billion m³ less than that during 1980–1999, with a degradation of 10.59%. The measured average annual flow at the Sanmenxia section during 2000–2019 was 6.66 billion m³ less than that during 1980–1999, with a decrease of 22.15%, indicating that the volume of water flowing into the lower Yellow River was greatly reduced. The decrease in water inflow from April to June was more prominent. The measured flow at the Sanmenxia section in the period of April to June during 2000–2019 was 29.70% lower than that during 1980–1999. At the same time, the average annual water withdrawal from the lower Yellow River (downstream of the Sanmenxia section) during 2000–2019 was 0.32 billion m³ higher than that during 1980–1999. The natural flow of the Yellow River, the measured water inflow into the lower Yellow River, and the volume of water withdrawal from the Lower Yellow River all developed in a direction that was detrimental to the Yellow River Delta and coastal areas. However, the measured ecological indicator values showed that the Xiaolangdi Reservoir eliminated the adverse impact of water inflow and water withdrawal and ensured the continuous improvement of ecology in the river, delta, and coastal areas.
Analysis of the impact on Yellow River Delta wetland and coastal organisms
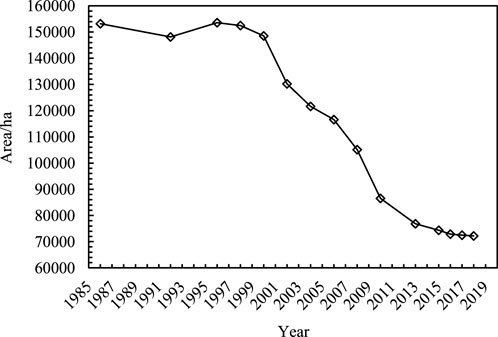
The change process of the natural wetland area in the Yellow River Delta during 1986–2018 is shown in Figure 9. The natural wetland area had continued to decline since the 21st century. To be specific, the natural wetland area had decreased by 29.20% during 2000–2007, with an annual average reduction of 5421.25 ha. There was only a small volume of environmental water supplement during 2008–2009, which did not slow down the shrinking rate of the natural wetland area. During 2010–2013, the shrinking rate of the natural wetland area had dropped to 3225.67 ha/yr; during 2014–2018, the natural wetland area tended to be stable, and the shrinking rate had dropped to 932.00 ha/yr.
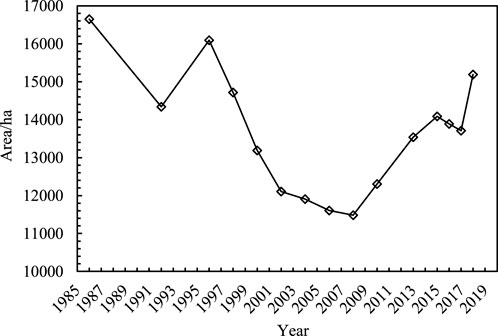
Reed marsh is a representative wetland of the Yellow River Delta, and its area change process is shown in Figure 10. From 1996 to the implementation of the environmental water supplement in the Yellow River Delta, the area of reed marsh in the Yellow River Delta decreased by 28.68%. The reed marsh area showed an increasing trend after 2008, with an average annual increase of 371.40 ha during 2008–2018. In 2018, the reed marsh area had recovered to 91.26% of its area in 1986.
With the implementation of wetland restoration and other wetland protection measures, bird diversity in the Yellow River Delta National Natural Reserve has increased. In 2019, the number of bird species in the natural reserve increased by 85 species compared to that in 1992. The Yellow River Delta wetland is the largest breeding place for Oriental stork in China. The Oriental stork started nesting and breeding in the natural reserve in 2003, and the number has been increasing year by year. In 2020, there were 115 nests and a total of 315 young birds.
During 2015–2019, the Yellow River Institute of Water Protection Research conducted trawl surveys on the nektons at 66 monitoring points in the coastal areas in the Yellow River estuary, and the results showed that the biological diversity and quantity had been increasing continuously. To be specific, in 2015, the average number of species at one monitoring station was 7.89, and the average weight density of catches was 1.10 kg/h, while in 2019, the average number of species at one monitoring station was 14.90, and the average weight density of catches was 3.70 kg/h.
Conclusion
This article proposes a quantitative analysis method for the ecological impact and contribution rate of the reservoir and studies the impact of the Xiaolangdi Reservoir on the Yellow River Delta wetland and coastal areas, and the following conclusions are drawn: 1) the Xiaolangdi Reservoir played an important role in improving the habitat of the organisms in the Yellow River Delta and coastal areas and increasing the number and diversity of organisms. The regulation of this reservoir guaranteed the continuous flow at the Lijin section for 20 years, increased the assurance rate of ecological base flow at the Lijin section by 20.60%, and increased the average annual volume of water flowing into the sea from April to June by 2.37 billion m³ during 2000–2019 and increased the environmental water supplement in the Yellow River Delta by 19.95 million m³ during 2008–2015. 2) The Xiaolangdi Reservoir has reversed the adverse effects of the decrease in the natural flow and the increase in water withdrawal in the past 20 years, ensuring that the flow process changed in the direction that was conducive to the ecological improvement of the Yellow River Delta wetland and the coastal areas. In ensuring the continuous flow at the Lijin section, the increase in ecological base flow at the Lijin section and the increase in water volume flowing into the sea from April to June and the contribution rates of the Xiaolangdi Reservoir all exceeded 100%.
River flow is affected by multiple factors such as climate change, water withdrawal, and reservoir operation. The method proposed in this article can quantify the ecological impact and contribution rate of the reservoir itself, which is of great value for the scientific analysis on and the improvement of ecological effect of reservoir regulation.
Data availability statement
The original contributions presented in the study are included in the article/supplementary material; further inquiries can be directed to the corresponding author.
Author contributions
WS: methodology, formal analysis, resources, writing—original draft, and data curation. DY: conceptualization. SP: visualization and supervision. YW: funding acquisition. LG: writing—review and editing. YS: data curation.
Funding
This article was supported by the National Key R&D Projects of China (2021YFC3200203) and Major Science and Technology Projects in Henan Province (201300311400).
Acknowledgments
The authors greatly appreciate the Yellow River Institute of Water Protection Research for providing remote sensing interpretation data of the Yellow River Delta wetland area from 1986 to 2018 and monitoring data of nekton in coastal waters from 2015 to 2019.
Conflict of interest
Authors WS, DY, SP, and YW were employed by Yellow River Engineering Consulting Company Limited.
The remaining authors declare that the research was conducted in the absence of any commercial or financial relationships that could be construed as a potential conflict of interest.
Publisher’s note
All claims expressed in this article are solely those of the authors and do not necessarily represent those of their affiliated organizations, or those of the publisher, the editors, and the reviewers. Any product that may be evaluated in this article, or claim that may be made by its manufacturer, is not guaranteed or endorsed by the publisher.
References
Adams, L. E., Lund, J. R., Moyle, P. B., Quinones, R. M., Herman, J. D., and O'Rear, T. A. (2017). Environmental Hedging: A Theory and Method for Reconciling Reservoir Operations for Downstream Ecology and Water Supply. Water Resour. Res. 53, 7816–7831. doi:10.1002/2016wr020128
Borchert, M. S., Osland, M. J., Enwright, M., Griffith, , and Nicholas, M. (2018). Coastal Wetland Adaptation to Sea Level Rise: Quantifying Potential for Landward Migration and Coastal Squeeze. J. Appl. Ecol. 55, 2876–2887. doi:10.1111/1365-2664.13169
Changming, Z., Xin, Z., and Qiaohua, H. (2018). Four Decades of Estuarine Wetland Changes in the Yellow River Delta Based on Landsat Observations between 1973 and 2013. Water 10, 933. doi:10.3390/w10070933
Cui, B., Yang, Q., Yang, Z., and Zhang, K. (2009). Evaluating the Ecological Performance of Wetland Restoration in the Yellow River Delta, China. Ecol. Eng. 35, 1090–1103. doi:10.1016/j.ecoleng.2009.03.022
Day, J. W., Agboola, J., Chen, Z., ’Elia, C. D., Forbes, D. L., Giosan, L., et al. (2016). Approaches to Defining Deltaic Sustainability in the 21st Century. Estuar. Coast. Shelf Sci. 183, 275–291. doi:10.1016/j.ecss.2016.06.018
Duarte, R., Pinheiro, A., and Schleiss, A. J. (2016). A Technical Review of Hydro-Project Development in China. Engineering 2, 302–312. doi:10.1016/j.eng.2016.03.008
Gabler, C. A., Osland, M. J., Grace, J. B., Stagg, C. L., Da, Y. R. H., Hartley, S. B., et al. (2017). Macroclimatic Change Expected to Transform Coastal Wetland Ecosystems This Century. Nat. Clim. Chang. 7, 142–147. doi:10.1038/nclimate3203
Grill, G., Lehner, B., Thieme, M., Geenen, B., Tickner, D., Antonelli, F., et al. (2019). Mapping the World's Free-Flowing Rivers. Nature 569, 215–221. doi:10.1038/s41586-019-1111-9
Hua, Y., and Cui, B. (2017). Environmental Flows and its Satisfaction Degree Forecasting in the Yellow River. Ecol. Indic. 92, 207–220. doi:10.1016/j.ecolind.2017.02.017
Kong, D., Miao, C., Borthwick, A., Duan, Q., Liu, H., Sun, Q., et al. (2015). Evolution of the Yellow River Delta and its Relationship with Runoff and Sediment Load from 1983 to 2011. J. Hydrol. X. 520, 157–167. doi:10.1016/j.jhydrol.2014.09.038
Leroy, P. N., and Olden, J. D. (2018). Can Dams Be Designed for Sustainability? Science 358, 1252–1253. doi:10.1126/science.aaq1422
Li, X., Bellerby, R., Craft, C., and Widney, S. E. (2018). Coastal Wetland Loss, Consequences, and Challenges for Restoration. Anthr. Coasts 1, 1–15. doi:10.1139/anc-2017-0001
Lin, Q., and Yu, S. (2018). Losses of Natural Coastal Wetlands by Land Conversion and Ecological Degradation in the Urbanizing Chinese Coast. Sci. Rep-Uk 8, 15046. doi:10.1038/s41598-018-33406-x
Liu, C., and Zhang, S. (2002). Drying up of the Yellow River: its Impacts and Counter-measures. Mitig. Adapt Strat. Gl. 7, 203–214.
Liu, Z., Fagherazzi, S., and Cui, B. (2021). Success of Coastal Wetlands Restoration Is Driven by Sediment Availability. Commun. Earth Environ. 2 (44). doi:10.1038/s43247-021-00117-7
Lu, Q., Bai, J., Yan, D., Cui, B., and Wu, J. (2020). Sulfur Forms in Wetland Soils with Different Flooding Periods before and after Flow-Sediment Regulation in the Yellow River Delta, China. J. Clean. Prod. 276, 122969. doi:10.1016/j.jclepro.2020.122969
Ma, Z., Zhang, M., Xiao, R., Cui, Y., and Yu, F. (2017). Changes in Soil Microbial Biomass and Community Composition in Coastal Wetlands Affected by Restoration Projects in a Chinese Delta. Geoderma 289, 124–134. doi:10.1016/j.geoderma.2016.11.037
Manuel, M., Sara, B. G., and Alejandro, E. T. (2018). Policies in Coastal Wetlands: Key Challenges. Environ. Sci. Policy 88, 72–82. doi:10.1016/j.envsci.2018.06.016
Mehvar, S., Filatova, T., Sarker, M., Dastgheib, A., and Ranasinghe, R. (2019). Climate Change-Driven Losses in Ecosystem Services of Coastal Wetlands: A Case Study in the West Coast of Bangladesh. Ocean. Coast. Manag. 169, 273–283. doi:10.1016/j.ocecoaman.2018.12.009
Narayan, S., Beck, M. W., Wilson, P., Thomas, C. J., Guerrero, A., Shepard, C. C., et al. (2017). The Value of Coastal Wetlands for Flood Damage Reduction in the Northeastern USA. Sci. Rep. 7, 9463. doi:10.1038/s41598-017-09269-z
Osland, M. J., Gabler, C. A., Grace, J. B., Day, R. H., Hartley, S. B., McLeod, J. L., et al. (2018). Climate and Plant Controls on Soil Organic Matter in Coastal Wetlands. Glob. Chang. Biol. 24, 5361–5379. doi:10.1111/gcb.14376
Pascual-Aguilar, J., Andreu, V., Gimeno-Garcia, E., and Pico, Y. (2015). Current Anthropogenic Pressures on Agro-Ecological Protected Coastal Wetlands. Sci. Total Environ. 503-504, 190–199. doi:10.1016/j.scitotenv.2014.07.007
Poff, N., L., and Schmidt, J., C. (2016). How Dams Can Go with the Flow. Science 353, 1099–1100. doi:10.1126/science.aah4926
Qiu, H., Chen, L., Zhou, J., He, Z., and Zhang, H. (2020). Risk Analysis of Water Supply-Hydropower Generation-Environment Nexus in the Cascade Reservoir Operation. J. Clean. Prod. 283, 124239. doi:10.1016/j.jclepro.2020.124239
Renzi, J. J., He, Q., and Silliman, B. R. (2019). Harnessing Positive Species Interactions to Enhance Coastal Wetland Restoration. Front. Ecol. Evol. 7, 131. doi:10.3389/fevo.2019.00131
Rodríguez, J., Saco, P. M., Sandi, S., Saintilan, N., and Riccardi, G. (2017). Potential Increase in Coastal Wetland Vulnerability to Sea-Level Rise Suggested by Considering Hydrodynamic Attenuation Effects. Nat. Commun. 8, 16094. doi:10.1038/ncomms16094
Stagg, C. L., Krauss, K. W., Cahoon, D. R., Cormier, N., Conner, W. H., and Swarzenski, C. M. (2016). Processes Contributing to Resilience of Coastal Wetlands to Sea-Level Rise. Ecosystems 19, 1445–1459. doi:10.1007/s10021-016-0015-x
Sun, Z., Sun, W., Tong, C., Zeng, C., Yu, X., and Mou, X. (2015). China's Coastal Wetlands: Conservation History, Implementation Efforts, Existing Issues and Strategies for Future Improvement. Environ. Int. 79, 25–41. doi:10.1016/j.envint.2015.02.017
Wang, C., Li, X., Yu, H., and Wang, Y. (2019). Tracing the Spatial Variation and Value Change of Ecosystem Services in Yellow River Delta, China. Ecol. Indic. 96, 270–277. doi:10.1016/j.ecolind.2018.09.015
Wang, C., Wang, G., Dai, L., Liu, H., Zhao, Y., Zhou, Y., et al. (2020). Diverse Usage of Waterbird Habitats and Spatial Management in Yancheng Coastal Wetlands. Ecol. Indic. 117, 106583. doi:10.1016/j.ecolind.2020.106583
Wang, Y., Geng, Y., Wang, R., and Zhang, J. (2016). Measuring Regional Sustainability with an Integrated Social-Economic-Natural Approach: a Case Study of the Yellow River Delta Region of China. J. Clean. Prod. 114, 189–198. doi:10.1016/j.jclepro.2015.05.121
Xu, B., Yang, D., Burnett, W. C., Ran, X., Yu, Z., Gao, M., et al. (2016). Artificial Water Sediment Regulation Scheme Influences Morphology, Hydrodynamics and Nutrient Behavior in the Yellow River Estuary. J. Hydrol. X. 539, 102–112. doi:10.1016/j.jhydrol.2016.05.024
Yang, M., Lu, K., Batzer, D. P., and Wu, H. (2019). Freshwater Release into Estuarine Wetlands Changes the Structure of Benthic Invertebrate Assemblages: A Case Study from the Yellow River Delta. Sci. Total Environ. 687, 752–758. doi:10.1016/j.scitotenv.2019.06.154
Yin, Y., Tang, Q., Liu, X., and Zhang, X. (2017). Water Scarcity under Various Socio-Economic Pathways and its Potential Effects on Food Production in the Yellow River Basin. Hydrol. Earth Syst. Sci. 21, 791–804. doi:10.5194/hess-21-791-2017
Yu, Z. A., Wang, A., Ge, S. B., and Jsk, C. (2019). Coastal Wetland Resilience to Climate Variability: A Hydrologic Perspective - ScienceDirect. J. Hydrol. 568, 275–284.
Zhang, X., Wang, L., Fu, X., Li, H., and Xu, C. (2017). Ecological Vulnerability Assessment Based on PSSR in Yellow River Delta. J. Clean. Prod. 167, 1106–1111. doi:10.1016/j.jclepro.2017.04.106
Zhao, Q., Bai, J., Zhang, G., Jia, W., Wei, X. I. N., and Wang, X. (2018). Effects of Water and Salinity Regulation Measures on Soil Carbon Sequestration in Coastal Wetlands of the Yellow River Delta. Geoderma 319, 219–229. doi:10.1016/j.geoderma.2017.10.058
Keywords: deltaic coastal wetland, reservoir regulation, contribution rate, ecological base flow, environmental water supplement, Yellow River, Xiaolangdi Reservoir
Citation: Shang W, Yan D, Peng S, Wang Y, Ge L and Shang Y (2022) Analysis on the ecological impact of the Xiaolangdi Reservoir on the Yellow River Delta wetland and coastal areas. Front. Earth Sci. 10:953318. doi: 10.3389/feart.2022.953318
Received: 26 May 2022; Accepted: 13 July 2022;
Published: 06 September 2022.
Edited by:
Celso Santos, Federal University of Paraíba, BrazilReviewed by:
Xueyan Jiang, Ocean University of China, ChinaBai Tao, Xi’an University of Technology, China
Copyright © 2022 Shang, Yan, Peng, Wang, Ge and Shang. This is an open-access article distributed under the terms of the Creative Commons Attribution License (CC BY). The use, distribution or reproduction in other forums is permitted, provided the original author(s) and the copyright owner(s) are credited and that the original publication in this journal is cited, in accordance with accepted academic practice. No use, distribution or reproduction is permitted which does not comply with these terms.
*Correspondence: Dengming Yan, MTg1MTk1MDA3OTVAMTYzLmNvbQ==
 Wenxiu Shang
 Dengming Yan
 Shaoming Peng
 Yu Wang1,2
 Lei Ge