- 1State Key Laboratory of Oil and Gas Reservoir Geology and Exploitation, Southwest Petroleum University, Chengdu, China
- 2Natural Gas Geology Key Laboratory of Sichuan Province, Southwest Petroleum University, Chengdu, China
- 3School of Geoscience and Technology, Southwest Petroleum University, Chengdu, China
- 4Research Institute of Experiment and Testing, Xinjiang Oilfield Company, PetroChina, Karamay, China
In recent years, significant advances have been made in the exploration of Carboniferous volcanic reservoirs in the Hongche Fault Zone of the Junggar Basin of China, showing good prospects for further exploration. However, the large variation in the physical properties of crude oil and the complex distribution rule inhibit the one-step exploration. In this study, the PM scale of the biodegradation of crude oil and source of crude oil were studied using experimental methods that target the properties, bulk properties and biomarker compounds of crude oil. The exploration potential of crude oil in this area was analysed, and an accumulation model of crude oil was established. Based on the differences in biomarker compounds and the degree of biodegradation, crude oils were divided into four groups and seven subgroups. Additionally, the analysis of the biomarker compounds of crude oil combined with the hydrocarbon-generation history of source rocks showed that there were at least two periods of oil charging in this area. The first period was the late Triassic, with crude oil derived from the P1f source rock. Owing to the strong tectonic activity during the late Indosinian movement, the oil reservoirs were distributed in the footwall of the fault zone, and the oil in the reservoir exhibited different degrees of biodegradation, forming crude oils of subgroup I1, II and III1. The second period was Cretaceous, during which the P1f source rock was in the natural gas generation stage, and the P2w source rock was at a mature stage. A small part of the crude oil formed by the P2w source rock migrated to the Carboniferous reservoirs and mixed with the crude oil formed by the earlier P1f source rock, resulting in crude oils of subgroups I2, III2, and IV2. The crude oil in the studied area originated from the source rocks in the sag during the peak of oil generation. As tectonic activity approached stability in the latter period, it is speculated that there may be well-preserved primary oil and gas reservoirs in the footwall and slope areas of the fault, making these potential exploration sites.
1 Introduction
Owing to the increasing global population and energy demand, the exploration and development fields of oil and natural gas are expanding. As new areas of exploration, volcanic reservoirs have attracted the attention of many researchers in the petroleum industry (He et al., 2010; Zou et al., 2011; Shi et al., 2019). Volcanic reservoirs have been explored for more than a century, and discovered in more than 300 basins worldwide. Industrial oil and gas flows and large-scale reserves were formed from volcanic rocks in 40 basins in 13 countries (Zou et al., 2008; Zhao et al., 2009; Tang et al., 2020; Zhang et al., 2021; Ye et al., 2022). In recent years, volcanic reservoirs containing large-scale oil and gas reserves have also been discovered in volcanic rock formations in many sedimentary basins in China, proving that volcanic rock reservoirs have good hydrocarbon potential (Feng 2008; Zou et al., 2008; Feng et al., 2014; Chang et al., 2019; Ye et al., 2022).
Since the Karamay volcanic reservoir was first discovered on the north-west side of the Junggar Basin in the 1950s, Baikouquan, Chepai, Hongshanzui and other volcanic reservoirs have also been discovered on the north-west side of the Junggar Basin. However, several volcanic reservoirs have also been discovered in the Hongche Fault Zone, and these are distributed along the fault zone (Cao et al., 2010; Chang et al., 2019; Zhu et al., 2020).
Previous research on Carboniferous volcanic rocks in the Junggar Basin has mainly focused on the lithology, spatial types, and influencing factors of volcanic reservoirs (Ma et al., 2019; Wang and Zhang, 2019; Yang et al., 2019; Zhu et al., 2020). However, there are few reports on the genetic types and origins of oil and gas with complex distributions in Carboniferous volcanic rock reservoirs. Many large oil and gas reservoirs have been discovered on the north-west side of Junggar Basin, and they were likely distributed during hydrocarbon-generation depression. The source rocks of the Permian Fengcheng Formation (P1f), Permian Lower Wuerhe Formation (P2w), and Permian Jiamuhe Formation (P1j) are the main source rocks in this area (Chen et al., 2016a; Jiang et al., 2020; Shi et al., 2020; Pan et al., 2021). Chen et al. (2016b) pointed out that Carboniferous crude oil in the Kebai Fault Zone is mainly derived from the P1f source rock, with some also originating from the P2w source rock. They also pointed out that the Carboniferous, middle Triassic, late Triassic to Early Jurassic, and middle to late Jurassic were the four main stages of crude oil charging.
Existing research on the Carboniferous volcanic rocks in the Hongche Fault Zone mainly focued on volcanic reservoirs, and there are relatively few studies on the geochemical characteristics, origins, and the accumulation models of crude oil, which greatly restrict future exploration and deployment (Xiao et al., 2010; Chen et al., 2016a; Mao et al., 2021). Therefore, in this study, we clarify the origins and accumulation models of crude oil in Carboniferous volcanic reservoirs of Hongche Fault Zone. This study aimed at providing new data for the law of crude oil enrichment in volcanic oil reservoirs, promote future exploration of volcanic reservoirs, and provide more references for domestic and foreign research.
2 Geological setting
The Junggar Basin is a large superposition basin in north-western China, with a total area of approximately 1.3 × 10⁵ km2 (Cao et al., 2010; Gong et al., 2019; Shi et al., 2020; Li et al., 2022) (Figure 1A). The Hongche Fault Zone is on the west side of the Junggar Basin at the intersection of the western uplift and central depression of the Junggar Basin. It is composed of a series of thrust faults with a near-south-north strike. Additionally, the Hongche Fault Zone is adjacent to the two major hydrocarbon-generation depressions, namely, Shawan Sag and Sikeshu Sag, and is an important oil and gas accumulation areas in the northwestern Junggar Basin (Figure 1B). So far, the previously discovered oil and gas reservoirs are mainly distributed along the fault zone, indicating that the migration and accumulation of these oil and gas reservoirs are closely related to fault activity (Figure 1C).
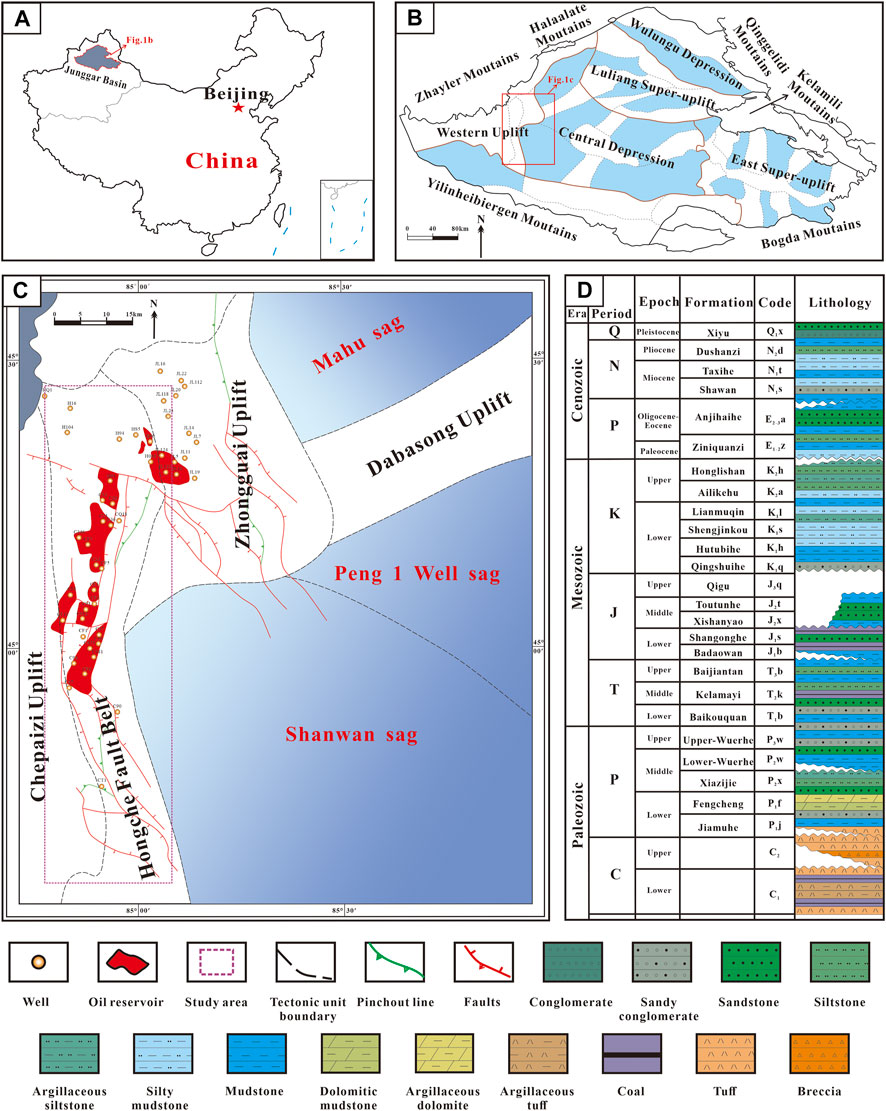
FIGURE 1. The location of the study area and the comprehensive stratigraphic column. (A) The location of the Junggar Basin in China; (B) The location of the study area in the Junggar Basin; (C) The location of wells and reservoirs in the study area; (D) Comprehensive stratigraphic column of Shawan Sag.
The Hongche Fault Zone was formed in the early stage of the late Hercynian movement, and is an inherited uplift that developed on the Carboniferous volcanic rock base (Xiao et al., 2014). The Hongche Fault Zone has undergone three stages of tectonic evolution: The middle of late Hercynian movement (P2), the late IndoChinese movement (T3) and the middle and late Yanshanian movement (J2-E) (Cao et al., 2010; Liang et al., 2018). Moreover, the Hongche fault zone received three phases of oil and gas charging: late Triassic to early Jurassic, early Cretaceous, and late Palaeogene to early Neogene (Li et al., 2013). The multi-cycle tectonic events in this area caused multiple periods of oil and gas charging, which provided a favourable space for oil and gas accumulation.
The Hongche fault zone lacks Permian, Triassic, and part of the Jurassic strata. The overlying strata directly cover the Carboniferous strata, forming a favourable reservoir-cap combination for Carboniferous volcanic reservoirs (Figure 1D). The Shawan Sag is an important hydrocarbon-generation depression in this area, among which the P1j, P1f, and P2w are important source rocks. P1f was formed in a reducing environment with high salinity and mainly composes of dark dolomitic and tuffaceous mudstone. P2w is dominated by fine-grained sediments from shallow-to-deep lacustrine facies in a weakly reducing freshwater depositional environment, composed of conglomerate, argillaceous siltstone and mudstone. P1j was formed during the period of volcanic activity. The source rocks are lacustrine dark grey and tuffaceous mudstone. The source rocks in the deep part of the depression have a high degree of thermal evolution and severe organic carbonisation (Chen et al., 2017; Pan et al., 2021).
3 Experimental
3.1 Samples
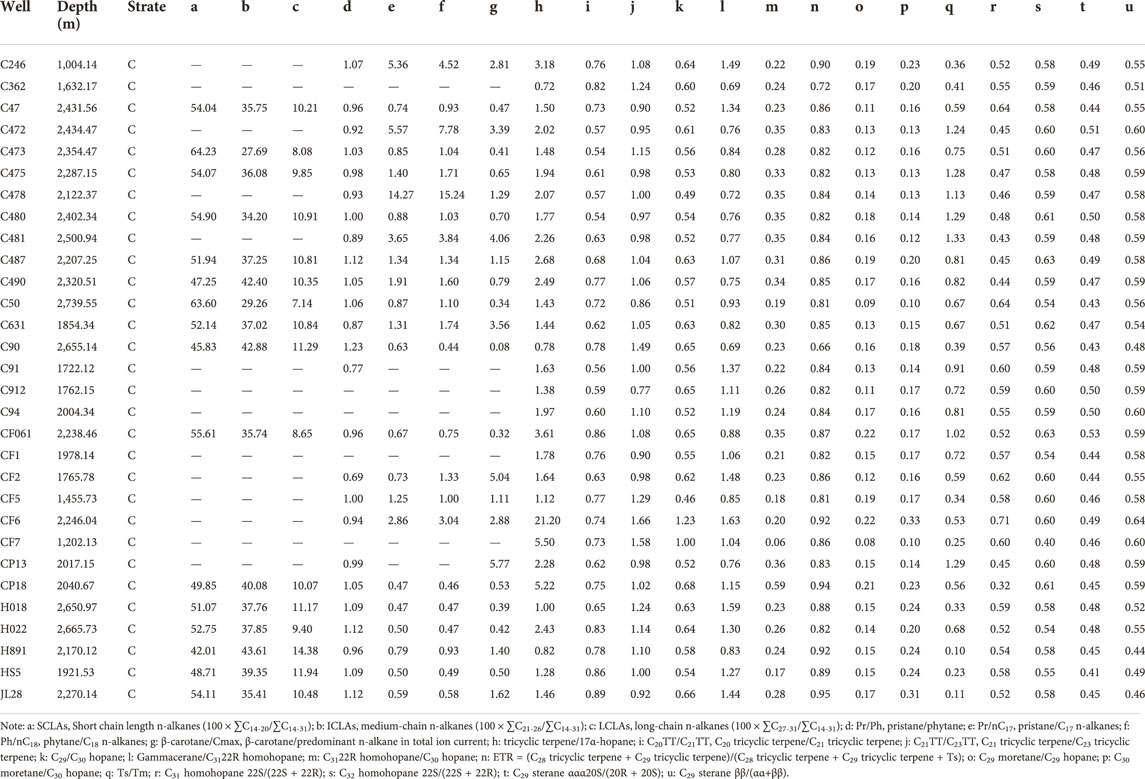
Thirty-nine source rock and thirty crude oil samples were collected. The source rock samples were from P1j, P1f, and P2w in the hydrocarbon-generation depression of the western Junggar Basin (Table 1). The crude oil samples were from the Carboniferous strata in the Hongche Fault Zone (Figure 1; Tables 2, 3). Sample preparation and analysis were carried out at PetroChina Xinjiang Oilfield Testing Institute and State Key Laboratory of Southwest Petroleum University. All rock samples were pulverised to 200 mesh and 60–80 mesh, respectively, to prepare the following series of organic geochemical experiments, namely, rock pyrolysis, total organic carbon (TOC) content, kerogen separation, and soluble organic matter extraction.
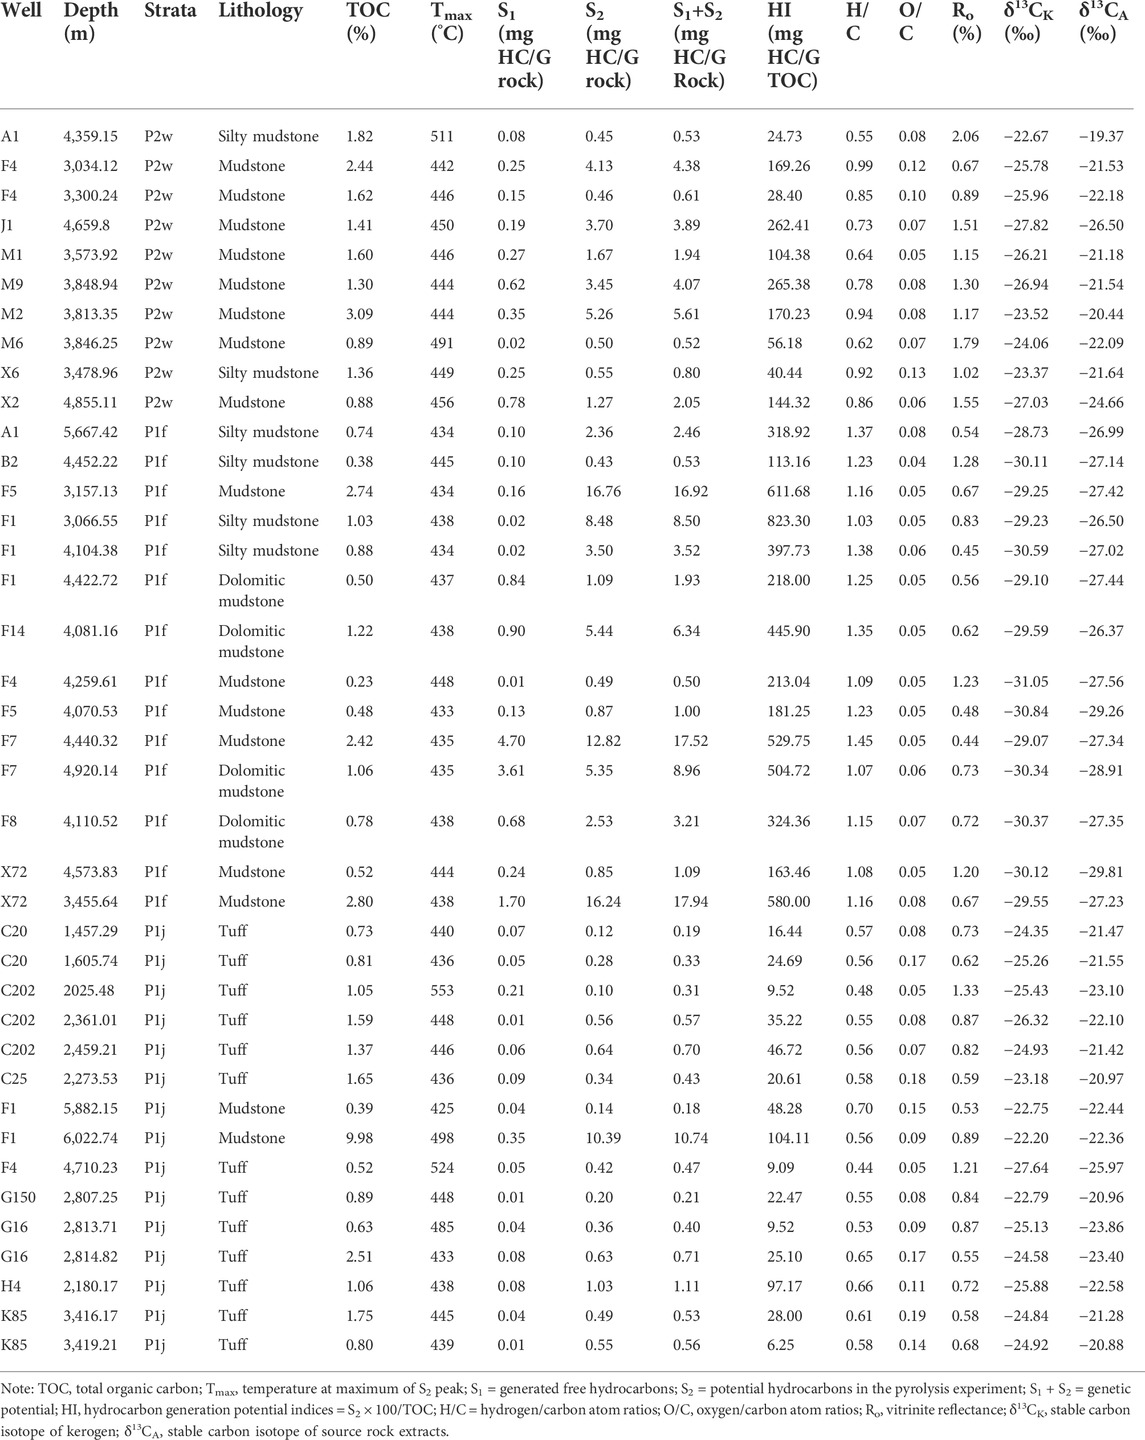
TABLE 1. Total organic content, Rock-Eval pyrolysis, vitrinite reflectance, kerogen element and carbon isotopic data from P2w, P1f, and P1j source rock samples in the western Junggar Basin.
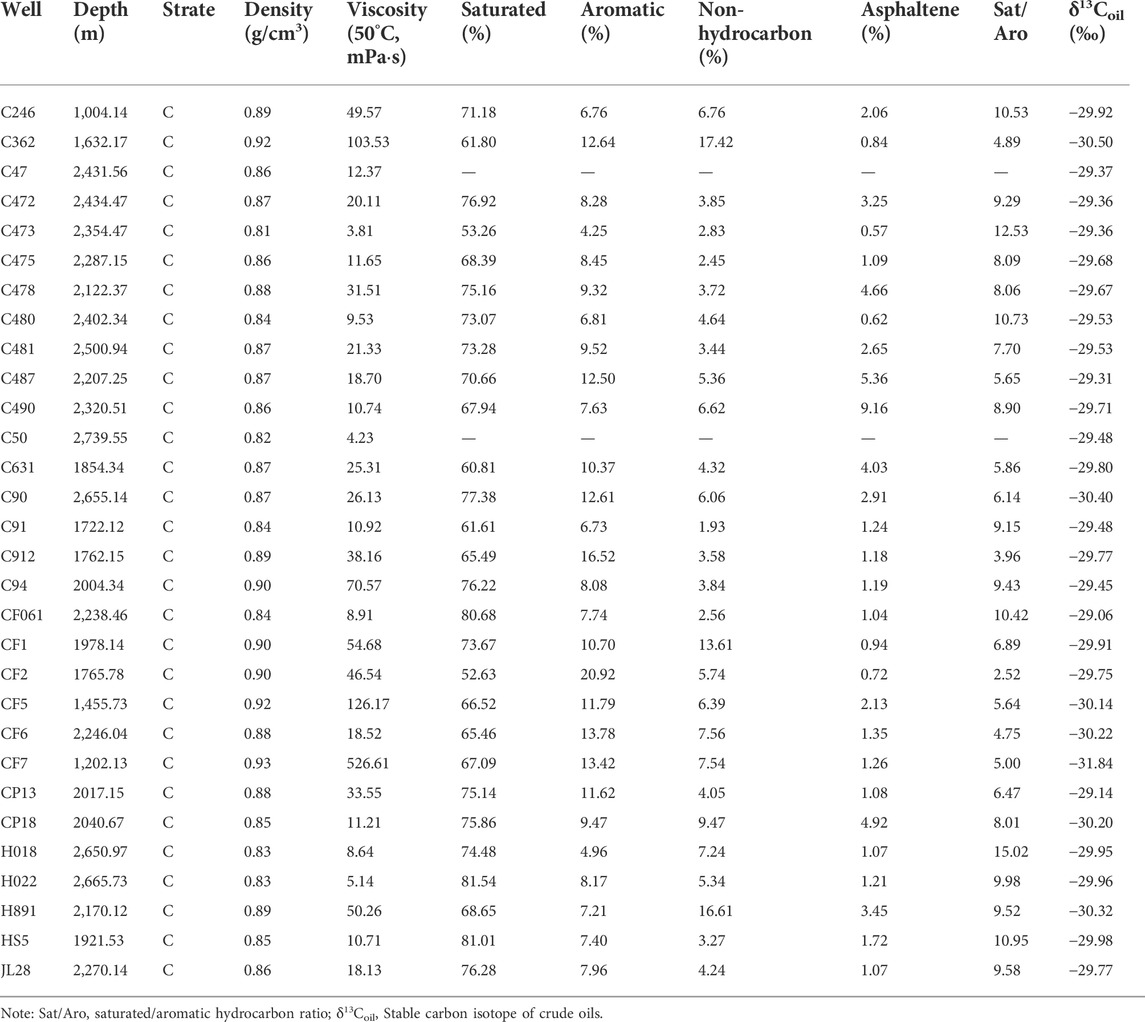
TABLE 2. Bulk physical properties, bulk compositions and stable carbon isotopes from the analyzed Carboniferous crude oil samples in the Hongche fault zone.
3.2 Methods
3.2.1 Rock pyrolysis and total organic carbon
Small amount of the 200-mesh powder samples were used for rock pyrolysis and TOC analyses using the Rock-Eval VI and LECO C230 instruments, respectively, to obtain S1, S2, Tmax, and TOC data. Before TOC content analysis, the powder samples were washed with hydrochloric acid to remove carbonate rocks, neutralised with deionised water, and dried to a constant weight at 60°C. The mass losses of the powder samples were recorded. Finally, the TOC content analysis was performed in an LECO C230 instrument.
3.2.2 Preparation and separation of kerogen
Sixty grams of 200-mesh (80 μm) powder samples were measured, and the carbonate and silicate rocks in the powder samples were sequentially removed first using hydrochloric acid followed by hydrofluoric acid. Thereafter, the samples were washed with distilled water to reach near-neutrality. Hydrochloric acid (6 mol/L) and arsenic-free zinc particles (Zn) were added to the samples to remove pyrite, and then washed with deionised water until neutral. Kerogen was separated via heavy-liquid ultrasonic centrifugation, and the kerogen sample was washed with deionised water to reach a chloride-free state. Finally, it was dried in an oven at 80°C for 8 h to obtain a concentrated kerogen sample.
3.2.3 Element and stable carbon isotope and vitrinite reflectance of kerogen analysis
The presence of C, H, O, N, and S in the kerogen samples was determined using a Var10 EL-Ⅲ elemental analyser based on the principle of high-temperature combustion. Under high-temperature and aerobic conditions, organic matter can be combusted, and the organic elements previously in it are converted into corresponding stable gaseous compounds, such as CO2, H2O, N2, and SO2. For a known mass of sample, the content of each element in the sample can be obtained by measuring the content of gaseous products generated after complete sample combustion. The stable carbon isotope of kerogen (‰ Pee Dee Belemnite, PDB) was determined by Isoprime100 isotope mass spectrometer with an analytical accuracy of ±0.02‰. The prepared kerogen samples were fixed on a glass slide with epoxy resin, prepared into optically thin slices, and vitrinite reflectance (Ro) analysis was performed using a QDI302 microspectrophotometer equipped with a Leica DM4500P polarising microscope.
3.2.4 Group composition separation experiment, physical property and stable carbon isotope of crude oil analysis
Group composition separation experiments as well as the analyses of the physical properties and stable carbon isotopes of crude oil were conducted at the PetroChina Xinjiang Oilfield Testing Institute. The asphaltene fraction was precipitated using n-hexane. The deasphalted products were separated into saturated hydrocarbons, aromatic hydrocarbons and non-hydrocarbons via chromatography in an alumina:silica (2:1 v/v) column. The fractions were eluted with n-hexane, dichloromethane:n-hexane (2:1 v/v), and chloroform. The density of the crude oil was determined using a DMA4500M digital densitometer, and the viscosity of the crude oil was determined using an MCR101 rheometer. A Thermo Fisher Flash 2000 EA-MAT253 IRMS instrument was used for the stable carbon isotope analysis of crude oil based on the international PDB standard (‰ Pee Dee Belemnite) with an analytical accuracy of ±0.02‰.
3.2.5 Gas chromatography-mass spectrometry
Crushed rock samples were selected for Soxhlet extraction using chloroform for 72 h. The asphaltenes in the rock extracts were precipitated using n-hexane. The deasphalted products were separated into saturated and aromatic hydrocarbons via chromatography and eluted with n-hexane and dichloromethane. GC-MS analysis of saturated hydrocarbons in crude oil and rock samples was performed using an Agilent 7890-7000A gas chromatography tandem mass spectrometer equipped with an HP-5MS capillary column (30 m × 0.25 mm × 0.25 μm). The initial GC oven temperature was set at 50°C for 1 min, then increased from 50 to 120°C at 20°C/min, increased from 120 to 310°C at 3°C/min, and finally maintained at 310°C for 20 min. The mass spectrometer was operated in full-scan mode. Helium was used as the carrier gas at a flow rate of 1 ml/min. The ionisation energy was 70 eV and the scanning range was 50–600 Da. The total ion chromatograms (TIC), m/z 177, m/z 191, and m/z 217 were used to analyse n-alkanes, terpanes, steranes, and 25-norhopanes. The relative abundance of each biomarker was calculated based on the peak area.
4 Results
4.1 Source rock evaluation
The TOC and genetic potential (S1+S2) are important parameters for evaluating the quality of source rocks (Tissot and Welte, 1984). The TOC contents of the samples of P2w, P1f, and P1j are in the ranges of 0.88–3.09 wt% (1.79 wt% on average), 0.13 to 2.80 wt% (1.02 wt% on average) and 0.15 to 9.98 wt% (1.47 wt% on average), respectively (Table 1). Most samples have TOC contents that are greater than 0.5 wt%, which are effective source rocks. The genetic potentials (S1+S2) of the samples of P2w, P1f, and P1j are in the range of 0.52–10.57 mg HC/g TOC (3.14 mg HC/g TOC on average), 0.44–17.94 mg HC/g TOC (5.74 mg HC/g TOC on average) and 0.18–10.74 mg HC/g TOC (1.03 mg HC/g TOC on average), respectively (Table 1). The plot of genetic potential (S1+S2) versus TOC shows that the P2w and P1f source rocks have good hydrocarbon-generation potential, whereas the P1j source rocks have poor hydrocarbon-generation potential (Figure 2).
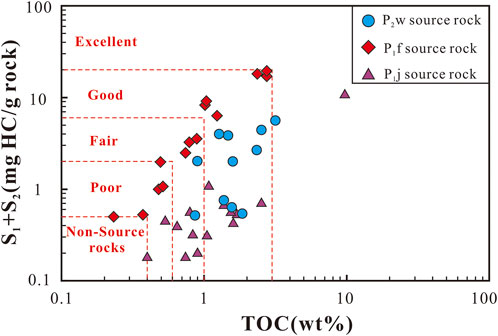
FIGURE 2. Plot of the genetic potential (S1+S2) versus TOC from P2w, P1f, and P1j source rock samples.
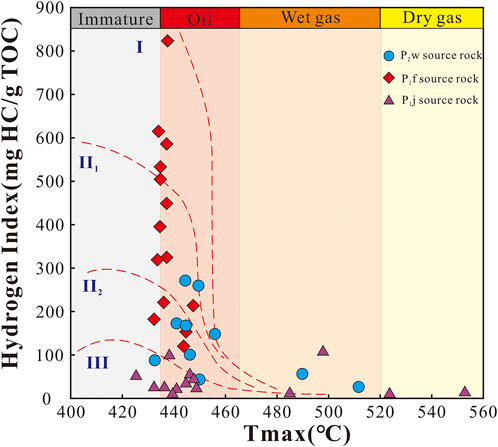
The hydrogen index (HI) of the samples of P2w, P1f, and P1j are in the ranges of 24.72–374.54 mg HC/g TOC (144.38 mg HC/g TOC on average), 113.16–823.30 mg HC/g TOC (369.15 mg HC/g TOC on average) and 3.70–104.11 mg HC/g TOC (32.42 mg HC/g TOC on average), respectively (Table 1). The relationship between HI and Tmax in rock pyrolysis provide vital information on the type of organic matter present in the source rock (Van Krevelen 1961; Hunt 1996; Hadad et al., 2021). From plot of Tmax versus HI (Figure 3), shows that the P2w source rock belongs to types II2 and III kerogen, the P1f source rock belongs to types I and II1 kerogen, and the P1j source rock belongs to type III kerogen.
As summarised shown in Table 1, the H/C atomic ratios of P2w, P1f, and P1j source rocks are in the ranges of 0.55–1.03 (0.80 on average), 1.03 to 1.45 (1.21 on average), and 0.44 to 0.76 (0.59 on average), respectively, whereas the O/C atomic ratios of P2w, P1f, and P1j source rocks are in the ranges of 0.05–0.15 (0.09 on average), 0.04 to 0.08 (0.06 on average) and 0.05 to 0.19 (0.12 on average), respectively. As depicted in Figure 4, the P2w source rock (Ro < 1.3%) belongs to types II2 and III kerogen, the P1f source rock belongs to types I and II1 kerogen, and P1j source rock (Ro < 1.3%) belongs to type III kerogen. The analysis results of kerogen elements and pyrolysis parameters are consistent.
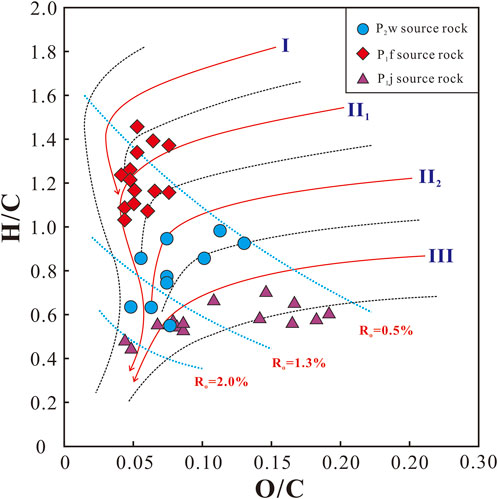
FIGURE 4. Plot of O/C atomic ratio versus H/C atomic ratio from P2w, P1f, and P1j source rock samples. The base map modified from Van Krevelen (1961).
The vitrinite reflectance (Ro) and temperature at the maximum of S2 peak (Tmax) are two important indicators of the maturity of source rocks (Tissot and Welte, 1984; Mashhadi and Rabbani, 2015). Additionally, in the process of hydrocarbon generation, the atomic ratios of H/C and O/C of kerogen will decrease witha continuous increase in maturity (Tissot and Welte, 1984; Baskin 1997; Craddock et al., 2020; Hou et al., 2020). As shown in Table 1, the Tmax and Ro of P2w source rock are in the ranges of 433–511°C (455°C on average) and 0.57%–2.06% (1.27% on average), respectively. The Tmax and Ro of P1f source rock are in the ranges of 433–448°C (438°C on average) and 0.44%–1.28% (0.76% on average), respectively. The Tmax and Ro of P1j source rock are in the ranges of 401–553°C (456°C on average) and 0.52%–1.33% (0.77% on average), respectively. Evidently, the P2w, P1f, and P1j source rocks reached the mature stage and were in the peak period of oil generation (Figures 3, 4).
4.2 Bulk properties of crude oils
Biodegradation is one of the most common secondary alterations in reservoirs, and is the main process for the formation of heavy oils worldwide. During the biodegradation of crude oil, a large amount of hydrocarbons are consumed by micro-organisms, resulting in an increase in the content of polar components (NSO compounds and asphaltenes), a decrease in the content of saturated and aromatic hydrocarbons, and an increase in the density and viscosity of the crude oil (Tissot and Welte 1984; Peters and Moldowan 1993; Niu et al., 2018). Changes in the physical properties and composition caused by this secondary effect are common in the Carboniferous strata of the study area (Table 2; Figures 5, 6). The density and viscosity of the Carboniferous crude oil in the Hongche Fault Zone at 50°C are in the ranges of 0.81–0.93 g/cm3 (0.87 g/cm3 on average) and 3.81–526.61 mPa s (51.77 mPa s on average), respectively (Table 2; Figure 5). The contents of saturated, aromatic, non-hydrocarbons, and asphaltenes in the Carboniferous crude oil samples from the Hongche Fault Zone are in the ranges of 47.86%–92.86%, 2.47%–20.92%, 1.93%–17.42%, and 0.57%–9.16%, respectively (Table 2). The study area experienced multiple periods of tectonic activity and three major oil charging periods, leading to the development of faults. Moreover, the distribution of the formed oil reservoirs is related to the period of fault activity, the crude oil has suffered different degrees of biodegradation, and the physical properties and composition of the Carboniferous crude oil in the study area have a wide distribution range. The saturated/aromatic hydrocarbon ratio of carboniferous crude oil exhibits a strong negative correlation with the density of crude oil (Figure 6), which is consistent with the impact of biodegradation on the physical properties of crude oil.
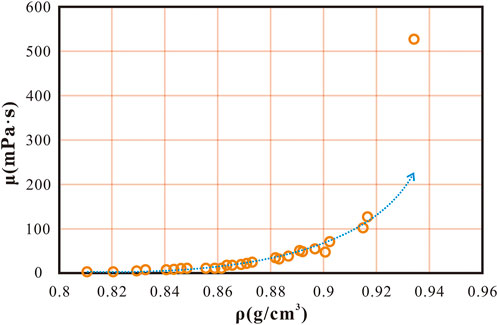
FIGURE 5. Plot of density (ρ) versus viscosity (50°C, μ) from the studied Carboniferous crude oil samples in the Hongche fault zone.
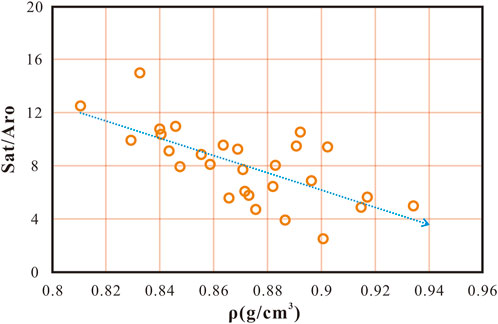
FIGURE 6. Plot of density (ρ) versus saturated/aromatic hydrocarbon ratios (Sat/Aro) from the studied Carboniferous crude oil samples in the Hongche fault zone.
4.3 Stable carbon isotope composition of crude oils
Previous studies have shown that the stable carbon isotope values of crude oil are strongly resistant to biodegradation and thermal degradation. Therefore, stable carbon isotopes are often used to classify crude oil and identify the depositional environment of source rocks (Chung et al., 1992; Pallasser 2000; Marcano et al., 2013; Han et al., 2019). Generally, source rocks with organic matter derived from higher plants have heavier stable carbon isotopes of kerogen, generally greater than −28‰. However, source rocks with organic matter derived from bacteria, algae and other lower organisms have lighter stable carbon isotopes of kerogen, generally less than −28‰ (Tissot and Welte 1984; Gong et al., 2018). The difference in the stable carbon isotopes of crude oil is less than 2‰–3‰, which can be regarded as the same source. Generally, if the stable carbon isotope value of crude oil is 0‰–1.5‰ lighter than that of kerogen, it means that crude oil has a genetic relationship with the source rock (Chung et al., 1981; Chung et al., 1992). The stable carbon isotope values of the Carboniferous crude oil in the study area range from -31.84‰ to −29.06‰ (−29.78‰ on average), and the difference between the maximum and minimum values (δ13Coil max-δ13Coil min) is 2.78‰. Therefore, the Carboniferous crude oil in the study area can be regarded as coming from the same set of source rocks.
4.4 Biomarker characteristics as indicators for organic matter input and depositional conditions
4.4.1 Normal alkanes and isoprenoids
Normal alkanes are ubiquitous in crude oil and source rock extracts. They are often used to determine the source and maturity of organic matter as well as the degree of biodegradation of crude oil (Peters and Moldowan 1993; Chen et al., 2019; Samad et al., 2020; Hadad et al., 2021; Su et al., 2021). In the gas chromatograms of crude oil samples that have experienced severe biodegradation, there are often no peaks for n-alkanes, because these compounds are the first compounds consumed first during biodegradation (Peters and Moldowan 1993). Among them, short-chain n-alkanes (SCLAs: C14-C20) are consumed earlier than medium-chain n-alkanes (ICLAs: C21-C26) and long-chain n-alkanes (LCLAs: C27-C31) (Peters and Moldowan 1993; Peters et al., 2005). As shown in Figure 7, some samples of Carboniferous crude oil form the Hongche Fault Zone consume n-alkanes, there are obvious unseparated complex compounds (UCM), and some samples have a relatively complete distribution of n-alkanes and isoprenoids. Some crude oil samples in the study area underwent different degrees of biodegradation, resulting in the absence of n-alkane peaks. The contents of short, medium, and long-chain n-alkanes of crude oil samples are in the ranges of 42.00%–64.23%, 27.69%–43.61% and 7.14%–14.38%, respectively. Additionally, Pr/nC17 and Ph/nC18 of crude oil samples are in ranges of 0.47–14.27 and 0.44 to 15.24, respectively. The wide distribution of these parameters indicates that some samples may be affected by secondary effects. The Pr/Ph ratios of the crude oil samples in the study area range from 0.69 to 1.23, implying that the crude oil coming from the source rocks was deposited under anoxic conditions (Didyk et al., 1978; Peters et al., 2005). The crude oil samples in the study area contained a relatively high abundance of β-carotane, suggesting that the source rock was formed in a brackish lagoonal sedimentary environment (Murphy et al., 1967; Didyk et al., 1978; Moldowan et al., 1985; Valle and Simoneit 2005; Peters et al., 2005; Zhang et al., 2015; Ding et al., 2020).
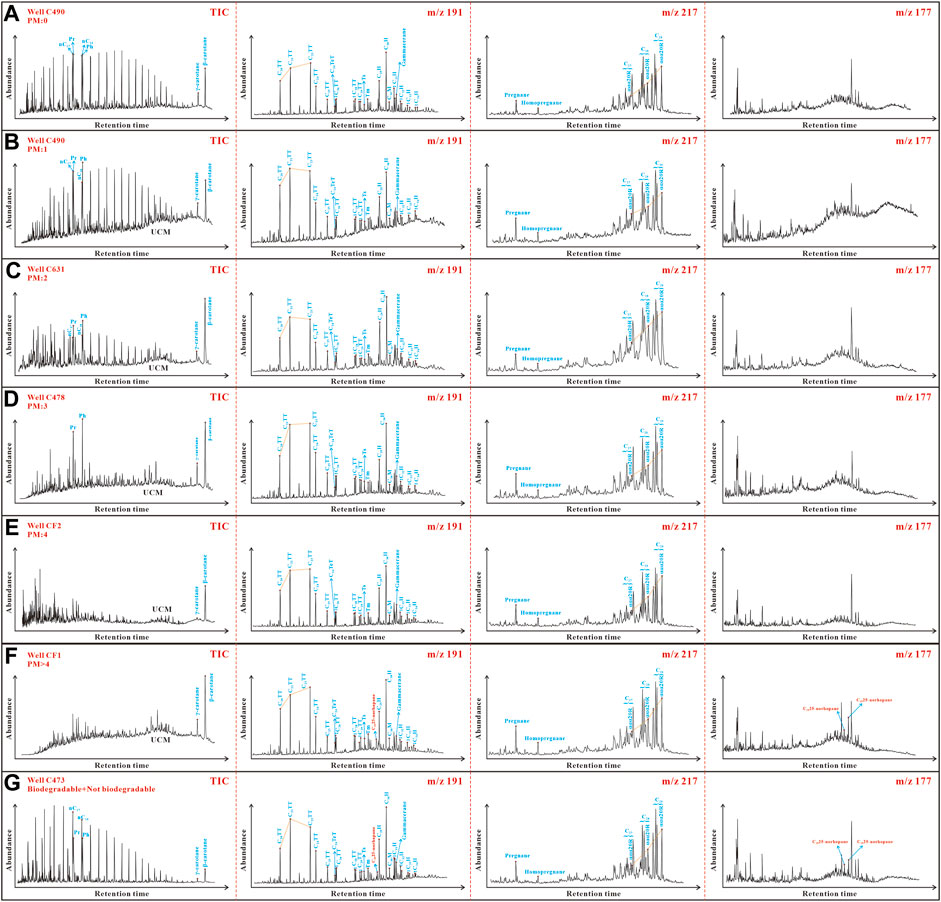
FIGURE 7. GC-MS of saturated hydrocarbons in Carboniferous crude oil samples from the Hongche fault zone. (A) C490; (B) C490; (C) C631; (D) C478; (E) CF2; (F) CF1; (G) C473.
4.4.2 Triterpanes and steranes
In Figure 7, the m/z 191 mass spectrum of the saturated hydrocarbons in the analysed crude oil samples show that tricyclic terpanes are abundant, and the tricyclic terpane/17α-hopane ratios range from 0.72 to 21.20. The tricyclic terpane/17α-hopane ratios of some samples were unexpected, which may have been caused by biodegradation. Tricyclic terpanes are abundant in the extracts and crude oil samples of highly evolved source rocks. Tricyclic terpanes are less affected by thermal maturity and more resistant to biodegradation than hopanes and steranes (Xiao et al., 2019). Most crude oil samples in the study area are dominated by C23 tricyclic terpanes (C20TT < C21TT < C23TT, and C20TT < C21TT ≈ C23TT), while a few crude oil samples are dominated by C21 tricyclic terpanes (Figure 7). The C20TT/C21TT and C21TT/C23TT ratios of the crude oil samples are in the ranges of 0.54–0.89 (0.70 on average) and 0.77 to 1.66 (1.09 on average) (Table 3).
The C29/C30 hopane ratios of the crude oil samples range from 0.46 to 1.23 (0.62 on average), with most of the sample ratios being less than 1, indicating that the crude oil comes from source rocks that are rich in terrestrial organic matter (Gurgey 1999). The abnormal C29/C30 hopane ratios may be a result of biodegradation. Unlike C29 hopanes, C30 hopanes are preferentially degraded and are unrelated to the type of hydrocarbon-generating parent material (Peters et al., 2005).
The amount of gammacerane in all crude oil samples is high, and the gammacerane/C31 22R homohopane ratios are in the range of 0.69–1.63 (1.04 on average), indicating that the crude oil comes from the source rock formed in high-salinity sedimentary environments (Moldowan et al., 1985; Peters and Moldowan 1993; Damsté et al., 1995).
The Ts/Tm ratios of crude oil samples in the study area are in the range of 0.10–1.33 (0.68 on average) (Table 3). The Ts/Tm ratio is affected by maturity, and sedimentary background (Moldowan et al., 1985; Peters et al., 2005). The source rocks in the study area have various lithologies, the salinity of the water body varies greatly, and the types of hydrocarbon-generating parent materials are diverse. Therefore, the Ts/Tm ratio cannot be used as the maturity identification standard.
The ratios of C29 moretane/C29 hopane and C30 moretane/C30 hopane in the study area are in the range of 0.08–0.22 (mean 0.15) and 0.10–0.33 (0.18), respectively (Table 3), indicating that the crude oils are derived from mature source rocks (Seifert and Moldowan, 1986). However, the ratios of C31 homohopane 22S/(22S + 22R), C32 homohopane 22S/(22S + 22R) in crude oil samples are in the range of 0.32–0.71 and 0.40–0.63, respectively (Table 3; Figure 8). Some samples had low ratios, which have been may be caused by biodegradation.

FIGURE 8. Comparison of the thermal maturity of the studied source rocks and crude oils. (A) Plot of C29 sterane 20S/(20R + 20S) versus C29 sterane ββ/(αα+ββ); (B) Plot of C31 homohopane 22S/(22S + 22R) versus C32 homohopane 22S/(22S + 22R).
The distribution characteristics of C27, C28, and C29 regular steranes are often used to identify the source of organic matter input (Huang and Meinschein 1979; Waples and Machihara 1991; Li et al., 2020; Lu et al., 2022). As shown in Figure 7, all crude oil samples from the study area exhibit a similar distribution of C27, C28, and C29 regular steranes (C29 > C28 > , and C27), and the amounts of pregnane and homopregnane are relatively high. Generally, the organic matter of source rocks comes from aquatic organisms, such as algae, and biomarkers that are rich in C27 steranes, whereas the organic matter of source rocks coming from higher plants, and biomarkers are rich in C29 steranes (Huang and Meinschein 1979; Volkman 1986). The ratios of C29 sterane 20S/(20S + 20R) and ββ/(ββ+αα) for the crude oil samples from the study area are in the ranges of 0.41–0.52 and 0.44 to 0.64, respectively (Table 3; Figure 8).
5 Discussion
5.1 Assignment of biodegradation level
Because different biomarker parameters differ in their resistance to biodegradation, the degree of biodegradation can be graded by comparing their relative amounts (Peters et al., 2005). The distribution ranges of the physical properties and composition of crude oils in the study area are relatively large (Table 2; Figure 5). The saturated/aromatic hydrocarbon ratios, as well as the amounts of short, medium and long-chain n-alkanes in the crude oil samples display a good relationship with density (Figures 6, 9A–C–C). Among these, short-chain n-alkanes have the highest content, followed by medium-chain n-alkanes (Figure 9D). Previous studies have demonstrated that the crude oil in the study area originates from mature source rocks and migrates over the same distance. Therefore, different degrees of biodegradation have a significant impact on the overall composition of crude oil. As shown in Table 3, most of the crude oil in the study area suffered from the biodegradation at the 1–4 p.m. scale, and only a small portion of the crude oil suffered strong biodegradation levels (PM > 4) (Peters and Moldowan, 1993). As presented in Figure 7B, biodegradation level 1 (PM 1) indicates a certain consumption of short-chain n-alkanes, and a significant unresolved complex mixture (UCM), and a high Pr/nC17 and Ph/nC18 ratios (Figure 10). Figure 7C shows the n-alkanes of this type of crude oil as being significantly degraded, and the abundance of isoprenoids is higher than that of n-alkanes. Therefore, it also shows higher Pr/nC17 and Ph/nC18 ratios (Figure 10), indicating that this type of crude oil suffered from level 2 biodegradation (PM 2). It can also be seen Figure 7D that the crude oil is nearly depleted of n-alkanes, but the Pr, Ph and β-carotene peaks still exist, indicating that the crude oil suffered from level 3 biodegradation (PM 3). As shown in Figure 7E, the crude oil is depleted of n-alkanes and isoprenoids, with only the peak of β-carotene being observed, and there is no significant C2825-norhopane and C2925-norhopane on the m/z 177 mass spectrum. Therefore, the biodegradation of the crude oil has reached level 4 (PM 4). As shown in Figure 7F, the n-alkanes and isoprenoids of this crude oil are also completely consumed, and C2825-norhopane and C2925-norhopane is evident on the m/z 177 mass spectrum. This indicates that the crude oil has suffered extensive biodegradation, with the level of biodegradation reaching PM scale level 5 and above, further suggesting that such crude oil steranes and hopanes have also started to degrade. As shown in Figure 7G, this type of crude oil has a complete set of n-alkanes, but there are clear peaks for C2825-norhopane and C2925-norhopane in the m/z 177 mass spectrum. The results obtained reveal that analysed crude oil is a mixture of the crude oil that suffered extensive biodegradation in the early stages and crude oil that did not undergo biodegradation in the later stages. This also confirms that there are multistage oil-charging events in this study area.
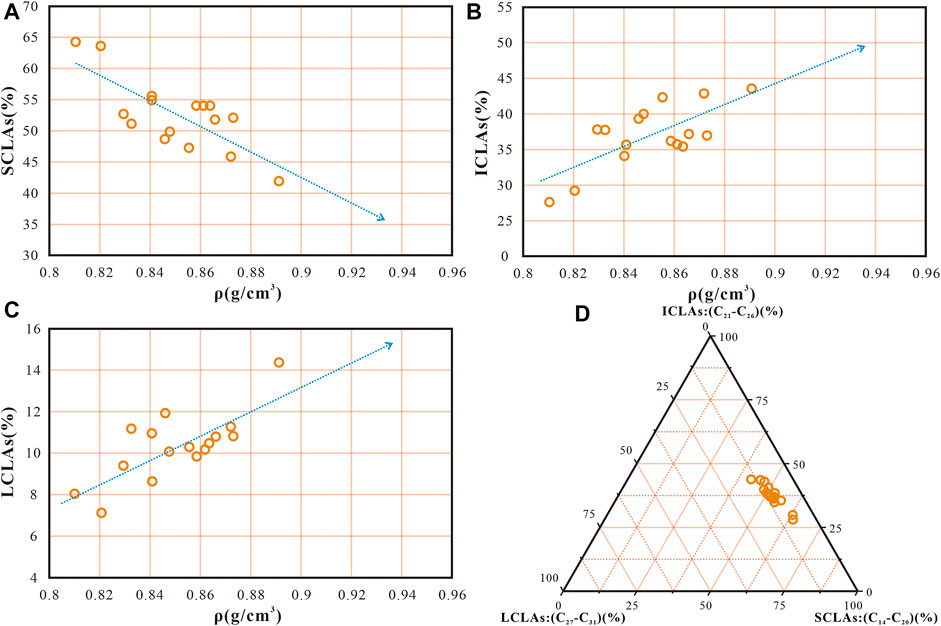
FIGURE 9. Plot of distribution characteristics of n-alkanes from the studied Carboniferous crude oil in the Hongche fault zone. (A) Plot of density (ρ) versus short chain length n-alkanes (SCLAs); (B) Plot of density (ρ) versus medium-chain n-alkanes (ICLAs); (C) Plot of density (ρ) versus long-chain n-alkanes (LCLAs); (D) Ternary plot of SCLAs, ICLAs, and LCLAs.
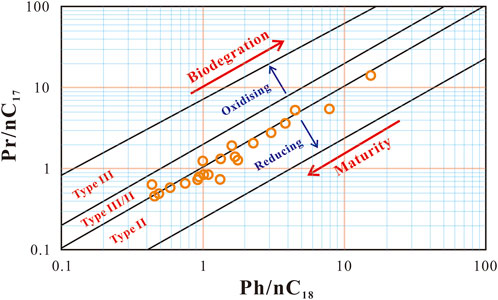
FIGURE 10. Plot of Ph/nC18 versus Pr/nC17 ratios from the studied Carboniferous crude oil samples in the Hongche fault zone. The base map modified from Shanmugam (1985).
As mentioned above, the crude oil in the study area suffered from different degrees of biodegradation. Therefore, the parameters are related to n-alkanes and isoprenoids (e.g., Pr/Ph, Pr/nC17 and Pr/nC17 and Ph/nC18). However, steranes and terpanes are more resistant to biodegradation than n-alkanes and isoprenoids. Therefore, the sterane and terpane series of biomarkers can be used for oil-source correlation of biodegraded oils with PM scales less than level 5 biodegradation. When the PM scale is larger than level 4 biodegradation, most biomarker compounds are ineffective. Therefore, the oil source of this part of the crude oil was analysed by β-carotane and the tricyclic terpane series of compounds with strong high biodegradation susceptibilities.
5.2 Inferred oil-source correlation
The three sets of source rocks in the P2w, P1f, and P1j are recognized as important source rocks for the hydrocarbon supply in the Shawan Sag (Wang and Kang, 2001; Chen et al., 2016b). Among them, the P2w and P1f are the main oil source rocks. Previous studies show that the crude oil distributed in the reservoirs on the north-western margin of the Junggar Basin mainly originates from these two sets of source rocks. Therefore, the purpose of this part of the study is to clarify the genetic relationship between the crude oil of the Carboniferous volcanic reservoirs in the Hongche Fault Zone and the three sets of source rocks. Based on the differences in biomarker compounds and degree of biodegradation of crude oil, the crude oils in the study area were divided into four groups and seven subgroups (Figure 11).
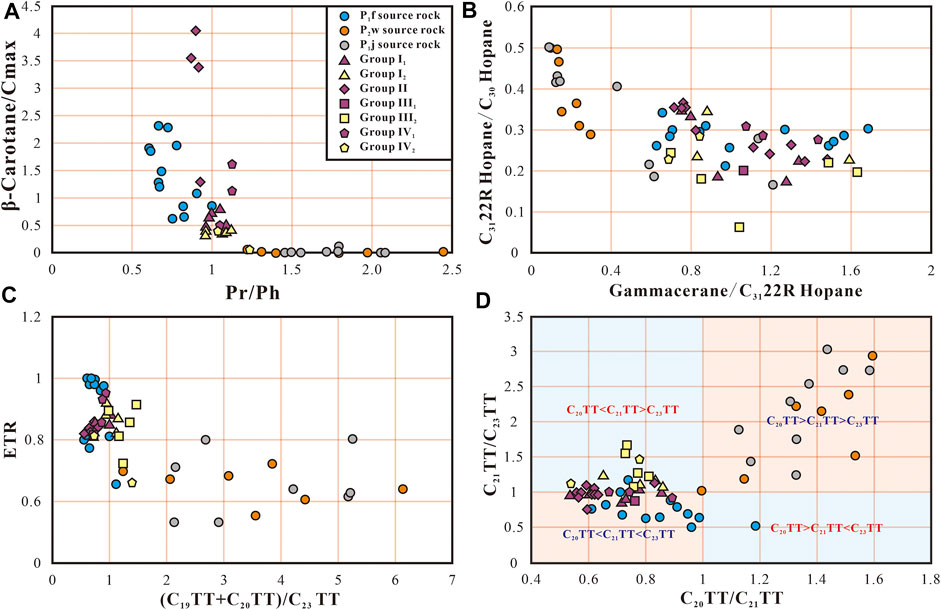
FIGURE 11. Cross-plots of biomarker parameters from the studied Carboniferous crude oil samples and P2w, P1f, and P1j source rock samples. (A) Plot of Pr/Ph versus β-Carotane/Cmax; (B) Plot of gammacerane/C3122R homohopane versus C3122R homohopane/C30 hopane; (C) Plot of (C19TT + C20TT)/C23TT versus ETR; (D) Plot of C20TT/C21TT versus C21TT/C23TT.
Crude oils of group I are non-degraded and slightly degraded (PM ≤ 1), and retain almost all n-alkanes and isoprenoids, among which the Pr/Ph ratio is low (0.96–1.12). Regular steranes of C27, C28, and C29 show an ascending distribution (C29 > C28 > C27) and contain a high abundance of gammacerane (the ratio of gammacerane/C3122R homohopane is in the range of 0.75–1.59). Although this group of crude oils has many similar characteristics, there are also some minor differences, which can be divided into subgroups I1 and I2 (Figure 11). The C20, C21, and C23 tricyclic terpanes of subgroup I1 crude oils show an increasing distribution (C20TT < C21TT < C23TT or C20TT < C21TT = C23TT) and contain a high amount of β-carotane. The distribution characteristics of tricyclic terpanes of subgroup I2 crude oils are C20TT < C21TT > C23TT (C20TT < C23TT), which also contains β-carotane, but its relative abundance is lower than that in the subgroup I1 crude oils. These characteristics indicate that subgroup I1 crude oils originate from the P1f source rock, while subgroup I2 crude oils are a mixed product from the P1f and P2w source rocks (Figure 11).
The crude oils of group II were moderately-to-severely biodegraded (PM: 2–4). The n-alkanes and isoprenoids in this type of crude oils are consumed or exhausted. There is an obvious UCM and a high abundance of β-carotane (Figure 7). Some crude oils still have an abundance of Pr and Ph, and their Pr/Ph ratio is less than 1. The C20, C21, and C23 tricyclic terpanes of this type of crude oils all show an increasing distribution (C20TT < C21TT < C23TT) and contain high amounts of gammacerane (the ratio of gammacerane/C3122R homohopane is in the range of 0.72–1.48). These characteristics indicate that the crude oils of group II originate from the P1f source rock (Figure 11).
The crude oils of group III are extensively biodegradated (PM > 4). These crude oils have no n-alkanes and isoprenoids, but have C2825-norhopane and C2925-norhopane. Based on the differences in the biomarker compounds, they can be divided into subgroups III1 and III2 (Figure 11). Subgroup III1 crude oils have similar characteristics as those of subgroup I1 and group II crude oils, with an abundance of β-carotane and the distribution characteristics of C20TT < C21TT < C23TT. Subgroup III1 crude oils also originate from the P1f source rock and suffer from severe biodegradation in the later stages. Subgroup III2 crude oils have low amounts of β-carotane, and the distribution of tricyclic terpanes is C20TT < C21TT > C23TT, indicating that this type of crude oils is a mixed product derived from the P1f and P2w source rocks (Figure 11).
The crude oils of group IV have a complete set of n-alkanes and isoprenoids, as well as significant C2825-norhopane and C2925-norhopane present, indicating that such crude oils are a mixture of non-biodegraded and severely biodegraded residual oils (Figure 7). Based on the characteristics of the biomarker compounds, they can be further divided into subgroups IV1 and IV2 (Figure 11), Of which subgroup IV1 has similar characteristics to subgroup I1, indicating that the crude oils originated from the P1f source rock. The characteristics of the subgroup IV2 and I2 crude oils are similar, indicating that subgroup IV2 crude oils are a mixed product of P1f and P2w source rocks (Figure 11).
In summary, the crude oils in the study area mainly originate from the P1f source rock, with part of the crude oils being a mixed product of P1f and P2w source rocks. The above conclusions can also be drawn from the distribution characteristics of the stable carbon isotopes in the crude oils and the three sets of source rocks (i.e., P2w, P1f, and P1j) (Figure 12).
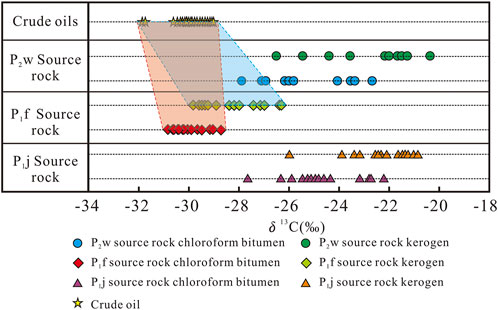
FIGURE 12. Plot of distribution characteristics of stable carbon isotopes from the studied Carboniferous crude oil samples and P2w, P1f, and P1j source rock samples.
5.3 Origin and accumulation mode of heavy oil
According to previous results and discussions, crude oils in the study area are mainly derived from mature P1f source rocks, and a small part of the crude oils is derived from the mixture of P1f and P2w source rocks. The Hongche Fault Zone is mainly affected by the Hercynian, the Indosinian, and the Yanshan movements, whereas the Himalayan movement has little effect on the structural transformation of the area (Cao et al., 2010; Liang et al., 2018). In the late Triassic, the P1f source rock in the Shawan Sag reached a mature stage, and the oil and gas generated by the source rock migrated to the upper plate of the Carboniferous reservoir of the fault zone (Figure 13A). In the Hongche Fault Zone, owing to intense tectonic activity during the late Indosinian movement, the newly formed faults or the faults formed in the early stage reopened, resulting in different degrees of biodegradation of the crude oil, forming crude oils of groups I1, II, and III1 (Figure 13B). In the early Cretaceous, the P1f source rock was in the natural gas generation stage, and the P2w source rock was in the mature stage. During this period, the fault zone had a certain sealing effect on crude oil, so that a small part of the crude oil could migrate to the Carboniferous oil reservoir, forming crude oils of groups I2, III2, and IV (Figure 13C). As shown in Figure 8, the maturity of crude oil is slightly higher than that of the source rocks, because the well locations of P2w, P1f, and P1j source rocks that have been drilled in this area are distributed in the structural parts or sloped areas. The crude oil in the study area does not come from the source rocks in the structural parts or sloped areas, instead, it originates from by the source rocks in the sag during the peak oil generation period. Therefore, it is speculated that there may be well-preserved primary oil and gas reservoirs in the footwall of the fault and slope areas, which have good exploration prospects.
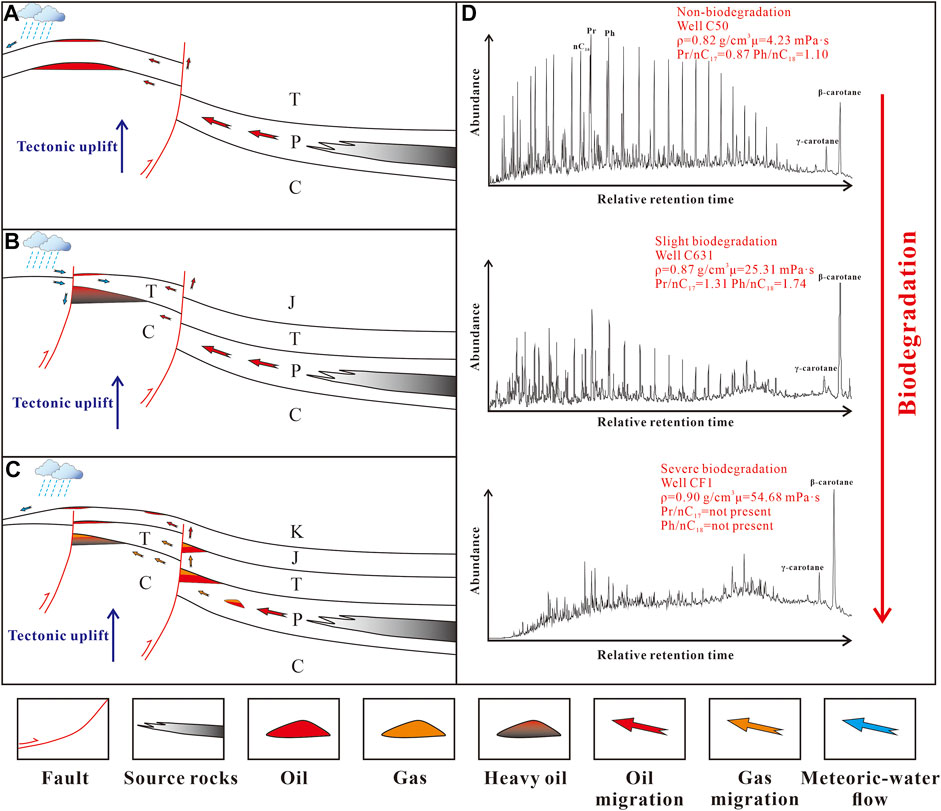
FIGURE 13. Accumulation model for volcanic reservoirs in the Hongche fault zone in different geological periods and gas chromatograms of crude oil under different degrees of biodegradation. (A) Late Triassic oil and gas accumulation model; (B) Late Jurassic oil and gas accumulation model; (C) Early Cretaceous oil and gas accumulation model; (D) Gas chromatograms of crude oil under different degrees of biodegradation.
The Carboniferous volcanic reservoirs in the study area are mainly distributed along the fault zone. Not only is the migration and accumulation of oil and gas closely related to fault activity, but the degree of crude oil biodegradation is also closely related to fault activity. As shown in Figure 13D, three sets of typical gas chromatograms in the study area show different degrees of biodegradation of crude oil. This result is related mainly to the strength of tectonism in this area.
6 Conclusion
In this study, the PM scale of crude oil biodegradation was determined by analysing its physical properties, bulk compositions, and biomarker compounds. Most of the crude oil in the study area suffered from biodegradation at the 1–4 p.m. scale, and only a small portion of the crude oil suffered severe biodegradation levels (PM > 4). The main difference between crude oils is in the degree of biodegradation, followed by the differences in biomarker compounds. Therefore, crude oils could be divided into four groups and seven subgroups. The analysis results showed that the crude oils of subgroups I1, II, III1, and IV1 were derived from P1f source rocks, while the crude oils of subgroups I2, III2 and IV2 were mixed product of the P1f and P2w source rocks.
We identified periods of oil-charging events. The first stage was late Triassic, and the crude oil in this period was derived from the P1f source rock. Owing to the strong tectonic activity in the late Indosinian movement, the reservoir was mainly distributed in the footwall of the fault zone, and the crude oil in the reservoir suffered different degrees of biodegradation, forming crude oils of subgroups I1, II, and III1. The second stage is the Cretaceous, during which the P1f source rock was in the natural gas generation stage, and the P2w source rock was at the mature stage, causing a small part of the crude oil formed by the P2w source rock to migrate to Carboniferous reservoirs, thereby forming crude oils of subgroups I2, III2, and IV.
Through a comparative analysis of the maturity of the crude oil in the reservoir and the obtained source rocks, it was shown that the crude oil in the study area is not from the source rocks in the structural positions or sloped areas, but from the source rocks in the sag during the peak of oil generation. As tectonic activity approaches stability in the later period, it is speculated that there may be well preserved primary oil and gas reservoirs in the footwall and sloped areas of the fault, showing good exploration prospects.
Data availability statement
The original contributions presented in the study are included in the article/supplementary material, further inquiries can be directed to the corresponding author.
Author contributions
QH: Writing-original draft, visualization, formal analysis, validation, Supervision, Investigation. SC: Conceptualization, methodology, writing-review and editing, funding acquisition. JW: Resources, funding acquisition. LZ: Data curation, visualization, investigation. ZM: Data curation, visualization.
Funding
This work was supported by National Natural Science Foundation of China (Grant Numbers 41872165 and 42072185), Science and Technology Cooperation Project of the CNPC-SWPU Innovation Alliance (Grant Number 2020CX030000) and Foundation of Postgraduate Research and Innovation of Southwest Petroleum University (Grant Number 2020cxyb020).
Conflict of Interest
Author JW was employed by Research Institute of Experiment and Testing, Xinjiang Oilfield Company, PetroChina.
The remaining authors declare that the research was conducted in the absence of any commercial or financial relationships that could be construed as a potential conflict of interest.
Publisher’s Note
All claims expressed in this article are solely those of the authors and do not necessarily represent those of their affiliated organizations, or those of the publisher, the editors and the reviewers. Any product that may be evaluated in this article, or claim that may be made by its manufacturer, is not guaranteed or endorsed by the publisher.
References
Baskin, D. K. (1997). Atomic H/C ratio of kerogen as an estimate of thermal maturity and organic matter conversion. Am. Assoc. Pet. Geol. Bull. 81, 1437–1450. doi:10.1306/3B05BB14-172A-11D7-8645000102C1865D
Cao, J., Jin, Z. J., Hu, W. X., Zhang, Y. J., Yao, S. P., Wang, X. L., et al. (2010). Improved understanding of petroleum migration history in the Hongche fault zone, northwestern Junggar Basin (northwest China): Constrained by vein-calcite fluid inclusions and trace elements. Mar. Pet. Geol. 27 (1), 61–68. doi:10.1016/j.marpetgeo.2009.08.014
Chang, X. C., Wang, Y., Shi, B. B., and Xu, Y. D. (2019). Charging of Carboniferous volcanic reservoirs in the eastern Chepaizi uplift, Junggar Basin (northwestern China) constrained by oil geochemistry and fluid inclusion. Am. Assoc. Pet. Geol. Bull. 103 (7), 1625–1652. doi:10.1306/12171818041
Chen, S. J., Lei, J. J., Liu, C., Yao, J. L., Li, Y., Li, S. X., et al. (2019). Factors controlling the reservoir accumulation of triassic Chang 6 member in jiyuan-wuqi area, ordos basin, NW China. Petroleum Explor. Dev. 46 (2), 253–264. doi:10.1016/S1876-3804(19)60006-6
Chen, Z. H., Cao, Y. C., Wang, X. L., Qiu, L. W., Tang, Y., and Yuan, G. H. (2016a). Oil origin and accumulation in the paleozoic chepaizi-xinguang field, Junggar Basin, China. J. Asian Earth Sci. 115, 1–15. doi:10.1016/j.jseaes.2015.09.019
Chen, Z. H., Zha, M., Liu, K., Liu, K. Y., Zhang, Y. Q., Yang, D. S., et al. (2016b). Origin and accumulation mechanisms of petroleum in the carboniferous volcanic rocks of the Kebai Fault zone, western Junggar Basin, China. J. Asian Earth Sci. 127, 170–196. doi:10.1016/j.jseaes.2016.06.002
Chen, Z. L., Liu, G. D., Wei, Y. Z., Gao, G., Ren, J. L., Yang, F., et al. (2017). Distribution pattern of tricyclic terpanes and its influencing factors in the Permian source rocks from Mahu Depression in the Junggar Basin. Oil Gas. Geol. 38 (02), 311–322. (in Chinese with English abstract). doi:10.11743/ogg20170211
Chung, H. M., Brand, S. W., and Grizzle, P. L. (1981). Carbon isotope geochemistry of Paleozoic oils from big horn basin. Geochim. Cosmochim. Acta 45 (10), 1803–1815. doi:10.1016/0016-7037(81)90011-9
Chung, H. M., Rooncy, M. A., Toon, M. B., and Claypool, G. E. (1992). Carbon isotope composition of marine crude oils. AAPG Bull. 76 (7), 1000–1007. doi:10.1306/BDFF8952-1718-11D7-8645000102C1865D
Craddock, P. R., Haecker, A., Bake, K. D., and Pomerantz, A. E. (2020). Universal curves describing the chemical and physical evolution of type II kerogen during thermal maturation. Energy fuels.. 34 (12), 15217–15233. doi:10.1021/acs.energyfuels.0c02376
Damsté, J. S. S., Kenig, F., Koopmans, M. P., Köster, J., Schouten, S., Hayes, J. M., et al. (1995). Evidence for gammacerane as an indicator of water column stratification. Geochem. Geochim. Cosmochim. Ac. 59 (9), 1895–1900. doi:10.1016/0016-7037(95)00073-9
Didyk, B. M., Simoneit, B. R. T., Brassell, S. C., and Eglinton, G. (1978). Organic geochemical indicators of palaeoenvironmental conditions of sedimentation. Nature 272 (5650), 216–222. doi:10.1038/272216a0
Ding, W. J., Hou, D. J., Jiang, L., Jiang, Y. H., and Wu, P. (2020). High abundance of carotanes in the brackish-saline lacustrine sediments: A possible cyanobacteria source? Int. J. Coal Geol. 219, 103373. doi:10.1016/j.coal.2019.103373
Feng, Z. H., Yin, C. H., Liu, J. J., Zhu, Y. K., Lu, J. M., and Li, J. H. (2014). Formation mechanism of in-situ volcanic reservoirs in eastern China: A case study from xushen gasfield in songliao basin. Sci. China Earth Sci. 57 (12), 2998–3014. doi:10.1007/s11430-014-4969-2
Feng, Z. Q. (2008). Volcanic rocks as prolific gas reservoir: A case study from the qingshen gas field in the songliao basin, ne China. Mar. Pet. Geol. 25 (4-5), 416–432. doi:10.1016/j.marpetgeo.2008.01.008
Gong, D. Y., Li, J. Z., Ablimit, I., He, W. J., Lu, S., Liu, D. G., et al. (2018). Geochemical characteristics of natural gases related to Late Paleozoic coal measures in China. Mar. Pet. Geol. 96, 474–500. doi:10.1016/j.marpetgeo.2018.06.017
Gong, D. Y., Song, Y., Wei, Y. Z., Liu, C. W., Wu, Y. W., Zhang, L. J., et al. (2019). Geochemical characteristics of Carboniferous coaly source rocks and natural gases in the Southeastern Junggar Basin, NW China: Implications for new hydrocarbon explorations. Int. J. Coal Geol. 202, 171–189. doi:10.1016/j.coal.2018.12.006
Gürgey, K. (1999). Geochemical characteristics and thermal maturity of oils from the Thrace Basin (Western Turkey) and Western Turkmenistan. J. Pet. Geol. 22 (2), 167–189. doi:10.1111/j.1747-5457.1999.tb00466.x
Hadad, Y. T., Hakimi, M. H., Abdullah, W. H., Kinawy, M., Mahdy, O. E., and Lashin, A. (2021). Organic geochemical characteristics of Zeit source rock from Red Sea Basin and their contribution to organic matter enrichment and hydrocarbon generation potential. J. Afr. Earth Sci. 177, 104151. doi:10.1016/j.jafrearsci.2021.104151
Han, W. X., Chang, X. C., Tao, S. Z., Hou, L. H., Ma, W. J., Yao, J. L., et al. (2019). Geochemical characteristics and Genesis of pre-salt gases in the Ordos Basin, China. J. Pet. Sci. Eng. 179, 92–103. doi:10.1016/j.petrol.2019.04.042
He, D. F., Chen, X. F., Kuang, J., Yuan, H., Wu, X. Z., Du, P., et al. (2010). Characteristics and exploration potential of Carboniferous hydrocarbon plays in Junggar Basin. Acta Pet.. Sin. 31 (1), 1–11. (in Chinese with English abstract). doi:10.1016/S1876-3804(11)60008-6
Hou, L. H., Ma, W. J., Luo, X., Tao, S. Z., Guan, P., and Liu, J. Z. (2020). Chemical structure changes of lacustrine Type-II kerogen under semi-open pyrolysis as investigated by solid-state 13C NMR and FT-IR spectroscopy. Mar. Pet. Geol. 116, 104348. doi:10.1016/j.marpetgeo.2020.104348
Huang, W. Y., and Meinschein, W. G. (1979). Sterols as ecological indicators. Geochim. Cosmochim. Acta 43 (5), 739–745. doi:10.1016/0016-7037(79)90257-6
Hunt, J. M. (1996). Petroleum Geochemistry and geology. second ed.. New York: W. H. Freeman and company.
Jiang, W. L., Imin, A., Wang, X. Y., Wang, T., and Guo, W. J. (2020). Geochemical characterization and quantitative identification of mixed-source oils from the baikouquan and lower Wuerhe formations in the eastern slope of the mahu sag, Junggar Basin, NW China. J. Pet. Sci. Eng. 191, 107175. doi:10.1016/j.petrol.2020.107175
Li, Y., Chen, S. J., Wang, Y. X., Su, K. M., He, Q. B., Qiu, W., et al. (2020). Relationships between hydrocarbon evolution and the geochemistry of solid bitumen in the Guanwushan Formation, NW Sichuan Basin. Mar. Pet. Geol. 111, 116–134. doi:10.1016/j.marpetgeo.2019.08.018
Li, Y., Lu, J. G., Liu, X. J., Wang, J., Ma, W. Y., He, X., et al. (2022). Geochemistry and origins of natural gas in the Hong-Che fault zone of the Junggar Basin, NW China. J. Pet. Sci. Eng. 214, 110501. doi:10.1016/j.petrol.2022.110501
Li, Z. H., Qiu, L. W., Sun, B. Q., Tang, Y., Kong, Y. H., and Zhu, S. B. (2013). Characteristics of fluid inclusion and charging events of natural gas in Permian Jiamuhe Formation of Zhongguai area, Junggar Basin. Nat. Gas. Geosci. 24 (5), 931–939. (in Chinese with English abstract). doi:10.1016/S0264-410X(97)00182-5
Liang, Y. S., He, D. F., Zhen, Y., Zhang, L., and Tian, A. J. (2018). Tectono-stratigraphic sequence and basin evolution of shawan sag in the Junggar Basin. Oil Gas. Geol. 39 (5), 943–954. oi:(in Chinese with English abstract). doi:10.11743/ogg20180509
Lu, J. G., Liao, J. B., Liu, X. J., Li, Y., Yao, J. L., He, Q. B., et al. (2022). Geochemistry of different source rocks and oil-source correlation of lacustrine sedimentary successions: A case study of the triassic yanchang formation in the dingbian-wuqi area, ordos basin, northern China. J. Asian Earth Sci. 232, 105216. doi:10.1016/j.jseaes.2022.105216
Ma, S. W., Chen, C. Y., Luo, J. L., Wei, L., Liu, Y., Dai, J. J., et al. (2019). Research of major controlling factors on favorable reservoir of the carboniferous volcanic rocks in xiquan area, Junggar Basin. Geol. J. China Univ. 25 (2), 197–205. (in Chinese with English abstract). doi:10.16108/j.issn1006-7493.2018087
Mao, Z. G., Zhu, R. K., Wang, J. H., Luo, J. L., and Su, L. (2021). Characteristics of diagenesis and pore evolution of volcanic reservoir: A case study of Junggar Basin, northwest China. J. Earth Sci. 32 (4), 960–971. doi:10.1007/s12583-020-1366-y
Marcano, N., Larter, S., and Mayer, B. (2013). The impact of severe biodegradation on the molecular and stable (C, H, N, S) isotopic compositions of oils in the Alberta Basin, Canada. Org. Geochem. 59, 114–132. doi:10.1016/j.orggeochem.2013.04.001
Mashhadi, Z. S., and Rabbani, A. R. (2015). Organic geochemistry of crude oils and Cretaceous source rocks in the Iranian sector of the Persian Gulf: An oil-oil and oil-source rock correlation study. Int. J. Coal Geol. 146, 118–144. doi:10.1016/j.coal.2015.05.003
Moldowan, J. M., Seifert, W. K., and Gallegos, E. J. (1985). Relationship between petroleum composition and depositional environment of petroleum source rock. AAPG Bull. 69 (8), 1255–1268. doi:10.1306/AD462BC8-16F7-11D7-8645000102C1865D
Murphy, S. M. T., McCormick, A., and Eglinton, G. (1967). Perhydro-β-Carotene in the green river shale. Science 157 (3792), 1040–1042. doi:10.1126/science.157.3792.1040
Niu, J., Huang, H. P., and Jiang, W. L. (2018). Geochemical characteristics and correlation of continuous charge mixing and biodegradation of heavy oil in southeastern Dongying Sag, Bohai Bay basin, China. J. Pet. Sci. Eng. 166, 1–12. doi:10.1016/j.petrol.2018.03.035
Pallasser, R. J. (2000). Recognising biodegradation in gas/oil accumulations through the δ13C compositions of gas components. Org. Geochem. 31 (12), 1363–1373. doi:10.1016/S0146-6380(00)00101-7
Pan, C. C., Wang, J., Yu, S., Wang, X. L., Xiang, B. L., Liao, J. D., et al. (2021). Oil origins, mixing and biodegradation in southwestern Junggar Basin, NW China. J. Pet. Sci. Eng. 196, 108017. doi:10.1016/j.petrol.2020.108017
Peters, K. E., and Moldowan, J. M. (1993). The biomarker guide, interpreting molecular fossils in petroleum and ancient sediments. Englewood Cliffs Nj: Prentice-Hall.
Peters, K. E., Walters, C. C., and Moldowan, J. M. (2005). The biomarker guide: Biomarkers and isotopes in the environment and human history. Cambridge University Press.
Samad, S. K., Mishra, D. K., Mathews, R. P., Ghosh, S., Mendhe, V. A., and Varma, A. K. (2020). Geochemical attributes for source rock and palaeoclimatic reconstruction of the Auranga Basin, India. India. J. Petrol. Sci. Eng. 185, 106665. doi:10.1016/j.petrol.2019.106665
Seifert, W. K., and Moldowan, J. M. (1986). Use of biological markers in petroleum exploration. Methods Geochem. Geophys. 24, 261–290.
Shanmugam, G. (1985). Significance of coniferous rain forests and related organic matter in generating commercial quantities of oil, Gippsland Basin, Australia. Am. Assoc. Pet. Geol. Bull. 69 (8), 1241–1254. doi:10.1306/AD462BC3-16F7-11D7-8645000102C1865D
Shi, B. B., Chang, X. C., Xu, Y. D., Mao, L. X., Zhang, J. H., and Li, Y. (2019). Charging history and fluid evolution for the Carboniferous volcanic reservoirs in the Western Chepaizi Uplift of Junggar Basin as determined by fluid inclusions and basin modelling. Geol. J. 55 (4), 2591–2614. doi:10.1002/gj.3527
Shi, B. B., Chang, X. C., Xu, Y. D., Wang, Y. R., Mao, L. X., and Wang, Y. (2020). Origin and migration pathway of biodegraded oils pooled in multiple-reservoirs of the Chepaizi Uplift, Junggar Basin, NW China: Insights from geochemical characterization and chemometrics methods. Mar. Pet. Geol. 122, 104655. doi:10.1016/j.marpetgeo.2020.104655
Su, K. M., Chen, S. J., Hou, Y. T., Zhang, H. F., Zhang, X. L., Zhang, W. X., et al. (2021). Geochemical characteristics, origin of the Chang 8 oil and natural gas in the southwestern Ordos Basin, China. J. Pet.. Sci. Eng. 200, 108406. doi:10.1016/j.petrol.2021.108406
Tang, H. F., Wang, P. J., Bian, W. H., Huang, Y. L., Gao, Y. L., and Dai, X. J. (2020). Review of volcanic reservoir geology. Acta Pet.. Sin. 41 (12), 1744–1773. (in Chinese with English abstract). doi:10.7623/syxb202012026
Tissot, B. P., and Welte, D. H. (1984). Geochemical fossils and their significance in petroleum formation, petroleum formation and occurrence. Berlin: Springer.
Valle, P. F. Z., and Simoneit, B. R. T. (2005). Hydrothermal bitumen generated from sedimentary organic matter of rift lakes - lake Chapala, Citala Rift, Western Mexico. Appl. Geochem. 20 (12), 2343–2350. doi:10.1016/j.apgeochem.2005.09.001
Volkman, J. K. (1986). A review of sterol markers for marine and terrigenous organic matter. Org. Geochem. 9 (2), 83–99. doi:10.1016/0146-6380(86)90089-6
Wang, W. F., and Zhang, Z. D. (2019). Evolution of Carboniferous source rocks and hydrocarbon accumulation process in the area of the Wucaiwan area. Nat. Gas. Geosci. 30 (7), 1018–1026. (in Chinese with English abstract). doi:10.11764/j.issn.1672-1926.2019.01.006
Wang, X. L., and Kang, S. F. (2001). Analysis on the oil source of the Mabei oilfield, northwest Junggar Basin. J. Southwest Petrol. Inst. 23, 6–8. (in Chinese with English abstract). doi:10.3863/j.issn.1674-5086.2001.06.02
Waples, D. W., and Machihara, T. (1991). Biomarkers for Geologists e a Practical Guide to the Application of Steranes and Triterpanes in Petroleum Geology American Association of Petroleum Geologists Methods in Exploration Series. Geol. Mag., 129 (6), 793–793. doi:10.1017/S0016756800008529
Xiao, F., Liu, L. F., Zhang, Z. H., Wu, K. J., Xu, Z. J., and Zhou, C. X. (2014). Conflicting sterane and aromatic maturity parameters in Neogene light oils, eastern Chepaizi High, Junggar Basin, NW China. Org. Geochem. 76, 48–61. doi:10.1016/j.orggeochem.2014.07.014
Xiao, H., Li, M. J., Yang, Z., and Zhu, Z. L. (2019). Distribution patterns and geochemical implications of C19-C23 tricyclic terpanes in source rocks and crude oils occurring in various depositional environments. Geochimica 48 (2), 161–170. (in Chinese with English abstract). doi:10.19700/j.0379-1726.2019.02.006
Xiao, Q. L., He, S., Yang, Z., He, Z. L., Wang, F. R., Li, S. F., et al. (2010). Petroleum secondary migration and accumulation in the central Junggar Basin, northwest China: Insights from basin modeling. Am. Assoc. Pet. Geol. Bull. 94 (7), 937–955. doi:10.1306/12090909002
Yang, F., Song, Y., Chen, H., Gong, D. Y., Bin, B. L., and Liu, H. L. (2019). Evaluation of carboniferous songkaersu formation source rocks and gas-source correlation in the fukang sag of eastern Junggar Basin. Nat. Gas. Geosci. 30 (7), 1018–1026. (in Chinese with English abstract). doi:10.11764/j.issn.1672-1926.2019.03.006
Ye, T., Chen, A. Q., Hou, M. C., Niu, C. M., and Wang, Q. B. (2022). Lithofacies characteristics and controlling on volcanic reservoirs in the basement: A case study of the offshore bohai bay basin, eastern China. J. Pet. Sci. Eng. 209, 109860. doi:10.1016/j.petrol.2021.109860
Zhang, N. L., Luo, Z. F., Chen, X., Zhao, L. Q., Zeng, X. Q., and Zhao, M. R. (2021). Investigation of the artificial fracture conductivity of volcanic rocks from Permian igneous in the Sichuan Basin, China, with different stimulation method using an experiment approach. J. Nat. Gas. Sci. Eng. 95, 104234. doi:10.1016/j.jngse.2021.104234
Zhang, S. Y., Wu, T., Zhang, S. C., Cao, C. H., Ma, W. Y., Shi, J., et al. (2015). Organofacies and paleoenvironment of lower carboniferous mudstones (dishuiquan formation) in eastern junggar, NW China. Int. J. Coal Geol. 150-151, 7–18. doi:10.1016/j.coal.2015.08.004
Zhao, W. Z., Zou, C. N., Li, J. Z., Feng, Z. Q., Zhang, G. Y., Hu, S. Y., et al. (2009). Comparative study on volcanic hydrocarbon accumulations in Western and eastern China and its significance. Petroleum Explor. Dev. 36 (1), 1–11. doi:10.1016/S1876-3804(09)60106-3
Zhu, D. P., Liu, X. W., and Guo, S. B. (2020). Reservoir formation model and main controlling factors of the carboniferous volcanic reservoir in the hong-che Fault zone, Junggar Basin. Energies 13 (22), 6114. doi:10.3390/en13226114
Zou, C. N., Hou, L. H., Tao, S. Z., Yuan, X. J., Zhu, R. K., Zhang, X. X., et al. (2011). Hydrocarbon accumulation mechanism and structure of large-scale volcanic weathering crust of the Carboniferous in northern Xinjiang, China. Sci. China Earth Sci. 55 (2), 221–235. doi:10.1007/s11430-011-4297-8
Keywords: hongche fault zone, volcanic rock, Carboniferous, biodegradation, oil-source correlation, geochemical characteristics
Citation: He Q, Chen S, Wang J, Zhao L and Ma Z (2022) Geochemical characteristics and origin of crude oil from Carboniferous volcanic rocks in the Hongche Fault Zone of the Junggar Basin of China. Front. Earth Sci. 10:953245. doi: 10.3389/feart.2022.953245
Received: 26 May 2022; Accepted: 22 August 2022;
Published: 07 September 2022.
Edited by:
Patrick G. Hatcher, Old Dominion University, United StatesReviewed by:
Parthipan Punniyakotti, Pondicherry University, IndiaDeyu Gong, Research Institute of Petroleum Exploration and Development (RIPED), China
Copyright © 2022 He, Chen, Wang, Zhao and Ma. This is an open-access article distributed under the terms of the Creative Commons Attribution License (CC BY). The use, distribution or reproduction in other forums is permitted, provided the original author(s) and the copyright owner(s) are credited and that the original publication in this journal is cited, in accordance with accepted academic practice. No use, distribution or reproduction is permitted which does not comply with these terms.
*Correspondence: Shijia Chen, Y2hlbnNqMTk2NEBzd3B1LmVkdS5jbg==
 Qingbo He
 Shijia Chen1,2,3*