
94% of researchers rate our articles as excellent or good
Learn more about the work of our research integrity team to safeguard the quality of each article we publish.
Find out more
ORIGINAL RESEARCH article
Front. Earth Sci., 12 September 2022
Sec. Structural Geology and Tectonics
Volume 10 - 2022 | https://doi.org/10.3389/feart.2022.952314
This article is part of the Research TopicGeomechanics and Induced Seismicity for Underground Energy and Resources ExploitationView all 9 articles
 Jiawei Qian1,2†
 Kangdong Wang2,3†
 Haijiang Zhang2*
 Yuyang Tan4Chuanjian Xu3Qingsong Wang3Qiangqing Xiong3Michal Malinowski5
To monitor the status of cavern roof instability induced by solution salt mining, we deployed a surface microseismic monitoring system for Dongxing salt mine, Dingyuan county, China. The microseismic monitoring system consists of 11 three-component geophones installed in shallow holes of 5 m deep. From 7-month continuous monitoring data, we have detected a novel type of signal that consists of two events. The first event has a long duration (>15 s) and generally has higher frequencies at the beginning. The 2nd event has a shorter duration of ∼3 s with lower frequencies. The two events are separated by ∼30–90 s in time. From May 2017 to November 2017, there are a total of 88 distinct paired signals with two events in sequence. We propose the first event corresponds to a series of fracturing processes on the cavern roof, and microseismic signals associated with different fractures are mixed and overlapped to produce a mixed signal with a longer duration. Due to a series of fracturing processes, some zones of cavern roof become instable and some rock debris may fall from the roof and collide on the cavern floor. This collision can produce a short duration signal, which corresponds to the 2nd event of the paired signal. The further analysis of polarities of the first arrivals for the 2nd event further proves its collision origin. The time interval between two events is related to the time for the falling rock debris through the brine, which is controlled by the cavern height and various physical properties of the rock debris and brine. Through the detailed analysis of paired signals, we can have a better understanding of the cavity development status for solution salt mining.
Salt is not only an indispensable necessity for human life, but also one of the main raw materials for the basic chemical industry. As a special mining method, solution mining has been widely used in salt mines to effectively extract subsurface salt reservoirs, where fresh water is injected into the salt layer through wells (Berest et al., 2008; Schléder et al., 2008; Liu et al., 2019; Xing et al., 2021). However, when solution mining continues, it can create cavities beneath injection wells and between injection and extraction wells. As a result, geological disasters such as surface subsidence and sinkholes may be induced by solution mining, which could result in large damages for human life and property (Ege, 1984; Waltham et al., 2005; Ellsworth et al., 2012; Gutiérrez et al., 2014; Kinscher et al., 2014).
The commonly used methods for monitoring the potential collapse of solution salt mines include seismic method, settlement monitoring, hydrophone monitoring, and cavity scanning (Liu et al., 2020). Seismic method includes two-dimensional and three-dimensional seismic imaging using active sources, ambient noise tomography, and microseismic monitoring. Two-dimensional or three-dimensional seismic exploration method has been widely used in salt mining, which can be used to image the dissolution cavities (Xiong et al., 2019), but it is generally expensive to conduct the survey and cannot dynamically monitor the development of dissolution cavities. Surface subsidence monitoring cannot be used to image cavities and may not provide sufficient information about the cavity development. Although the InSAR (Synthetic Aperture Radar Interferometry) technology has a good spatial coverage (Valentino, 2016), due to the lack of good scatterers in the salt mine field it may not be sensitive to the actual surface subsidence.
Compared with other seismic methods, microseismic monitoring provides an effective way to monitor the solution mining process dynamically. It was first applied in the early sixties (Cook, 1963) and has grown to be a routine tool in daily mining hazard assessment (Ge, 2005). As solution mining continues, the cavity roof may become instable and can produce some fractures. As a result, the fracturing process will produce some microseismic signals that can be detected by the microseismic monitoring system (Guarascio, 1987; Trifu and Shumila, 2010; Nayak and Dreger, 2014; Kinscher et al., 2016). For example, a local seismic network installed over an underground salt cavern in the Lorraine basin recorded microseismic events possibly related to fluid-filled cracking process and rock-debris falling into the cavern from delamination of clay marls in the immediate roof (Mercerat et al., 2010).
Earthquake waveforms are highly complex due to multiple effects including source mechanism, stress drop, scattering, site-effects, phase conversions and interference from a multitude of noise sources (Das and Zoback, 2011; Eaton et al., 2013; Zhu and Beroza, 2019). In general, the signals generated by the brittle failure of rock are easily identified. Hydroacoustic monitoring of the controlled collapse of the Cerville-Buissoncourt salt cavity has identified two types of events, termed “X” events and “seismic” events, which could serve as precursory events of the collapse (Lebert et al., 2011). The “X” events may be related to the damaging and breaking process in the roof that involves microcracks appearing and then coalescing. In comparison, the “seismic” events that occur after the period of “X” events are likely related to the postrupture rock movements related to the intense deformation of the cavity roof (Lebert et al., 2011). Some microseismicity observed in the vicinity of an underground salt cavern was triggered by a remote M ∼ 7.2 earthquake that is ∼12,000 km away (Jousset and Rohmer, 2012). They documented three types of earthquakes (brittle-like micro-earthquakes, Long Period events and Very Long Period earthquakes), similar to those recorded in volcanic or hydrothermal systems (Jousset and Rohmer, 2012). In addition to microseismic events, roof failure could also produce ground shaking events (Dahm et al., 2011).
In this study, we report the characteristic paired signals that are first observed from solution salt mining from the 7-month continuous surface microseismic monitoring of the Dingyuan salt mine in China. For the first time we have observed paired signals that are induced by cavern roof instability. No previous research has found this pairing phenomenon in solution salt mining, and no research has explained the second event of paired signal associated with the collision between the fallen debris and the cavern floor. This paired signal may be related to the detachment process of roof debris and its impact on the cavity floor. We give a detailed analysis of the mechanism for forming the observed paired signals and show their potential applications on assessing the stability of the cavity roof.
The Dingyuan salt mine with dozens of wells lies in Dongxing Town, Dingyuan County of China (Figure 1A). Millions of tons of salt have been exploited by solution mining since 1988, which produced many caverns full of brine in the underground (Xiong et al., 2019). There have been three surface collapses in the area which seriously affected the normal production and exacerbated the public panic on salt mining (Zhang et al., 2018, 2019).
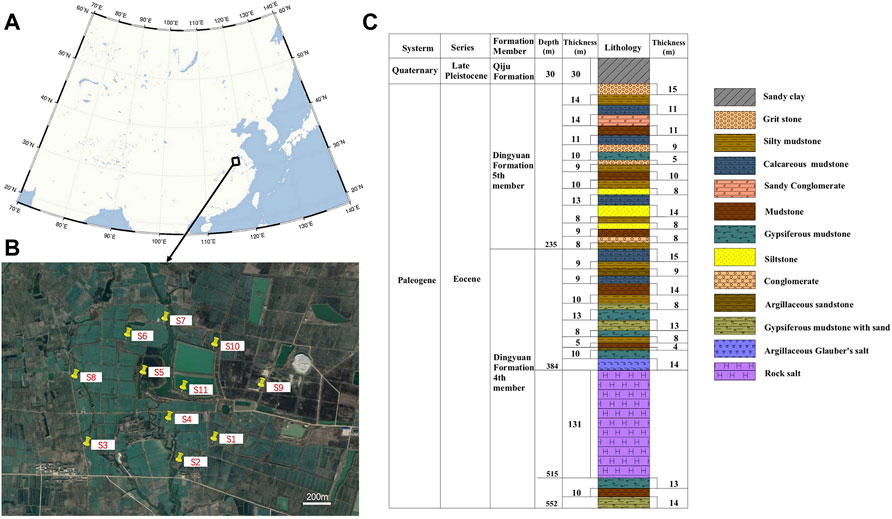
FIGURE 1. (A) The geographic location of the Dongxing salt mine in eastern China. (B) The distribution of surface geophones of the microseismic monitoring system. (C) Stratigraphic column of the Dongxing salt mine (modified after Zhang et al., 2018).
Eleven three-component geophones (VHL5) of Weihai Sunfull Geophysical Exploration Equipment Co., Ltd. were installed in shallow holes of 5 m deep covering the area of 1,400 m by 1,000 m (Figure 1B) to monitor solution mining. The geophones have the response frequency of 5 Hz and have the sensitivity of 200 v/m/s. Its temperature sensitivity ranges from minus 40°C to 100°C, and its coil resistance is 3,600 Ω. The sampling frequency is set to be 500 Hz. We use the 7-month continuous monitoring data from May 2017 to November 2017. The roof boundary of cavern C1 (Figure 2A) has been imaged from the 3D seismic exploration (Xiong et al., 2019). It is full of brine and beneath seismic stations S5 and S4. The thickness of the sediment deposit ranges from 8 to 36 m in this area. The underlying bedrocks are sandstone, mudstone, gypsum mudstone and salt, respectively (Figure 1C). The salt formations in the basin are buried continuously at depths of ∼300–600 m. Solution mining is the process of extracting soluble minerals. Fresh water is injected from the injection well and the brine is extracted from the extraction well which is called the dual-well convection. As a result, the caverns continuously grow as the salt is dissolved (Figure 2B). When the soluble minerals are mined, salt cavities will be formed and become larger, which may induce surface collapse hazards. Accompanied by mining, many physical processes like fracturing in the roof and debris hitting the floor may produce microseismic signals which can be received by our surface microseismic monitoring system.
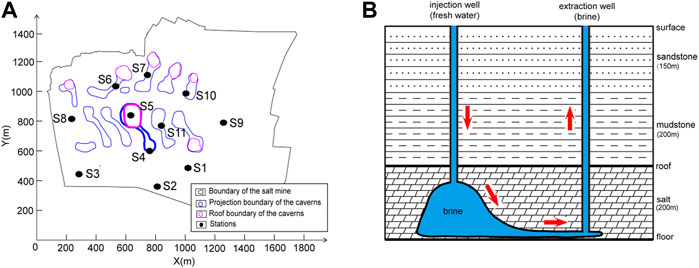
FIGURE 2. (A) Map showing the distribution of 11 seismic stations (black dots) and solution caverns (enclosed areas). The red and blue lines represent the roof and floor boundaries of the caverns, respectively, which are derived from the 3D active seismic imaging. The cavity with thickened lines is the cavern C1. (B) Layout diagram illustrating the dual-well solution mining. The cavern is full of the brine.
With 7 months of observation, we have detected many signals including natural earthquake signals and microseismic signals in the salt mine with the standard STA/LTA algorithm (Allen, 1978). In these waveforms, we detected a new kind of microseismic signal consisting of two parts, which is for the first time observed for solution salt mining. The first part of the paired signal is a long-duration signal of about 15 s. The second part is a short duration signal. The separation between two signals ranges from 30 to 90 s (Figure 3). The durations of the two parts are different and the first one is longer than the second one. From May 2017 to November 2017, there are a total of 88 distinct paired signals with these characteristics and they are randomly distributed at any time of the day.
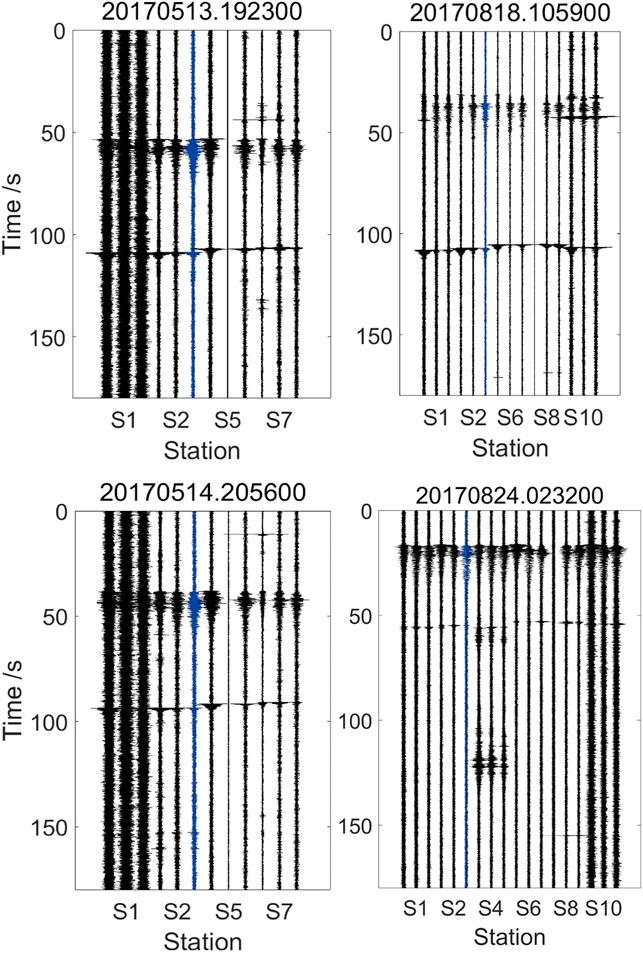
FIGURE 3. Four examples of paired signals having the window length of 180 s. The title of each waveform is the UTC time for the beginning time of the record. The horizontal coordinate is the station number and three channels for each station are shown.
To further compare these two parts of the paired signals, we analyze their time-frequency properties and initial motions. From the time frequency analysis of the vertical (Z) component of the seismic data, we can find that the frequency content of the first part of the paired signal is below 40 Hz, and it decreases gradually. In comparison, the frequency of the second part of the signal concentrates below 10 Hz (Figure 4). The initial motions of the first signal are random but the initial motions of the second signal are moving downward in the vertical direction (Figure 5). Usually, the second signal waveform has a narrow frequency band (Figure 6). These characteristics are ubiquitous in our 88 paired signals.
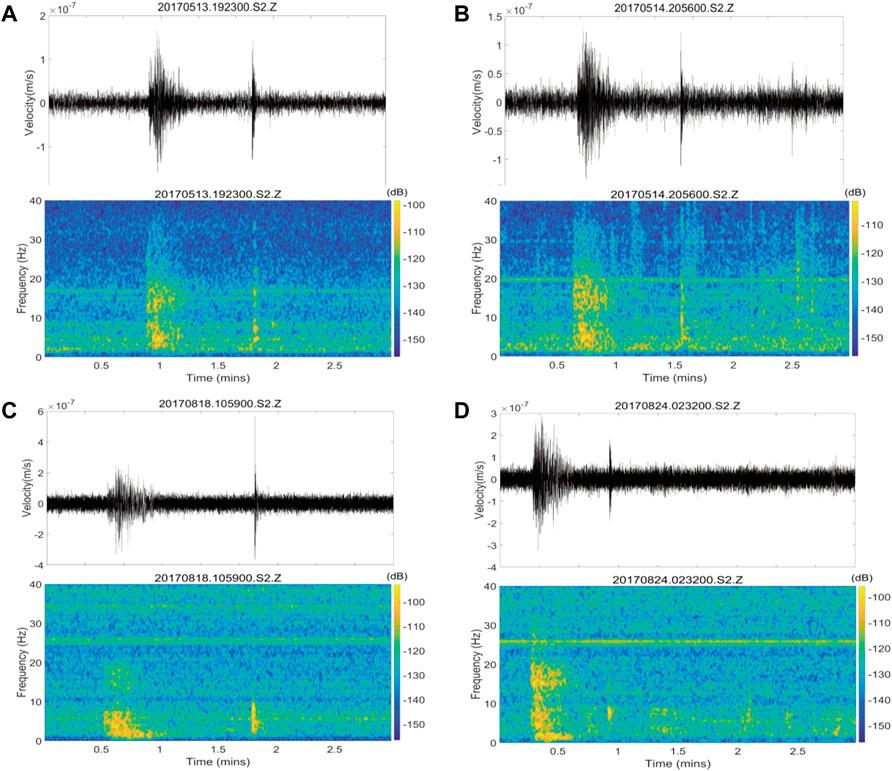
FIGURE 4. Time frequency analysis of the Z-component of the four paired signals at station S2. The top one is the waveform and the bottom one is the time frequency spectrogram of the corresponding waveform. (A) The paired signal on 13 May 2017, 19:23:00 UTC. (B) The paired signal on 14 May 2017, 20:56:00 UTC. (C) The paired signal on 18 August 2017, 10:59:00 UTC. (D) The paired signal on 24 August 2017, 02:32:00 UTC.
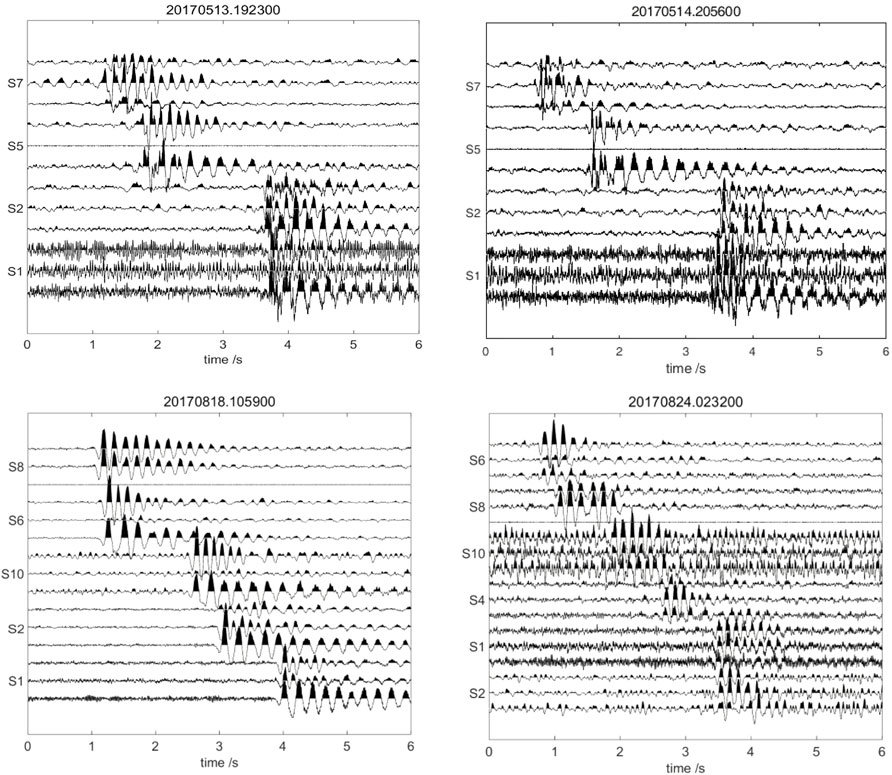
FIGURE 5. The second event waveforms for four paired signals in Figure 3.
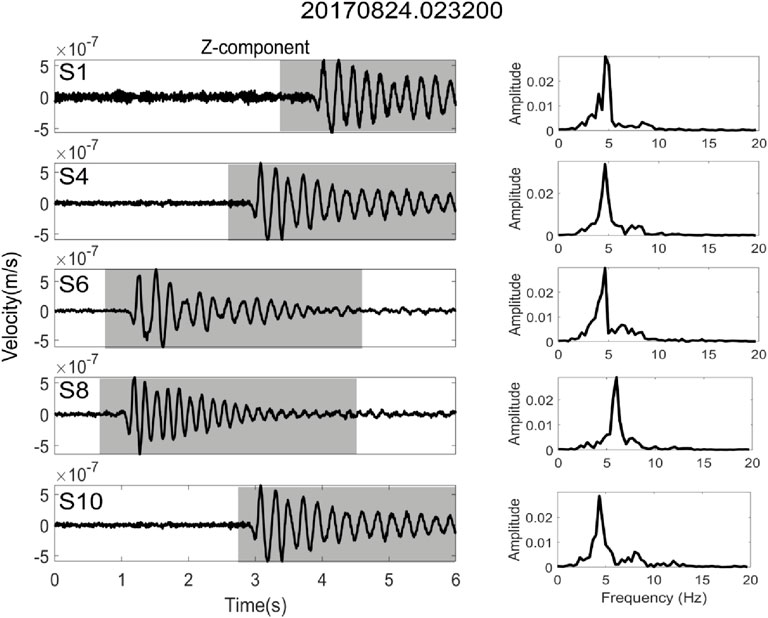
FIGURE 6. Zoom-in waveforms of the second event (left) and the corresponding frequency spectra (right) at five stations for the paired signal observed on 24 August 2017, 02:32:00 UTC. The frequency spectra are computed using the waveforms in the time windows marked by the grey rectangles.
Besides, there is a significant difference between these two parts. The travel time differences on different stations for the first signals are almost all less than one second, but the travel time differences on different stations for the second signals can be up to about 3 s (Figure 5). Usually the stations S6, S8, and S10 received the second signal earlier, and the stations S1 and S2 recorded the latest.
Event-pair double-difference earthquake location method, as incorporated in hypoDD (Waldhauser and Ellsworth, 2000), has been widely used in improving relative earthquake locations. One advantage of the double-difference location method is that the relative locations are less affected by velocity uncertainties because some common path anomalies outside the source region can be cancelled out due to similar ray paths. Similarly, station-pair differential arrival times from one event to pairs of stations can also be used to improve earthquake locations by cancelling out the event origin time and some path anomalies inside the source region (Zhang et al., 2010). To utilize advantages of both double-difference location methods, Guo and Zhang (2017) developed a double-pair double-difference location method using differential times constructed from pairs of events to pairs of stations.
We have relocated the first signals with the double-pair double-difference earthquake location algorithm (Guo and Zhang, 2017). We set the velocity model according to the lithology of the overburden (Figure 7A). The initial locations are constructed by grid search location method. After double-pair double-difference location, root mean square values for differential time residuals decrease from 64.59 to 30.26 ms (Figure 7B). Overall. The first microseismic signals are located around station S5 (Figure 8) where it is under mining.
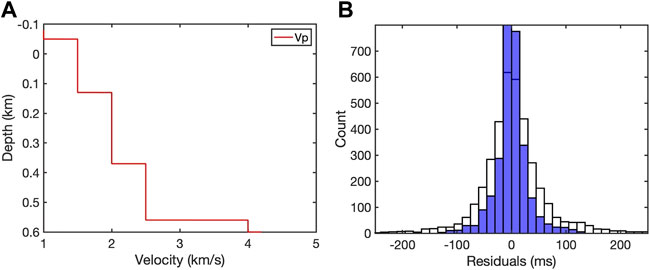
FIGURE 7. (A) P-wave velocity model used for location. (B) Histograms of travel time residuals before (white) and after (white) event relocation.
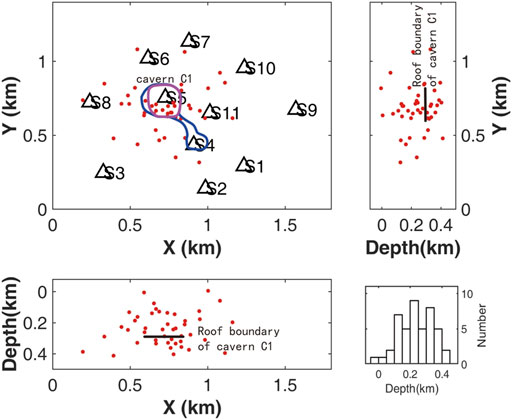
FIGURE 8. Distribution of event locations for the first events of the paired signals detected during the 7-month period, The events are located by the method of double-pair double-difference earthquake location algorithm (Guo and Zhang, 2017). The black triangles represent the seismic stations and the red dots represent the first events of paired signals.
The first event of the paired signal has a longer duration of ∼15 s and has a mixed frequency band of 5–30 Hz (Figure 4). It can be related to multiple fracturing processes on the cavern roof before the falling of a rock debris. Individual fracturing process on the roof can emit different microseismic signals and these signals can be mixed together. In addition, smaller fractures can coalesce to form larger fractures. As a result, the corresponding microseismic signals would have lower frequencies (Martínez-Martínez et al., 2016; Du et al., 2020). This crack generation and propagation process on the roof is consistent with the time-frequency characteristics of the first event with higher frequencies at the beginning and lower frequencies in the later part. The cotransport of heavy metals and particles by seepage on the roof will affect the generation of the first event (Bai et al., 2021). This type of microseismic signal corresponding to a series of fracturing processes before the detachment of a debris from the roof has also been found in other solution salt mining (e.g., Kinscher et al., 2014).
When the rock debris is detached from the roof, it can collide with the bottom or the floor of the cavern, which could also produce seismic signals. The second part of the paired signal is consistent with this collision process. First, the signal resulting from collision is expected to be short and actually the duration of the second part of the paired signal is only ∼3 s. Second, for the signal produced by the collision, its initial motion polarity should be negative in the vertical component because the equivalent force vector due to collision points upwards. When we check the polarities of the first arrivals of second events, most of them are clearly negative (Figure 5), consistent with this process. Based on the above analysis, we think the first event of the paired signal represents the fracture development and the detachment process for rock debris from the cavern roof, and the second event represents the collision between the debris and the cavern floor.
Kinscher et al. (2014) proposed that the process of fracturing development that could lead to the debris detachment on the cavity roof in the overlying Marl layer and the overburden can generate acoustic emissions. The microseismic signals may be isolated or tremor-like. However, he claimed that due to low energy released by the impacts of falling blocks on the cavity floor, the related signals may not be detectable by the seismic instruments. If the floor is covered by the heavy mud layer, most energy of the collision will be attenuated and absorbed. In our case, we clearly detect the collision signals, indicating the floor is not covered by the heavy mud layer that could act as a cushion for the falling debris.
For the paired signal, the separation time between two events ranges from ∼30 to ∼90 s (Figure 3), which should correspond to the travel time for the debris through the brine. The delay times between two signals should be controlled by the shape and density of debris and viscosity of the brine. By assuming the debris has a circular shape, we can roughly estimate the falling-velocity of the rock debris (w) in the brine as follows (Ahrens, 2000),
where
The falling velocity of the rock debris in the brine varies from a few meters per 10 s to a few meters per second which depends on the shape and size of the debris, the density of the rock and the temperature of the brine (Figure 9C). The solution is saturated brine which determines the density of the brine and the kinematic viscosity of brine. These two values play an important role in determining the falling velocity of the rock debris. The ambient temperature and the hydraulic and thermal conductivity of geotechnical media also play a role in determining the falling velocity (Bai et al., 2022). Here we set the brine temperature as 40°C, density ρ as 1,200 kg/m3, kinematic viscosity of brine v = 1.9858e-6 m2/s, and the block density ρs = 2,700 kg/m3.
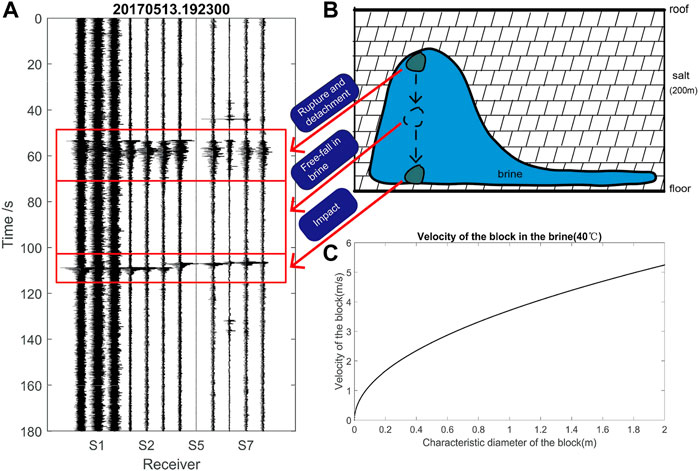
FIGURE 9. Cartoon showing the mechanism of the observed paired signals for solution salt mining. (A) The paired signals observed at different stations. (B) The cartoon showing the physical process producing paired signals. (C) The velocity of the falling bock from the roof through the brine estimated using Eq. 1.
In our case, the cavern has the height of about 200 m. Based on the estimated falling velocity, the rock debris will spend dozens of seconds to fall onto the cavern floor, which is consistent with our observations. Therefore, in theory, the time interval between two events of paired signal could be used to characterize the height of the cavern.
It is noted that the first event of the paired signal has travel time differences within 1 s at different seismic stations. In comparison, the travel time differences for the second event of the paired signal are much larger. This is mainly because the first event of the paired signal travels through the media above the cavern roof and its shallower layers and seismic velocities may not change greatly. In comparison, for the second event of the paired signal, they need to travel through some cavities filled with brine and seismic velocities may vary greatly in space. As a result, the travel times to different stations will differ at a larger degree. This also makes it difficult to locate the second event of the paired signal because the velocity heterogeneity is very large and accurate velocity model is difficult to obtain. In comparison, we can more accurately locate the first events with the double-pair double-difference earthquake location algorithm (Guo and Zhang, 2017), which is less sensitive to velocity heterogeneities. It can be seen that these events are mostly located around cavern C1 below station S5 (Figure 8). These events extend a relatively large depth range of ∼200 m. On one hand, this may reflect the fact that cavern roof has varying heights. On the other hand, this could be due to location uncertainties due to inaccurate arrival time picks and velocity models used for location.
In addition to paired signals, we also observed signals similar to the first event of the paired signal but without the second part (Figure 10). This could be because the corresponding rock debris is too small so that the collision cannot produce enough energy to be detected by geophones. Or it could be because the cavern floor is covered by heavy mud materials so that the collision energy is absorbed and attenuated. It could also be due to the fact that there are some fractures created in the roof due to the roof instability but without debris falling. Observing the distinct second part depends on the size of the fallen blocks and the lithological characters of the fallen blocks and the cavern floor. Only relatively huge and hard blocks and relatively hard floor of the cavern can produce obvious collision signals.
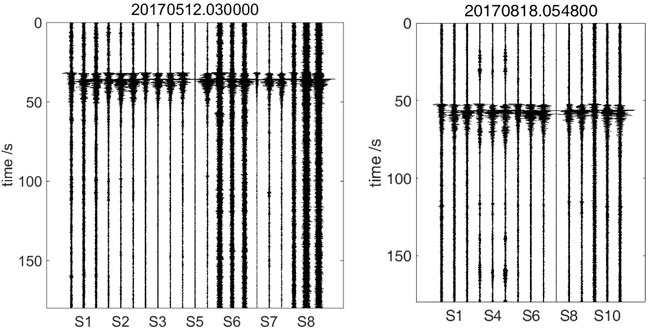
FIGURE 10. Two examples of signals similar to the first part of the paired signals but without the second part having the window length of 180 s. The title of each waveform is the UTC time for the beginning time of the record. The horizontal coordinate is the station number and three channels for each station are shown.
By using a surface microseimic monitoring system for the Dongxing salt mine located in Dongxing county, China, for the first time we have observed paired signals that are induced by cavern roof instability. The first event of the paired signal has a longer duration, which is caused by a series of crack generation and propagation on the cavern roof before the debris detachment from the roof. The second event of paired signal is associated with the collision between the fallen debris and the cavern floor. The time delay between two events of paired signal corresponds to the falling time of the debris through brine. Therefore, by using the paired signal we can better understand the whole process of fracturing development on the cavern roof before the rock debris starts to fall, the time for the debris falling through the brine, and the collision of the debris on the cavern floor.
By using paired signals, it is helpful for better understanding the cavern roof instability status and thus assessing the cavern collapse hazard. By locating the first event of paired signals, we can delineate the spatial distribution of cavern roof. The delay time between two events of paired signals can be used to qualitatively estimate the height of the cavern. The observation of collision signal could be used to derive the size of the rock debris through some further analysis. The derived information could be combined to assess the cavern collapse hazard through some rock mechanics analysis.
The original contributions presented in the study are included in the article/supplementary material, further inquiries can be directed to the corresponding author.
JQ and KW: methodology, software, data curation, writing—original draft. HZ: supervision, writing-review and editing, funding acquisition. YT: data curation. CX, QW, and QX: funding acquisition, project administration. MM: writing-review and editing. All authors contributed to the article and approved the submitted version.
This work is a part of the joint Polish-Chinese FULLIMAGE project, which received funding in the SHENG call from National Natural Science Foundation of China (NSFC) under grant no. 41961134001 and the Polish National Science Centre (NCN) under grant no. UMO-2018/30/Q/ST10/00680 the National Natural Science Foundation of China under grants U2139204 and the Fundamental Research Funds for the Central Universities under grant WK2080000153.
The authors declare that the research was conducted in the absence of any commercial or financial relationships that could be construed as a potential conflict of interest.
All claims expressed in this article are solely those of the authors and do not necessarily represent those of their affiliated organizations, or those of the publisher, the editors and the reviewers. Any product that may be evaluated in this article, or claim that may be made by its manufacturer, is not guaranteed or endorsed by the publisher.
Ahrens, J. P. (2000). A fall-velocity equation. J. Waterw. Port. Coast. Ocean. Eng. 126 (2), 99–102. doi:10.1061/(asce)0733-950x(2000)126:2(99)
Allen, R. V. (1978). Automatic earthquake recognition and timing from single traces. Bull. Seismol. Soc. Am. 68 (5), 1521–1532. doi:10.1785/bssa0680051521
Bai, B., Nie, Q., Zhang, Y., Wang, X., and Hu, W. (2021). Cotransport of heavy metals and SiO2 particles at different temperatures by seepage. J. Hydrology 597, 125771. doi:10.1016/j.jhydrol.2020.125771
Bai, B., Wang, Y., Rao, D., and Bai, F. (2022). The effective thermal conductivity of unsaturated porous media deduced by pore-scale SPH simulation. Front. Earth Sci. (Lausanne). 1057. doi:10.3389/feart.2022.943853
Berest, P., Brouard, B., Feuga, B., and Karimi-Jafari, M. (2008). The 1873 collapse of the Saint-Maximilien panel at the Varangeville salt mine. Int. J. Rock Mech. Min. Sci. 45 (7), 1025–1043. doi:10.1016/j.ijrmms.2007.10.007
Cook, N. (1963). “The seismic location of rockbursts,” in Proceedings of the fifth rock mechanics symposium (Pergamon Press), 463, 516.
Dahm, T., Heimann, S., and Bialowons, W. (2011). A seismological study of shallow weak micro-earthquakes in the urban area of Hamburg city, Germany, and its possible relation to salt dissolution. Nat. Hazards (Dordr). 58 (3), 1111–1134. doi:10.1007/s11069-011-9716-9
Das, I., and Zoback, M. D. (2011). Long-period, long-duration seismic events during hydraulic fracture stimulation of a shale gas reservoir. Lead. Edge 30 (7), 778–786. doi:10.1190/1.3609093
Du, K., Li, X., Tao, M., and Wang, S. (2020). Experimental study on acoustic emission (AE) characteristics and crack classification during rock fracture in several basic lab tests. Int. J. Rock Mech. Min. Sci. 133, 104411. doi:10.1016/j.ijrmms.2020.104411
Eaton, D., van der Baan, M., Tary, J. B., Birkelo, B., Spriggs, N., Cutten, S., et al. (2013). Broadband microseismic observations from a Montney hydraulic fracture treatment, northeastern BC, Canada. Ele 1150 (1200), 1250.
Ege, J. R. (1984). Mechanisms of surface subsidence resulting from solution extraction of salt. Man-induced land subsidence. Geol. Soc. Am. Rev. Eng. Geol. 6, 203–221.
Ellsworth, W. L., Horton, S., Benz, H., Hickman, S., Leeds, A., Leith, W. S., and Herrmann, R. B. (2012). Tremors in the bayou: The events on the napoleonville salt dome, Louisiana. San Francis, CA: AGUFM, S51E–S2453.
Ge, M. (2005). Efficient mine microseismic monitoring. Int. J. Coal Geol. 64 (1-2), 44–56. doi:10.1016/j.coal.2005.03.004
Guo, H., and Zhang, H. (2017). Development of double-pair double difference earthquake location algorithm for improving earthquake locations. Geophys. J. Int. 208, 333–348. doi:10.1093/gji/ggw397
Gutiérrez, F., Parise, M., De Waele, J., and Jourde, H. (2014). A review on natural and human-induced geohazards and impacts in karst. Earth-Science Rev. 138, 61–88. doi:10.1016/j.earscirev.2014.08.002
Jousset, P., and Rohmer, J. (2012). Evidence for remotely triggered microearthquakes during salt cavern collapse. Geophys. J. Int. 191 (1), 207–223. doi:10.1111/j.1365-246x.2012.05598.x
Kinscher, J., Bernard, P., Contrucci, I., Mangeney, A., Piguet, J. P., and Bigarre, P. (2014). Location of microseismic swarms induced by salt solution mining. Geophys. J. Int. 200 (1), 337–362. doi:10.1093/gji/ggu396
Kinscher, J., Cesca, S., Bernard, P., Contrucci, I., Mangeney, A., Piguet, J. P., et al. (2016). Resolving source mechanisms of microseismic swarms induced by solution mining. Geophys. J. Int. 206 (1), 696–715. doi:10.1093/gji/ggw163
Lebert, F., Bernardie, S., and Mainsant, G. (2011). Hydroacoustic monitoring of a salt cavity: An analysis of precursory events of the collapse. Nat. Hazards Earth Syst. Sci. 11 (9), 2663–2675. doi:10.5194/nhess-11-2663-2011
Liu, W., Zhang, Z., Chen, J., Jiang, D., Wu, F., Fan, J., et al. (2020). Feasibility evaluation of large-scale underground hydrogen storage in bedded salt rocks of China: A case study in jiangsu province. Energy 198, 117348. doi:10.1016/j.energy.2020.117348
Liu, X., Xing, X., Wen, D., Chen, L., Yuan, Z., Liu, B., et al. (2019). Mining-induced time-series deformation investigation based on SBAS-InSAR technique: A case study of drilling water solution rock salt mine. Sensors 19 (24), 5511. doi:10.3390/s19245511
Martínez-Martínez, J., Fusi, N., Galiana-Merino, J. J., Benavente, D., and Crosta, G. B. (2016). Ultrasonic and X-ray computed tomography characterization of progressive fracture damage in low-porous carbonate rocks. Eng. Geol. 200, 47–57. doi:10.1016/j.enggeo.2015.11.009
Mercerat, E. D., Driad-Lebeau, L., and Bernard, P. (2010). Induced seismicity monitoring of an underground salt cavern prone to collapse. Pure Appl. Geophys. 167 (1-2), 5–25. doi:10.1007/s00024-009-0008-1
Nayak, A., and Dreger, D. S. (2014). Moment tensor inversion of seismic events associated with the sinkhole at Napoleonville salt dome, Louisiana. Bull. Seismol. Soc. Am. 104 (4), 1763–1776. doi:10.1785/0120130260
Schléder, Z., Urai, J. L., Nollet, S., and Hilgers, C. (2008). Solution-precipitation creep and fluid flow in halite: A case study of zechstein (Z1) rocksalt from neuhof salt mine (Germany). Int. J. Earth Sci. 97 (5), 1045–1056. doi:10.1007/s00531-007-0275-y
Trifu, C. I., and Shumila, V. (2010). Microseismic monitoring of a controlled collapse in field II at ocnele mari, Romania. Pure Appl. Geophys. 167 (1-2), 27–42. doi:10.1007/s00024-009-0013-4
Waldhauser, F., and Ellsworth, W. L. (2000). A double-difference earthquake location algorithm: Method and application to the northern Hayward fault, California. Bull. Seismol. Soc. Am. 90 (6), 1353–1368. doi:10.1785/0120000006
Waltham, T., Bell, F. G., Culshaw, M. G., Knez, M., and Slabe, T. (2005). Sinkholes and subsidence: Karst and cavernous rocks in engineering and construction. Berlin: Springer.
Xing, X., Zhu, Y., Yuan, Z., Xiao, L., Liu, X., Chen, L., et al. (2021). Predicting mining-induced dynamic deformations for drilling solution rock salt mine based on probability integral method and weibull temporal function. Int. J. Remote Sens. 42 (2), 639–671. doi:10.1080/01431161.2020.1813345
Xiong, Q., Yuan, X., and Gu, H. (2019). Application of 3D seismic exploration on the detection of shape of salt cavity and the integrity of overlying strata. Chin. J. Eng. Geophys. 16 (3), 266–272.
Zhang, G., Wang, Z., Wang, L., Chen, Y., Wu, Y., Ma, D., et al. (2019). Mechanism of collapse sinkholes induced by solution mining of salt formations and measures for prediction and prevention. Bull. Eng. Geol. Environ. 78 (3), 1401–1415. doi:10.1007/s10064-017-1173-6
Zhang, G., Wang, Z., Zhang, K., Li, Y., Wu, Y., Chen, Y., et al. (2018). Collapse mechanism of the overlying strata above a salt cavern by solution mining with double-well convection. Environ. Earth Sci. 77 (16), 588. doi:10.1007/s12665-018-7739-1
Zhang, H., Nadeau, R. M., and Toksoz, M. N. (2010). Locating nonvolcanic tremors beneath the San Andreas fault using a station‐pair double‐difference location method. Geophys. Res. Lett. 37 (13). doi:10.1029/2010gl043577
Keywords: induced seismicity, paired signals, solution salt mining, cavern roof stability, fracturing
Citation: Qian J, Wang K, Zhang H, Tan Y, Xu C, Wang Q, Xiong Q and Malinowski M (2022) First observation of paired microseismic signals during solution salt mining. Front. Earth Sci. 10:952314. doi: 10.3389/feart.2022.952314
Received: 24 May 2022; Accepted: 25 August 2022;
Published: 12 September 2022.
Edited by:
Wenzhuo Cao, Imperial College London, United KingdomReviewed by:
Bing Bai, Beijing Jiaotong University, ChinaCopyright © 2022 Qian, Wang, Zhang, Tan, Xu, Wang, Xiong and Malinowski. This is an open-access article distributed under the terms of the Creative Commons Attribution License (CC BY). The use, distribution or reproduction in other forums is permitted, provided the original author(s) and the copyright owner(s) are credited and that the original publication in this journal is cited, in accordance with accepted academic practice. No use, distribution or reproduction is permitted which does not comply with these terms.
*Correspondence: Haijiang Zhang, emhhbmcxMUB1c3RjLmVkdS5jbg==
†These authors have contributed equally to this work
Disclaimer: All claims expressed in this article are solely those of the authors and do not necessarily represent those of their affiliated organizations, or those of the publisher, the editors and the reviewers. Any product that may be evaluated in this article or claim that may be made by its manufacturer is not guaranteed or endorsed by the publisher.
Research integrity at Frontiers
Learn more about the work of our research integrity team to safeguard the quality of each article we publish.