- 1Department of Basic Teaching, Liaoning Technical University, Huludao, China
- 2School of Software, Liaoning Technical University, Huludao, China
- 3Graduate School, Liaoning Technical University, Fuxin, China
- 4School of Resources and Civil Engineering, Northeastern University, Shenyang, China
- 5School of Mechanics and Engineering, Liaoning Technical University, Fuxin, China
Through piecewise linearization, the control equation of gas migration in coal is simplified to a parabolic differential equation with time-dependent source terms, and under the corresponding initial conditions, boundary and additional conditions are used to obtain a definite solution to the unknown source function identification of the parabolic differential equation. A triaxial gas migration experimental device to measure the axial gas pressure of a specimen is independently developed, and a gas migration test of coal samples is performed. With the use of the fundamental equation solution, by substituting the definite solution conditions obtained in the experiment, the above equation is discretized into a system of linear equations, the Tikhonov regularization method and generalized cross-validation (GCV) method are employed to solve the obtained ill-conditioned linear system of equations, and the diffusion source functions in the seepage equation are identified. The results suggest that the unknown function identification method for the differential equation, which avoids measurement and analysis of the pore and fissure structures of coal samples, accurately and directly obtains the change trend of desorption–diffusion sources in the process of gas seepage and provides a new idea for the study of the coal seam gas migration process.
1 Introduction
Gas, as a concomitant component in the process of coal carbon generation, is a major factor threatening the safe operation of coal mines and constitutes an efficient and clean energy source (Qian, 2010; Daggupati et al., 2011). The study of the occurrence state and migration mechanism of gas in coal seams is of great significance for the safe production and rational utilization of resources and environmental protection in coal mines (Administration, N. E, 2016).
Coal is a complex porous medium comprising a coal matrix interwoven with a large network of pores and fissures (Zhou and Lin, 1999). The structure of pores and fissures in coal affects gas occurrence and migration and determines the mechanical properties of the coal matrix itself, which represents one of the important bases for studying the gas emission pattern and determining whether there exists a risk of coal and gas outbursts in the coal mining process (Li et al., 2013). In recent years, scholars worldwide have conducted much research on the scale and distribution pattern of coal pores and fissures via techniques such as Mercury porosimetry, scanning electron microscopy and computed tomography (CT), combined with image recognition and three-dimensional image reconstruction (Wang et al., 2008; He and Kusiak, 2018; Li H et al., 2021; Li H. J et al., 2021; Li et al., 2022), to obtain pore and fissure structures that are closer to the real structures in coal and to lay the foundation to examine the micro-mechanism and migration processes of coal seam gas migration (Wang, 2014; Cheng et al., 2018). However, these existing methods inevitably produce errors in the measurement and calculation of pore and fissure structures, among the fluid immersion methods such as Mercury intrusion, low-temperature nitrogen adsorption, and carbon dioxide adsorption, the damage to coal samples during the measurement process is often irreversible, and the requirements for the experimental conditions and experimental equipment are very high. Additionally, due to the heterogeneity of coal, the obtained numerical simulation model often reflects the structure of a real coal sample after homogenization, and simulation accuracy improvement is accompanied by a high computational cost.
Although various studies have been conducted, the criteria for the classification of pore-scale structures are not completely unified (Fu et al., 2005; Dong, 2018), although there exists a basic consensus that gas occurs in different forms, and the migration methods also differ between pores and fractures of different scales (Liang et al., 1996; Li et al., 2007). In the process of coal mining, with stress release in a given mining seam, free-state gas in fissures flows into the mining well (borehole) driven by the gas pressure, and this process is accompanied by a decrease in gas pressure in the fissures. The change in pressure leads to desorption of adsorbed gas and its entry into fissures (seams) driven by the concentration gradient, which becomes the source of free-state gas seepage (Cui et al., 2021). The adsorbed gas contained in the coal seam, through desorption, diffusion, seepage and finally discharge from the mining well (hole), undergoes gas adsorption, desorption, diffusion and seepage processes and various occurrence states and migration mechanisms, which entails complex physical and chemical processes (Cheng et al., 2017; Zhou et al., 2021). To describe this complex migration process, scholars worldwide have performed much research based on the assumption of a continuous medium, from an initial single-hole model gradually transitioning to a double-hole model (Barenblatt et al., 1960) to the development of a multi-pore model, based on which a variety of mathematical and physical models have been established (Wu and Guo, 1999; Peng et al., 2014; Lin et al., 2018; Liu et al., 2018; Liu, 2021). With increasing accuracy of model simulations, in addition to an increase in the computational cost, the problem of accurate acquisition of numerous physical parameters must be considered.
The dual-medium model can well describe the pore–fissure structure of coal seams and the desorption-diffusion-seepage process of gas. Therefore, to mechanistically model the gas flow process in a coal seam, the dual-porosity medium model remains the most widely used model. In this paper, based on this assumption, the effect of diffusion on seepage is reflected by an unknown source function on the right side of the gas seepage equation for coal. To obtain the initial and boundary values and additional conditions required to identify the unknown source function on the right side of the above equation, we independently develop a triaxial permeation test device for axial pore pressure measurement, use the fundamental solution to the equation and experimental data under definite solution conditions to identify the unknown diffusion source function on the right side of the equation with the Tikhonov regularization method and generalized cross-validation (GCV) method (Yan, 2011), which can identify the unknown diffusion source function on the right side of the equation, realize the study of the effect of coal seam gas diffusion on seepage without measuring the pore and fissure structures of coal samples, and provide a new idea for the establishment of a fluid–solid coupling model to study the gas migration process in coal seams.
2 Mathematical model of coal seam gas migration
2.1 Pore-fracture dual medium assumption
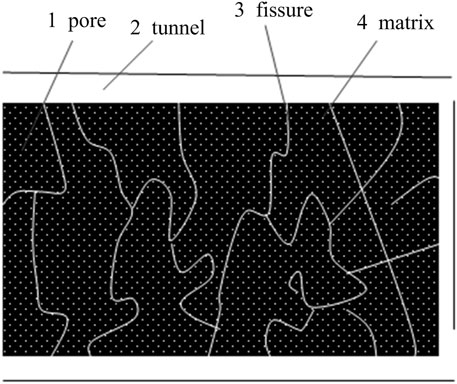
A schematic diagram of a dual-porosity medium is shown in Figure 1, and this study is based on the following assumptions:
(1) Coal is a continuous porous medium consisting of a coal matrix containing an extensive coal matrix and a complex fissure network.
(2) Gas occurs in the adsorbed state in the micro-pores of the coal matrix, and the migration mode is diffusion driven by the concentration gradient, while gas occurs in the free state in fissures. Moreover, the migration mode is seepage driven by the pressure gradient.
(3) Instantaneous desorption of adsorbed gas, under the influence of the concentration gradient, into fissures via diffusion functions as a source–sink supplement for gas seepage into the fissures.
(4) The free-state gas occurring in fissures and macro-pore seepage is driven by the pressure gradient, with seepage conforming to Darcy’s law.
(5) The free-state gas is compressible, and the density satisfies the following:
2.2 Basic control equation of coal seam gas migration
Assuming that gas in coal consists of both free and adsorbed gas, the change in gas mass per unit time in a control unit body is attributed to a combination of seepage of free gas and desorption–diffusion of adsorbed gas, as follows:
Considering the compressibility of free gas, Eq. 1 can be rewritten as follows Eq. 3:
Assuming that the variation in the concentration of adsorbed gas in the pore space conforms to the Langmuir equation (Cheng et al., 2017), the variation can thus be denoted as:
Eq. 2 can be rewritten as follows Eq. 5:
where
Therefore, the following can be obtained:
Under isothermal conditions, Eq. 6 can be rewritten as follows Eq. 7:
Eq. 7 can be transformed into the following form expressed as a function of the compression factor (Kong, 1999):
where
2.3 Basic model simplification
Through analysis, the basic control equation of gas migration in coal is a differential equation Eq. 8:
Considering the compressibility of gas and the change in porosity, even when the permeability remains constant, the equation is a complex differential equation with many undetermined parameters of the pore pressure p, which is difficult to mathematically solve. Studies have indicated that in general, under the premise of maintaining the applied load unchanged, the permeability should also be a function of the pore pressure p (Lv et al., 2018), resulting in the following equation:
Considering the difficulty of measuring the desorption–diffusion term in the migration process, the desorption–diffusion term in the migration process is shifted to the right side of the equation and expressed as a time-dependent function Eq. 9 can be rewritten as Eq. 10:
In the migration test, the axial pressure of the specimen gradually changes, but the change process is slow. Therefore, the density, porosity, compression coefficient, compression factor and permeability of gas in the specimen are considered constants with respect to the average pore pressure within a short period, and in the case of a very low pressure gradient, the effect of the squared term of the pressure gradient is neglected, and Eq. 10 can thus be simplified as:
where
Then, the above equation can be re-written as follows Eq. 12:
The above equation is a parabolic differential equation with a time-dependent source term, where the source function on the right side reflects the effect of diffusion on seepage and is an unknown function. Regarding this equation, under appropriate initial and boundary conditions and additional conditions, the following model can be obtained:
To solve the above model, it is necessary to consider the initial and boundary conditions and additional conditions, for which helium penetration and gas migration tests of coal were designed. The specific test design operations and results are described in Section 4.
3 Identification of the unknown original function of the parabolic differential equation
3.1 Dimensionless model
To identify the unknown source functions of the model via numerical methods, the established model must be dimensionless, and the process is described below.
The reference pressure is denoted as P, the reference length is denoted as X, and the reference time is denoted as T, which yields the following:
The above can be written as:
Substituting Eq. 14 into Model 12, a dimensionless model can be obtained, as expressed with the following equation:
Combined with the definite solution conditions after dimensionless loading, a problem with a definite solution is obtained after dimensionless loading, as expressed in Eq. 15.
where.
3.2 Determination steps for the model
After dimensionless processing of the model, the unknown source functions of the model can be identified. The specific steps are as follows:
(1) In regard to the non-homogeneous parabolic differential equation in Eq. 15 containing time-dependent source terms, the following can be obtained through variable substitution:
Transforming the above equation into a parabolic differential equation with respect to the new variables and accordingly converting the fixed solution conditions of Eq. 15, the problem is transformed as follows:
(2) The basic solution of the parabolic differential equation Eq. 17 is obtained as:
A total of
where
(3) If Eq. 19 yields a solution to the definite-solution problem Eq. 17, the former must also satisfy the corresponding definite solution conditions. Choosing the corresponding number of matching points in the studied area, the corresponding definite solution conditions are substituted, and the equation can be written as:
Then, the following system of linear equations is obtained:
(4) Singular value decomposition of the coefficient matrix of the above ill-conditioned linear system of equations Eq. 21 is performed, and the decomposition is denoted as:
(5) Based on singular value decomposition of the coefficient matrix, using the Tikhonov regularization method and introducing the regular filter operator, the standard regular solution of Eq. 21 is:
where constant α is the regularization parameter to be determined.
(6) With the use of the GCV method, the regularization parameter α is determined according to Eq. 22, and in turn, a solution to the fixed-solution problem Eq. 17 can be obtained according to Eq. 20 and Eq. 21.
(7) According to the solution obtained in Step (6), combined with the boundary conditions defined in Eq. 17, we obtain:
Therefore:
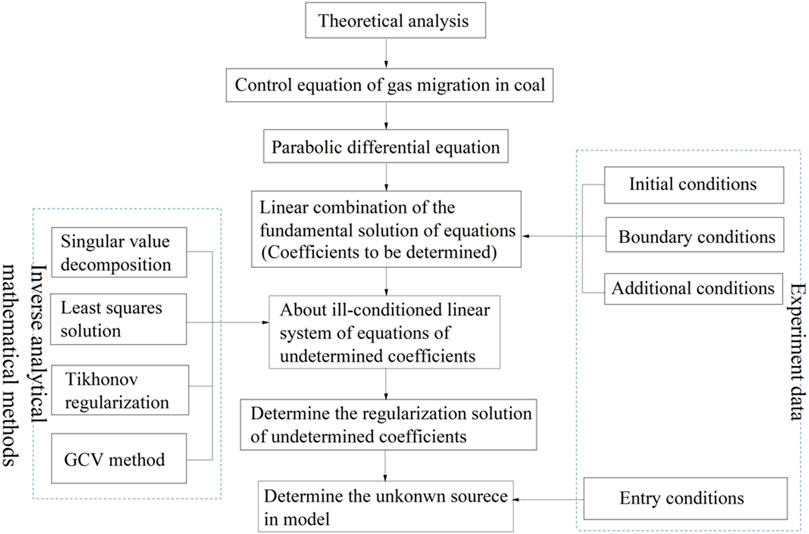
Regarding the gas migration definite-solution problem Eq. 13 established in Section 2.2, which reflects the effect of diffusion on seepage, this paper uses the method depicted in Figure 2 to solve this problem and finally identifies the time-dependent unknown source functions in the model.
3.3 Assessment method for the identified unknown source functions
Regarding Eq. 13, let its analytical solution be:
Then, the source function is:
Substituting the initial conditions, boundary conditions and additional conditions obtained from Eq. 23 into the method described in this paper, the calculated source is compared to the theoretical source, as shown in Figure 3.
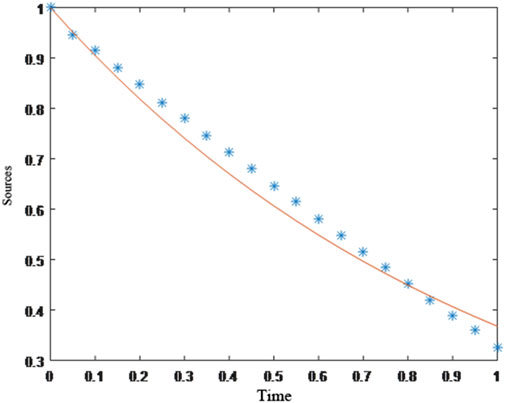
FIGURE 3. Comparison of the theoretical and computed sources. Note: “*” indicates the source value determined according to the method in this paper, and “-” indicates the theoretical value of the source.
As shown in Figure 3, with the basic solution of the equation, the Tikhonov regularization and GCV methods, typically employed to determine regular parameters, can effectively and accurately solve the unknown sources to be identified in the model. Moreover, it has been verified that the method is effective not only for the identification of continuous unknown sources but is also for the identification of segmented unknown sources, and ideal results can be obtained for a certain range of perturbed data.
4 4 Gas migration experiment for pore pressure at measurable axial fixed points
To study the desorption-diffusion-seepage migration process of gas in coal and to provide initial boundary values and additional conditions to identify the unknown diffusion source functions in the basic control equation of gas migration, field samples were collected and processed into standard coal specimens. We performed triaxial loading in the laboratory to simulate the relevant stress conditions and arranged multiple observation points along the axial direction of the tested specimens to measure the change in pore pressure at the observed locations over time. Under the specified stress conditions, 48-h ventilation was performed to allow the specimens to fully adsorb gas, after which the inlet end was closed to simulate the diffusion–percolation process of gas under natural conditions. The gas that desorbed and diffused into fissures was considered the source in the seepage process.
4.1 Experimental device
To identify the unknown time-dependent source terms in the model, a triaxial gas migration test of coal specimens was conducted. In the test, the confining pressure of the specimens was controlled, and the gas pore pressures at the inlet, outlet, and additional points in the specimens, as well as the initial gas pore pressure, were measured. According to the need to characterize the model, an experimental scheme and experimental process were designed.
The main instruments used in the test included an improved ZYS-1 true-triaxial permeameter (gripper type with a pressure tap), manual pressure test pump, digital pressure gauge, six-way valve, energy accumulator, gas source cylinder, high-pressure regulating valves, pressure sensor, flow meter, DDS data acquisition system, computer, and high-pressure pipeline.
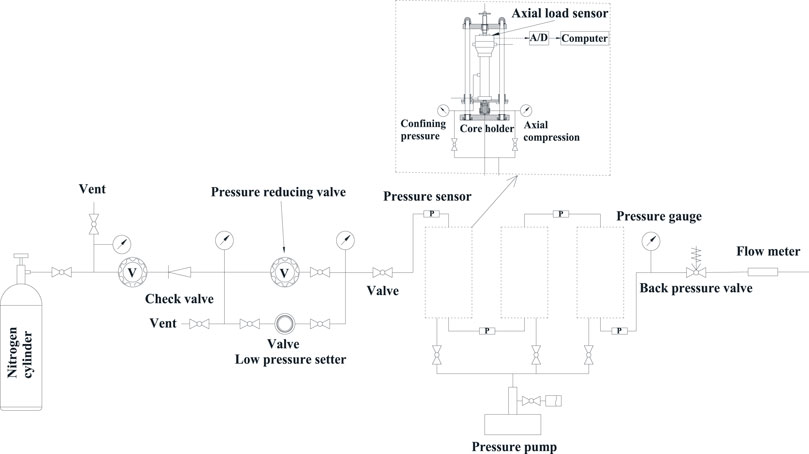
As shown in Figure 4, the test system consists of a coal sample pressure loading chamber, axial and confining pressure loading system, gas pore pressure loading system, voltage stabilization system, gas pressure measurement system and gas flow measurement system. The confining pressure of the coal sample is supplied by a manual pressure test pump, and the pressure is maintained constant after pressurization via the accumulator. The pore pressure is adjusted with high-pressure nitrogen gas through the gas pressure regulating valve to reach the required value. The pore pressure, confining pressure and axial pressure are measured with a high-precision digital pressure sensor, and the seepage gas flow value is measured with a flow meter.
4.2 Experimental scheme
The test uses coal briquette specimens processed from pulverized coal. Coal is pulverized and subsequently sieved using a hydraulic press according to the set water-coal ratio, and the mixture is poured into a mould and pressed into two groups of Ф 50 mm × 100 mm standard coal specimens with different porosities, as shown in Figure 5 The average porosity of the first group of samples is 6.55%, and the average porosity of the second group of samples is 6.65%.
The gas pore pressure in the coal specimen is used as a variable to study the source–sink effect of nitrogen in the adsorbed state in the specimen on seepage flow. By conducting migration tests of nitrogen in the coal specimens, the variation in nitrogen pressure over time at different positions along the axial direction of the specimens is measured, and the unknown source functions in the basic control equation of migration are then solved. Figure 6 shows the scene of the experiment.
(1) The confining pressure of the specimen was maintained constant at 8 MPa, and the temperature remained unchanged. The flow rate of nitrogen was measured under an inlet gas pressure of 3 MPa to calculate the specimen permeability.
(2) The confining pressure of the test specimen was maintained constant at 8 MPa, and the temperature remained constant. The inlet helium gas pressure was maintained at 3 MPa, and the outlet end was closed, after which gas was continuously supplied until the gas pressure at each measurement point within the specimen reached 3 MPa. The outlet valve was then opened after the inlet was closed, the gas pressure at each measurement point was measured with the pressure sensor, and the flow rate of helium gas was determined with the flow meter at the outlet end.
(3) The confining pressure of the specimen was maintained constant at 8 MPa, the temperature remained unchanged, the inlet nitrogen pressure was maintained at 3 MPa, and after adsorption reached equilibrium, the valve at the inlet end was closed, the nitrogen pressure at each pressure measurement point was measured with the pressure sensor, and the flow meter at the outlet end determined the flow of gas.
4.3 Experimental procedure
(1) The device was connected and ventilated, and the airtightness was evaluated.
(2) The air within the coal sample was evacuated with a vacuum pump to reduce the internal gas pressure to below 50 Pa.
(3) All valves of the confining pressure loading system were opened, the confining pressure chamber and the confining pressure accumulator of the loading-seepage-desorption chamber were slowly pressurized to 8 MPa, and the valves of the confining pressure loading system were closed.
(4) The valves of the high-pressure helium tank and the pressure reducing valve were opened, the outlet was closed, and the helium flow at the inlet end was determined with the flow meter until the helium pressure was increased to 3 MPa.
(5) The valve of the intake pipe was closed, the valve of the outlet end was opened, and the pressure measured by the gas pressure sensor and the flow rate measured by the flow meter at the inlet and outlet were recorded.
(6) Helium gas in the coal sample was evacuated with a vacuum pump to reduce the pressure in the sample to below 50 Pa.
(7) The valves of the high-pressure nitrogen tank and the pressure reducing valve were opened, the nitrogen pressure was increased to 3 MPa, the outlet was closed, the gas pressure remained unchanged, and the coal sample was allowed to fully adsorb nitrogen for 48 h.
(8) The valve of the inlet pipe was closed, the valve of the outlet end was opened, and the pressure measured by the gas pressure sensor and the flow rate measured by the flow meter at the inlet and outlet were recorded.
4.4 Experimental results and analysis
In the test, a pore pressure time series at the four measurement points (corresponding to pressures 1–4 from inlet to outlet) and flow time series at the inlet and outlet for the above two sets of specimens were obtained. Considering that the pore pressure at the fourth measurement point (outlet) approached the atmospheric pressure, which greatly differed from the pressure at the first three measurement points, as shown in Figure 7, pore pressure curves at the first three measurement points for the two groups of specimens were generated. Figure 7A corresponds to the first group of specimens, and Figure 7B corresponds to the second group of specimens.
As shown in Figure 7, under the test conditions, with increasing time, the pore pressure at each measuring point exhibited a decreasing trend, but the decreasing trend gradually stabilized. Moreover, from the inlet end to the outlet end, the pore pressure at the first three measuring points sequentially decreased, and the change trends of the two groups of specimens were basically the same.
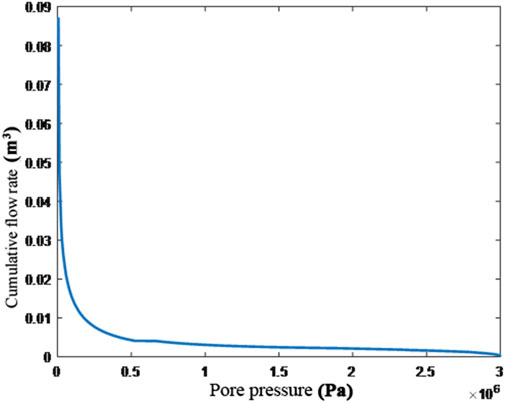
As shown in Figure 8, the curve of the cumulative flow rate with the pore pressure throughout the test (48 h) was smooth, and within a sufficiently short period, the relationship between these two variables agreed with a linear change trend.
A total period of 1800 s from 440 to 2,240 s after the start of the experiment was selected for analysis. The cumulative volume flow versus the pore pressure is shown in Figure 9 after the average time of each section was divided into three sections of 600 s.
The linear relationship between these two variables is suitable in each 600-s interval. In a subsequent study, the basic control equation of gas transport was linearized in segments, and the equation was simplified into a parabolic differential equation with a right-side nonlinear source term in shorter intervals after linearization. This treatment was reasonable based on the experimental results.
5 Model determination and analysis
5.1 Model determination
Considering the high change rate at the early stage of the test and gradual stabilization at the later stage, the first 2,400 s of the test results was divided into 300-s intervals, the period from 2,401 to 86,100 s was divided into 2700-s intervals, and the total test period was divided into 39 sections.
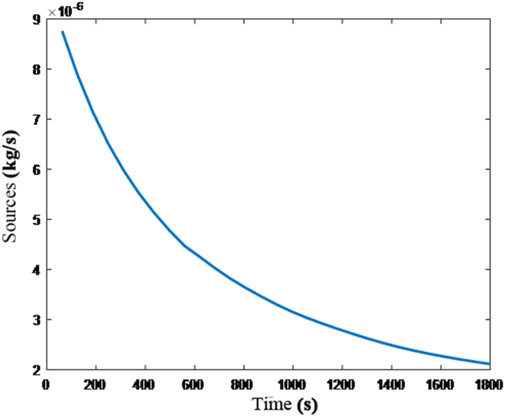
The result of Section four was substituted into the method of Section three, and a numerical solution to the undetermined right-side source function in Eq. 12 was subsequently obtained, as expressed in Eq. 24b. The calculation curve of the source function over time (600–2,400 s) is shown in Figure 10.
The above figure shows that the diffusion source exhibited a negative exponential variation over time during the study period. Although the mass of gas diffused per unit time gradually decreased over time, the decline rate of the gas mass increased over time and eventually stabilized, as shown in Figure 11. This trend is closely related to the change in pore pressure in the specimen. With decreasing pore pressure, the amount of desorbed gas gradually increased, but as the reduction rate of the pore pressure gradually increased and stabilized, the mass of desorbed gas in the coal specimen gradually increased over time, and the increase occurred gradually and finally stabilized.
Furthermore, the obtained source function was integrated over the entire period, and the cumulative mass of the gas source generated in the specimen during the test period was calculated as 3.440 × 10⁻³ kg.
The flow difference between the adsorbed nitrogen and non-adsorbed helium under the same test conditions could be considered a reference for the amount of gas desorption. By calculating the flow difference between nitrogen and helium under the same test conditions during the corresponding period, the amount of gas desorption was determined to be 3.425 × 10⁻³ kg.
The total diffusive mass of gas calculated based on the source integral obtained via inversion analysis agrees with the mass values obtained based on the cumulative flow rates of nitrogen and helium under the same test conditions, indicating that the diffusive source obtained with the method proposed in this paper is consistent with the actual situation.
Studies have indicated that under the same conditions, the seepage flow rate of adsorbed nitrogen gas is lower than that of helium gas at the stable seepage stage, indicating that adsorption could reduce the coal porosity, thereby affecting the gas permeability.
At the steady-state percolation stage, under the influence of the applied load and pore pressure, the permeation of adsorbed nitrogen under the same conditions was significantly lower than that of non-adsorbed helium, indicating that the adsorbed gas could alter the pore structure of the coal specimen, thus affecting the coal permeability. In the gas migration test, the flow of adsorbed nitrogen under the same conditions was higher than that of non-adsorbed helium, indicating that the migration of adsorbed gas in coal is the result of the combined effect of seepage and diffusion.
5.2 Identification of langmuir adsorption constants based on diffusion sources
When establishing a fluid–solid coupling model to describe the gas migration process in mining, the permeability function affected by the stress and pore pressure reflects the effect of coal adsorption on the gas permeability in coal, and the identified diffusion source function reflects the complementary effect of adsorbed gas on gas seepage in coal after the occurrence of desorption and diffusion due to the influence of mining.
Considering that the obtained diffusion source function via inversion analysis with time only represents an average quantitative description of the source for small specimens under test conditions, in the process of establishing a numerical model to simulate the coal seam gas migration process, a source function reflecting diffusion source variation with the pressure is needed. According to the variation trend shown in Figure 11, it was assumed that the diffusion source and pressure conform to the Langmuir equation, as expressed in Eq. 4:
This equation is a nonlinear function with two unknown parameters. According to Eq. 24b, the average pore pressure and corresponding desorption volume during different periods can be denoted as
With the use of a parameter inversion analysis system based on the GA (genetic algorithm) and Gauss–Newton synthesis algorithm, these two parameters are finally identified as:
Based on Eq. 11 and Eq. 26 obtained via inversion analysis, a coupled model of coal seam gas migration could be established to study the gas emission process of coal seam gas (Lv et al., 2018). The above research results provide a theoretical basis and reference for the establishment of a fluid–solid coupling numerical model to study the coal seam gas migration process.
5.3 Coupled analysis of coal seam gas migration
Based on the derived gas migration equation in coal, combined with the nonlinear seepage trend under stress–gas seepage coupling described in Section 3, a numerical model considering gas adsorption-desorption and stress-gas seepage coupling in coal was established.
(1) Coal deformation equation (Lv, 2021)
(2) Gas migration equation
(3) Coupling equation (Lv, 2021)
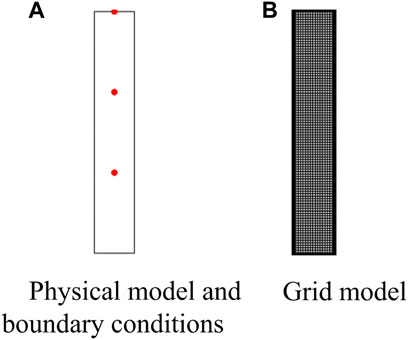
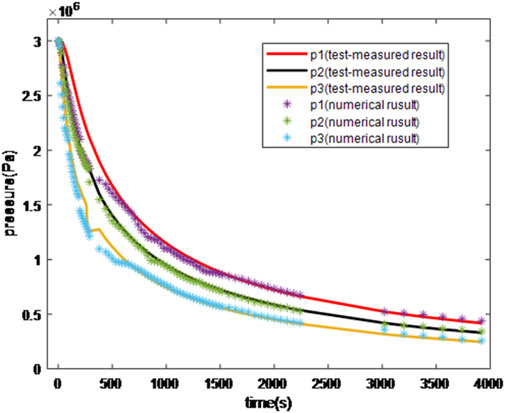
According to the experiment, a physical model with a length of 300 mm and a width of 50 mm was established, and the specific boundary and mesh divisions are shown in Figure 12. After calculation, the pore pressure at the first three measurement points could be obtained, and the test-measured pore pressure is shown in Figure 13.
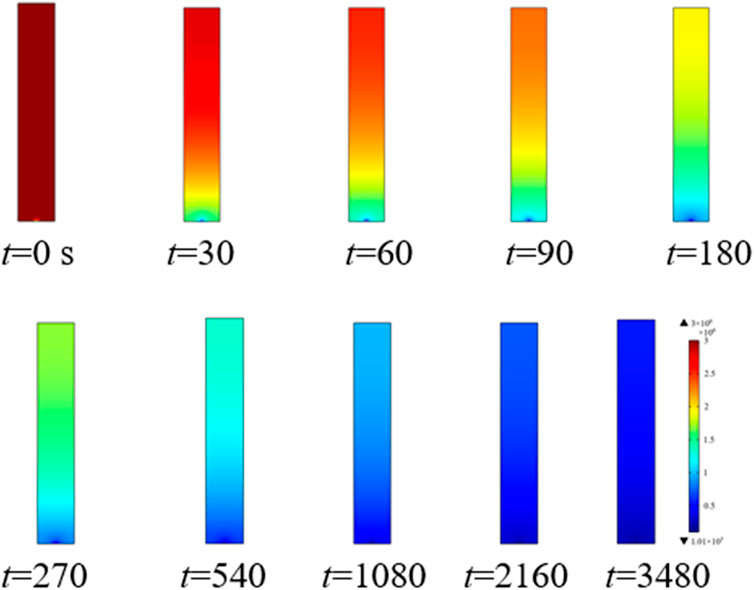
After further calculation, the porosity and pore pressure at different times are shown in Figures 14, 15, respectively. These figures reveal that with increasing time, the porosity and pore pressure of the specimen gradually decreased, the decreasing trend was gradual, and the results are consistent with the experimental findings. The inversion analysis method proposed in this paper can provide a simple and feasible new idea to study the gas migration process in coal seams, which does not need to strictly distinguish and measure the pore scale and can truly reflect the migration pattern under the interaction of desorption-diffusion and seepage processes.
6 Conclusion and prospects
The method of combining theoretical analysis and experimental design was used to study the effect mechanism of gas diffusion on seepage. The following conclusions were obtained:
(1) Under the assumptions and experimental conditions in this paper, the control equation of gas migration in coal was transformed into a parabolic equation with an unknown nonlinear term on the right side, which reflects the source–sink effect of gas diffusion on seepage.
(2) With the use of the basic solution of the parabolic differential equation combined with the GCV method and Tikhonov regularization method to select parameters, the unknown right-side nonlinear source–sink term of the equation was accurately identified.
(3) Based on the source functions identified via inversion analysis, the unknown constants in the Langmuir equation were inverted by establishing a nonlinear least squares model, which provides a basis for the establishment of a coupled model to analyse the process of coal seam gas inflow.
With the use of the gas migration test for specimens designed in this chapter, combined with the inversion analysis method for unknown source identification via a parabolic equation, the diffusion source function in the gas seepage process could be obtained, which does not require accurate measurement of the pore and fracture scales and distributions in specimens, is less expensive to calculate, and considers the interaction between desorption-diffusion and seepage in the migration process.
The interaction between gas desorption-diffusion and seepage in coal directly affects the ease of coal seam gas drainage and gas emission and further affects the selection of gas drainage methods. The establishment and determination of the basic control equation of gas migration considering desorption-diffusion and seepage interaction provides a new idea for the study of the gas migration process in coal seams and a theoretical basis for the establishment of a mathematical model to predict gas emissions.
Data availability statement
The raw data supporting the conclusion of this article will be made available by the authors, without undue reservation.
Author contributions
FL contributed to conception and design of the study, wrote the original manuscript and performed experiments. TH wrote sections of the manuscript, drew images and typeset the manuscript. BL, ZX, and WS reviewed and read the manuscript. All authors contributed to manuscript revision, read, and approved the submitted version.
Funding
This work was supported by the National Natural Science Foundation of China Youth Fund (Grant no. 51904144), and the National Natural Science Foundation of China (Grant nos. 51874166 and 51974145).
Acknowledgments
The authors acknowledge the support from the School of Resources and Civil Engineering of Northeastern University and the School of Mechanics and Engineering of Liaoning Technical University for providing experimental equipment and test technical support, Jiangtao Li and Tie Liu from China Coal Technology and Engineering Group Shenyang Research Institute for their help in obtaining on-site coal samples, and Wenxue Deng from Northeastern University for his help in theoretical derivation and numerical simulation.
Conflict of interest
The authors declare that the research was conducted in the absence of any commercial or financial relationships that could be construed as a potential conflict of interest.
Publisher’s note
All claims expressed in this article are solely those of the authors and do not necessarily represent those of their affiliated organizations, or those of the publisher, the editors and the reviewers. Any product that may be evaluated in this article, or claim that may be made by its manufacturer, is not guaranteed or endorsed by the publisher.
References
Administration, N.E. (2016). The Thirteenth Meeting of the Inter-ministerial Coordination Leading Group for Coal Mine Gas Prevention and Control. Beijing.
Barenblatt, G. I., Zheltov, I. P., and Kochina, I. N. (1960). Basic concepts in the theory of seepage of homogeneous liquids in fissured rocks [strata]. J. Appl. Math. Mech. 24 (5), 1286–1303. doi:10.1016/0021-8928(60)90107-6
Cheng, Y. P., Dong, J., Li, W., Chen, M. Y., and Liu, K. (2017). Effect of negative pressure on coalbed methane extraction and application in the utilization of methane resource. J. China Coal Soc. 42 (06), 1466–1474. doi:10.13225/j.cnki.jccs.2016.1270
Cheng, Z. L., Sui, W. B., Ning, Z. F., Gao, Y. F., Hou, Y. A., Chang, C. H., et al. (2018). Microstructure characteristics and its effects on mechanical properties of digital core. Chin. J. Rock Mech. Eng. 37 (02), 449–460. doi:10.13722/j.cnki.jrme.2017.1122
Cui, S. H., Pei, X. J., Jiang, Y., Wang, G. H., Fan, X. M., Yang, Q. W., et al. (2021). Liquefaction within a bedding fault: understanding the initiation and movement of the Daguangbao landslide triggered by the 2008 Wenchuan Earthquake (Ms=8.0). Eng. Geol. 295, 106455. doi:10.1016/j.enggeo.2021.106455
Daggupati, S., Mandapati, R. N., Mahajani, S. M., Ganesh, A., Pal, A. K., Sharma, R. K., et al. (2011). Compartment modeling for flow characterization of underground coal gasification cavity. Ind. Eng. Chem. Res. 50 (1), 277–290. doi:10.1021/ie101307k
Dong, J. (2018). Gas diffusion properties of coal mass based on equivalent physical structure and its application. Doctoral dissertation. Xu zhou: China University of Mining and Technology.
Fu, X. H., Qin, Y., Zhang, W. H., Wei, C. T., and Zhou, R. F. (2005). Study on fractal classification and natural classification of coal pores based on coalbed methane migration. Chin. Sci. Bull. 50 (S1), 51–55. doi:10.3321/j.issn:0023-074X.2005.z1.009
He, Y. S., and Kusiak, A. (2018). Performance assessment of wind turbines: data-derived quantitative metrics. IEEE Trans. Sustain. Energy 9 (1), 65–73. doi:10.1109/tste.2017.2715061
Kong, X. Y. (1999). Advanced mechanics of fluids in porous media. China: University of Science and Technology of China Press.
Li, C. L., Peng, C. Y., and Zhu, S. Y. (2013). Coalbed methane is adsorption gas underground. Lithol. Reserv. 25 (02), 112. CNKI:SUN:YANX.0.2013-02-027.
Li, H., Deng, J., Yuan, S., Feng, P., and Arachchige, D. D. K. (2021). Monitoring and identifying wind turbine generator bearing faults using deep belief network and EWMA control charts. Front. Energy Res. 9. doi:10.3389/fenrg.2021.799039
Li, H. J., Deng, J. H., Feng, P., Pu, C. H., Arachchige, D. D. K., Cheng, Q., et al. (2021). Short-term nacelle orientation forecasting using bilinear transformation and ICEEMDAN framework. Front. Energy Res. 9. doi:10.3389/fenrg.2021.780928
Li, H. J., He, Y. S., Xu, Q., Deng, J. H., Li, W. L., Wei, Y., et al. (2022). Detection and segmentation of loess landslides via satellite images: a two-phase framework. Landslides 19 (3), 673–686. doi:10.1007/s10346-021-01789-0
Li, X. C., Guo, Y. Y., Wu, S. Y., and Nie, B. S. (2007). Mathematical model and numerical simulation of fluid-solid coupled flow of coal-bed gas considering swelling stress of adsorption. Chin. J. Rock Mech. Eng. 26 (S1), 2743–2748. doi:10.3321/j.issn:1000-6915.2007.z1.023
Liang, B., Zhang, M. T., and Wang, Y. J. (1996). Mathematical model and numerical method for coupled gas flow in coal seams and coal deformation. Chin. J. Rock Mech. Eng. 16 (02), 40–47. CNKI:SUN:YSLX.0.1996-02-007.
Lin, B., Liu, T., and Yang, W. (2018). Solid-gas coupling model for coalseams based on dynamic diffusion and its application. J. China Univ. Min. Technoligy 47 (01), 32. doi:10.13247/j.cnki.jcumt.000811
Liu, L. Y., Zhu, W. C., Wei, C. H., Elsworthb, D., and Wang, J. H. (2018). Microcrack-based geomechanical modeling of rock-gas interaction during supercritical CO2 fracturing. J. Petroleum Sci. Eng. 164, 91–102. doi:10.1016/j.petrol.2018.01.049
Liu, Z. Y. (2021). Non-isothermal diffusion-seepage model of coalbed methane based on modified channeling term. Master dissertation. Shenyang: Northeastern University.
Lv, F. (2021). Back analysis on coal seam gas migration and prediction of gas emission. Doctoral dissertation. Northeastern University.
Lv, F., Xu, Z. H., Liang, B., and Sun, W. J. (2018). Experimental study on the seepage law of coal considering deformation of the coal rock and the adsorption characteristics. J. Exp. Mech. 33 (03), 469–476. doi:10.7520/1001-4888-17-155
Peng, Y., Liu, J. S., Wei, M. Y., Pan, Z. J., and Connell, L. D. (2014). Why coal permeability changes under free swellings: new insights. Int. J. Coal Geol. 133, 35–46. doi:10.1016/j.coal.2014.08.011
Qian, M. G. (2010). On sustainable coal mining in China. J. China Coal Soc. 35 (04), 529–534. doi:10.13225/j.cnki.jccs.2010.04.007
Wang, B. J., Shi, S. B., Cai, C. Y., and Tang, C. S. (2008). 3D visualization and porosity computation of clay soil SEM image by GIS. Rock Soil Mech. 26 (01), 251–255. doi:10.16285/j.rsm.2008.01.049
Wang, J. B. (2014). 3D reconstruction of porous rock and numerical simulations of fluid flow at mesoscale levels. Doctoral dissertation. Beijing: China University of Mining and Technology-Beijing.
Wu, S. Y., and Guo, Y. Y. (1999). Study on the movement property of coal seam methane. J. China Coal Soc. 24 (01), 67–71. CNKI:SUN:MTXB.0.1999-01-014.
Yan, L. (2011). Efficient numerical methods for inverse problems. Doctoral dissertation. Lanzhou: Lanzhou University.
Zhou, J. R., Wei, J., Yang, T. H., Zhang, P. H., Liu, F. Y., Chen, J. K., et al. (2021). Seepage channel development in the crown pillar: insights from induced microseismicity. Int. J. Rock Mech. Min. Sci. 145, 104851. doi:10.1016/j.ijrmms.2021.104851
Keywords: diffusion, seepage, function identification, fundamental solution, regularization method
Citation: Lv F, Hu T, Liang B, Xu Z and Sun W (2022) Diffusion source function identification in the process of gas seepage in a coal seam. Front. Earth Sci. 10:951763. doi: 10.3389/feart.2022.951763
Received: 24 May 2022; Accepted: 08 July 2022;
Published: 09 August 2022.
Edited by:
Jingren Zhou, Sichuan University, ChinaReviewed by:
Bai Guoliang, China Coal Research Institute, ChinaLi Hongyan, China Coal Research Institute, China
Copyright © 2022 Lv, Hu, Liang, Xu and Sun. This is an open-access article distributed under the terms of the Creative Commons Attribution License (CC BY). The use, distribution or reproduction in other forums is permitted, provided the original author(s) and the copyright owner(s) are credited and that the original publication in this journal is cited, in accordance with accepted academic practice. No use, distribution or reproduction is permitted which does not comply with these terms.
*Correspondence: Fu Lv, bHZmdUBsbnR1LmVkdS5jbg==
 Fu Lv
Fu Lv Tingting Hu2