 Chuanshun Li
 Guohuai Wang3*
- 1First Institute of Oceanography, Ministry of Natural and Resources, Qingdao, China
- 2Laboratory for Marine Mineral Resources, Pilot National Laboratory for Marine Science and Technology, Qingdao, China
- 3Tianjin Geology Research and Marine Geological Center, Tianjin, China
Many achievements have been made in the exploration of seafloor polymetallic hydrothermal vents, however, it needs to further study how to discovery more potential new hydrothermal or massive sulfide fields. In this study, we collected 9818 major-element geochemical data sets of basalt samples from the Mid-Atlantic Ridge (MAR, 78°N–53°S) and the seafloor topographic data for eleven known hydrothermal vents (e.g., TAG, Snake Pit, MAR 22°30′N, Lilliput). Based on the different spatial distances between basalts and hydrothermal vents, we classified all the basalts into three categories: 1) basalt near known vent (focal objects of the research, 29 samples), 2) basalt around known vent (observed objects, 155 samples), and 3) other basalt of the MAR (as background basalt). Meanwhile, we used major element components of basalts to calculate the analogy viscosity and analyzed the possible correlation between analogy viscosity and the spatial distribution of seafloor hydrothermal vents. We found that the analogy viscosity of basalt near known vent fall into a narrow medium value range (∼46.8–68.5 Pa s) contrasted with the range of background basalt values range (∼4.0–356.0 Pa·s). It infers that these basalts on the Mid-Atlantic Ridge with the medium values of analogy viscosity favor the formation of hydrothermal vents. However, due to the complexities of magmatic activity and fault structure, as well as the multi-stage water-rock reaction, whether the analogy viscosity of basalts can be used as an indicator for determining the location of seafloor hydrothermal field or not needs further verification. Hence, this paper provides a possible rule (the variation of analogy viscosity estimated by major element components in the basalts) for exploration the location of hydrothermal vents rather than a fully developed method.
Introduction
Hydrothermal fields are rich in biological and mineral resources and provide a window to the Earth’s depth. Finding and studying hydrothermal vents is one of the most interesting scientific aims worldwide. However, finding hydrothermal vents, especially those inactive hydrothermal zones on the vast, and dark seafloor, which is covered by several kilometers of water, is an extremely challenging task. The vicinities of seafloor hydrothermal fields exhibit special characteristics: higher anomalies of heat flow on the seafloor (e.g., Chiba et al., 2001; Dias et al., 2010; Schmidt et al., 2011), frequent seismic activity (e.g., Johnson et al., 2000; Seewald et al., 2003; Crone et al., 2010), oceanic core complex outcrop and detachments around some of the vents (e.g., Morris et al., 2009; Cheadle and Grimes, 2010; Macleod et al., 2011), increased turbidity on the seafloor (e.g., Baker et al., 2006), and high magnetic anomalies (e.g., Miranda et al., 2005; Rona et al., 2013). According to Baker and German (2004), hydrothermal activity is positively correlated with the full spreading rate of the mid-ocean ridge. The search for new indicators of hydrothermal vents will therefore assist both the study and exploration of these fascinating appearances.
The geochemical characteristics of basalt near hydrothermal vents differ from those of normal mid-ocean ridge basalt (N-MORB) in the Mid-Atlantic Ridge (MAR). Wang et al. (2014) reported that the basalt of the 49.6°E hydrothermal field on the southwest Indian Ridge is richer in K2O, Na2O, Fe2O3, and MnO, and poorer in SiO2 and Al2O3, than N-MORB. Gale et al. (2013b) compared the compositions of basaltic glass in the French American Mid-Ocean Undersea Study (FAMOUS) data and North FAMOUS segment. Basaltic glass on the North FAMOUS segment, which is near a hydrothermal vent, is rich in SiO2, FeO, TiO2, and K2O and poor in Al2O3, CaO, and MgO. The viscosity of basalt might reflect its geochemical characteristics (Zhu et al., 1997). It is an important physical property that affects the rising, crystallization differentiation, degassing, ejection, and other behaviors of magma (e.g., Papale, 1999; Sparks, 2003; Dingwell, 2006) and restricts the occurrence, topography, and other features of basalt. By analyzing the viscosity difference between the basalt around known vents (BNV) and the background basalt of MAR, we might obtain a new identifying indicator of hydrothermal vents.
Seafloor hydrothermal activity was first discovered in 1948 (Bruneau et al., 1953). In 1985, the first active hydrothermal field, the trans-Atlantic geotraverse (TAG) field, was discovered in the MAR (Rona et al., 1986). Since then, 721 hydrothermal seabed vents have been discovered worldwide. Among these, 304 have been confirmed as active, 362 have been inferred as active, and more than 50% are located in the mid-ocean ridge (The InterRidge Database, 2020, Accessed date is 2021. 03. 21). By studying the known hydrothermal vents, we might reveal their spatial distribution rules and control factors. To determine the differences in the major elements and viscosities of the BNV and background basalt on the MAR, we collected and analyzed thousands of basalt datasets sampled from the MAR. This paper reports the findings of the study.
Data and Methods
Petro-Geochemistry Data
More than 35,000 datasets of rock/glass samples from the MAR were collected and preliminarily analyzed. Some of these samples were located near 11 known hydrothermal vents. The locations and basic information of the samples near the 11 vents, on which this research focuses, are presented in Figure 1 and Table 1, respectively. The data were mainly collected from the Petrological Database of the Ocean Floor (PetDB, http://www.earthchem.org/petdb/search), a database of global seabed rock (Lehnert et al., 2000) was downloaded on 26 September 2017. In addtition, we also collected some data from Haase et al. (2009). Gale et al. (2013a) used datasets from PetDB to study the mean composition of mid-ocean ridge basalts and found some geochemical problems associated with Earth composition and evolution.
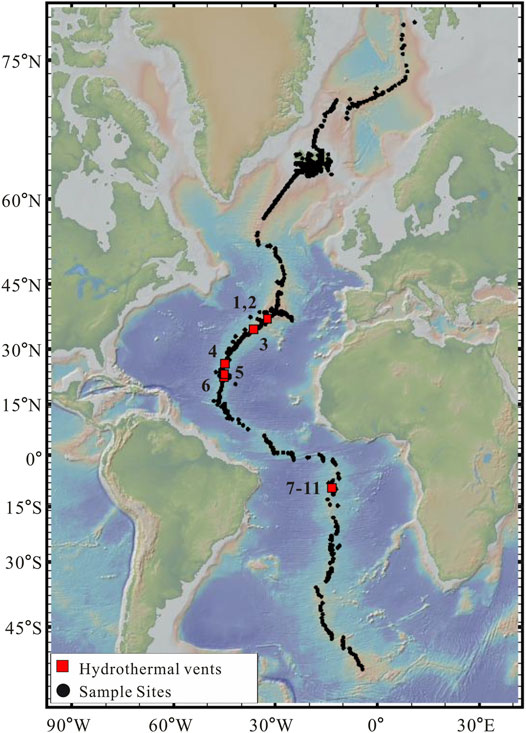
FIGURE 1. Basalt sampling sites and locations of the 11 known seabed hydrothermal vents (for information, see Table 1). Shaded relief bathymetric map from GeoMapApp, 2021.

TABLE 1. Hydrothermal vents of MAR.
According to Gale et al. (2013a), the sequence of steps that are required to eliminate questionable or inapplicable analyses and retain only the highest-quality data can be given as follows: 1) Sample location: To assign each sample to the appropriate MAR, only the samples that were located on MAR and its flanks were retained. 2) Altered samples: According to the descriptions that were obtained from PetDB regarding the samples, we eliminated the altered or mineralized rock samples, including those that were altered by seawater. Further, only fresh basalt/basalt glass remained. 3) Complete set of oxides: For the major element data, each sample was required to contain Fe (as FeO and/or Fe2O3), SiO2, TiO2, Al2O3, MgO, CaO, Na2O, and K2O. Duplicate samples, which possess identical location and major element compositions, were eliminated. Fe required special attention to determine the total amount of Fe (FeOT) due to the diverse forms in which it has been reported in PetDB, which is given by Gale et al. (2013a) as FeOT = FeO + 0.9 × Fe2O3. 4) Igneous compositions and major-element sums: Data were further filtered to eliminate the samples outside the basic-rock range because the vast majority of known hydrothermal vents are observed to develop on a basalt basement (only eight known hydrothermal vents are located in the ultramafic basement worldwide). We retained the samples having 45– 53 wt% composition of SiO2. The final filter to ensure data quality involved a check of the major elemental sum (SiO2 + Al2O3 + MgO + TiO2 + FeOT + CaO + K2O + Na2O + MnO + P2O5). Since MnO and P2O5 are not analyzed by all the laboratories, we calculated the placeholder values strictly for the sum calculations (MnO = FeOT/54; P2O5 was estimated using the polynomial best-fit equation that is based on the K2O−contents). Further, the sum was estimated as mentioned previously, and any analyses depicting a sum that was either less than 98 wt% or greater than 101 wt% were eliminated. 5) Estimating H2O: H2O was estimated using H2Oest = 1.5 × K2O (Langmuir et al., 2006) that was applicable for open-ocean ridge basalts. Finally, 9818 datasets were retained to be the study materials. Their locations are illustrated in Figure 1. The basalt/basalt glass datasets were classified by their total alkali silica (TAS) (Maitre, 1984). The classification results are shown in Figure 2. Most of the samples are basalt; the remaining minority are trachybasalt, basaltic trachyandesite, tephrite/basanite, or phonotephrite. Herein, all samples are referred to as basalt.
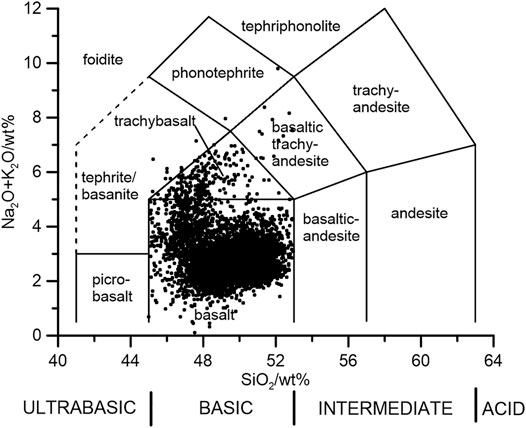
FIGURE 2. TAS classification of samples collected from the MAR.
Bathymetry Data
Bathymetric maps were taken from the GeoMapApp of the Marine Geoscience Data System on 21 Jan 2022 (GeoMapApp, 2021). Bathymetric data were extracted from the Global Multi-Resolution Topography database with a 100 m grid (for MAR 22°30′N, Snake Pit, the Lilliput field (vents 7–11), and S oceanographer) (Ryan et al., 2009), the Woods Hole Oceanographic Institute (WHOI) with a 20 m grid (Tivey et al., 2003) and a 0.25 m grid (Roman and Singh, 2005; Roman and Singh, 2007) (for TAG), and the WHOI with a 10 m grid (for Lucky Strike and Evan) (Scheirer et al., 2000).
Analogy Viscosity
The earliest models that were used for estimating the viscosity of geologically relevant silicate melts adopted a strict Arrhenius temperature dependence such as the most commonly used Arrhenius model of Fulcher (1925) and Shaw (1972). Giordano et al. (2008) compared their non-Arrhenius model with the model of Shaw (1972) and demonstrated that the former is better. Hence, viscosity was estimated using the model of Giordano et al. (2008) in the following manner:
Here,
The optimal values for the 18 model parameters and their corresponding confidence limits are reported in Table 2; and a demonstration calculation is provided in Table 3. The minimum temperature of tholeiite erupting from the Kilauea volcano (Hawaii) is 1,423 K (Wright et al., 1968), and 1,433 K at a vapor pressure of 1,000 × 105 kPa (Xu & Qiu, 2010). Therefore, in the viscosity estimates of Eq. 1, we set the melting temperature of oceanic basalt to the middle temperature (1428 K) of the Kilauea tholeiite in 1,000–4,000 m depth range (100 × 105–400 × 105 kPa) in which vents may appear. Due to constraints such as the water content in the melting basalts was given indirectly with an empirical formula, the analogy viscosity more like a comprehensive geochemical characteristics of basalt than the viscosity value in the physical sense.
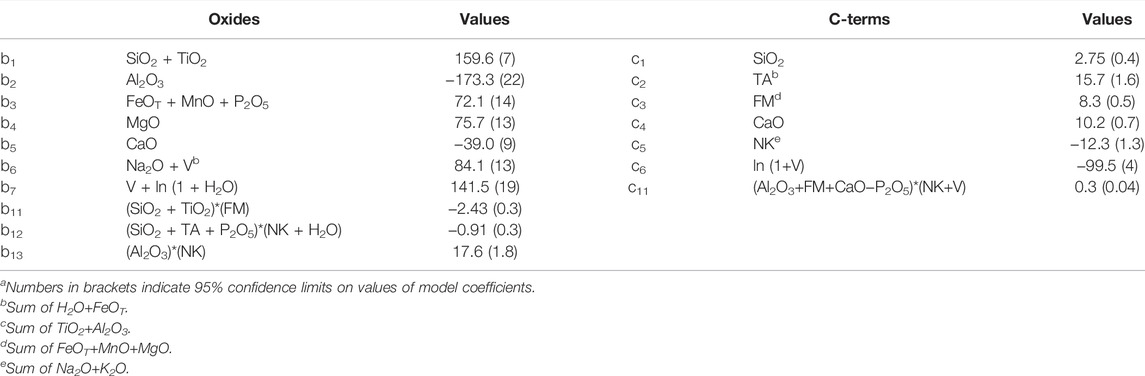
TABLE 2. Coefficients for calculation of VFT parameters B and C [A = −4.55 (± 0.21)a] from melt compositions expressed as mol% oxides (Giordano et al., 2008).
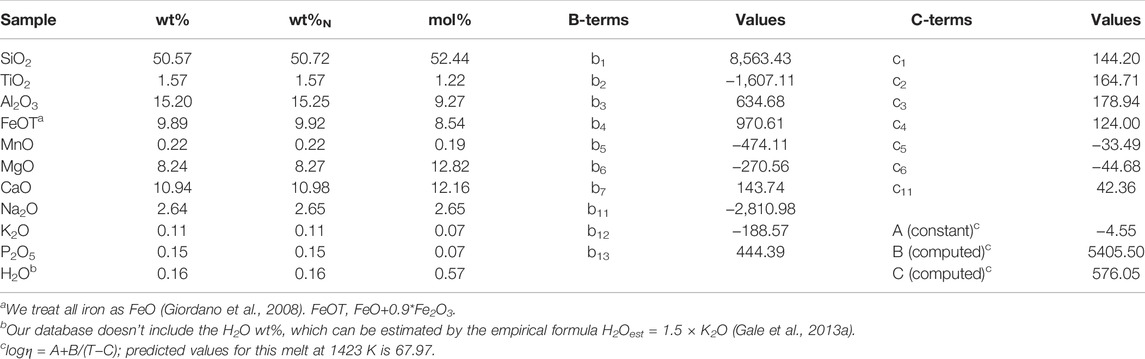
TABLE 3. Sample calculation of viscosity (Pa·s) using model coefficients in Table 2.
Three Classifications of Basalts
To compare the characteristics of the BNVs and the background basalt on MAR, we classified the basalt samples into three categories based on the spatial distance and topography coherence of their sampling sites to known hydrothermal vents. 1) Basalt near known vent (BNV): The BNV samples are located near known hydrothermal vents and are assumed to represent the basement basalt of the hydrothermal vents. The sampling sites and the known hydrothermal vents coexist in the same topographic unit and are adjacent to each other (i.e., separated by 10–103 m). 2) Basalt around known vent (BAV): These basalt sampling sites are located farther from the known hydrothermal vents than BNVs, but may be associated with hydrothermal vents. They are separated by 103–104 m from the known hydrothermal vents and all in the same topographic unit. Or, they are separated by 102–103 m from the known hydrothermal vents in different topographic units. 3) Basalt of the MAR: The basalt samples in the MAR are far (>104 m) from the known hydrothermal vents or no hydrothermal vents were found in the range. The basalt of the MAR is treated as the background basalt of the first two categories (especially of BNV). According to the above BNV classification standard, BNV samples from only 11 hydrothermal vents were collected over the whole MAR. These vents are the focal objects of this paper. The classifications of the sampling sites near each vent are described below.
Trans-Atlantic Geotraverse Vent
The TAG vent was discovered by Rona et al. (1986) in 1985. It is located on the north side of a large hydrothermal sulfide mound at the bottom of the axial valley, which has a maximum depth of 3,670 m. Thirty-nine basalt geochemical datasets have been collected from 36 sampling sites around the TAG vent (Figure 3). The major-element concentrations and viscosities at each site are listed in Table 4. Sites 24, 25, and 26 occupy the basement basalt under the large hydrothermal sulfide mound containing the TAG vent. Basalt samples from sites 24 and 26 were collected by drilling, and the sample from site 25 was collected by submersible equipment. These basalt samples were classified as BNV. The remaining sites are not beneath the hydrothermal sulfide mound and are approximately 1–15 km from the TAG vent; hence, their basalt samples were classified as BAV.
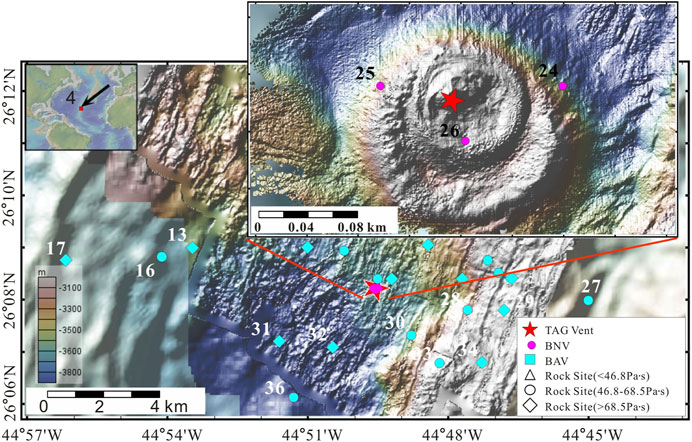
FIGURE 3. Bathymetric map from GeoMapApp, showing the locations of the TAG vent and the sample sites. The inset (upper left) shows the MAR location of the TW vent. The color bar on the left indicates the depths of the contours (where red represents shallow and blue represents deep). The red star indicates the hydrothermal vent. The pink circle and cyan triangles denote the BNV and BAV sites, respectively. At the sites marked by open triangles, circles, and rhombuses, the basalt viscosity is <46.8, 46.8–68.7, and >68.7 Pa·s, respectively. The vicinities of the vents are delineated by the red boxes.
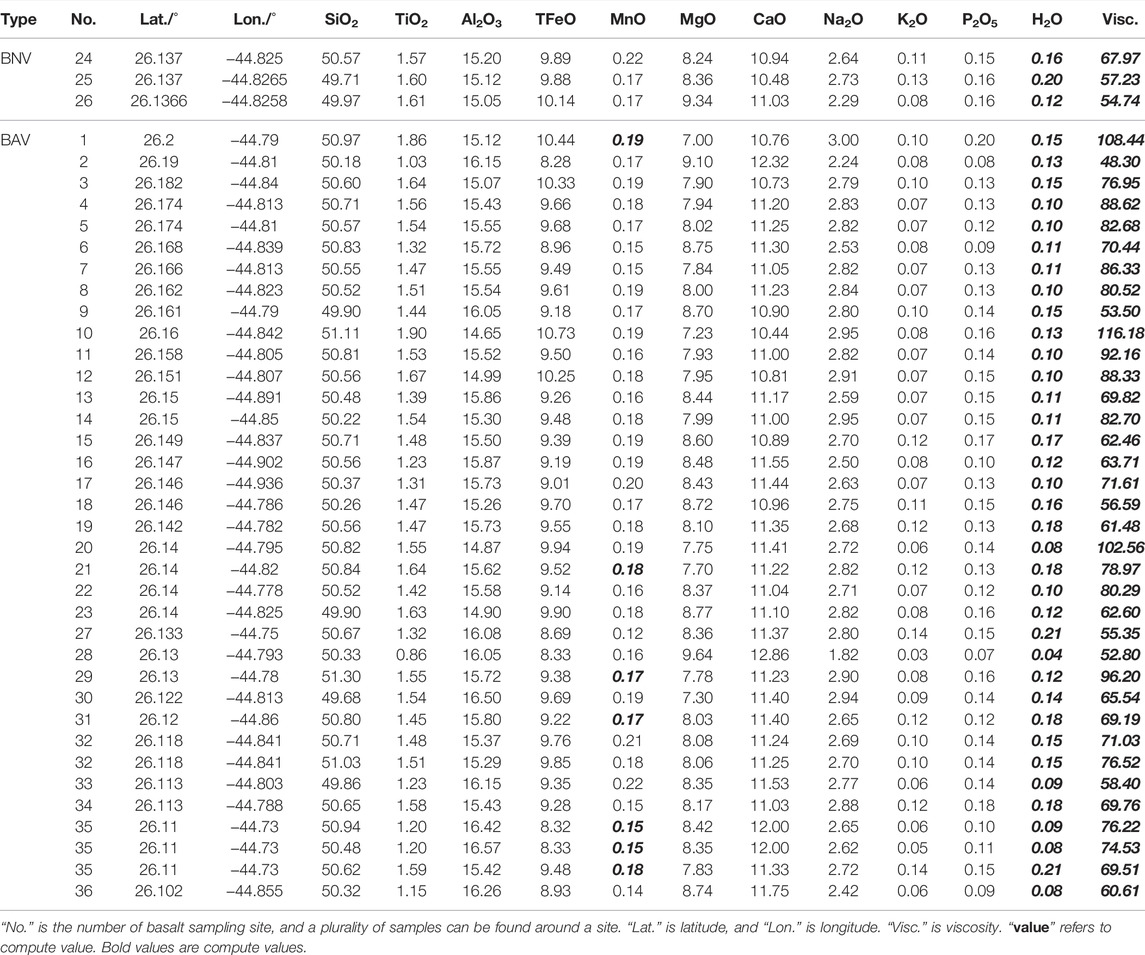
TABLE 4. Major elements (wt%) and viscosity of basalt (Pa·s) on TAG vent (data from PetDB).
Snake Pit Vent
The Snake Pit vent was discovered by Kong et al. (1985). It is situated on an intensely fissured neovolcanic ridge along the axial valley, which occupies the south side of the 3500-m-deep Kane transform fault. Thirty-two basalt geochemical datasets from 23 basalt sampling sites have been collected around the Snake Pit vent (Figure 4). Table 5 to continue lists the major-element concentrations and viscosities of the basalt at these sites. The Snake Pit vent and sites 12, 13 are located at the top of the same neovolcanic ridge, belong to the same topography unit, and are less than 300 m apart. Therefore, the basalt samples from these sites were classified as BNV. The remaining sites are located 1–5 km from the vent even in different topographic units. Therefore, samples from these sites were classified as BAV.
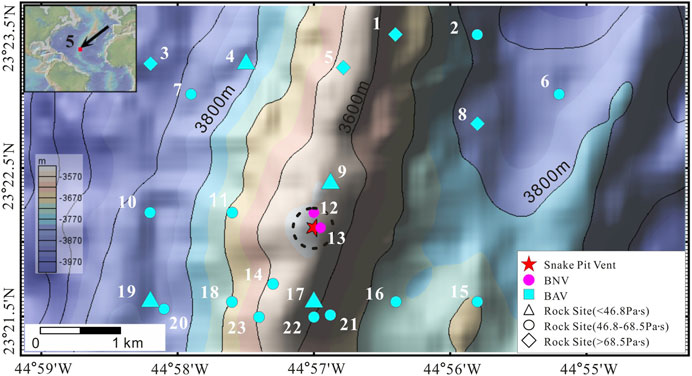
FIGURE 4. Bathymetric map from GeoMapApp, showing the location of the Snake Pit vent and the sample sites. The dashed circle encloses the range of BNV. Black solid lines are the 10 m isobaths. The symbols and color bar are described in the caption of Figure 3.
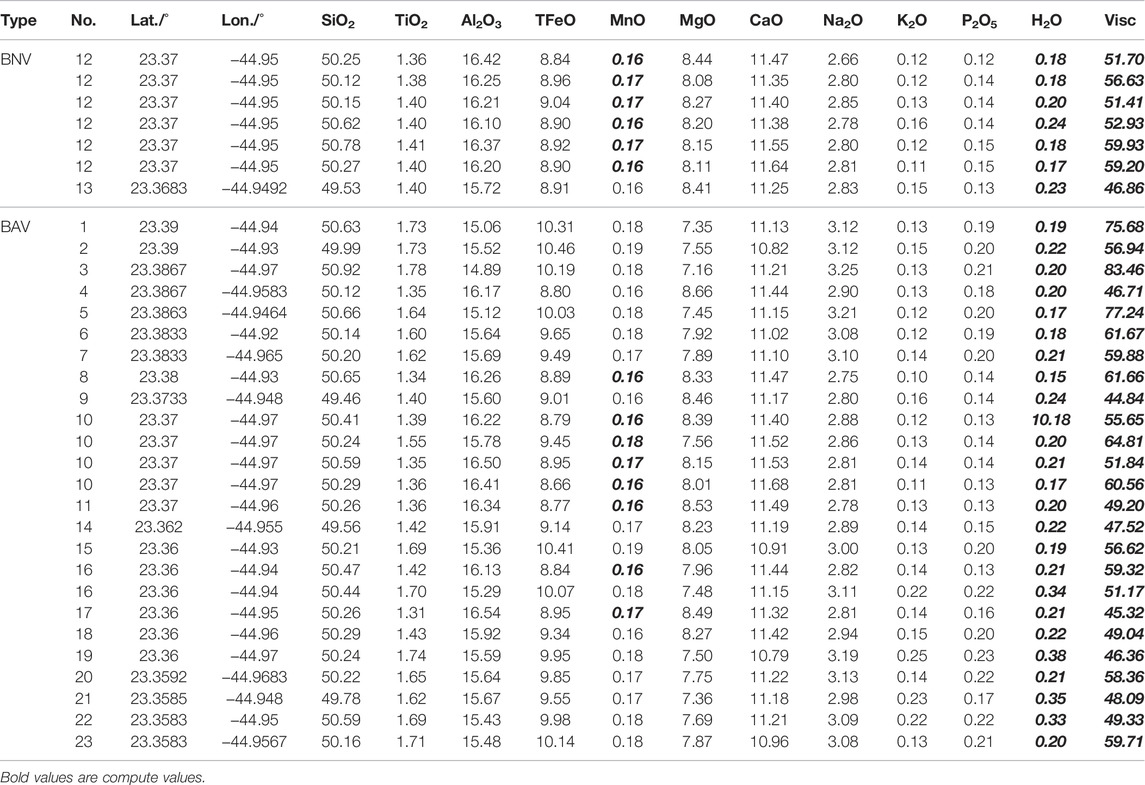
TABLE 5. Major elements (wt%) and viscosity of basalt (Pa·s) on snake pit vent (data from PetDB).
Lucky Strike Vent and Evan Vent
The Lucky Strike vent was discovered by Alvin in 1993 (Langmuir et al., 1993), and the Evan vent was discovered by Nautile in 2006 (Escartin, 2009). Both vents are located on the seamount in the central part of the Lucky Strike segment (Figure 5). Water depths at the Lucky Strike and Evan vents are 1740 and 1775 m, respectively, and the vents are approximately 3.5 km apart. 42 basalt geochemical datasets were collected from the 40 sampling sites around the two vents (Figure 5). The major-element concentrations and viscosities at the sampling sites are listed in Table 6. The Lucky Strike vent and site 14 occupy the depression between the two high topographies and are observed to be not more than 200 m apart. The Evan vent and sites 31 and 33 are also separated by only 400 m and occupy the same slope of the seamount having a similar water depth. Therefore, the basalt samples at sites 14, 31, and 33 were classified as BNVs. The remaining 37 sites and two hydrothermal vents are located in different topographic units or are separated by more than 1 km; hence, the samples that were collected from these sites were classified as BAVs.
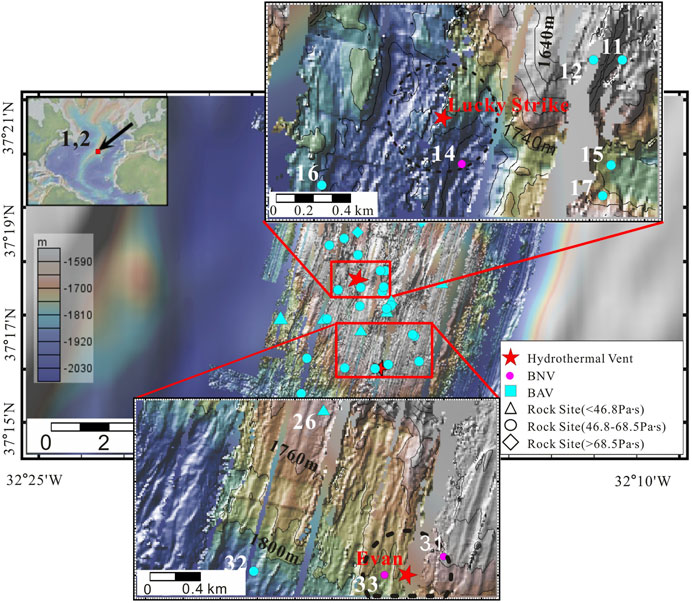
FIGURE 5. Bathymetric map from GeoMapApp, showing the locations of the Lucky Strike vent, the Evan vent, and the sample sites. The color bar is not applicable to the two local maps. Black solid lines are the 20 m isobaths. The symbols and color bar are explained in the caption of Figure 3.
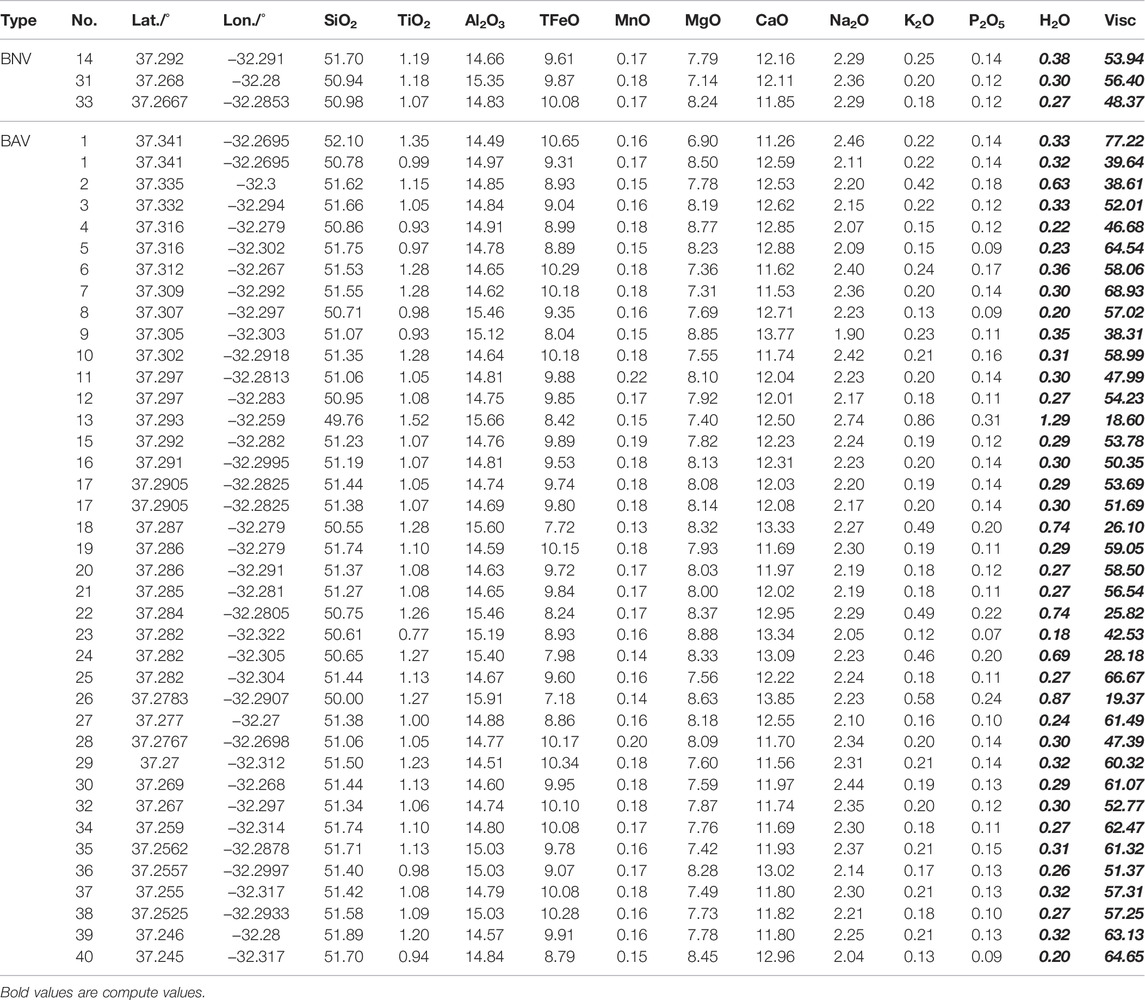
TABLE 6. Major elements (wt%) and viscosity of basalt (Pa·s) on lucky strike and evan vents (data from PetDB).
S Oceanographer Vent
The S Oceanographer vent, located on a smaller seamount at the bottom of the axial valley, was discovered by Chin et al. (1998). Its depth is 3,460 m. There are 32 basalt sampling sites around the vent, from which 37 geochemical datasets of basalt were collected (Figure 6). Their major-element concentrations and viscosities are listed in Table 7. The S Oceanographer vent and site 20 are separated by approximately 500 m at the bottom of the axial valley; hence, the basalt sample at site 20 was classified as BNV. The other sites are 1–20 km from the vent; hence, their basalt samples were classified as BAV.
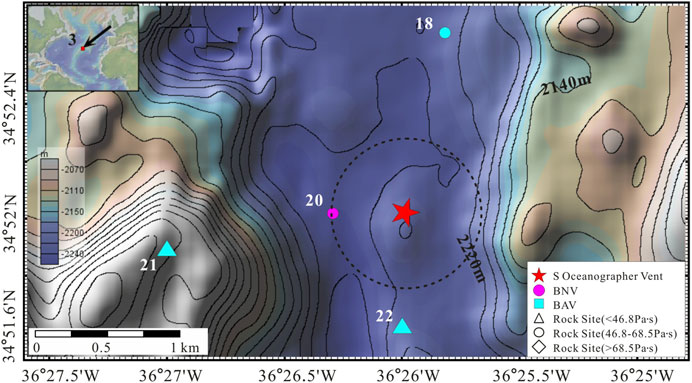
FIGURE 6. Bathymetric map from GeoMapApp, showing the locations of the S Oceanographer vent and the sample sites. Black solid lines are the 20 m isobaths. The symbols and color bar are described in the caption of Figure 3.
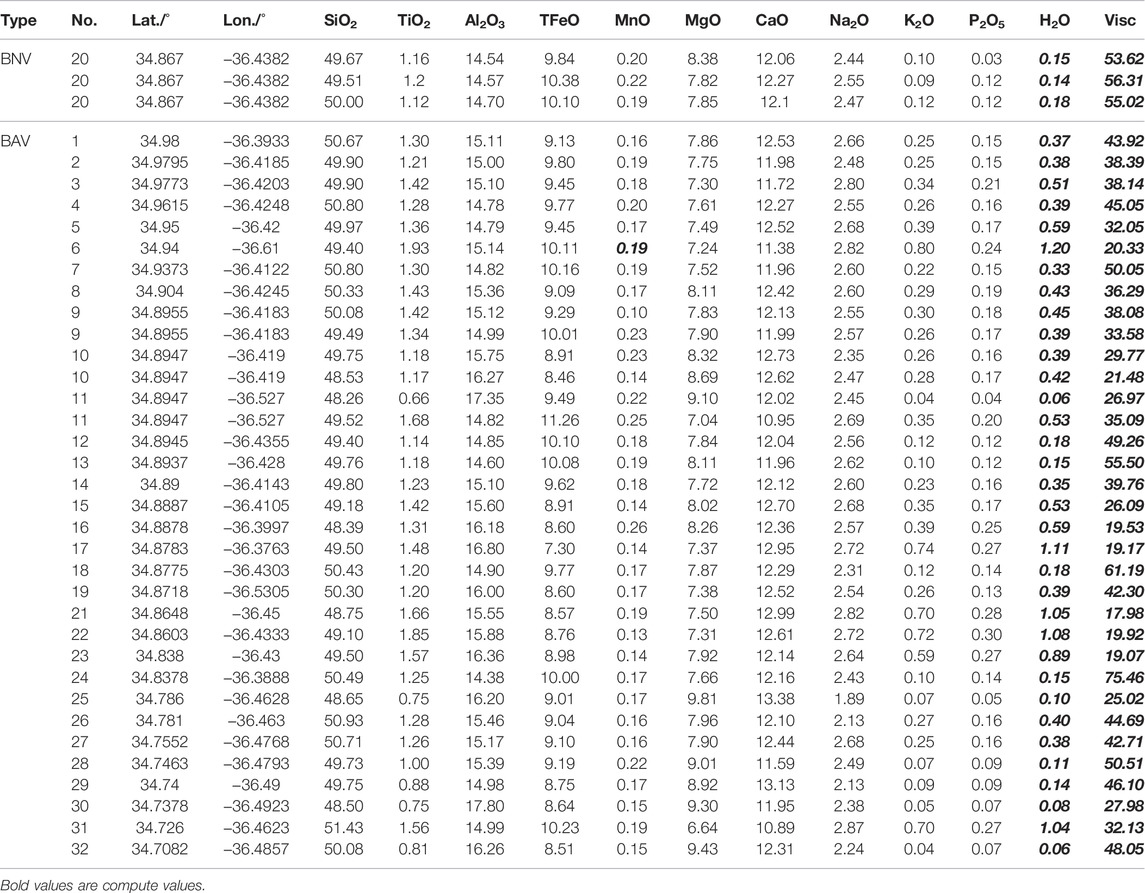
TABLE 7. Major elements (wt%) and viscosity of basalt (Pa·s) on S oceanographer vent (data from PetDB).
Mid-Atlantic Ridge 22°30′N Vent
The MAR 22°30′N vent was discovered by Rona et al. (1986). It is located on the east of the axial valley scarp, which is 2,800 m deep. Twelve basalt geochemical datasets were collected from four basalt sampling sites around the vent (Figure 7). The major-element concentrations and viscosities of the basalt at each site are listed in Table 8. Site 2 is only 10 m from the MAR 22°30′N vent; hence, its four basalt samples were classified as BNV. The other sites are more than 5 km from the vent; hence, their basalt samples were classified as BAV.
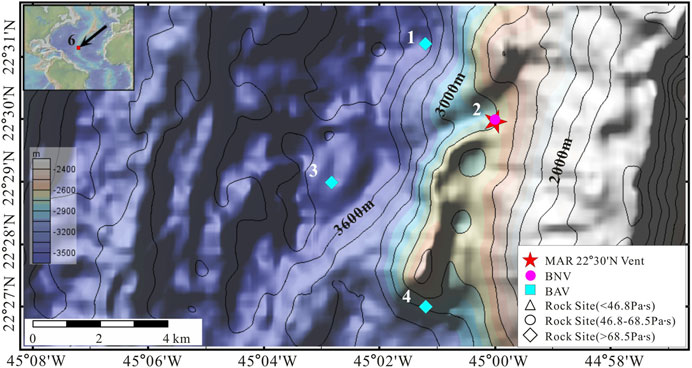
FIGURE 7. Bathymetric map from GeoMapApp, showing the locations of the MAR 22°30′N vent and the sample sites. Black solid lines are the 20 m isobaths. The symbols and color bar are described in the caption of Figure 3.
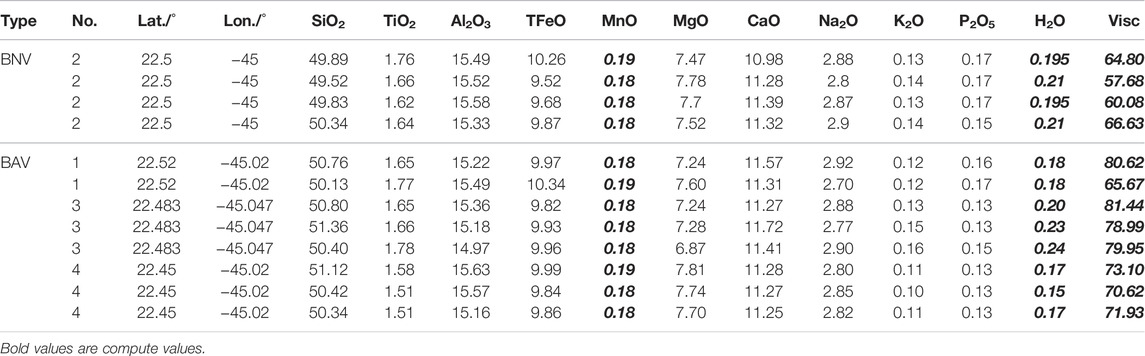
TABLE 8. Major elements (wt%) and viscosity of basalt (Pa·s) on MAR 22°30′N vent (data from PetDB).
Lilliput Field
The Lilliput field was preliminarily discovered by German et al. (2002) in 2002 and confirmed by ROV investigation in 2002 (Haase and Scientific Party, 2009). It occupies the segment between the Ascension and the Bode Verde fracture zones, which are 1,500 m deep. The areal coverage of the Lilliput hydrothermal field is approximately (1,000 × 250) m2. Five relatively small hydrothermal vents are found on a large (∼5,000 m × 600 m) young (estimated as <100 years old) lava flow. From observations of the Lilliput vent fauna over four consecutive years, researchers have inferred a pulsed hydrothermal activity (Haase et al., 2009). Twenty-two basalt geochemical datasets have been collected from 19 sampling sites around the Lilliput vent (Figure 8). The major-element concentrations and viscosities at these sites are listed in Table 9. The vents of the Lilliput field and sites 1–8 are separated by <500 m on the same slope (possibly created by the same lava flow); hence, their basalt samples were classified as BNV. The remaining sites were distant (<1 km) from the hydrothermal vents; hence, their basalt samples were classified as BAV.
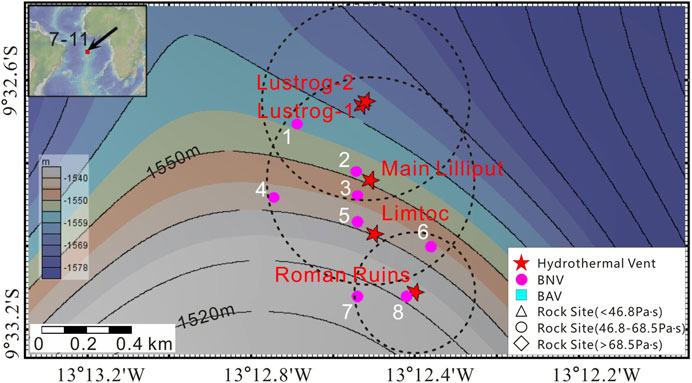
FIGURE 8. Bathymetric map from GeoMapApp, showing the locations of vents in the Lilliput hydrothermal field and the sample sites. Black solid lines are the 10 m isobaths. The symbols and color bar are described in the caption of Figure 3.
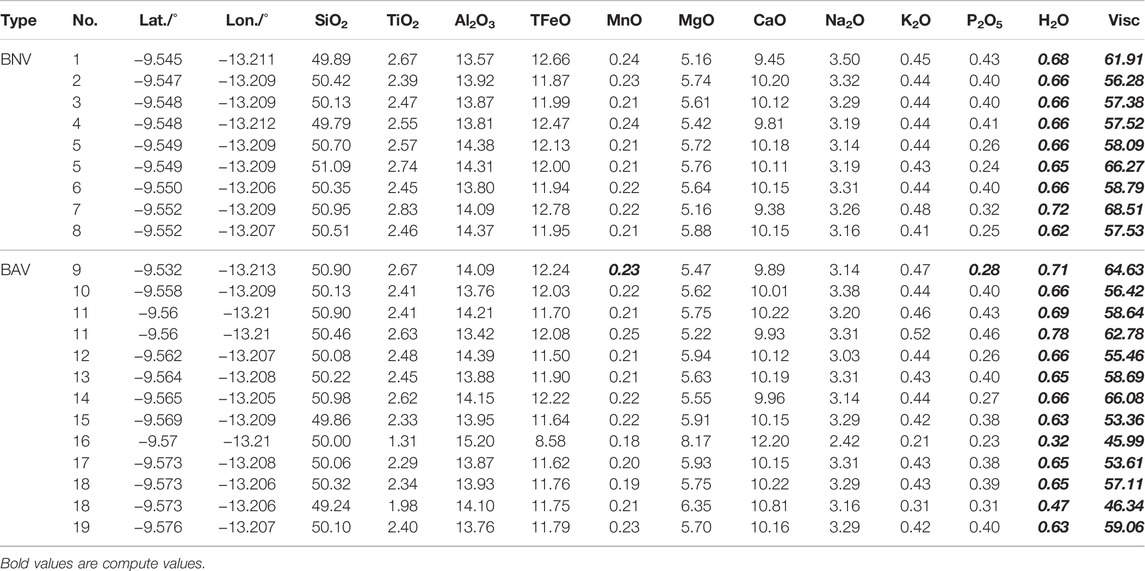
TABLE 9. Major elements (wt%) and viscosity of basalt (Pa·s) on lilliput field (data from PetDB; Haase et al., 2009).
The above classification grouped the 9818 sampled basalt datasets into 29 BNV datasets and 155 BAV datasets. The differences between both types of basalt samples and the background basalts on the MAR are compared in the following section.
Results
The latitudes and the analogy viscosity provided in the 9818 datasets were plotted in a scatter diagram, with latitude as the ordinate and viscosity as the abscissa (Figure 9). The viscosities of the basalts from the MAR, BAV, and BNV groups were 4–356, 17–117, and 46.8–68.5 Pa·s, respectively. As shown in Figure 9, the viscosity range narrows near the vents (e.g., 46.8–68.5 Pa·s), but many of the BAV samples are likely to be background basalt on the MAR. Among the whole 9818 basalt samples collected from the MAR, 31.1% have viscosities ranging from 46.8 to 68.5 Pa·s. In other words, less than one-third of the basalt samples from the MAR fall within the viscosity range of BNV.
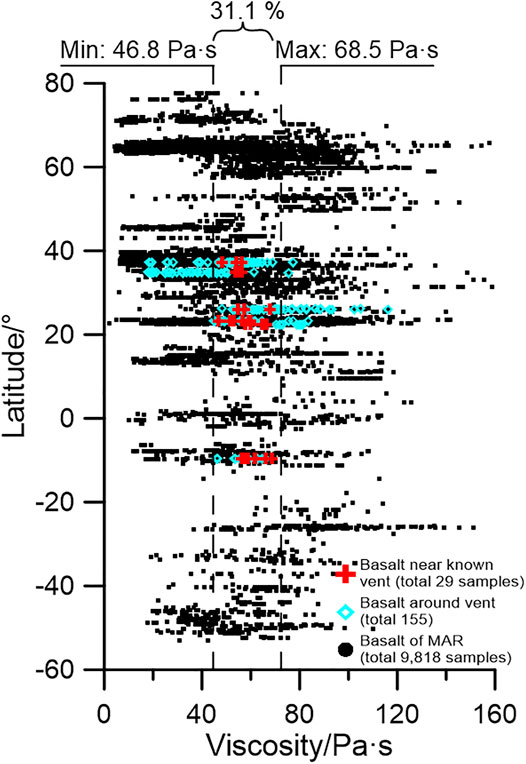
FIGURE 9. BNV, BAV, and MAR basalt samples (distinguished by pink crosses, cyan diamonds, and black circles, respectively) plotted on a viscosity–latitude scatter diagram. All BNV and BAV, and MAR basalts with viscosities below 160 Pa·s (this excludes 20 samples with viscosities between 160 Pa.s and the maximum viscosity of 574 Pa·s) are shown.
Meanwhile, the viscosities of the BNV, BAV, and MAR basalt samples were statistically analyzed, and the results were plotted as histograms (Figure 10). The modes and means of the viscosities are 54–56 Pa·s and 50.49 Pa·s for the MAR basalt, 58–60 Pa·s and 56.07 Pa·s for BAV, 56–58 Pa·s and 57.71 Pa·s for BNV respectively. The mean viscosities of the BNV and BAV samples are similar but clearly differ from those of the MAR basalt. The viscosity standard deviations of the MAR basalt, BAV, and BNV are 24.30, 18.44, and 5.30, respectively. Note that the standard deviation is much smaller in BNV than in the other basalt groups, indicating a stronger aggregation effect of the viscosity in BNV.
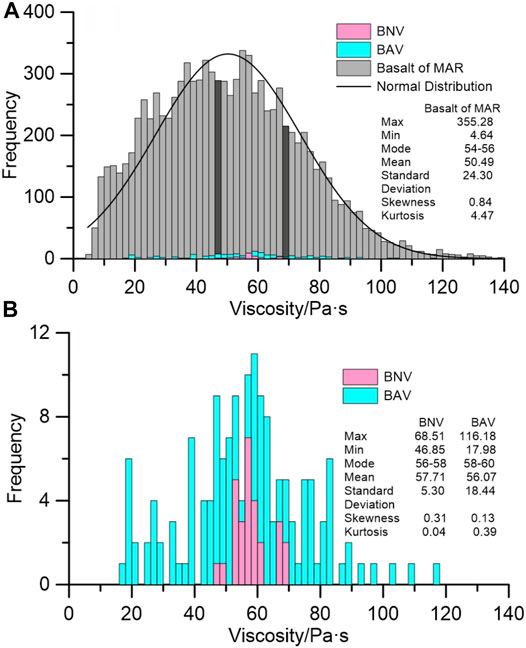
FIGURE 10. (A) Frequency histograms of BNV, BAV, and MAR basalt samples. The darker grayscale shows the range of BNV. The statistical parameters on the right were computed for MAR basalt. (B) Frequency histograms of BNV and BAV.
In addition, all basalt samples are classified by the maximum and minimum concentrations of BNV major elements and the proportion of the Mid- Ridge basalt samples belonging to BNV category is listed in Table 10. These results show that the concentration range of major elements in most basalts as the same as that of BNV, while only 31% of basalts had the analogy viscosity similar to BNV which shows that the analogy viscosity may be another suitable indicator for the seafloor hydrothermal vents.
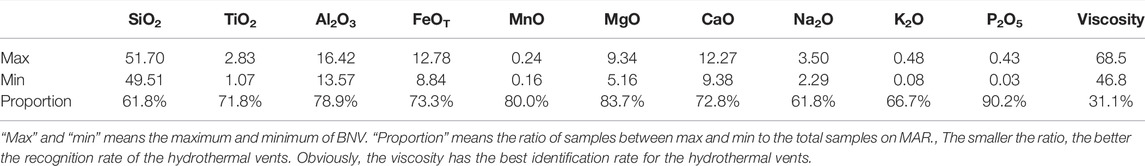
TABLE 10. Major element (wt%) and viscosity (Pa·s) range of BNV and their recognition rate of basalt on MAR.
Discussion
The major-element concentrations of basalt have limited ability to identify hydrothermal vents (Table 10). To understand this result, we plotted the analogy viscosity versus oxide content for the three types of basalt (Figure 11). BNV is divided into two distinct categories along the horizontal axis: Type 1, located in the north MAR (20–40°N), and Type 2, located in the south MAR (9°S). Because the geochemical compositions of BNV differ among the MAR locations, they are unsuitable as indicators of hydrothermal vents. In contrast, the analogy viscosity of BNV is highly consistent among the locations and better identifies the hydrothermal vents. According to statistical analysis, the range of BNV analogy viscosity differs from that of the MAR (46.8–68.5 Pa·s in the former vs. 4–356 Pa·s in the latter). This suggests that a narrow analogy viscosity range (e.g. 46.8–68.5 Pa.s) favors the formation and development of hydrothermal vents. To date, the role of basalt viscosity in restricting the hydrothermal vents is not clear, which require further research.
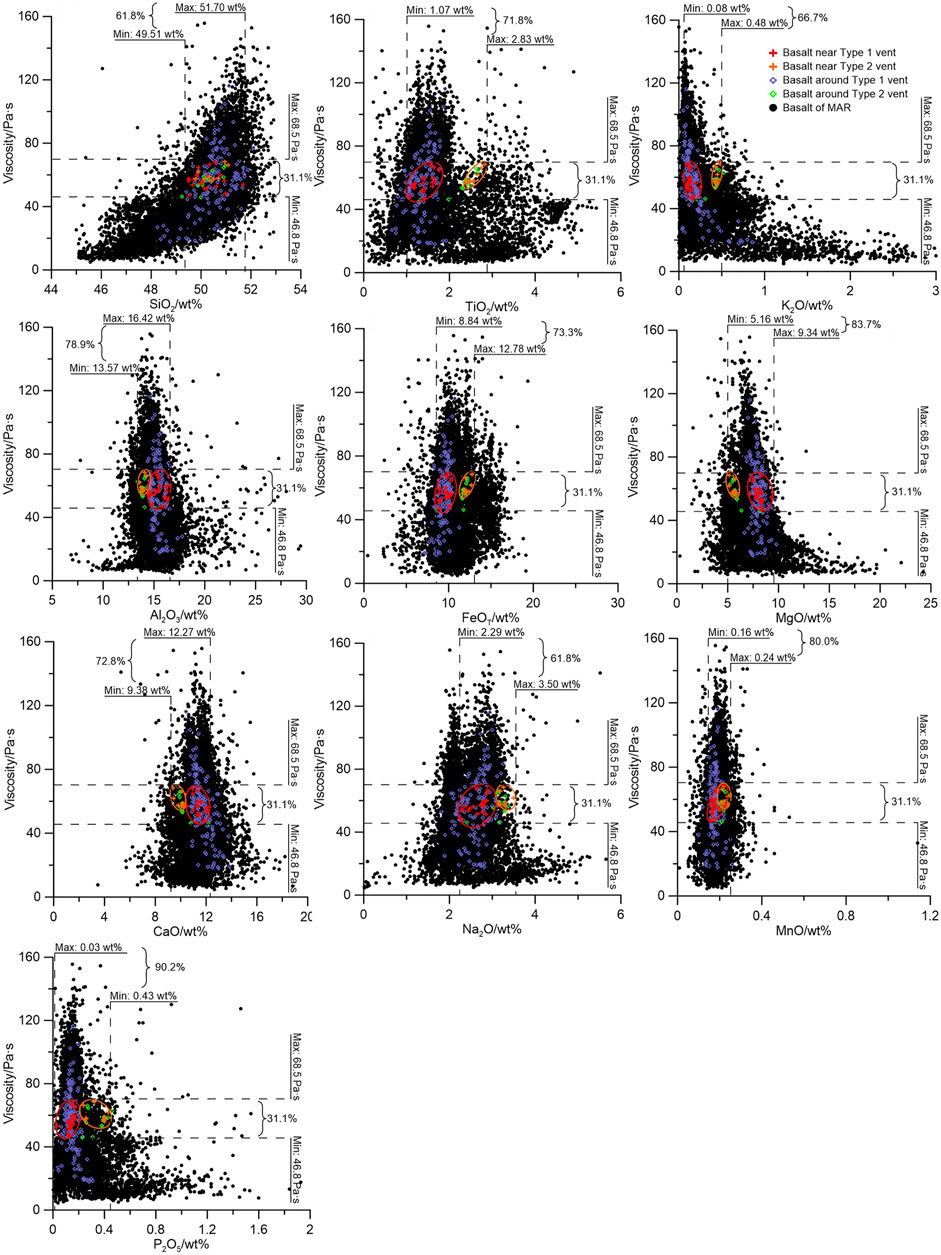
FIGURE 11. Major-element–viscosity scatter diagrams for BNV and MAR basalt. The BNV vents are divided into Type 1 (vents 1–6, enclosed by red circles) and Type 2 (vents 7–11, enclosed by orange circles). The dashed lines delineate the upper and lower values in BNV, and the annotations report the proportions of MAR samples in each range.
Due to the complex formation mechanism, controlling factors and individual differences of the seafloor magmatic system, tectonic fault system and hydrothermal evolution system, it may not be comprehensive to take the basalt viscosity of the mid-ocean ridge as a characteristic parameter to indicate the formation and existence of hydrothermal zone. However, the calculation results and statistical rules in this paper do find that the simulated viscosity data of basalt is correlated with the distance of the hydrothermal vent, as shown in the Figures 9, 10. It should be noted that, according to the thermal cooling of deep magma, fractional crystallization of magma chamber, different development degree of fault zone, and the timing of water-rock reaction, the indicator of analogy viscosity may only provide a possibility for the exploration of submarine hydrothermal field.
First, the viscosity or composition of the rock formations hosting such systems may be of little influence in their generation (besides having some influence on the elastic properties and therewith the fracture behavior of the material). The fracture process itself is governed by the local stress field and the elastic, response of the solidified magma to this stress. In fact, all of the zones that selected for analyses of hydrothermal vent regions in this study lie on fault zones. These are the result of tectonic processes that induce the fractures requires for the generation of permeability. How recovering samples from the ocean floor, performing compositional analyses and then calculating viscosity should return better results at identifying hydrothermal vents than the first order observations made during the dives required to recover these samples in the first place. Further, identifying thermal or chemical signatures of active vents in the water column maybe drastically faster, easier than analogy viscosity, though it may be a useful tool for exploration for hydrothermal vents as found here.
Second, crustal magma transport systems, independent of their geometry, remain filled with rock after solidification of the magma and fluid pathways (used by sea water during hydrothermal activity) are subsequently induced by fracturing. It is this fracturing process in combination with the temperature differential between the intrusion and the sea water that drives fluid circulation and hydrothermal activity (Baker and German 2004). Hydrothermal activity is correlated to spreading velocity since higher spreading velocity means higher heat flow and more intense fracturing. On the other hand, since the H2O content drastically affects melt viscosity, simply assuming H2O = 1.5* K2O maybe not a suitable approach for global mid-ocean ridge system. Varying the water content from 0 to 0.3 wt% for the melt of Table 3 at constant temperature induces a variation in modelled viscosity of > 100 Pas - much larger than the proposed “identifier viscosity range.” Especially since water solubility in melts is extremely sensitive to changes in pressure, water depth would likely be a much better indicator for water solubility.
Third, calculated viscosity from compositional data using an empirical model would introduce further uncertainty, and any apparent differences between the samples are composition driven and that information is already present in the compositional data, so whether viscosity is a better parameter for determining the location of hydrothermal vents than composition is not certain. For example, the uncertainty of the GRD model is ∼ ± 5% of the measured viscosity value (in this case that translates to ∼ ± 2.5 Pa s, i.e. ∼ ± 10% of the range suggested relevant to vent formation).
Fourth, the computed viscosities change only with composition and are assumed to have the same temperature (1,423°C). This may be not suitable because lava viscosity is very sensitive to temperature, and lava composition changes with temperature, due to fractional crystallization. The proposed explanation for finding that vents favoring a limited range of intermediate viscosities is based on the assumption that the computed viscosities were those of the lavas when they erupted and eventually formed as crust. But it is not clear the computed viscosities accurately represent the eruption viscosities, given the lack of temperature information. Alternative methods such as the MELTS algorithm are able to compute viscosity from major element compositions of basalts by also calculating the liquidus temperatures. Using such a method would be more meaningful to this study. Assuming one temperature for all the lavas is an important shortcoming.
Therefore, whether the analogy viscosity of basalts can be used as an indicator for determining the location of seafloor hydrothermal field needs more observations to be verified due to the complexities of magmatic activity and fault structure, as well as the multi-stage water-rock reaction. Hence, this paper provides a possible insight for exploration of hydrothermal vents rather than a fully developed method.
Conclusion
According to the calculation results of analogy viscosity, the basalts along the MAR system with analogy viscosity values ranged from 46.8 to 68.5 Pa·s are considered to be suitable for exploration the location of hydrothermal vents. However, because of the complex seafloor magmatic system, tectonic fault system and hydrothermal evolution system, the analogy viscosity parameter may only provide a possible insight for the exploration of submarine hydrothermal field rather than a developed method, which needs more observations to be verified.
Data Availability Statement
The original contributions presented in the study are included in the article/supplementary material, further inquiries can be directed to the corresponding author.
Author Contributions
CL designed the study and wrote the first draft. GW collected and analyzed the data. All authors discussed the results and contributed to the preparation of the manuscript.
Funding
This work was supported by the China Ocean Mineral Resources R&D Association (grant numbers DY135-S2-2) and by the National Nature Science Foundation of China (grant number 42006180).
Conflict of Interest
The authors declare that the research was conducted in the absence of any commercial or financial relationships that could be construed as a potential conflict of interest.
Publisher’s Note
All claims expressed in this article are solely those of the authors and do not necessarily represent those of their affiliated organizations, or those of the publisher, the editors and the reviewers. Any product that may be evaluated in this article, or claim that may be made by its manufacturer, is not guaranteed or endorsed by the publisher.
Acknowledgments
We gratefully acknowledge the efforts of all parties involved in collecting data.
References
Baker, E. T., and German, C. R. (2004). “On the Global Distribution of Hydrothermal Vent Fields,” in Mid-Ocean Ridges (Washington, DC: American Geophysical Union), 245–266. doi:10.1029/148GM10
Baker, E. T., Resing, J. A., Walker, S. L., Martinez, F., Taylor, B., and Nakamura, K.-i. (2006). Abundant Hydrothermal Venting along Melt-Rich and Melt-free Ridge Segments in the Lau Back-Arc Basin. Geophys. Res. Lett. 33, L07308. doi:10.1029/2005GL025283
Cheadle, M., and Grimes, C. (2010). To Fault or Not to Fault. Nat. Geosci. 3, 454–456. doi:10.1038/ngeo910
Chiba, H., Masuda, H., Lee, S.-Y., and Fujioka, K. (2001). Chemistry of Hydrothermal Fluids at the TAG Active Mound, MAR 26°N, in 1998. Geophys. Res. Lett. 28, 2919–2922. doi:10.1029/2000GL012645
Chin, C. S., Klinkhammer, G. P., and Wilson, C. (1998). Detection of Hydrothermal Plumes on the Northern Mid-Atlantic Ridge: Results from Optical Measurements. Earth Planet. Sci. Lett. 162, 1–13. doi:10.1016/s0012-821x(98)00141-1
Crone, T. J., Wilcock, W. S. D., and Mcduff, R. E. (2010). Flow Rate Perturbations in a Black Smoker Hydrothermal Vent in Response to a Mid-ocean Ridge Earthquake Swarm. Geochem. Geophys. Geosyst. 11, a–n. doi:10.1029/2009GC002926
Dias, Á. S., Mills, R. A., Ribeiro da Costa, I., Costa, R., Taylor, R. N., Cooper, M. J., et al. (2010). Tracing Fluid-Rock Reaction and Hydrothermal Circulation at the Saldanha Hydrothermal Field. Chem. Geol. 273, 168–179. doi:10.1016/j.chemgeo.2010.02.020
Dingwell, D. B. (2006). Transport Properties of Magmas: Diffusion and Rheology. Elements 2, 281–286. doi:10.2113/gselements.2.5.281
Escartin, J. (2009). Graviluck 2006 Cruise Blog. Available at: http://www.insu.cnrs.fr/a1890,decouverte-un-site-hydrothermal-jour-19.html.
Fulcher, G. S. (1925). Analysis of Recent Measurements of the Viscosity of Glasses. J Am. Ceram. Soc. 8, 339–355. doi:10.1111/j.1151-2916.1925.tb16731.x
Gale, A., Dalton, C. A., Langmuir, C. H., Su, Y., and Schilling, J.-G. (2013a). The Mean Composition of Ocean Ridge Basalts. Geochem. Geophys. Geosyst. 14, 489–518. doi:10.1029/2012GC004334
Gale, A., Laubier, M., Escrig, S., and Langmuir, C. H. (2013b). Constraints on Melting Processes and Plume-Ridge Interaction from Comprehensive Study of the Famous and North Famous Segments, Mid-Atlantic Ridge. Earth Planet. Sci. Lett. 365, 209–220. doi:10.1016/j.epsl.2013.01.022
GeoMapApp (2021). Available at: http://www.geomapapp.org/.
German, C. R., Connelly, D. P., Evans, A. J., and Parson, L. M. (2002). Hydrothermal Activity on the Southern Mid-Atlantic Ridge. San Francisco: Agu Fall Meeting Abstracts.
Giordano, D., Russell, J. K., and Dingwell, D. B. (2008). Viscosity of Magmatic Liquids: a Model. Earth Planet. Sci. Lett. 271, 123–134. doi:10.1016/j.epsl.2008.03.038
Haase, K. M., Koschinsky, A., Petersen, S., Devey, C. W., German, C., Lackschewitz, K. S., et al. (2009). Diking, Young Volcanism and Diffuse Hydrothermal Activity on the Southern Mid-Atlantic Ridge: The Lilliput Field at 9°33′SDiking, Young Volcanism and Diffuse Hydrothermal Activity on the Southern Mid-Atlantic Ridge: the Lilliput Field at 9°33′S. Mar. Geol. 266, 52–64. doi:10.1016/j.margeo.2009.07.012
Haase, K. M., and Scientific Party, M. (2005). Hydrothermal Activity and Volcanism on the Southern Mid-Atlantic Ridge. American Geophysical Union, Fall Metting Abstract, San Francisco.
InterRidge Vent Database (2020). InterRidge Global Database of Active Submarine Hydrothermal Vent Fields. Available at: http://vents-data.interridge.org/.
Johnson, H. P., Hutnak, M., Dziak, R. P., Fox, C. G., Urcuyo, I., Cowen, J. P., et al. (2000). Earthquake-induced changes in a hydrothermal system on the Juan de Fuca mid-ocean ridge. Nature 407, 174–177. doi:10.1038/35025040
Kong, L., Ryan, W. B. F., Mayer, L., Detrick, R., Fox, P. J., and Manchester, K. (1985). Bare Rock Drill Sites, ODP Legs 106 and 109: Evidence for Hydrothermal Activity at 23’N on the Mid Atlantic Ridge. Eos Trans. Am. Geophys. Union 66, 936.
Langmuir, C. H., Bézos, A., Escrig, S., and Parman, S. W. (2006). “Chemical Systematics and Hydrous Melting of the Mantle in Back-Arc Basins,” in Back-Arc Spreading Systems: Geological, Biological, Chemical and Physical Interactions (Washington, D. C.: American Geophysical Union: Geophysical Monograph Series 166), 87–146. doi:10.1029/166gm07
Langmuir, C. H., Fornari, D., Colodner, D., Charlou, J. L., Costa, I., Desbruyères, D., et al. (1993). Geological Setting and Characteristics of the Lucky Strike Vent Field at 37017'N on the Mid-atlantic Ridge. Eos Trans. Am. Geophys. Union 74, 99.
Le Maitre, R. W. (1984). A Proposal by the Iugs Subcommission on the Systematics of Igneous Rocks for a Chemical Classification of Volcanic Rocks Based on the Total Alkali Silica (Tas) Diagram. Aust. J. Earth Sci. 31, 243–255. doi:10.1080/08120098408729295
Lehnert, K., Su, Y., Langmuir, C. H., Sarbas, B., and Nohl, U. (2000). A Global Geochemical Database Structure for Rocks. Geochem. Geophys. Geosyst. 1, 179–188. doi:10.1029/1999GC000026
Macleod, C. J., Carlut, J., Escartín, J., Horen, H., and Morris, A. (2011). Quantitative Constraint on Footwall Rotations at the 15°45′N Oceanic Core Complex, Mid-Atlantic Ridge: Implications for Oceanic Detachment Fault Processes. Geochem. Geophys. Geosyst. 12, a–n. doi:10.1029/2011GC003503
Miranda, J. M., Luis, J. F., Lourenço, N., and Santos, F. M. (2005). Identification of the Magnetization Low of the Lucky Strike Hydrothermal Vent Using Surface Magnetic Data. J. Geophys. Res. 110, 387–405. doi:10.1029/2004JB003085
Morris, A., Gee, J. S., Pressling, N., John, B. E., Macleod, C. J., Grimes, C. B., et al. (2009). Footwall Rotation in an Oceanic Core Complex Quantified Using Reoriented Integrated Ocean Drilling Program Core Samples. Earth Planet. Sci. Lett. 287, 217–228. doi:10.1016/j.epsl.2009.08.007
Papale, P. (1999). Strain-induced Magma Fragmentation in Explosive Eruptions. Nature 397, 425–428. doi:10.1038/17109
PetDB The Petrological Database of the Ocean Floor (PetDB). Available at: http://www.earthchem.org/petdb/search.
Roman, C., and Singh, H. (2007). A Self-Consistent Bathymetric Mapping Algorithm. J. Field Robot. 24, 23–50. doi:10.1002/rob.20164
Roman, C., and Singh, H. (2005). Improved Vehicle Based Multibeam Bathymetry Using Sub-maps and SLAM. Ieee/rsj Int. Conf. Intelligent Robots Syst. IEEE, 3662–3669. doi:10.1109/IROS.2005.1545340
Rona, P. A., Klinkhammer, G., Nelsen, T. A., Trefry, J. H., and Elderfield, H. (1986). Black Smokers, Massive Sulphides and Vent Biota at the Mid-Atlantic Ridge. Nature 321, 33–37. doi:10.1038/321033a0
Ryan, W. B. F., Carbotte, S. M., Coplan, J. O., O'Hara, S., Melkonian, A., Arko, R., et al. (2009). Global Multi-Resolution Topography Synthesis. Geochem. Geophys. Geosyst. 10, a–n. doi:10.1029/2008GC002332
Scheirer, D. S., Fornari, D. J., Humphris, S. E., and Lerner, S. (2000). High-resolution Seafloor Mapping Using the Dsl-120 Sonar System: Quantitative Assessment of Sidescan and Phase-Bathymetry Data from the Lucky Strike Segment of the Mid-Atlantic Ridge. Mar. Geophys. Res. 21, 121–142. doi:10.1023/A:1004701429848
Schmidt, K., Garbe-Schönberg, D., Koschinsky, A., Strauss, H., Jost, C. L., Klevenz, V., et al. (2011). Fluid Elemental and Stable Isotope Composition of the Nibelungen Hydrothermal Field (8°18′S, Mid-Atlantic Ridge): Constraints on Fluid-Rock Interaction in Heterogeneous Lithosphere. Chem. Geol. 280, 1–18. doi:10.1016/j.chemgeo.2010.07.008
Seewald, J., Cruse, A., and Saccocia, P. (2003). Aqueous volatiles in hydrothermal fluids from the main endeavour field, northern Juan de Fuca ridge: temporal variability following earthquake activity. Earth Planet. Sci. Lett. 216, 575–590. doi:10.1016/s0012-821x(03)00543-0
Shaw, H. R. (1972). Viscosities of Magmatic Silicate Liquids; an Empirical Method of Prediction. Am. J. Sci. 272, 870–893. doi:10.2475/ajs.272.9.870
Sparks, R. S. J. (2003). Dynamics of Magma Degassing. Geol. Soc. Lond. Spec. Publ. 213, 5–22. doi:10.1144/GSL.SP.2003.213.01.02
Tivey, M. A., Dyment, J., Dyment, J., and Murton, B. J. (2010). “The Magnetic Signature of Hydrothermal Systems in Slow Spreading Environments,” in Diversity of Hydrothermal Systems on Slow Spreading Ocean Ridges (American Geophysical Union), 43–66. doi:10.1029/2008GM000773
Tivey, M. A., Schouten, H., and Kleinrock, M. C. (2003). A Near-Bottom Magnetic Survey of the Mid-Atlantic Ridge axis at 26°N: Implications for the Tectonic Evolution of the Tag Segment. J. Geophys. Res. Atmos. 108, 2277. doi:10.1029/2002jb001967
Wang, Z. B., Guang-Hai, W. U., and Han, C. H. (2014). Geochemical Characteristics of Hydrothermal Deposits and Basalts at 49.6°E on the Southwest Indian Ridge. J. Mar. Sci 32(1), 64–73. doi:10.3969/j.issn.1001-909X.2014.01.008
Wright, T. L., Kinoshita, W. T., and Peck, D. L. (1968). March 1965 Eruption of Kilauea Volcano and the Formation of Makaopuhi Lava Lake. J. Geophys. Res. 73, 3181–3205. doi:10.1029/JB073i010p03181
Keywords: basalt, geochemical characteristics, hydrothermal vents, Mid-Atlantic Ridge, viscosity
Citation: Li C, Wang G, Yan S and Du D (2022) Geochemical Analogy Viscosity of Mid-Ocean Ridge Basalt as an Indicator for Determining the Location of Seafloor Hydrothermal Fields?. Front. Earth Sci. 10:951553. doi: 10.3389/feart.2022.951553
Received: 24 May 2022; Accepted: 31 May 2022;
Published: 24 June 2022.
Edited by:
Shengyao Yu, Ocean University of China, ChinaCopyright © 2022 Li, Wang, Yan and Du. This is an open-access article distributed under the terms of the Creative Commons Attribution License (CC BY). The use, distribution or reproduction in other forums is permitted, provided the original author(s) and the copyright owner(s) are credited and that the original publication in this journal is cited, in accordance with accepted academic practice. No use, distribution or reproduction is permitted which does not comply with these terms.
*Correspondence: Guohuai Wang, MTgzMDY0ODU1NjdAc2luYQ==