
94% of researchers rate our articles as excellent or good
Learn more about the work of our research integrity team to safeguard the quality of each article we publish.
Find out more
ORIGINAL RESEARCH article
Front. Earth Sci., 25 July 2022
Sec. Solid Earth Geophysics
Volume 10 - 2022 | https://doi.org/10.3389/feart.2022.951033
This article is part of the Research TopicJoint Inversion and Imaging in GeophysicsView all 12 articles
The June 23 2020 Oaxaca Mw 7.4 interplate thrust earthquake struck the state of Oaxaca in Mexico, generating strong shaking and a long-lived tsunami. This earthquake is well recorded by the teleseismic, high-rate Global Positioning System (GPS) and Interferometric Synthetic Aperture Radar (InSAR) data, which provides an opportunity to understand the rupture characteristics of the Mexican subduction zone. Here, an integrated inversion strategy involving centroid moment tensor inversion and kinematic finite-fault inversion is used to study the rupture history of the 2020 Oaxaca earthquake. The fault geometry and source duration time derived from the centroid moment tensor solution are used as prior information in linear kinematic finite-fault joint inversion. The rupture initial point and relative weight of each dataset are determined to estimate a well-constrained rupture model. The finite-fault model shows the rupture expanded bilaterally around the hypocenter, the peak slip is 3.5 m, the main slip was located at a depth of 15–30 km, the whole rupture lasted about 20 s, and a 95% moment rate was released at 15 s. The half-duration of the finite-fault inversion is consistent with the centroid moment tensor inversion results (half-duration 9 s), which shows the good resolution of the temporal information. The total scalar moment was 1.5 × 10²⁰ Nm, equivalent to a moment magnitude of Mw 7.4. The integrated inversion strategy used in this study is useful since the prior information can be derived and used to constrain the rupture process. Both the centroid moment tensor and finite-fault inversion mainly rely on identical temporal information provided by teleseismic P waveforms. The 2020 Oaxaca earthquake was mainly the interaction between Cocos and the North American plate, and the slow slip events may be the key factor affecting the seismogenic zone width in the Oaxaca region.
The June 23 2020 Mw 7.4 Oaxaca, Mexico Earthquake nucleated at the southern Mexican subduction zone of the Cocos plate which is beneath the North American plate at 15:29:04 UTC. The relative convergence rate at the Oaxaca state is ∼70 mm/yr (Figure 1; DeMets et al., 2010) and the interseismic coupling has been inferred to be high (at least 50%) (Rousset et al., 2017). The subduction zones have accounted for most major and great earthquakes in the world because of the lithospheric plates sinking into the viscous fluid-like mantle (Ruff, 1996; Wen et al., 2021). In the Mexican subduction zone, most of the large Mexican earthquakes were Mw 7–8 and this area has a short seismic average recurrence of 30–50 yr (Singh et al., 1981, 1983). Recently, the Mexican subduction zone experienced a series of large earthquakes, for example, the 2012 Mw 7.4, 2017 Mw 8.2, and 2018 Mw 7.2 earthquakes (Figure 1), indicating the strong seismicity in this region. The Oaxaca earthquake caused large surface deformation and was well recorded by the geodetic observations, involving Global Positioning System (GPS) measurements and Interferometric Synthetic Aperture Radar (InSAR) images, and global teleseismic stations which were well distributed with a good azimuth coverage and takeoff angle. This earthquake provides an opportunity to study the slip behavior to better understand the dynamic mechanism and potential seismic risk in the Mexican subduction zone.
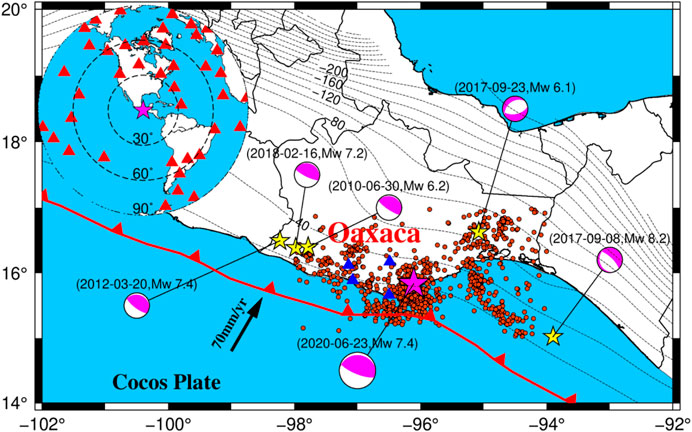
FIGURE 1. Map of the epicentral region of the 2020 Oaxaca earthquake in the Mexican subduction zone; the yellow and magenta stars denote the epicentral locations of historical earthquakes which Mw >6 since 2012 from the USGS earthquake catalogs and 2020 Oaxaca earthquake, respectively. The magenta beach balls denote the focal mechanism of each earthquake event. The dashed black contours denote slab surface depths from the slab 2.0 model (Hayes et al., 2018) with a contour interval of 20 km. The blue and red triangles (upper-left insets) denote the 4 high-rate GPS stations and 40 teleseismic stations with an epicenter distance of 30°‒90°. The red circles denote the Mw ≥3.5 aftershocks a month after the 2020 Oaxaca earthquake.
This earthquake caused at least 10 fatalities and damage to 2,000 homes (Tracy et al., 2020), due to the devastating shaking and landslides. Generally, the U.S. Geological Survey (USGS), Global Centroid Moment Tensor (GCMT) group, and GEOFOrschungsNetz (GEOFON) provide fast moment solutions to analyze the preliminary earthquake using different wave phases (e.g., teleseismic body wave, surface wave, or very long-period W phase (100–1,000 s) (Duputel et al., 2012)). The regional institution Servicio Sismológico Nacional (SSN) also provides the epicenter location and moment tensor solution of the 2020 Oaxaca earthquake. The hypocenter (15.803° N, 96.134° W, and 22.6 km depth) reported by SSN is located about ∼16 km southwest of the hypocenter from the USGS (15.886° N, 96.008° W, and 20 km), which is closer to the coast. The moment tensor solutions reported from SSN, USGS, GCMT, and GEOFON show that this earthquake was a thrust event with a low dip angle (Table 1). However, moment tensor solutions are not enough to describe all source characteristics and assess the seismic hazards.

TABLE 1. Comparisons of the earthquake parameter of the 2020 Oaxaca Earthquake with different studies.
The spatiotemporal information of an earthquake from finite-fault inversion has been used to analyze seismic source processes and characteristics (Olson and Apsel, 1982; Hartzell and Heaton, 1983). For the 2020 Oaxaca earthquake, the rupture models from finite-fault inversion have been investigated (Melgar et al., 2020; Guo et al., 2021; Wen et al., 2021). The finite-fault model from existing studies shows that the main slip was located at depths of 15–30 km, while the fault geometry and hypocenter location are different in their research. Melgar et al. (2020) used an average strike of 278° and an average dip of 21° according to the hypocentral region to inverse the rupture process. Guo et al. (2021) used a grid search method to determine the strike and dip angle, and finally, a strike and dip of 272° and 23°, respectively, are used. Wen et al. (2021) used a rectangular fault dislocation model in elastic half-space (Okada, 1985) to estimate the fault geometry from static GPS and InSAR observations, and the derived strike, dip, and rake angles are 264.6°, 28.8°, and 58.6°, respectively. To some extent, near-field geodetic data could not constrain the fault geometry well since they are located on one side of the epicenter for megathrust earthquakes, and lack temporal information. Therefore, the centroid moment tensor inversion, including fault geometry and source duration time should be used to constrain the linear kinematic finite-fault inversion. In addition, seismic data, geodetic data, and/or tsunamis buoy data are involved in their finite-fault joint inversion, and the finite-fault model from existing studies shows that the main slip was located at depths of 15–30 km, even though the fault geometry and hypocenter location are different in their research. However, the relative weight of each dataset, which is a critical challenge in joint inversion, has not been well studied. The resolution of the finite-fault joint inversion result should be further discussed during this earthquake.
In this study, we use an integrated strategy involving centroid moment tensor solution and finite-fault inversion to study the 2020 Mw 7.4 Oaxaca earthquake. We use the vertical-component teleseismic P waves to invert the centroid moment tensor and extract the fault geometry parameter (i.e. strike, dip, and rake). The standard deviation of the fault parameter is calculated using the jackknife re-sampling method. Compared with the existing studies, we performed the linear kinematic joint inversion (Zhang et al., 2012) combining the teleseismic P waves, high-rate GPS waveforms, static GPS offsets, and InSAR data. The rupture initial point and the relative weight of each dataset are determined by using the grid search in this study to obtain a well-constrained rupture model. To assess the rupture model obtained from this event, we performed the resolution test and stability test to verify the efficiency of the joint inversion method. Finally, we discuss the rupture characteristics of this event through our finite-fault model.
In this study, the broadband teleseismic records were downloaded from the Incorporated Research Institutions for Seismology (IRIS) website. We only selected the P waves on the vertical components and the stations with an epicentral distance of 30°–90°. We reselected the stations with an azimuth interval of 5° to provide a good homogeneous azimuthal coverage of the stations on the epicenter and only retained records with high signal-to-noise ratios. Finally, 40 P waveforms were selected (inset in Figure 1) to invert the moment tensor and finite-fault model. The raw data were resampled to 1 Hz and translated into displacements after removing the instrument response. To satisfy the point source approximation, we used a third-order Butterworth bandpass filter of 0.01–0.05 Hz on the teleseismic P waves in centroid moment tensor inversion, and applied a bandpass filter of 0.01–0.2 Hz in finite-fault inversion. It is noted that we use identical teleseismic waveforms that mainly provide temporal information of the earthquake in moment tensor inversion and finite-fault inversion; this data consistency contributes to avoiding possible biases in prior information due to different observed data handling strategies.
We collect four high-rate GPS data (1 Hz sampling rate at station OXPE and 5 Hz sampling rate at stations OXUM, TNNP, and TNSJ) from the University NAVSTAR Consortium (UNAVCO) where the minimum and maximum epicentral distances are about 45 km (OXUM) and 113 km (TNNP), respectively. The raw observed data are processed using the precise point positioning algorithm with ambiguity resolution (PPP-AR) using UPD products (Li et al., 2013; Li et al., 2021). The precise orbits and clocks with 30 s from the Center for Orbit Determination in Europe are used for the PPP method. Finally, we obtained the displacement position time series and rotated to local north, east, and up coordinates (Bock et al., 2011; Li et al., 2014). The displacement time series are resampled to 1 Hz and we obtain the static offset after the displacement sequence converges. The maximum offset of the OXUM station which is closest to the epicenter is about 14 cm in horizontal and 3.8 cm in vertical components. We applied a bandpass filter of 0.02–0.2 Hz to the high-rate GPS displacement waveforms in finite-fault inversion.
We collected InSAR data from the European Space Agency (ESA) Copernicus Sentinel-1A. Two ascending (T005A and T107A) and one descending (T070D) orbits were selected to cover the whole area affected by the event. The pre-event images of T005A, T107A, and T070D were collected on 12, 19, and 22 June 2020, respectively, and the post-event scenes are from 24, 25, and 28 June 2020, respectively. We used an open-source Jet Propulsion Laboratory (JPL) InSAR Scientific Computing Environment (ISCE) version 2 software (Rosen et al., 2012) to process the SAR images from the single look complex products. The precise orbit data were used to reduce potential orbit errors. We use a Shuttle Radar Topography Mission (SRTM) digital elevation model with a spatial resolution of about 30 m (Farr et al., 2007) to remove the topographic contribution of the interferograms. A stick, high-precision co-registration is performed on the Sentinel-1 data to meet the co-registration accuracy of at least 0.001 pixels. A power spectrum filter method (Goldstein and Werner, 1998) is used to smooth the interferograms. The interferograms are then unwrapped using the Snaphu method (Chen and Zebker, 2000) and geocoded into the World Geodetic System 84 coordinate system. The line-of-sight (los) displacement images are shown in Supplementary Figure S1. Finally, 99, 186, and 172 data points were retrieved from the T005A, T107A, and T070D tracks, respectively, using the quadtree sampling algorithm (Jónsson et al., 2002) to downsample the InSAR observations.
Earthquake rupture processes inverted from finite-fault inversion are critical to understanding source physics and assessing hazards. Finite-fault inversion often pre-assumes a fault plane, and this fault plane can be solved by seismic or geodetic data. Teleseismic P waves are useful because of their well homogeneous azimuthal coverage, while geodetic data are located on one side of the epicenter for megathrust earthquakes. In addition, teleseismic P waves show a good convergence with the depth since the takeoff angles for teleseismic stations are quite small and the ray path is straight down from the source (Wei et al., 2013). The centroid moment rate function (or source duration time) and fault mechanism derived from the moment tensor solution provide prior information to the kinematic finite-fault inversion. Finite-fault joint inversion is widely used to imagine the earthquake processes since it is complementary to different observed data and different resolutions (i.e., spatial and temporal resolution) (Ji et al., 2002; Yue and Lay, 2013; Yi et al., 2017). The prior assumptions (e.g., maximum duration of the rupture history) should be given to constrain the inversion results. Therefore, an integrated inversion strategy involving the centroid moment tensor and finite-fault joint inversion is used in this study to analyze the 2020 Oaxaca earthquake source characteristics. We use teleseismic P waves to invert the centroid moment tensor and extract the strike, dip, and rake of the nodal planes and the duration of the earthquake rupture history to finite-fault joint inversion.
The earthquake event can be treated as a point source if the epicenter distance was large enough. The form of observation, coefficient matrix, and unknown parameter can be expressed as
where
For a preliminary location (i.e. hypocenter from the earthquake research institutions), we can obtain a moment tensor solution after determining the optimum source time function (or half-duration time). To better explain the observed data, we attempt to find a centroid location that is better than the preliminary location estimate. The procedure is consistent with the W phase source inversion (Duputel et al., 2012); we set up a 3D grid search (latitude-longitude-depth), where each grid node is used as a potential centroid location and a moment tensor inversion is made. The normalized misfit (
Our finite-fault joint inversion method is based on the study by Zhang et al. (2012). This method is a linear combination with the seismic and geodetic data performed at the time domain which is convenient to realize. In addition, this method only set a maximum rupture velocity and duration time to constrain the rupture area, indicating that each subfault is allowed to rupture complex. We use vertical-component teleseismic P waveforms, three components of high-rate GPS displacement waveforms, static GPS offset, and InSAR data to invert the rupture process. The joint inversion equation can be expressed as
where
Figure 2A shows the locations obtained from our centroid moment tensor solution and others reported from existing research institutions (i.e. USGS, GCMT, SSN, and GEOFON). The centroid location obtained in this study is longitude −96.1° and latitude 15.7°, which is about 9.5 km to the south of the SSN location (Figure 2A). The centroid depth is 18 km (Figure 2C) and is close to the depth contour of 20 km corresponding to the Slab 2.0 model (Hayes et al., 2018) of the megathrust. The fault geometry parameters extracted from the moment tensor solution are listed in Table 1. The final fault mechanism obtained from the centroid moment tensor solution is 276° strike, 24° dip, and 67° rake, which is consistent with the 2020 Oaxaca earthquake region with the northwest direction and low dip angle. The standard deviations of strike, dip, and rake angles calculated from the jackknife re-sample method are 2.5°, 0.6°, and 2.1°, respectively (Supplementary Figure S2). These results are acceptable compared with the existing studies. Figure 2B shows the normalized moment rate function, indicating that the whole duration time is 18 s. The half duration which reaches the peak moment rate is 9 s and slightly small than the USGS (13.1 s) and GCMT moment tensor solution (11.9 s). Figure 2C shows the optimal depth we obtained and its fault mechanism with each depth from the moment tensor solution. Figure 2D shows the normalized misfit between the observed and synthetic data at each grid node, and the minimum misfit is 0.1663. In addition, the comparison between the observed and synthetic data shows a good fit (Figure 3), and most correlation coefficients are larger than 0.8. The average correlation coefficient between the observed and synthetic waves is 0.9, which means that the centroid moment tensor solution can explain the observed data well.
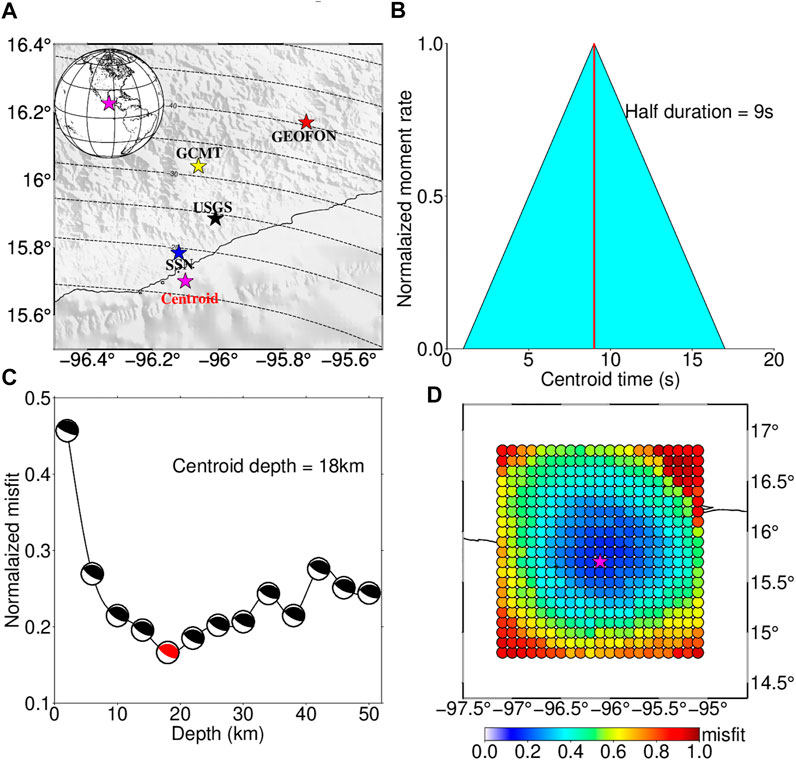
FIGURE 2. Map of the epicentral region of the 2020 Oaxaca earthquake and centroid moment tensor solution. (A) Map view of the epicentral locations, black, yellow, red, blue, and magenta stars show the epicenters from the USGS, GCMT, GEOFON, SSN, and this study, respectively. (B) Searched normalized moment rate function. (C) Map view of the normalized misfit between the observed and synthetic data with different centroid depths; the black beach ball denotes the focal mechanism with the depth and the red beach ball denotes the optimal focal mechanism when the centroid depth is selected at 18 km. (D) Normalized residual with the different centroid epicentral locations used in our study areas.
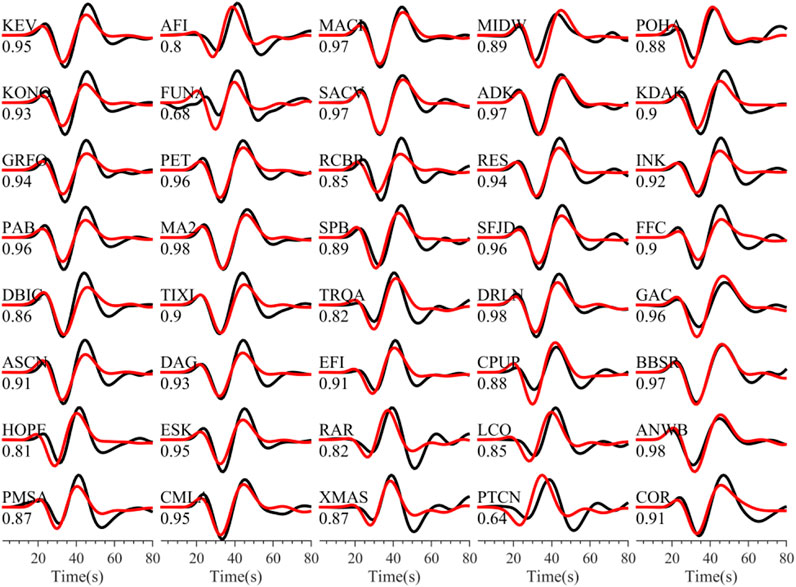
FIGURE 3. Comparisons of the 40 observed (black) and synthetic (red) teleseismic P waves data. The letters above the waves denote the station name of teleseismic and the digit under the waveforms denotes the correlation coefficient between the observed and synthetic waves.
The fault mechanism of the strike and dip obtained from our centroid moment tensor solution is used in finite-fault inversion, and the slip angles are estimated in the inversion. The fault plane used is 85 km long and 110 km wide, and is discretized into 374 subfaults where each has dimensions of 5 km × 5 km. This fault plane is large enough to cover the rupture area according to the existing studies. We used the epicenter location reported by SSN as a rupture initiation point of the earthquake first. A total rupture duration of 25 s is assumed, that is, the rupture window of each subfault lies in 0–25 s. It is to be noted that the maximum duration of the finite-fault inversion should be close to or larger than the centroid moment rate duration to capture the rupture history. Therefore, the centroid moment tensor inversion is necessary to provide prior information on fault geometry and source duration time. To stabilize the inversion, a maximum rupture velocity and maximum duration are generally used to limit the subfault rupture window. The cost is the possible loss of actual source information which lies outside of the time window. In principle, we prefer a narrow time that generates a small enough misfit, and a balance should be made between the window width and the normalized misfit. We tested different values of maximum rupture velocity and duration and found 3.6 km/s and 10 s to be suitable (Figure 4A).
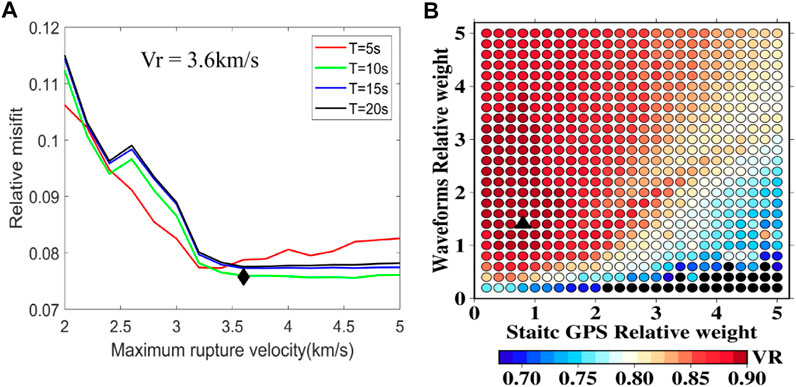
FIGURE 4. (A) Normalized misfit plotted against different maximum rupture velocities for maximum rupture durations of 5 s (red), 10 s (green), 15 s (blue), and 20 s (black). The black diamond marks the maximum rupture velocity of 3.6 km/s and a maximum rupture duration of 10 s for each subfault used in this study. (B) Total VR distribution with different relative weights of static GPS and waveform data. The black triangle marks the relative weight. The static GPS and waveform are 0.8 and 1.4, respectively, used in this study.
In this study, the variance reduction (VR) (Kim and Dreger, 2008; Zhang et al., 2012; Melgar et al., 2017) for each type of data and the total are used as an objective function to evaluate the inversion results and the differences of synthetics. The variance reduction is calculated as (Xu et al., 2022)
where superscript “obs” and “syn” represent observed and synthetic data points in the inversion, respectively,
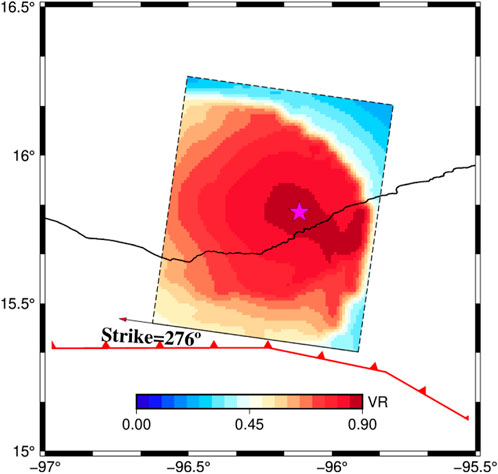
FIGURE 5. Total VR with the model parameters in joint inversion at each grid on the fault plane; the magenta star denotes the hypocenter location corresponding to the maximum VR.
The slip distribution, source time function (STF), subfault source time functions, and slip angle obtained from our joint inversion results are shown in Figure 6. The total seismic scalar moment is about 1.5 × 10²⁰ Nm, equivalent to a moment magnitude of Mw 7.4, consistent with the results reported from GCMT and GFZ. The peak slip of 3.5 m is mostly confined to the major slip area around the hypocenter, the peak slip is slightly smaller than the USGS solution (∼8 m) and those shown by Melgar et al. (2020) and Wen et al. (2021) (∼5 m); it is mainly because the rupture area shows a greater elliptical asperity around the epicenter. The main slip of this model is well constrained between 15 and 30 km, and is consistent with the existing studies (Melgar et al., 2020; Guo et al., 2021; Wen et al., 2021; Yan et al., 2022). The slip angle of our model shows that the 2020 Mw 7.4 Oaxaca earthquake was a thrust slip with a minor right slip event (Figure 6B). In our preferred model, the slip angle is decreased from the deep to shallow depth, and the slip angle we obtained is close to 90° below the epicenter and close to 67° above the epicenter. The whole rupture process lasted for about 20 s (Figure 6C), and the source time function and subfault source time functions (Figure 6D) show that the rupture process of this earthquake is simple with a single asperity. The moment rate reached a peak value of 2.37 × 10¹⁹ Nm/s at 9 s, the half-duration of the finite-fault inversion is consistent with the centroid moment tensor inversion results (half duration 9 s), indicating the consistency of the centroid moment tensor and finite-fault inversion.
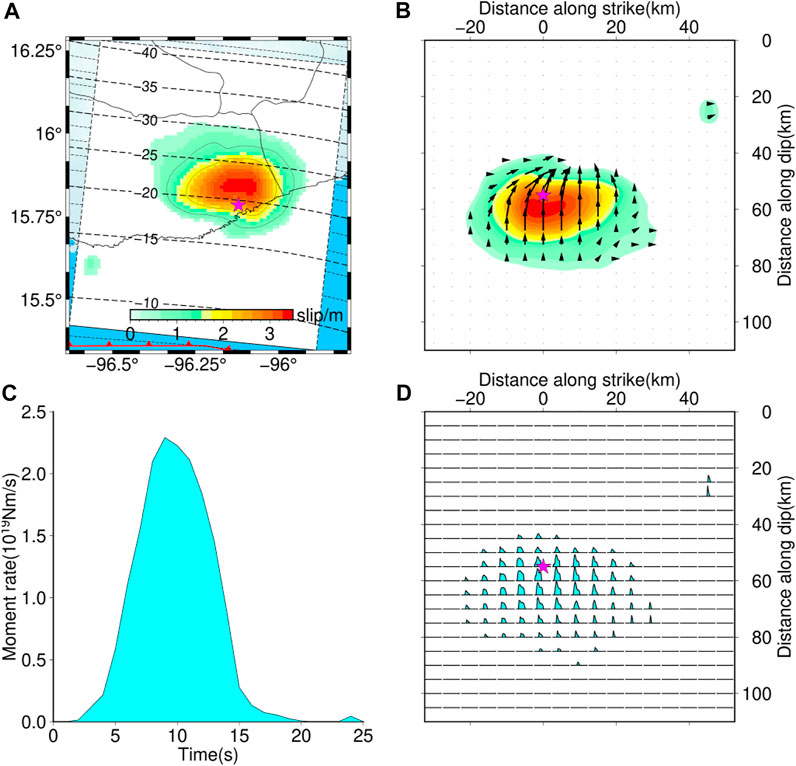
FIGURE 6. Finite-fault results of the 2020 Oaxaca earthquake from joint inversion. (A) Surface projections of fault slip distribution; the magenta stars denote the epicentral location. (B) Slip distribution on the fault plane, the black arrow denotes the slip direction of each subfault. (C) Source time function (STF) of this earthquake. (D) Subfault source time functions of each subfault on the fault plane.
Figure 7 shows the fitting of the teleseismic data and high-rate GPS data. The average correlation coefficient between the observed and synthetic waveform of teleseismic data is greater than 0.82. In addition, the InSAR data show a good fitting that the average residual is 0.01 m (Figure 8). The VR of the waveforms (teleseismic and high-rate GPS), static GPS, and InSAR data are 84.0, 98.2, and 95%, respectively, indicating that the model can explain the observed data well. Figures 9A,B show the fitting of the static GPS displacement in horizontal and vertical components, and the OXUM station shows a good consistency of the observed and synthetic data because of the high signal-to-noise ratio of the observed data. In addition, to better verify the robustness of the slip model, we make forward predictions using the observations not included in the joint inversion. The coastal uplift observation data 2 days after the events were collected from the study by Ramírez-Herrera et al. (2020). The observed data show that the maximum coastal uplift is about 0.53 m near the epicenter, and this observed data fit well with the 0.55 m of the uplift reported by tide gauge data at Huatulco (Melgar et al., 2020). We calculated the synthetic coastal uplift using our preferred rupture model and compared it with the observed data (Ramírez-Herrera et al., 2020), and the VR is 89.7% and the result is shown in Figure 9C, indicating a well-fitting with the observed data.
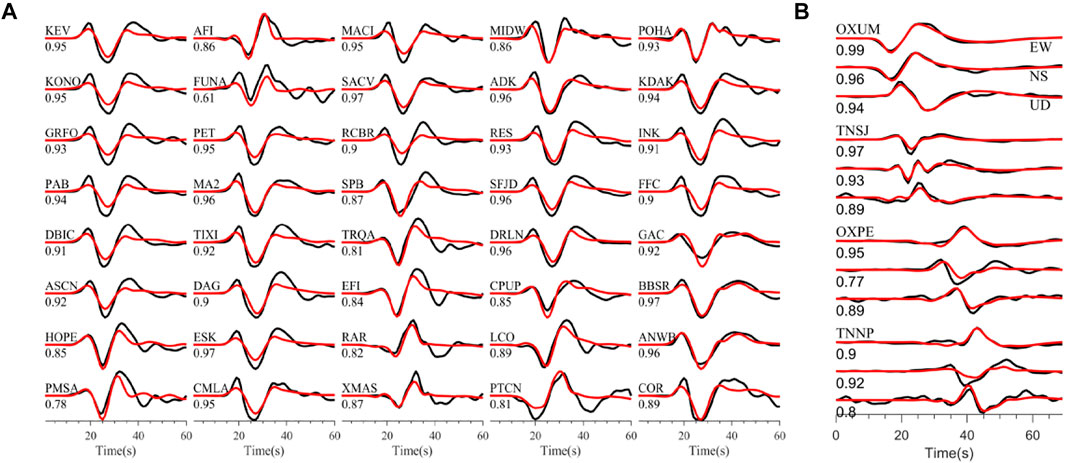
FIGURE 7. Comparisons of the observed (black) and synthetic (red) waves. (A) Denotes the 40 teleseismic P waves’ data. (B) Denotes the four high-rate GPS waves. The letters above the waves denote the station names and the digit under the waves denotes the correlation coefficient between the observed and synthetic waves.
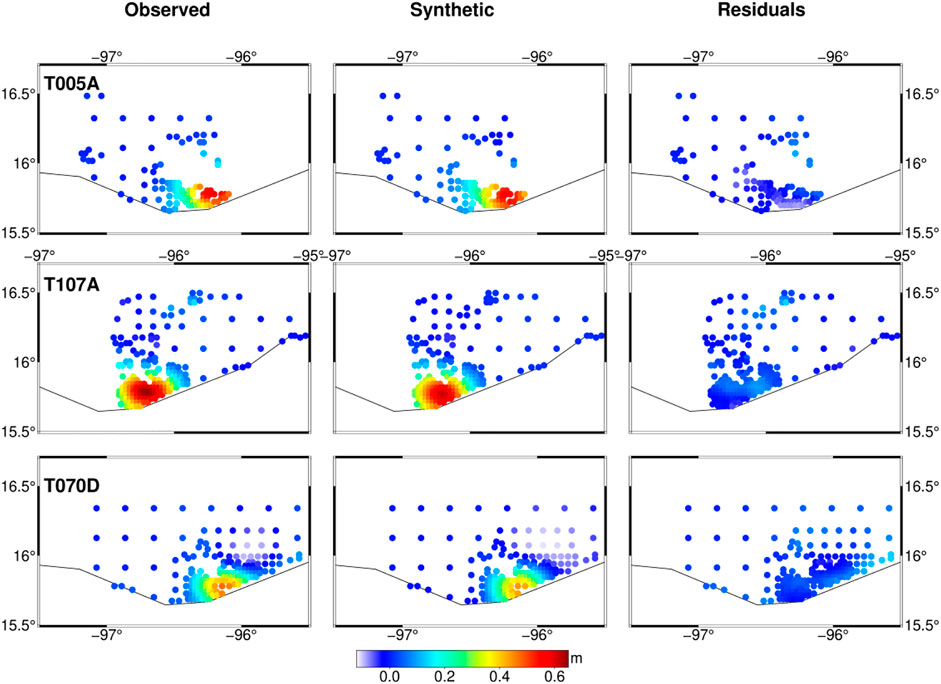
FIGURE 8. InSAR observed (left panel), synthetic (middle panel), and associated residuals (right panel). The first and second row denotes the T005A and T107A images, respectively, and the third denotes the T070D image.
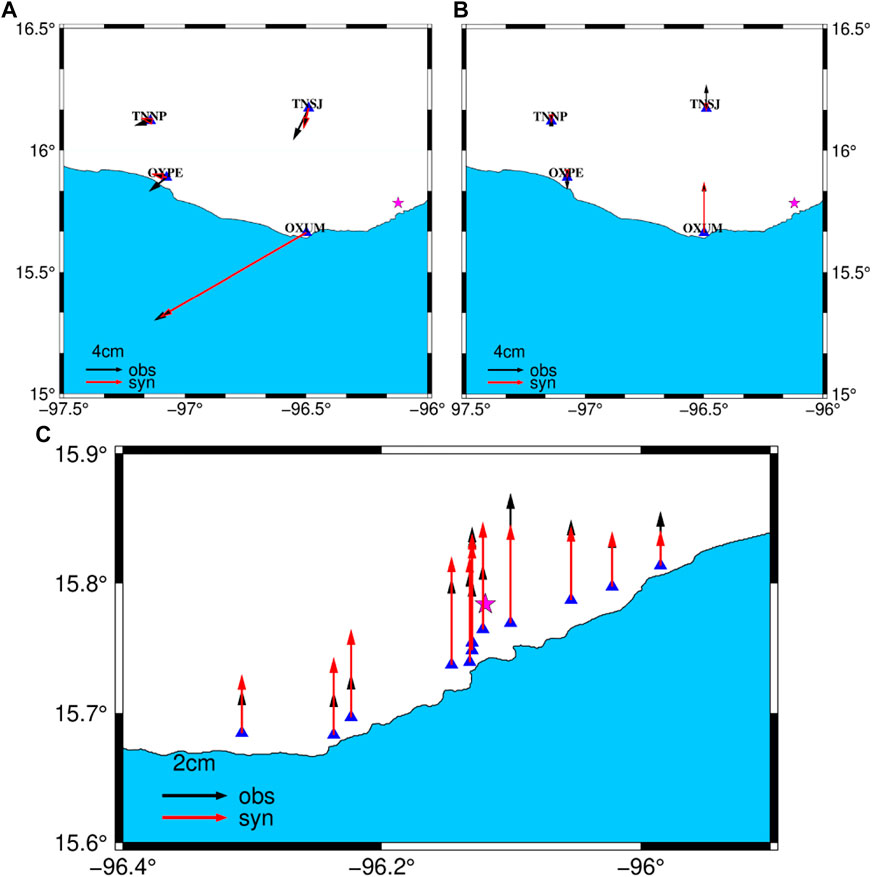
FIGURE 9. (A) Comparison between the observed horizontal (black) and synthetic horizontal (red) static GPS data. (B) Comparison between the observed vertical (black) components and synthetic vertical (red) static GPS data. (C) Comparison between the observed (black) and synthetic (red) coastal uplift data from the study by Ramírez-Herrera et al. (2020).
To better understand the rupture process of the 2020 Mw 7.4 Oaxaca earthquake, we present the snapshot form of the slip rate distributions of this rupture model in Figure 10. The result shows that the rupture expanded bilaterally around the hypocenter, and that the rupture initiated at 4 s around the hypocenter and propagated outward. The source time functions show that the moment rate increased and decreased rapidly, at 9 s, the moment rate reached a peak value of 2.32 × 10¹⁹ Nm/s, corresponding to the peak slip of 1.6 m. The average rupture velocity calculated is about 3 km/s, consistent with the existing studies (Melgar et al., 2020; Guo et al., 2021; Wen et al., 2021). In the first 4 s, the rupture initiated gradually, and at 4–8 s, the moment released rapidly and the magnitude reached Mw 7.17 at 9 s. At 8–14 s, the moment rate propagates below the epicenter, and most moment rates are released at 14 s. The source time function shows a symmetrical energy release pattern and the slip distribution model shows that this earthquake was a simple event with a single asperity.
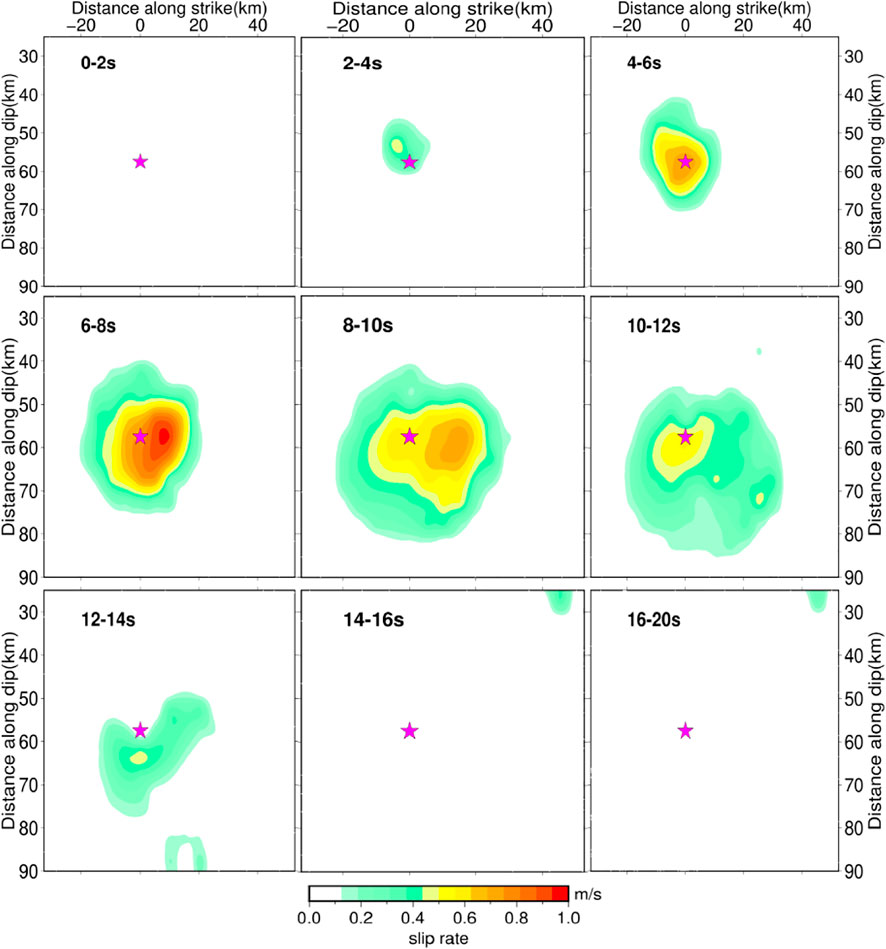
FIGURE 10. Snapshots of the slip rate for the 2020 Oaxaca earthquake with a time interval of 2 s, most of the moment was released at 14 s. The magenta star denotes the epicenter.
In this study, we also tested different datasets to examine the coseismic slip model of the 2020 Oaxaca earthquake. The geodetic (static GPS and InSAR) inversion result (Supplementary Figure S3B) shows a slightly narrow rupture area than the waveforms’ (teleseismic and high-rate GPS) result (Supplementary Figure S3A). This is mainly because the geodetic data are located on one side of the epicenter of the megathrust earthquake, resulting in a low resolution on the shallow and deep portions. Compared with the geodetic data, global teleseismic data show a good azimuthal coverage, while the teleseismic data only constrain the relative position of fault slips compared with the hypocenter. Therefore, it is complementary to join the seismic and geodetic data in finite fault inversion to constrain the spatiotemporal history.
For joint inversion, the critical challenge is to determine the relative weights between different datasets. In this study, the VR which is influenced by the relative weight of each dataset is defined as a function to evaluate the inversion model. We examine the rupture model with different weights through the trial-and-error method, and the rupture model changes smoothly with different smoothness weights (Supplementary Figures S4A–D), relative weights (Supplementary Figures S4E–H), and maximum rupture velocity (Supplementary Figures S4I–L). It is noted that the rupture area is slightly small than the others and close to the result from geodetic inversion (Supplementary Figure S3B) when the relative weights of waveform, static GPS, and InSAR data are 0.2, 1, and 1, respectively. This is mainly because the relative weight of each dataset is inappropriate and the weight of the waveform data is small, leading to the result being close to the result from geodetic inversion. In our preferred rupture model, the relative weight of waveforms data, static GPS, and InSAR data are 1.4, 0.8, and 1, respectively. These weights were chosen by considering that (1) the waveform (teleseismic and high-rate GPS) and static deformation (static GPS and InSAR) are weighted equally since they are normalized by dividing by its vector
The fault mechanism obtained from existing institutions and studies shows a slight difference from each other. We test the stability of inversion with different fault geometry listed in Table 1. Figure 11 shows the different slip distribution models and source time functions. The results show that the main slip is constrained at depths of 15–30 km, the whole rupture process lasted about 20 s, and the main characteristics of these rupture models are consistent with each other. The InSAR data that have dense coverage over the main slip result in a well constrain resolution on spatial information even if the strike and dip are varied from each other. It is mainly because the finite-fault inversion tends to put ruptures to the locations closest to their real positions after determining the hypocenter locations. The source time functions also show a good consistency with each other, indicating the efficiency of joining the seismic and geodetic data in finite-fault inversion to constrain the spatiotemporal information on the fault plane.
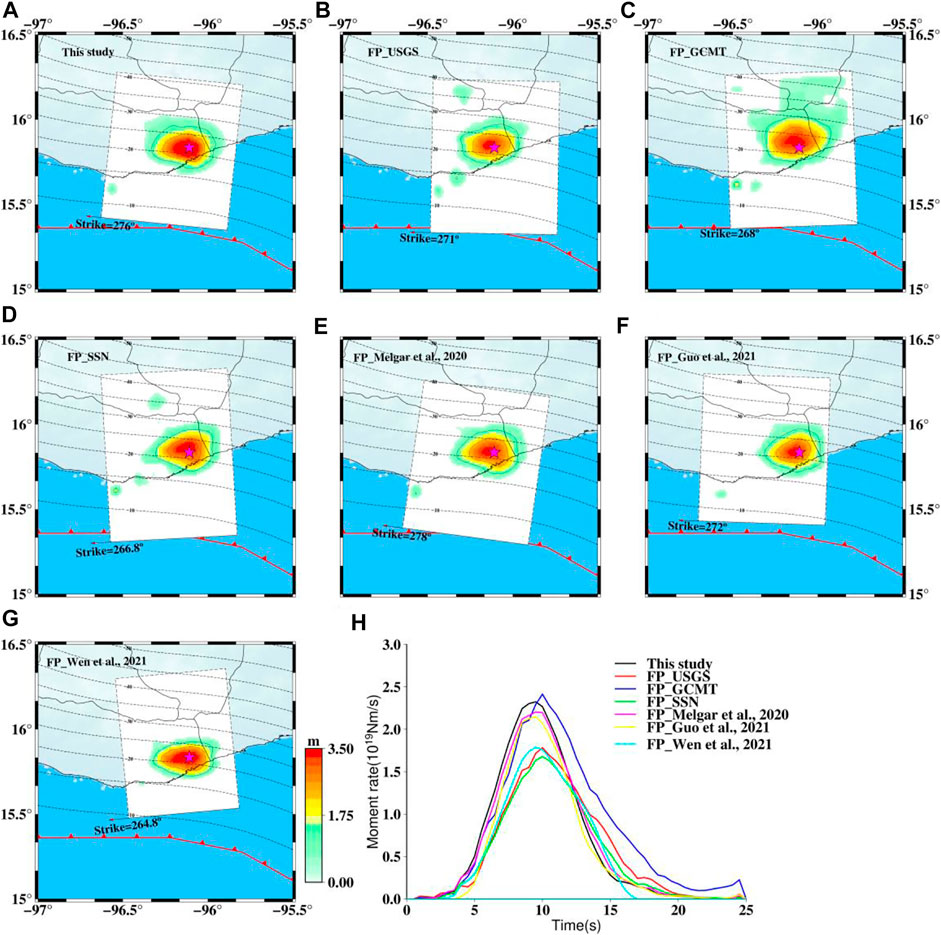
FIGURE 11. Surface projections of the slip distribution and source time functions. (A-G) denote the surface projections of the slip distribution used different fault plane [i.e. fault geometry from this study, USGS (FP_USGS), GCMT (FP_GCMT), SSN (FP_SSN)], Melgar et al. (2020) (FP_Melgar et al., 2020), Guo et al. (2021) (FP_Guo et al., 2021), and Wen et al. (2021) (FP_Wen et al., 2021), respectively. The magenta star denotes the epicentral location. (H) Source time functions derived from the results of (A-G).
Resolution tests can tell us how well the slip distribution can be recovered through the given observation data and constraining equations (Kim and Dreger, 2008). For a megathrust earthquake event, the shallow slip and deep slip are important to assess the tsunami generation and seismic hazard. To test the resolution of our preferred model, we use the same fault plane, datasets, Green’s functions, and constraint equations as previously to simulate synthetic data when we consider the fault plane has double, three, and six slip asperities, respectively (Figure 12). The input model of each slip patch contains 5 × 5 (25 km × 25 km) subfaults, and the subfaults have the same slip value and slip angle of 67°. The average rupture velocity is 3 km/s, and the maximum duration time of the source time function is 12 s for each subfault. Then, we add 5% Gaussian noise to these synthetic waveforms. It is noted that the residuals of static GPS and InSAR from our preferred result are added to the synthetic static GPS and InSAR data. In a synthetic inversion, we use a rupture velocity of 3.2 km/s which is slightly larger than the previous value and a maximum duration time of 20 s for each subfault, and the rake angle of the subfaults is allowed to vary between 22° and 112°. To some extent, teleseismic data can improve the deficiency of near-field data (i.e. GPS or InSAR) when these data are located on one side of the epicenter of a megathrust earthquake. We used waveform data (teleseismic P waves and high-rate GPS displacement data) and joined all data to invert the slip distribution model.
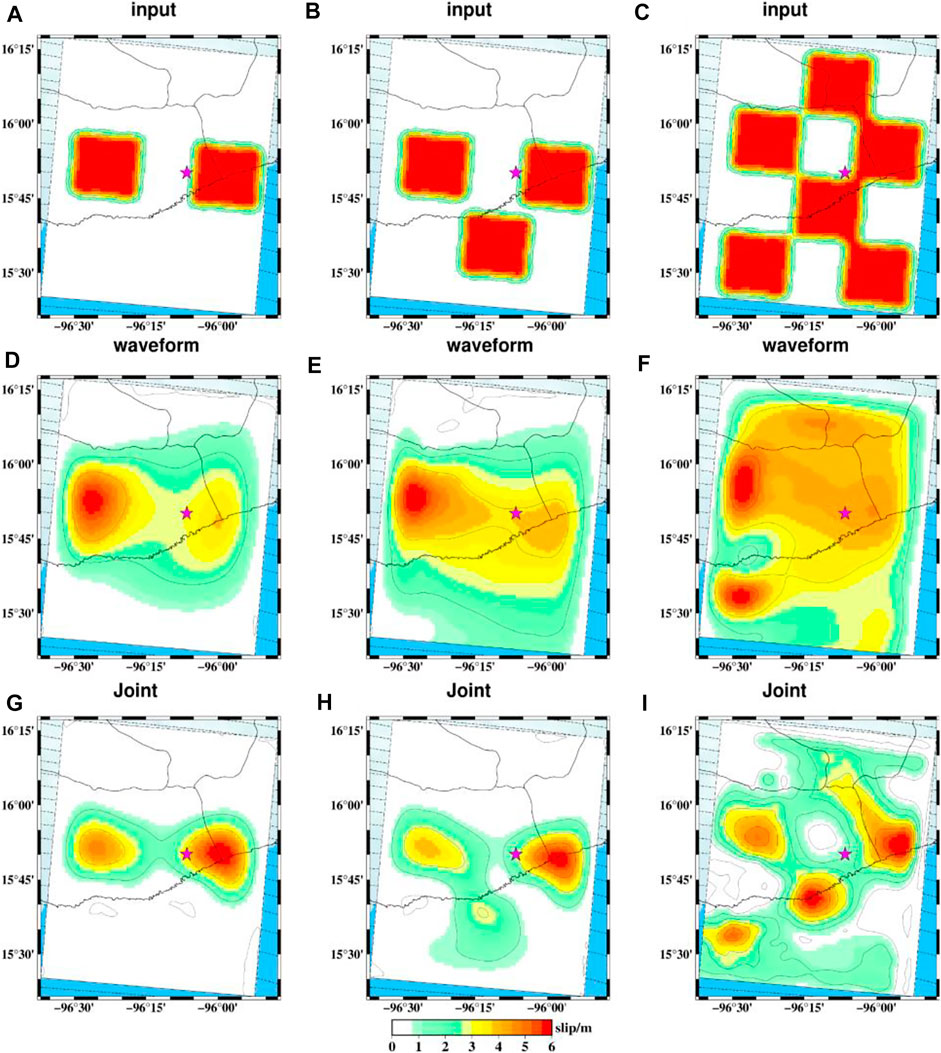
FIGURE 12. Checkboard test of the inversion resolution with different slip patches and different datasets combination. (A–C) denote the input model we simulated. (D–F) denote the inversion results used waveform data. (G–I) denote the inversion results used joint data.
The inversion results show that the joint inversion can retrieve the slip distribution well (Figures 12G–I), and the dense near-field InSAR data can improve the spatial resolution of the slip distribution. Figures 12D–F show that the inversion results have poor resolution overall except for the slip near the hypocenter since the teleseismic data have weak resolution in spatial information and the near-field high-rate GPS stations are sparse. The slip patches around the epicenter can be well retrieved because of the density of InSAR data covering the fault plane (Figures 12G–I). Figure 12I shows weak resolution of the slip distribution in deep depth, and the InSAR data have diminishing resolution with depth, consistent with the results shown by Melgar et al. (2017). The shallow slip distribution close to the trench can be retrieved and the resolution is decreased when they are far from the coast. The checkboard test shows that the joint inversion can well resolve the slip distribution and achieve an ideal resolution near the trench.
Several authors have analyzed the source characteristics of the 2020 Oaxaca earthquake using different datasets (e.g. Melgar et al., 2020; Guo et al., 2021; Wen et al., 2021; Yan et al., 2022). Usually, the results estimated from finite-fault inversion vary a lot because of the intrinsic resolution provided by each dataset and different inversion strategies. In the fault geometry, one of the factors that influences the rupture model has been tested in this study, showing slight differences and that the main characteristics are consistent. In the existing studies, seismic data, geodetic data, and tsunamis buoy data are involved in the investigation of the finite-fault model. Yan et al. (2022) summarized the rupture model from the existing studies. Melgar et al. (2020) derived a slip model constrained within 15–30 km in depth with a high energy-to-moment ratio using InSAR data, high-rate real-time Global Navigation Satellite Systems (hr-GNSS) time series, and one Deep-ocean assessment and tsunamis buoy waveform. A narrow rupture model (17–24 km) is obtained from Guo et al. (2021) using joint inversion of the teleseismic waveforms and GNSS static offsets. Wen et al. (2021) developed a slip model (20–30 km) with a higher cumulative seismic moment of 1.7 × 10²⁰ Nm using teleseismic waveforms, hr-GPS time series, static GPS offset, and InSAR data. In addition, Yan et al. (2022) obtained a rupture model (20–30 km) with a higher rupture speed and slip magnitude using teleseismic, strong-motion, hr-GPS, static GPS, and InSAR data. Our preferred model shows that the main slip is concentrated at a depth of 15–30 km and the average rupture velocity is 3 km/s. The inversion results are consistent with each other even though the fault geometry and inversion datasets are different. The main difference between our preferred model and the published models is the inversion strategy. A linear combination inversion method is used in this study, whereas the others’ is the nonlinear inversion method (Guo et al., 2021; Wen et al., 2021; Yan et al., 2022). In addition, we considered the relative weight of each dataset in linear joint inversion and obtained a well-constrained rupture model through the grid search method. The coastal uplift data which were not involved in joint inversion were used to verify the robustness of the slip model, and the VR is 89.7% between the normalized observed and synthetic data, indicating that the rupture model obtained in this study explains the observed data well.
The 2020 Oaxaca earthquake was mainly because of the interaction between the Cocos plate and the North American plate. The main slip in our inversion result is located at depths of 15–30 km, consistent with the existing studies (15–30 km (Melgar et al., 2020), 17–24 km (Guo et al., 2021), and 20–30 km (Wen et al., 2021)). A slight difference shows the non-unique inversion results with large earthquakes (Lay et al., 2010). However, the main rupture characteristics of this earthquake shows that the rupture located upon 30 km contour are consistent with each other. Deep slow slip events are observed in the Oaxaca region and represent transient behaviors where the fault releases accumulated stress (Graham et al., 2016; Almeida et al., 2018; Cruz-Atienza et al., 2021). These slow slip events may release most down-dip shear stress, limiting the rupture area and hindering the coseismic down-dip rupture within this earthquake.
The up-dip region is fully creeping (Byrne et al., 1988; Hyndman et al., 1997; Chlieh et al., 2007; Hubbard et al., 2015) and is mostly velocity strengthening with stable-sliding (Hyndman et al., 1997; Almeida et al., 2018) than the seismogenic zone. The creeping released the most stress and little stress, which would accumulate that nucleated small earthquake events in the shallowest part over the period between large earthquakes. Additionally, few slow slip events have been found on the shallow part of this fault (Cruz-Atienza et al., 2021; Plata-Martinez et al., 2021); this may be one of the reasons for the absence of the slip in the up-dip zone (Correa-Mora et al., 2009; Graham et al., 2014, 2016; Obara and Kato, 2016; Maury et al., 2018; Cruz-Atienza et al., 2021). We calculated Coulomb failure stress change (Toda et al., 2005) using our rupture model, and the friction coefficient is set to 0.6 because previous studies have shown that thrust faults have high friction coefficients of around 0.8 (Freed et al., 2007; Xiong et al., 2010; Guo et al., 2020). The result shows that the aftershocks located at 5–10 km are rare even if the coseismic Coulomb stress is propagated to a shallow depth (Figure 13). It seems that stress is released by the creeping or slow-slip events of the shallow part.
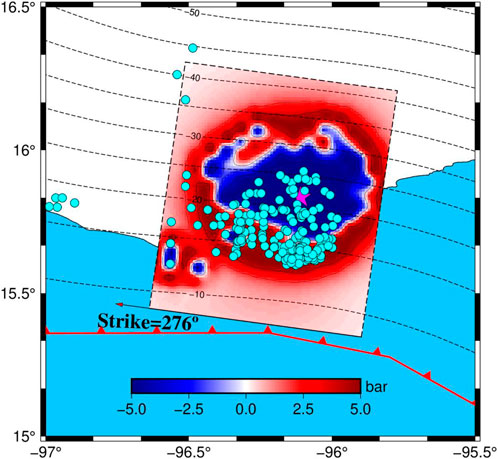
FIGURE 13. Coulomb failure stress change on the fault plane; the cyan circle denotes the aftershock distribution a month after earthquake origin time, which the depth small than 20 km. The magenta star denotes the epicenter.
In this study, we use an integrated inversion strategy to study the 2020 Oaxaca Mw 7.4 earthquake source characteristics. The centroid moment tensor inversion using teleseismic P waves was performed to determine the fault geometry and source duration time. The result shows that the 2020 Oaxaca earthquake was a thrust event in the northwest direction and with a low dip angle, corresponding to the strike angle of 276°, dip angle of 24°, and rake angle of 67°. Then we obtained finite-fault joint inversion based on the fault geometry from our moment tensor solution. The relative weight of each dataset is determined using the grid search method to obtain a rupture model that explains the observed data better. This inversion strategy shows good consistency in temporal information of the moment tensor and finite-fault inversion. A well-resolved model can be estimated through joint inversion even if the fault geometry is different from one another. The results from this integrated inversion strategy show good consistency with existing studies, and the stability of this method is discussed, indicating that this inversion strategy can be used to analyze other megathrust earthquake source characteristics. The 2020 Oaxaca earthquake in the Mexican subduction zone is mainly because of the interaction between the Cocos and the North American plate. The down-dip boundary is limited by deep slow slip events, and the up-dip is fully creeping so that most stress is released, resulting in a small aftershock in the shallow depth. Considering the plate tectonics and high coupling of the Mexican subduction zone, this area still has the potential for large earthquakes.
All data in this article are available. The teleseismic waveforms are downloaded from the Incorporated Research Institutions for Seismology (IRIS) Data Management Center (http://ds.iris.edu/wilber3/find_event). The Global Positioning System (GPS) RENIX data were downloaded from the University NAVSTAR Consortium (UNAVCO; ftp://data-out.unavco.org). The Sentinel-1 Synthetic Aperture Radar (SAR) data were downloaded from the European Space Agency (ESA) through the Sentinel-1 Scientific Data Hub (Scihub; https://vertex.daac.asf.alaska.edu). The focal mechanisms were available from the U.S. Geological Survey (USGS; https://earthquake.usgs.gov/earthquakes/eventpage/us6000ah9t), Global Centroid Moment Tensor (Global CMT; https://www.globalcmt.org), and GEOFOrschungsNetz (GEOFON; http://geofon.gfz-potsdam.de/eqinfo/event.php?id=gfz2020mhce). Aftershock hypocenters were available from the Servicio Sismológico Nacional (SSN; http://www.ssn.unam.mx). Maps for this work were made using the Generic Mapping Tools program (https://www.generic-mapping-tools.org/).
The datasets presented in this study can be found in online repositories. The names of the repository/repositories and accession number(s) can be found as follows: the teleseismic waveforms are downloaded from the Incorporated Research Institutions for Seismology (IRIS) Data Management Center (http://ds.iris.edu/wilber3/find_event). The Global Positioning System (GPS) RENIX data are downloaded from the University NAVSTAR Consortium (UNAVCO; ftp://data-out.unavco.org). The Sentinel-1 Synthetic Aperture Radar (SAR) data were downloaded from the European Space Agency (ESA) through the Sentinel-1 Scientific Data Hub (Scihub; https://vertex.daac.asf.alaska.edu).
GW and XL proposed the idea of this manuscript, designed and performed the experiments, and wrote the paper. Data analysis was conducted by GW, YZ, and GX. CX, YZ, and GX reviewed the manuscript and provided suggestions for improvements. All authors reviewed the final submitted version of the manuscript.
This study is financially supported by the National Natural Science Foundation of China (Grant Nos. 41974027 and 42104008), the National Key R&D Program of China (Grant No. 2021YFC3000504), the Hubei Province Natural Science Foundation (Grant No. 2020CFA002), and the Sino-German mobility program (Grant No. M-0054).
The authors declare that the research was conducted in the absence of any commercial or financial relationships that could be construed as a potential conflict of interest.
All claims expressed in this article are solely those of the authors and do not necessarily represent those of their affiliated organizations, or those of the publisher, the editors, and the reviewers. Any product that may be evaluated in this article, or claim that may be made by its manufacturer, is not guaranteed or endorsed by the publisher.
The Supplementary Material for this article can be found online at: https://www.frontiersin.org/articles/10.3389/feart.2022.951033/full#supplementary-material
Almeida, R., Lindsey, E. O., Bradley, K., Hubbard, J., Mallick, R., and Hill, E. M. (2018). Can the Updip Limit of Frictional Locking on Megathrusts Be Detected Geodetically? Quantifying the Effect of Stress Shadows on Near-Trench Coupling. Geophys. Res. Lett. 45 (10), 4754–4763. doi:10.1029/2018GL077785
Bock, Y., Melgar, D., and Crowell, B. W. (2011). Real-time Strong-Motion Broadband Displacements from Collocated GPS and Accelerometers. Bull. Seismol. Soc. Am. 101 (6), 2904–2925. doi:10.1785/0120110007
Byrne, D. E., Davis, D. M., and Sykes, L. R. (1988). Loci and Maximum Size of Thrust Earthquakes and the Mechanics of the Shallow Region of Subduction Zones. Tectonics 7 (4), 833–857. doi:10.1029/TC007i004p00833
Chen, C. W., and Zebker, H. A. (2000). Network Approaches to Two-Dimensional Phase Unwrapping: Intractability and Two New Algorithms. J. Opt. Soc. Am. A 17 (3), 401–414. doi:10.1364/josaa.17.000401
Chlieh, M., Avouac, J.-P., Hjorleifsdottir, V., Song, T.-R. A., Ji, C., Sieh, K., et al. (2007). Coseismic Slip and Afterslip of the Great Mw 9.15 Sumatra-Andaman Earthquake of 2004. Bull. Seismol. Soc. Am. 97 (1A), S152–S173. doi:10.1785/0120050631
Chu, R., Wei, S., Helmberger, D. V., Zhan, Z., Zhu, L., and Kanamori, H. (2011). Initiation of the Great Mw 9.0 Tohoku-Oki Earthquake. Earth Planet. Sci. Lett. 308 (3), 277–283. doi:10.1016/j.epsl.2011.06.031
Correa-Mora, F., DeMets, C., Cabral-Cano, E., Diaz-Molina, O., and Marquez-Azua, B. (2009). Transient Deformation in Southern Mexico in 2006 and 2007: Evidence for Distinct Deep-Slip Patches beneath Guerrero and Oaxaca. Geochem. Geophys. Geosyst. 10, a–n. doi:10.1029/2008GC002211
Cruz-Atienza, V. M., Tago, J., Villafuerte, C., Wei, M., Garza-Girón, R., Dominguez, L. A., et al. (20212021). Short-term Interaction between Silent and Devastating Earthquakes in Mexico. Nat. Commun. 12 (1), 1–14. doi:10.1038/s41467-021-22326-6
DeMets, C., Gordon, R. G., and Argus, D. F. (2010). Geologically Current Plate Motions. Geophys. J. Int. 181 (1), 1–80. doi:10.1111/j.1365-246X.2009.04491.x
Duputel, Z., Rivera, L., Kanamori, H., and Hayes, G. (2012). W Phase Source Inversion for Moderate to Large Earthquakes (1990-2010). Geophys. J. Int. 189 (2), 1125–1147. doi:10.1111/j.1365-246x.2012.05419.x
Farr, T. G., Rosen, P. A., Caro, E., Crippen, R., Duren, R., Hensley, S., et al. (2007). The Shuttle Radar Topography Mission. Rev. Geophys. 45 (2). doi:10.1029/2005rg000183
Freed, A. M., Ali, S. T., and Bürgmann, R. (2007). Evolution of Stress in Southern California for the Past 200 Years from Coseismic, Postseismic and Interseismic Stress Changes. Geophys. J. Int. 169, 1164–1179. doi:10.1111/j.1365-246X.2007.03391.x
Goldstein, R. M., and Werner, C. L. (1998). Radar Interferogram Filtering for Geophysical Applications. Geophys. Res. Lett. 25, 4035–4038. doi:10.1029/1998gl900033
Graham, S., DeMets, C., Cabral-Cano, E., Kostoglodov, V., Rousset, B., Walpersdorf, A., et al. (2016). Slow Slip History for the MEXICO Subduction Zone: 2005 through 2011. Pure Appl. Geophys. 173 (10), 3445–3465. doi:10.1007/s00024-015-1211-x
Graham, S. E., DeMets, C., Cabral-Cano, E., Kostoglodov, V., Walpersdorf, A., Cotte, N., et al. (2014). GPS Constraints on the 2011-2012 Oaxaca Slow Slip Event that Preceded the 2012 March 20 Ometepec Earthquake, Southern Mexico. Geophys. J. Int. 197 (3), 1593–1607. doi:10.1093/gji/ggu019
Guo, R., Yang, H., Zhu, Y., Zheng, Y., Xu, J., Zhang, L., et al. (2021). Narrow Rupture of the 2020 Mw 7.4 La Crucecita, Mexico, Earthquake. Seismol. Res. Lett. 92 (3), 1891–1899. doi:10.1785/0220200328
Guo, R., Zheng, Y., and Xu, J. (2020). Stress Modulation of the Seismic Gap between the 2008 Ms 8.0 Wenchuan Earthquake and the 2013 Ms 7.0 Lushan Earthquake and Implications for Seismic Hazard. Geophys. J. Int. 221 (3), 2113–2125. doi:10.1093/gji/ggaa143
Hartzell, S. H., and Heaton, T. H. (1983). Inversion of Strong Ground Motion and Teleseismic Waveform Data for the Fault Rupture History of the 1979 Imperial Valley, California, Earthquake. Bull. Seismol. Soc. Am. 73 (6A), 1553–1583. doi:10.1785/BSSA07306A1553
Hartzell, S., and Iida, M. (1990). Source complexity of the 1987 Whittier Narrows, California, earthquake from the inversion of strong motion records. Journal of Geophysical Research: Solid Earth 95 (B8), 12475–12485. doi:10.1029/jb095ib08p12475
Hayes, G. P., Moore, G. L., Portner, D. E., Hearne, M., Flamme, H., Furtney, M., et al. (2018). Slab2, a Comprehensive Subduction Zone Geometry Model. Science 362 (6410), 58–61. doi:10.1126/science.aat4723
Horikawa, H. (2001). Earthquake Doublet in Kagoshima, Japan: Rupture of Asperities in a Stress Shadow. Bull. Seismol. Soc. Am. 91, 112–127. doi:10.1785/0119990131
Hubbard, J., Barbot, S., Hill, E. M., and Tapponnier, P. (2015). Coseismic Slip on Shallow Décollement Megathrusts: Implications for Seismic and Tsunami Hazard. Earth-Science Rev. 141, 45–55. doi:10.1016/j.earscirev.2014.11.003
Hyndman, R. D., Yamano, M., and Oleskevich, D. A. (19971997). The Seismogenic Zone of Subduction Thrust Faults. Isl. Arc 6 (3), 244–260. doi:10.1111/j.1440-1738.1997.tb00175.x
Jónsson, S., Zebker, H., Segall, P., and Amelung, F. (2002). Fault Slip Distribution of the 1999 M W 7.1 Hector Mine, California, Earthquake, Estimated from Satellite Radar and GPS Measurements. Bull. Seismol. Soc. Am. 92 (4), 1377–1389.
Ji, C., Wald, D. J., and Helmberger, D. V. (2002). Source Description of the 1999 Hector Mine, California, Earthquake, Part I: Wavelet Domain Inversion Theory and Resolution Analysis. Bull. Seismol. Soc. Am. 92 (4), 1192–1207. doi:10.1785/0120000916
Kim, A., and Dreger, D. S. (2008). Rupture Process of the 2004 Parkfield Earthquake from Near‐fault Seismic Waveform and Geodetic Records. J. Geophys. Res. Solid Earth 113 (B7). doi:10.1029/2007jb005115
Laske, G., Masters, G., Ma, Z., and Pasyanos, M. (2013). Update on CRUST1.0—A 1‐degree Global Model of Earth's Crust. Geophys. Res. Abstr. 15, 2658.
Lay, T., Ammon, C. J., Hutko, A. R., and Kanamori, H. (2010). Effects of Kinematic Constraints on Teleseismic Finite-Source Rupture Inversions: Great Peruvian Earthquakes of 23 June 2001 and 15 August 2007. Bull. Seismol. Soc. Am. 100 (3), 969–994. doi:10.1785/0120090274
Li, X., Ge, M., Zhang, X., Zhang, Y., Guo, B., Wang, R., et al. (2013). Real-time High-Rate Co-seismic Displacement from Ambiguity-Fixed Precise Point Positioning: Application to Earthquake Early Warning. Geophys. Res. Lett. 40 (2), 295–300. doi:10.1002/grl.50138
Li, X., Guo, B., Lu, C., Ge, M., Wickert, J., and Schuh, H. (2014). Real-time GNSS Seismology Using a Single Receiver. Geophys. J. Int. 198 (1), 72–89. doi:10.1093/gji/ggu113
Li, X., Han, X., Li, X., Liu, G., Feng, G., Wang, B., et al. (2021). GREAT-UPD: An Open-Source Software for Uncalibrated Phase Delay Estimation Based on Multi-GNSS and Multi-Frequency Observations. GPS Solut. 25 (2). doi:10.1007/s10291-020-01070-2
Maury, J., Ide, S., Cruz-Atienza, V. M., and Kostoglodov, V. (2018). Spatiotemporal Variations in Slow Earthquakes along the Mexican Subduction Zone. J. Geophys. Res. Solid Earth 123 (2), 1559–1575. doi:10.1002/2017JB014690
Melgar, D., Ruiz-Angulo, A., Pérez-Campos, X., Crowell, B. W., Xu, X., Cabral-Cano, E., et al. (2020). Energetic Rupture and Tsunamigenesis during the 2020 Mw 7.4 La Crucecita, Mexico Earthquake. Seismol. Res. Lett. 92, 140–150. doi:10.1785/0220200272
Melgar, D., Bock, Y., and Crowell, B. W. (2012). Real-time Centroid Moment Tensor Determination for Large Earthquakes from Local and Regional Displacement Records. Geophys J. Int. 188 (2), 703–718. doi:10.1111/j.1365-246x.2011.05297.x
Melgar, D., Ganas, A., Geng, J., Liang, C., Fielding, E. J., and Kassaras, I. (2017). Source Characteristics of the 2015 Mw6. 5 Lefkada, Greece, Strike‐slip Earthquake. J. Geophys. Res. Solid Earth 122 (3), 2260–2273.
Obara, K., and Kato, A. (2016). Connecting Slow Earthquakes to Huge Earthquakes. Science 353 (6296), 253–257. doi:10.1126/science.aaf1512
Okada, Y. (1985). Surface Deformation Due to Shear and Tensile Faults in a Half-Space. Bull. Seismol. Soc. Am. 75 (4), 1135–1154. doi:10.1785/BSSA0750041135
Olson, A. H., and Apsel, R. J. (1982). Finite Faults and Inverse Theory with Applications to the 1979 Imperial Valley Earthquake. Bull. Seismol. Soc. Am. 72 (6A), 1969–2001. doi:10.1785/BSSA07206A1969
Plata-Martinez, R., Ide, S., Shinohara, M., Garcia, E. S., Mizuno, N., Dominguez, L. A., ., , Taira, T., Yamashita, Y., Toh, A., Yamada, T., Real, J., Husker, A., Cruz-Atienza, V. M., and Ito, Y. (2021). Shallow Slow Earthquakes to Decipher Future Catastrophic Earthquakes in the Guerrero Seismic Gap. Nat. Commun. 12 (1), 3976–3978. doi:10.1038/s41467-021-24210-9
Ramírez-Herrera, M.-T., Corona, N., Cerny, J., Castillo-Aja, R., Melgar, D., Lagos, M., et al. (2020). Sand Deposits Reveal Great Earthquakes and Tsunamis at Mexican Pacific Coast. Sci. Rep. 10 (1), 1–10. doi:10.1038/s41598-020-68237-2
Rosen, P. A., Gurrola, E., Sacco, G. F., and Zebker, H. (2012). The InSAR scientific computing environmentEUSAR 2012; 9th European con. ference synthetic aperture radar, VDE, 730-733.
Rousset, B., Campillo, M., Lasserre, C., Frank, W. B., Cotte, N., Walpersdorf, A., et al. (2017). A Geodetic Matched Filter Search for Slow Slip with Application to the Mexico Subduction Zone. J. Geophys. Res. Solid Earth 122 (12), 498–510. doi:10.1002/2017JB014448
Ruff, L. J. (1996). Large earthquakes in subduction zones: Segment interaction and recurrence times. Subduction: Top to bottom 96, 91–104. doi:10.1029/GM096p0091
Singh, S. K., Astiz, L., and Havskov, J. (19811981). Seismic Gaps and Recurrence Periods of Large Earthquakes along the Mexican Subduction Zone: A Reexamination. Bull. Seismol. Soc. Am. 71, 827–843. doi:10.1785/bssa0710030827
Singh, S. K., Rodríguez, M., and Esteva, L. (1983). Statistics of Small Earthquakes and Frequency of Occurrence of Large Earthquakes along the Mexican Subduction Zone. Bull. Seismol. Soc. Am. 73, 1779–1796.
Toda, S., Stein, R. S., Richards-Dinger, K., and Bozkurt, S. (2005). Forecasting the Evolution of Seismicity in Southern California: Animations Built on Earthquake Stress Transfer. J. Geophys. Res. 110, B05S16. doi:10.1029/2004JB003415
Tracy, K.-C., Ian, R., David, R., Khalid, M., David, P., Wael, H., et al. (2020). StEER—Crucecitas, Mexico Mw 7.4 Earthquake. DesignSafe-CI: Preliminary virtual Reconnaissance Report. doi:10.17603/ds2-k2bp-t724
Wang, R., Heimann, S., Zhang, Y., Wang, H., and Dahm, T. (2017). Complete Synthetic Seismograms Based on a Spherical Self-Gravitating Earth Model with an Atmosphere-Ocean-Mantle-Core Structure. Geophys. J. Int. 210 (3), 1739–1764. doi:10.1093/gji/ggx259
Wei, S., Helmberger, D., and Avouac, J.-P. (2013). Modeling the 2012 Wharton Basin Earthquakes Off-Sumatra: Complete Lithospheric Failure. J. Geophys. Res. Solid Earth 118 (7), 3592–3609. doi:10.1002/jgrb.50267
Wen, Y., Xiao, Z., He, P., Zang, J., Liu, Y., and Xu, C. (2021). Source Characteristics of the 2020 Mw 7.4 Oaxaca, Mexico, Earthquake Estimated from GPS, InSAR, and Teleseismic Waveforms. Seismol. Res. Lett. 92 (3), 1900–1912. doi:10.1785/0220200313
Xiong, X., Shan, B., Zheng, Y., and Wang, R. (2010). Stress Transfer and its Implication for Earthquake Hazard on the Kunlun Fault, Tibet. Tectonophysics 482, 216–225. doi:10.1016/j.tecto.2009.07.020
Xu, Y., Zhang, Y., and Xu, L. (2022). Geometry-dependent Rupture Process of the 2015 Gorkha, Nepal, Earthquake Determined Using a Dip-Varying Inversion Approach with Teleseismic, High-Rate GPS, Static GPS and InSAR Data. Geophys. J. Int. 229 (2), 1408–1421. doi:10.1093/gji/ggab519
Yagi, Y., Mikumo, T., Pacheco, J., and Reyes, G. (2004). Source Rupture Process of the Tecoman, Colima, Mexico Earthquake of 22 January 2003, Determined by Joint Inversion of Teleseismic Body-Wave and Near-Source Data. Bull. Seismol. Soc. Am. 94, 1795–1807. doi:10.1785/012003095
Yan, Z., Xiong, X., Liu, C., and Xu, J. (2022). Integrated Analysis of the 2020 Mw 7.4 La Crucecita, Oaxaca, Mexico, Earthquake from Joint Inversion of Geodetic and Seismic Observations. Bull. Seismol. Soc. Am. 112 (3), 1271–1283. doi:10.1785/0120210276
Yang, H., Yao, S., He, B., and Newman, A. V. (2019). Earthquake Rupture Dependence on Hypocentral Location along the Nicoya Peninsula Subduction Megathrust. Earth Planet. Sci. Lett. 520, 10–17. doi:10.1016/j.epsl.2019.05.030
Yi, L., Xu, C., Zhang, X., Wen, Y., Jiang, G., Li, M., et al. (2017). Joint Inversion of GPS, InSAR and Teleseismic Data Sets for the Rupture Process of the 2015 Gorkha, Nepal, Earthquake Using a Generalized ABIC Method. J. Asian Earth Sci. 148, 121–130. doi:10.1016/j.jseaes.2017.08.029
Yue, H., and Lay, T. (2013). Source Rupture Models for the Mw 9.0 2011 Tohoku Earthquake from Joint Inversions of High-Rate Geodetic and Seismic Data. Bull. Seismol. Soc. Am. 103, 1242–1255. doi:10.1785/0120120119
Keywords: moment tensor, finite-fault model, joint inversion, prior information, integrated inversion strategy
Citation: Wen G, Li X, Zhao Y, Xu C and Xu G (2022) Rupture Characteristics Analysis of the 2020 Mw 7.4 Oaxaca, Mexico Earthquake Using Teleseismic, High-Rate GPS, and InSAR Data. Front. Earth Sci. 10:951033. doi: 10.3389/feart.2022.951033
Received: 23 May 2022; Accepted: 23 June 2022;
Published: 25 July 2022.
Edited by:
Jian Sun, Ocean University of China, ChinaReviewed by:
Yanchuan Li, China Earthquake Administration, ChinaCopyright © 2022 Wen, Li, Zhao, Xu and Xu. This is an open-access article distributed under the terms of the Creative Commons Attribution License (CC BY). The use, distribution or reproduction in other forums is permitted, provided the original author(s) and the copyright owner(s) are credited and that the original publication in this journal is cited, in accordance with accepted academic practice. No use, distribution or reproduction is permitted which does not comply with these terms.
*Correspondence: Xingxing Li, eHhsaUBzZ2cud2h1LmVkdS5jbg==
Disclaimer: All claims expressed in this article are solely those of the authors and do not necessarily represent those of their affiliated organizations, or those of the publisher, the editors and the reviewers. Any product that may be evaluated in this article or claim that may be made by its manufacturer is not guaranteed or endorsed by the publisher.
Research integrity at Frontiers

Learn more about the work of our research integrity team to safeguard the quality of each article we publish.